Article

Holistic System Modelling and Analysis for Energy-Aware Production: An Integrated Framework

1
“Smart Mechatronics Engineering” Research Group, University of Applied Sciences Upper Austria, 4600 Wels, Austria
2
Quartz Laboratory (EA7393), ISAE-Supméca, 93400 Saint-Ouen-sur-Seine, France
3
Fraunhofer J-Lab IDEAS, Department of Industrial Engineering, University of Naples Federico II, P.le V. Tecchio 80, 80125 Naples, Italy
4
Electrical and Computer Engineering Department, University of Peloponnese, 26335 Patras, Greece
5
Electrical and Computer Engineering Department, University of Patras, 26500 Patras, Greece
6
Maggioli S.p.A. Greek Branch, 15124 Athens, Greece
*
Author to whom correspondence should be addressed.
Systems 2023, 11(2), 100; https://doi.org/10.3390/systems11020100
Submission received: 22 November 2022 / Revised: 2 February 2023 / Accepted: 6 February 2023 / Published: 11 February 2023

Abstract

:
Optimizing and predicting the energy consumption of industrial manufacturing can increase its cost efficiency. The interaction of different aspects and components is necessary. An overarching framework is currently still missing, and establishing such is the central research approach in this paper. This paper provides an overview of the current demands on the manufacturing industry from the perspective of digitalization and sustainability. On the basis of the developed fundamentals and parameters, a superordinate framework is proposed that allows the modelling and simulation of energy-specific properties on several product and process levels. A detailed description of the individual methods concludes this work and demonstrates their application potential in an industrial context. As a result, this integrated conceptual framework offers the possibility of optimizing the production system, in relation to different energy flexibility criteria.

1. Introduction

1.1. Motivation and Setting the Scence

Digitalization is progressing in many areas, thus taking form in most companies via additional work tasks [1]. These are usually triggered by new requirements from customers and suppliers who not only want to purchase or sell the product, but who also require additional “digital services”, such as virtual models for the usage phase. There are different viewpoints on digitalization, a process that often results in smart products [2,3]. Therefore, it is necessary to transform the processes, methods and tools of digitalization within a company. It can be pointed out that, in companies, digitization requires a certain level of digital maturity in order to effectively employ digital technologies.
This is requested in order to be able to provide information about the overall energy performance of either the whole production system or additional—virtual or not—aids for controlling maintenance activities, such as reliable statements about the remaining service life. All these aspects can be summarized under the umbrella term “digital twin”, which now poses additional challenges, especially for the producers of mechatronic systems in energy efficient production systems.
Optimizing and predicting the energy consumption of industrial manufacturing can increase the affiliated cost efficiency. However, the analysis of energy consumption in industrial manufacturing is a complex issue that is not only directly related to the production value chain (the life cycle cost of production), but that also has an impact on the environment. Most importantly, and beyond the issue of costs, it has various indirect impacts on society (environmental, political and societal impacts). Therefore, Factories of the Future (FoF) need to rethink their approach towards energy use and move from a pure energy optimization model to an energy sustainability model that takes a holistic and inter-/intra-systemic view of energy consumption [4].
Especially in Europe, industrial production consumes large amounts of energy and, therefore, represents an important target for energy sustainability. However, current approaches to optimizing production through closed-loop automation technology focuses primarily on reliability, production efficiency (e.g., time to market) and product quality, rather than on optimizing energy consumption as part of a holistic approach to energy sustainability. Therefore, an integration of energy sustainability and the related energy consumption factors is required; these are the key indicators in the production management cycle within a factory, alongside the traditional time-, cost- and quality-oriented indicators. The current typical industrial manufacturing management approach to measuring and accessing energy consumption is mostly static and relies on measuring values at a few points in the production line, instead of managing energy consumption holistically. This static approach prevents accurate metrics for and insights into energy consumption, and gives a false “picture” or timestamp of the factory’s energy consumption and its associated energy costs. The more complex the manufacturing process is, the more serious this problem becomes.
All these aspects result in the goals of the EU-funded project EnerMan, ENERgy-efficient manufacturing system MANagement (https://enerman-h2020.eu/, accessed on 1 September 2022) (GA no. 958478). Within this project, three main aspects of energy sustainability are considered:
  • Energy consumption: related to the energy efficiency of the production system and all involved machines and components (e.g., drives);
  • Energy cost: due to the actual power grid electricity price and the volatility in the market;
  • Environmental impact: presented by the carbon footprint due to the different kinds of energy sources (e.g., renewable energy ones).
By introducing a digital solution for energy sustainability management (focusing on modelling and analysis via a “digital twin”), the project aims to achieve an intelligent, autonomous, flexible and reconfigurable factory. The evaluation and demonstration of the EnerMan solution will take place across Europe in several industrial manufacturing use cases related to three domains (namely the food, metal processing and automotive manufacturing domain). As a first step, the actual state of energy use in the involved companies was surveyed by means of questionnaires and data analysis (see [5]). In this process, the three-expectation level Resource Management, Process Optimization and Data Management were identified.

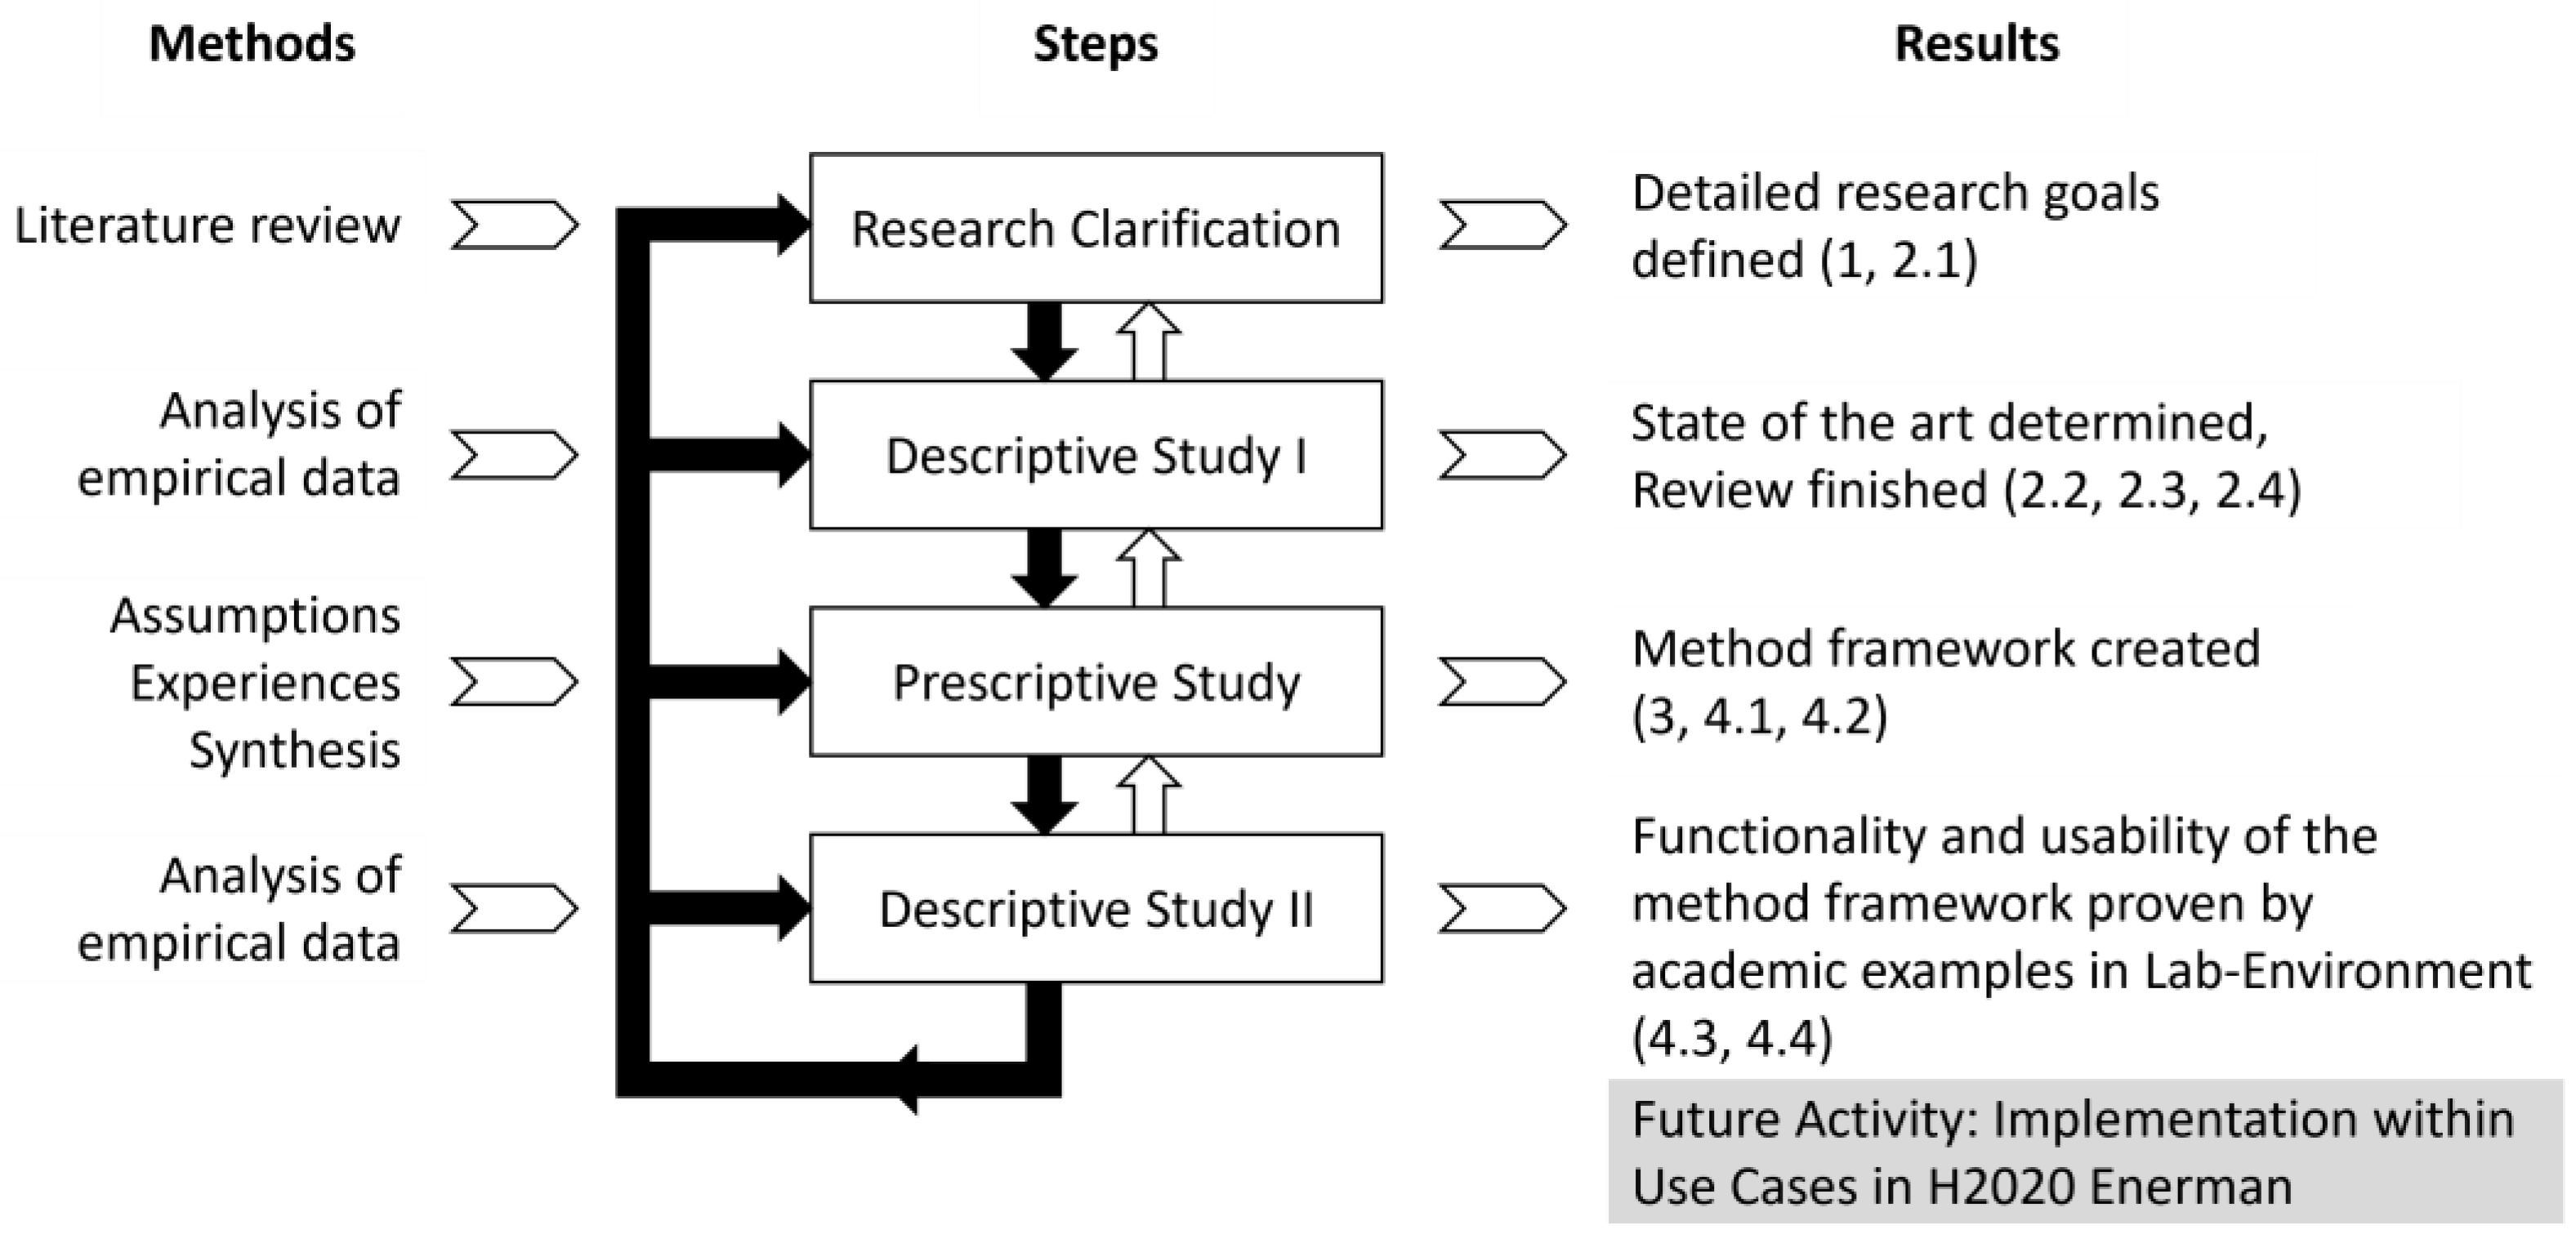
1.2. Research Methodology

Based on the aforementioned relevant work, discussion and questionnaire results, the research gap is identified; indeed, there is a lack of a holistic view on energy flexibility and the related supporting tools and methods.
The aim of the current paper is to formulate a conceptual framework, to build on the previous results, and to help towards achieving the defined goals; this framework utilizes an integration of methods and tools for the different layers of production systems and the related attributes and properties.
The scientific structure of this paper is based on the Design Research Methodology (DRM), which is shown in Figure 1. The concept of DRM is to view research as a process at different levels of research with different objectives. The DRM includes four stages: Research Clarification, Descriptive Study I, Prescriptive Study, and Descriptive Study II.
Figure 1 shows the links between the stages, the methods used in each stage, and the main results. The filled black arrows between each stage describe the main process flow, and the unfilled arrows represent the many iterations in the development of a design process. In the context of this paper, each DRM stage is represented by the activities in each section.
A central element in step 2 is the analysis of diverse energy management systems in the related fields and an indication of the relevant technological drivers. The first activity used to verify the functionality of the framework’s elements is shown in Descriptive Study II on the basis of academic use cases. A further implementation study is currently being carried out on industrial applications with the project partners of the H2020-project EnerMan.
In detail, this paper is structured as follows: in Chapter 2, the relative sustainability concepts are explained and their measurability (in the form of KPIs) is shown. Furthermore, the aspects of a digital and sustainable transformation process are presented. Chapter 3 provides the framework for integrating the various modelling and simulation aspects to be considered, the methodological elements of which are explained in detail in Chapter 4. The conclusion summarizes the results and gives an outlook on the future implementation of the framework in an industrial context.

2. Background

2.1. Sustainability and Key Performance Indicators

2.1.1. Definitions

Sustainability was defined in the 1987 Brundtland Report of the World Commission on Environment and Development, referring to sustainable development as “development that meets the needs of the present without compromising the ability of future generations to meet their own needs” [7].
Sustainability focuses on the environmental, economic and social impacts [8], and the current challenge aims to achieve these three types of sustainability [9]. Energy sustainability refers to the provision and use of energy services in a sustainable manner regarding their environmental, economic, and social impacts, all along the related lifecycle. It includes the harvesting of energy sources, their conversion to useful energy forms, energy transport and storage, its use and recycling. These different aspects can be synthesized, as is shown in Figure 2.
Energy sustainability has to be tackled from these various points of view: sustainable energy supply (energy sources and carriers, including their transport and storage), sustainable energy consumption and, finally, sustainable waste disposal. Sustainable energy consumption both involves energy efficiency (related to the amount of resources required to produce a given level of output) and energy effectiveness (related to the choice of the most appropriate energetic process for a given system) [10]. Finally, another long-term solution consists of reducing the demand for energy services (related to the economic growth) [11].
Sustainable energy [12] is similar to the concepts of green energy and clean energy in its consideration of environmental impacts; however, formal definitions of sustainable energy also include economic and social impacts. Sustainable energy is based on renewable energy, i.e., energy sources that are available in unlimited quantities. Renewable energy sources include solar and wind, natural forces (gravitation, earth rotation), hydraulic energy, ocean thermal energy, geothermal energy, tidal energy, wave energy, biomass energy and waste-to-energy incineration. Radiative cooling is another technique, which leads to a decrease in the temperature of the system (object, building, water, etc.) by dissipating its heat as thermal infrared radiation into the cold universe [13,14]. Smart grids and intelligent energy systems, including storage, can also help to match supply and demand. In parallel, some non-fossil fuel energy options reduce or eliminate greenhouse gas (GHG) emissions, as the main GHG source is carbon dioxide, resulting from the combustion of fossil fuels; these options can also support sustainable energy solutions. However, non-renewable, nuclear energy avoids GHG emissions [7].
Sustainable energy can also be provided by reusing, recovering, or recycling energy, or by any process of utilizing energy that would normally be wasted, e.g., by means of multi-energy generation systems. This is usually performed by capturing and converting this energy into electricity or thermal energy [15], while reducing energy costs and greenhouse gas pollution simultaneously.
In relation to the EnerMan project, we will focus on the economic and environmental impacts of energy sustainability. Focusing on industrial activities, they represent 51% of the global energy consumption; in particular, the manufacturing sector accounts for 84% of energy-related CO2 emissions and 90% in terms of energy consumption [10]. Thus, it is critical to study energy sustainability within the production and manufacturing context, regarding the different scales (unit process, multi-machine, factory, multi-facility, and supply chain). This is especially the case since, even though some environment-oriented software tools have been developed (e.g., Life Cycle Assessment LCA approach), manufacturing data are, unfortunately, often either not available, not representative of the situations faced by the manufacturers, or based on unrealistic assumptions [10].

2.1.2. Key Performance Indicators (KPIs)

In this context, in order to assess and optimize energy sustainability, a large number of parameters (influent factors used as inputs) and metrics (quantified outputs impacting energy sustainability) have been defined in the literature [16,17,18]. While excluding the social ones, which are out of the scope of this study, we have classified them in Table 1 according to the level of the system concerned, and according to their nature: technical/energy performance, economic, and environmental.
These parameters allow the previous facets to be characterized by quantitative criteria, based on measurable, calculated, and estimated reliable data, notably including environmental and economic impacts. Energy-related environmental impacts should be evaluated throughout a process or product’s life cycle. Such an approach is referred to as a life cycle assessment (LCA). This allows for a quantified assessment of environmental issues, from acquisition (energy and material resources) to utilization and end of life (ultimate disposal). These issues can thus be associated with the parts of the life cycle responsible for them.
In addition to the information contained in Table 1, regarding technical parameters, Boyd et al. evaluate manufacturing Energy Performance Indicators (EnPI) at the ‘plant level’ [19]. Ref. [10] identify five different levels to analyze energy efficiency: device/process level, line/cell/multi-machine system, facility, multi-factory system and enterprise/global supply chain. An overview of energy efficiency approaches, focusing on both production and machine tool levels, is also proposed by Salonitis and Ball [20]. Many indicators that characterize energy consumption and energy efficiency have been defined in the literature [21]; in addition, standards have been developed, such as the ISO 14955 series [22] and ISO 50006:2014 [23], proposed by the International Organization for Standardization. As pointed out by Suganthi, the huge number of indicators makes it difficult to grasp the overall problem for policy and decision makers. Therefore, composite indicators should be preferred [24].
Regarding the environmental and economic parameters/metrics of the LCA, Iacovidou et al. define global warming potential (GWP), ozone depletion, photochemical oxidation, acidification, eutrophication, human toxicity, aquatic ecotoxicity, terrestrial ecotoxicity, abiotic resource depletion and energy depletion [25]. Concerning Life Cycle Costing (LCC), they claim that LCC is mainly based on 5 parameters that correspond to the acquisition costs, operational costs, maintenance costs, end-of-life disposal costs and external environmental costs. By adding social aspects, they integrate a PESTEL (Political, Economic, Social, Technological, Environmental and Legal) analysis, in order to address the need for identifying the most significant parameters and rank their respective uncertainties that drive or inhibit change. Additionally, multiple sustainability metrics are discussed in [26].
Finally, the dependencies between the previous relevant parameters must be analyzed in order to serve as a modelling basis. By inspecting the interconnections with a correlation matrix, a pair-wise comparison of individual parameters and abstracted groups can be defined. An increased understanding of the cause–effect relationship can thus be established [27]. In particular, in order to comply with the defined term of sustainability, the identified groups can also be clustered into environmental topics, as mentioned in [28].

2.1.3. Cumulative Energy Demand (CED) and Life Cycle Assessment

The quantification of sustainability can be carried out by using several methods and approaches, which distinguish between the considered system boundaries and the temporal aspects. The background of assessment and resource consumption accounting methods originate from an economic input–output analysis and a process-based cumulative energy demand analysis. In 1978, Bullard et al. [29] introduced the idea of hybrid models, combining process models and input–output analysis. By the further developments of the process-based analysis, the Life Cycle Assessment (LCA) emerged. Thus, the relevant methods and approaches include the process-based analysis, the input–output analysis and the hybrid analysis [30].
The standardization actions of the methodologies include LCA with the ISO14040 and ISO 14044, as well as Cumulative Energy Demand (CED) methods in VDI 4600. ISO14044:2006 defines LCA as the compilation and evaluation of a product systems’ inputs and outputs. A LCA consists of the following phases: (i) the definition of the goal and scope, (ii) compiling the life cycle inventory, (iii) the creation of the impact assessment (iv) and finally the interpretation. The LCA itself is a holistic method that takes a multitude of effects into account.
A simplification of the traditional LCA neglects the temporal aspects. Considering the variations in the resources and the scoped systems, an alternative approach is a dynamic LCA, based on [31].
Frischknecht et al. concluded that CED shall be seen as an impact category of LCA, rather than as an indicator that represents the results; they argue that the primary energy resources should be taken into account [32]. Taking the primary energy resources into account results in a comparable paradigm to the DLCA. CED is also known as primary energy consumption.

2.2. Energy Management in Related Fields

Energy management systems (EnMSs), as defined in ISO 50001:2018, are applicable in organizations, independent of their size and domains. The purpose of EnMSs is to reach the defined energy goals for the scoped processes. Thus, energy management can be applied in a variety of domains, where residential and industrial contexts comprise a major share. Additionally, recent ICT developments, e.g., artificial intelligence (AI) and the Internet-of-Things (IoT), have been major drivers in transforming data availability and informed decision making.
Recent developments in the residential sector concerning energy management are mostly concerned with energy scheduling and are generally summarized as home energy management systems (HEMSs) [33,34]. The industrial sector differs from the residential sector mainly in terms of the involved actors. In the residential sector, a variety of heterogenous actors are responsible for a small share of the overall energy consumption, while the industrial sector features individual entities that are responsible for a significant share, embedded in complex process chains [35] Furthermore, the residential sector addresses well-being as an objective. A survey of the literature, conducted by Beaudin and Zareipur, estimated that using an HEMS created a potential saving of 23.1% in the operational electricity cost and a reduction in the peak demand of 29.6% [34]. Roe et al. estimated that the payback period of an HEMS without a battery is in the order of one year [36]. Infield et al. [37] estimated the potential of dynamic demand control in the residential sector by the inclusion of grid frequency and the prioritization of appliances. Erol-Kantarci and Mouftah provided and optimization approach for residential energy management, which included energy generation capability, real-time pricing and prioritized appliances [38]. Tomazzoli et al. applied the IoT and machine learning for several appliances, and validated the consumption data on the experimental data [39].
As highlighted by [35,40], the level of detail in models is an important characteristic, so as to not compromise on the meaningfulness of results and predictions. Although the underlying modelling approaches are related for industrial applications, recent initiatives aim to transform industrial applications towards changeability. Thus, a difference between industrial and residential applications is the predictability of processes. Residential devices are estimated to feature simple load curves, while discrete manufacturing applications feature job or process-dependent load curves. ICT advances can be incorporated by leveraging digital twins, the potentials of which will be addressed in Section 2.3 and Section 2.4. The following Table 2 summarizes the key differences between the residential and industrial sector. However, there are also similarities between the sectors. Clarke et al. described the development of a simulation-assisted building control approach for energy management [41]. Sassanelli et al. presented a Product-Service System that is applicable to residential, as well as small and large enterprise buildings [42].

2.3. Digital Transformation

Digitalization has the potential to radically transform the whole industrial value chain by enabling the risk-free collection of real-time and low-cost data, supporting decision-making, and improving the productivity and flexibility of businesses. However, the use of digital models in the industrial context is not a completely new approach. From the early third industrial revolution, digitalization has been a common practice, aiming to achieve innovation and knowledge sharing [44].
To date, the real innovation relies on achieving higher levels of integration and synchronization among physical and digital worlds, i.e., enabling an effective digital twin (DT). The digital twin concept dates back to 2003, when it was first mentioned by Michael Grieves within the Product Lifecycle management (PLM) context [45]. Then, the National Aeronautics and Space Administration (NASA) adopted the term, referring to “an integrated multi-physics, multi-scale, probabilistic simulation of a vehicle” that mirrors “the life of its flying twin” [46]. Although NASA’s digital twin originally referred to a spacecraft, today DT applies in a myriad of industries, including healthcare, construction, smart cities, energy and manufacturing, due to its potential in forecasting, optimizing, and enhancing decision making. DT can be defined as a set of adaptive models that constitute a digital duplication of a physical system or process, and is kept up to date with a continuous bidirectional exchange of information between the virtual and real world. Hence, three main elements compose the Digital Twin architecture: (i) the physical world, which contains users, assets, machines, and regulations; (ii) the digital world, which contains models, analytics, and the virtual environment platform; (iii) the communication network, which ensures the integration between the physical and the digital world.
Nowadays, industry can benefit from the use of digital twins, due to the rapid development of digitalization tools and information technologies. DTs are good fit for several applications in the industrial context, including design [47,48,49], production [50,51,52,53], and services [54,55,56], such as prognostics and health management (PHM) [57,58,59]. DTs are mainly used for PHM, predictive maintenance and anomaly detection, but also for the control and optimization of operations and the simulation of future scenarios; their comparison represents possible applications areas.
In the EnerMan context, DTs are one of the enabling tools in the realization of a factory as a living organism that can predict and manage energy consumption in an autonomous way. DTs are used to visualize the possible sustainability performances when changes occur in equipment or in the whole production line, representing the core element of the EnerMan Prediction Engine. Furthermore, the EnerMan DT aims to predict the cost of the consumed energy by collecting and analyzing the significant parameters, e.g., energy peak load tariff, the amount of self-produced renewable energy, and changes in supply and demand. EnerMan aims to achieve further innovation by using the DT. The ultimate goal lies in the complementary use of the DT, the closed control loop system and the intelligent decision support system, in order to evaluate workflows in term of time, cost, and carbon footprint; this achieves the automated correction of the whole production line towards energy sustainability. In this research, DTs are considered to be a central element of the transformation towards sustainable manufacturing.
Little research has exploited exploit the potentiality of DTs in reaching the sustainability goals of processes and whole value chains. Turan et al. [44] use a DT to reduce raw material consumption in thermoforming processes. In this work, a kind of DT is used to support the real-time quality control of finished products. The deviation of the process parameters could affect the quality of the final products. Thus, process parameter prediction could reduce the rework and usage of energy and material. Digital twins have a high potential to predict and adjust key process parameters, in order to move towards sustainable manufacturing processes. In a historical moment, in which the fast control of emission levels is becoming a significant concern, DTs are also used as a means of assessing the impact of policies for the control and reduction of CO2 emissions in cities [60]. Calabuig-Moreno et al. propose a digital model of a neighborhood, aiming to simulate its performance after applying a given sustainability policy and providing urban developers with a relevant decision-making tool.
DTs represent, without any doubt, a powerful tool to assess and improve the sustainability performances of manufacturing processes. It allows assessing the performances of existing and planned production processes by providing advice and guidelines for wiser and sustainability-aware decision-making [61]. DTs can support companies to move from a linear system to a circular economy system that considers almost zero waste production and pollution, keeps products and materials in the recycling loop longer and helps regenerate natural systems. This potentiality of DTs should be enhanced.

2.4. Twin Transistion

Green and Digital Twin Transition is a term, presented by the European Union, related to the European Green Deal, and means the usage of digital technologies for a sustainable future [62].
Ortega-Gras et al. propose twin transition within three levels (the industry level, the technology level and the knowledge level). The new technologies that enable the process are the Internet of Things (IoT), Big Data and Analytics, Cloud Computing (CC), Simulation, Virtual Reality (VR) and Augmented Reality (AR), Artificial Intelligence (AI), Additive Manufacturing (AM), System Integration, Robotics and Cyber Security [63].
Hehenberger et al. [64] present a technological paradigm for the implementation of twin transition in industry, named EcoMechatronics. The vision of EcoMechatronics is, therefore, to significantly reduce the production of GHG and improve human behavior, in accordance with the UN Sustainable Development Goals [65]. The authors propose that the main driver is digitalization (Industry 4.0 and Smart Manufacturing), which, along with the guiding principles of processes such as Agile Management and Agile Production, integrate with aspects of sustainability, such as Green Production and the Circular Economy, to drive forward the sustainability agenda.

3. Conceptual Framework for Energy Sustainability Modelling and Simulation

The EnerMan project framework consists of several components covered in individual work packages. The EnerMan components are associated with superordinate systems, namely, (1) the industrial management system, (2) the industrial data collection system and (3) system analysis and prediction. The modelling is covered in the system analysis and prediction, and covers a variety of models, as visualized in Figure 3.

3.1. Problem Description

Cyber-physical production systems rely on several types of models, which differ in fidelity, targeted hierarchical system level, physical domain and other aspects. The heterogeneity can be expressed as the ‘Zoo of Models’ [66]. A common problem within the Zoo of Models is obtaining results, which include various models.
As discussed in Section 2.1, key performance indicators can include a variety of aspects. In the case of sustainability, these include economic, ecological and social domains. A quantification of these domains can be difficult, as multiple underlying indicators are needed [67]. The relevant indicators are often not directly available by sensing, and are composed of an aggregation of multiple data sources. Therefore, the following main questions appear:
  • How can the underlying data be represented to consider dependencies, data aggregation and disaggregation?
  • How can temporal and spatial aspects be considered and integrated?
  • What possibilities arise through the use of ontologies for KPI obtainment?
  • How can the obtainment of KPIs be orchestrated in consideration of the underlying cyber-physical systems?

3.2. Overview Framework

The overall framework structure outputs the KPIs based on the available and scoped cyber-physical systems. To accomplish the challenge, several layers are proposed, as visualized in Figure 4. The basis for the proposal is founded on the cyber-physical production systems and digital twins. The concept of digital twins and the cyber-physical production system has evolved over the years; for example, the twin concept dates back to NASA’s Apollo mission. Through the years, coupled with evolving digital tools, applications in manufacturing [54,68,69], product development [70,71,72], operations [73,74,75] and recycling [76] have emerged. Most applications target the manufacturing stage [77]. Cyber-physical systems unite developments from information technology and real physical systems, to typically sense, monitor and actuate elements in real-time [78]. The concepts of digital twins and cyber-physical systems are thus related [79], and are the foundation for the modelling of energy sustainability modelling.
As digital twins are bound to specific applications, an overall data aggregation is not scoped directly. Thus, multiple digital twins can co-exist simultaneously and feature overlapping sets of features. Within the energy domain, external factors must also be attributed. One example is electricity, which varies throughout the day in composition and cost, depending on the location of consumption. In addition, digital twins for resources can exist and comprise the digital twin ensemble layer, with product and workshop entity digital twins [74].
To deal with the application specification of digital twins, and the ambiguity of provided digital twin data, an evaluation of data is necessary. Information is defined as interpretable data with an associated context. The process of information generation needs data interpretation. A major difficulty for the interpretation of results is dependencies between information nodes. In order to derive additional data by aggregation, multiple information nodes may need to be taken into account. Thus, a network problem results. A representation of this problem can be created by the usage of a directed graph (DiGraph). The directions of the connections represent the data flow and dependencies simultaneously. A detailed explanation of the DiGraph approach for sustainability representation follows in Section 4.2.
To connect the ensemble of digital twins with the DiGraph layer, the individual digital twins’ features must be analyzed. As the operational digital twin has a physical counterpart, a distinction is also possible for virtual and physical data sources. In the case of duplicated features, individual sources may be aggregated, or a single can be chosen. Notably, the flow of data and information is unidirectional from the digital twin ensemble layer to the DiGraph layer. Thus, a selection must be made to select the relevant features and sources from the digital twin layer.
To determine the relevant information nodes, the key performance indicators (KPIs) must be defined. Conventional KPIs strictly follow mathematical definitions. In case of a volatile environment, e.g., a situation caused by a changing energy composition in combination with changing data sources, the evaluation is a non-trivial task. The application of an ontology model has the potential to mitigate these problems. Thus, KPIs could be calculated based on rules, as opposed to a static definition. A detailed explanation of this approach can be found in Section 4.3.
Obtaining the KPIs’ access to the DiGraph nodes is necessary. As the nodes represent information, they feature underlying data and context. To obtain the rule-based KPIs, ontology-assisted, context and node data must be interpreted. The interconnection between the KPI and DiGraph layer thus results in. the definition of KPI calculation rules. The flow is unidirectional from the DiGraph to the KPI layer. The obtainment of KPIs thus does not influence any DiGraph nodes.
In summary, information flows from the digital twin layer to the DiGraph layer and then from the DiGraph layer to the KPI layer, where selection happens by the target layers. A problem occurs if new KPIs are introduced. In this case, it remains unclear whether the information provided by the digital twin can be interpreted by the DiGraph layer, in order to obtain the KPI. Hence, an orchestration is needed to evaluate the capabilities of the entirety of layers. For the backlinking of requirements and opportunities, a new dimension is introduced, namely the capability management dimension.

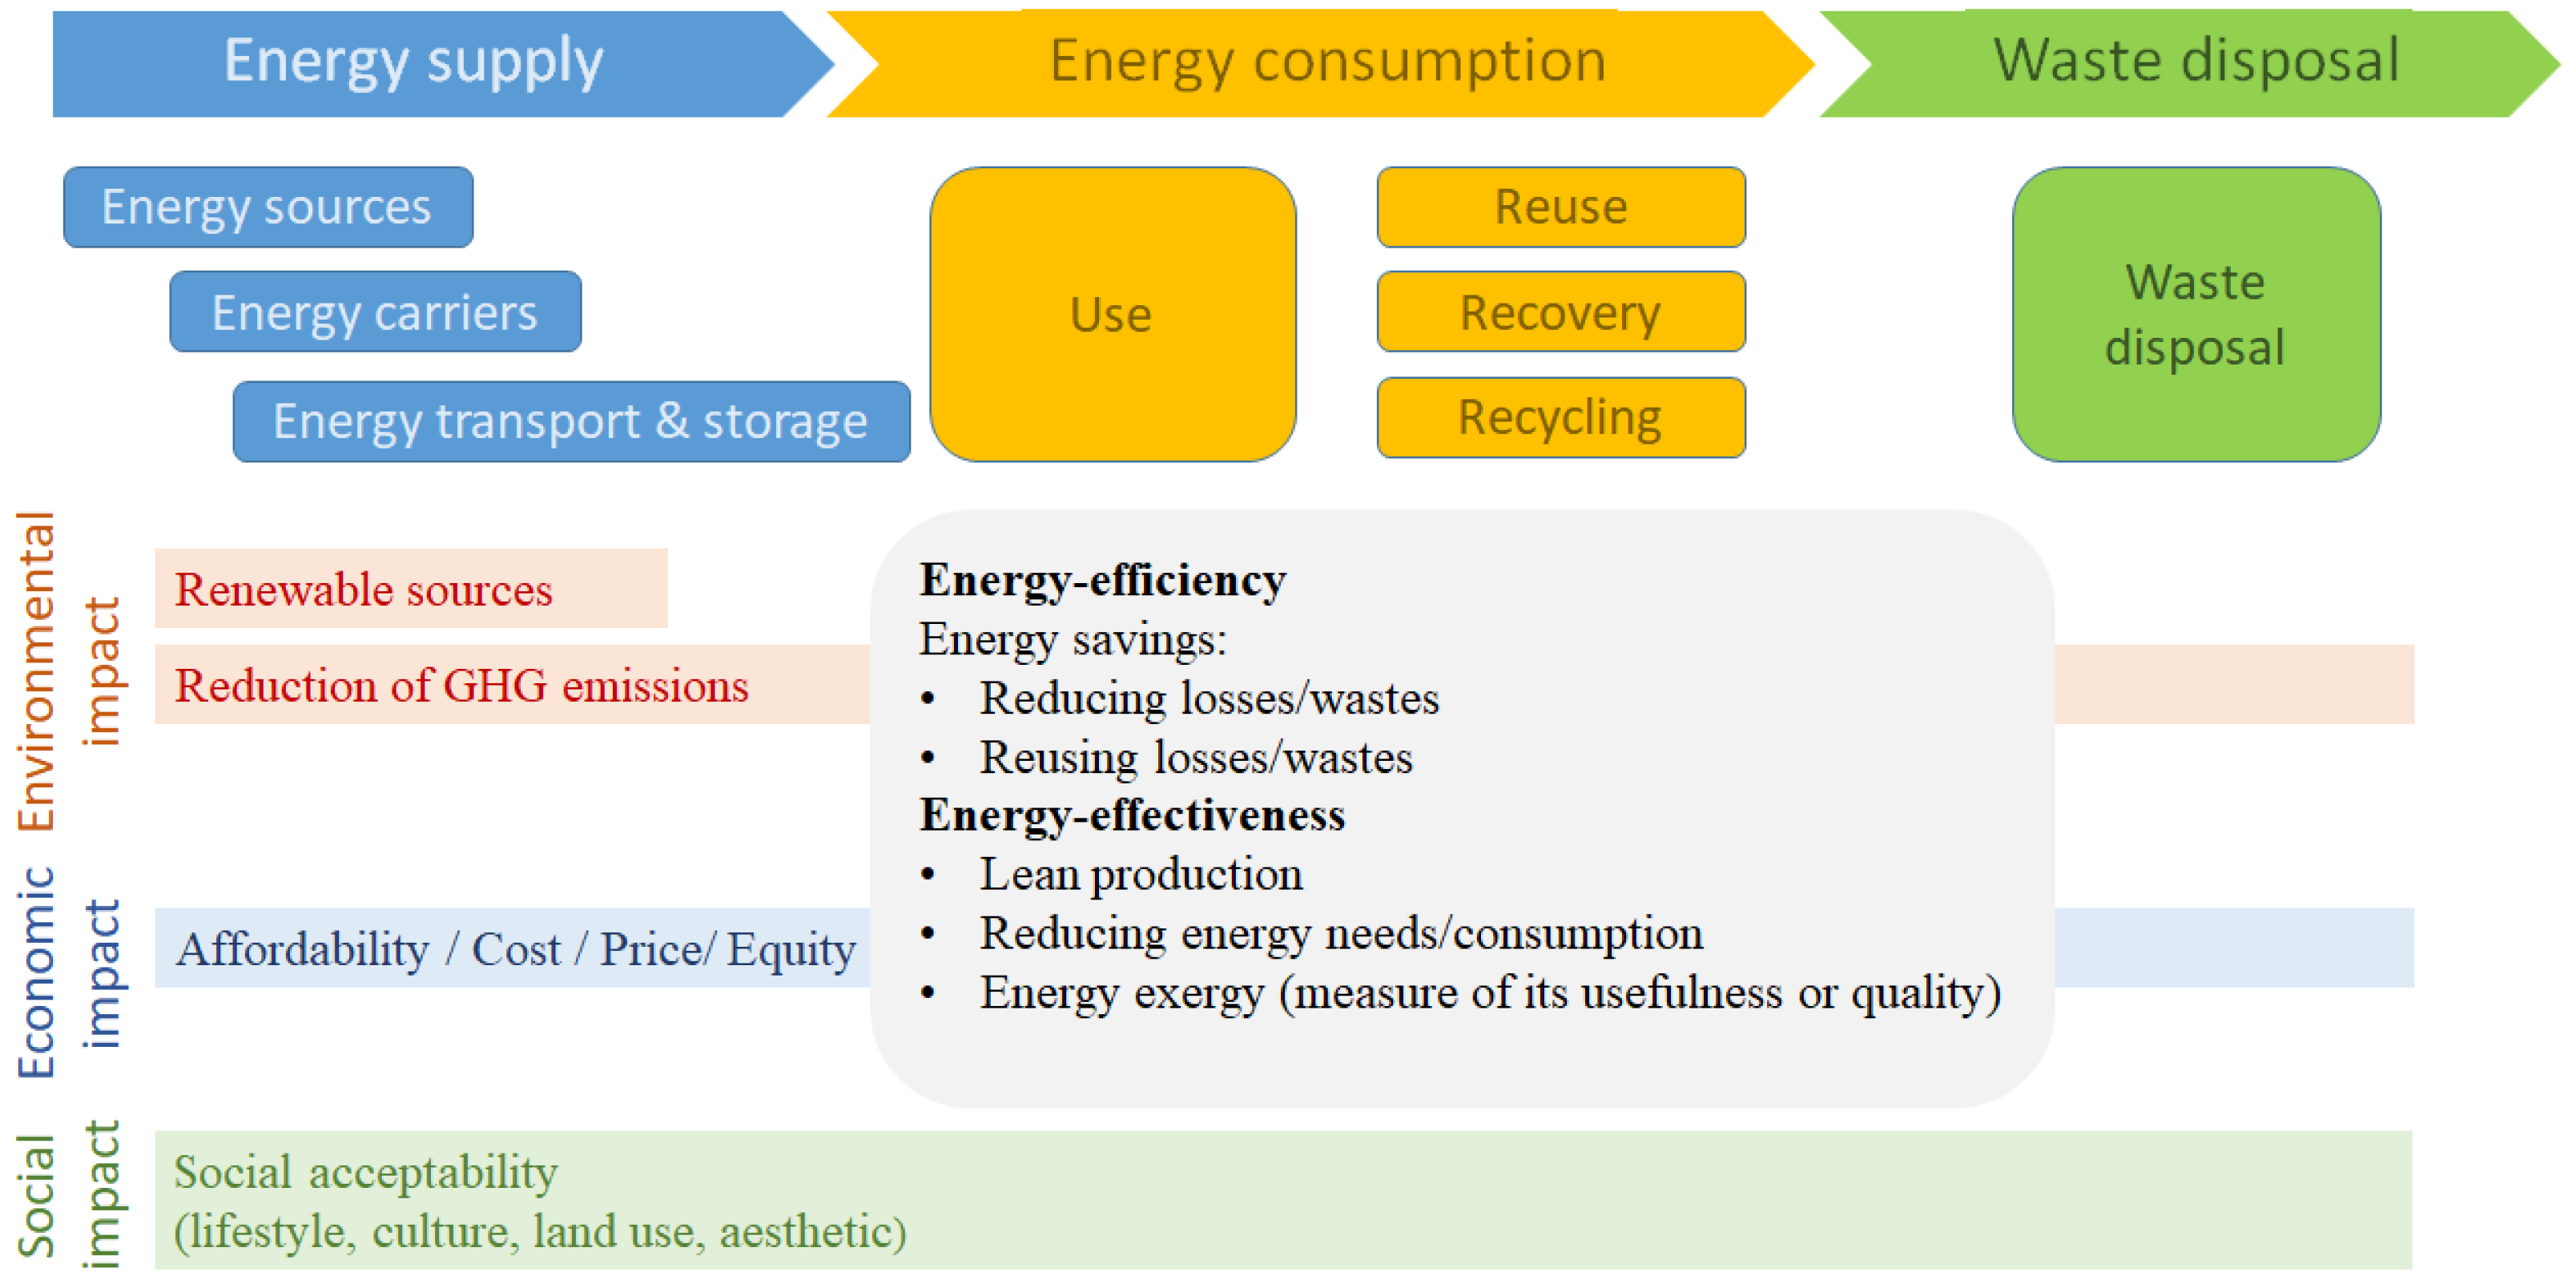
3.3. Energy Modelling within the Framework

To obtain the information from the digital twin ensemble layer, a segmentation of the digital twins is needed. As highlighted in the overview, digital twins exist in all life cycle phases, and for individual components and resources.
Considering the manufacturing environment as a system, it features inputs, and for material, it features information and energy. Instantiating material, information, energy and system internals on a workshop level yields products, resources and the workshop environment as respective classifications, as visualized in Figure 5. Notably, the derived classifications match with the digital twin types. Thus, the manufacturing system can be represented by an ensemble of the digital twin, provided that all the relevant information is provided.
To determine energy flows within the EnerMan framework, the Product–Workshop–Resource (PWR) representation is used as a basis. As highlighted in Figure 5, energy flows result from consumables.
A difficulty of the quantification of energy sustainability is the temporal and spatial aspects. This is especially the case for volatile energy types, e.g., electricity environmental changes impact the composition of electricity and thus sustainability. Due to complex supply chains, i.e., a network with multiple possible pathways and zones, such as the electricity grid, the location of energy consumption impacts sustainability.
To leverage the potentials of volatile energetic resources within the manufacturing environment, Grassl [80] defined energy flexible possibilities. Energy flexible measures, contrary to energy efficiency measures, do not aim for energy savings. They are used to adapt power consumption to match defined goals, e.g., minimizing energy cost by efficient scheduling or the reduction in peak loads to avoid penalties. In order to carry out these optimizations, predictions of environmental data, as well as the resource consumption of the manufacturing environment, are needed to evaluate the sustainability indicators in advance. As previously stated, energy sustainability depends on a variety of factors, which can feature an inverse dependency, i.e., falling energy price but rising inherent CO2 equivalent emissions.

4. Detailed Description for the Methodological Elements the Framework

As shown in Section 3, the conceptual framework provides a holistic view on energy sustainability; therefore, the used methods are integrated. In the following, details of the methods will be presented.

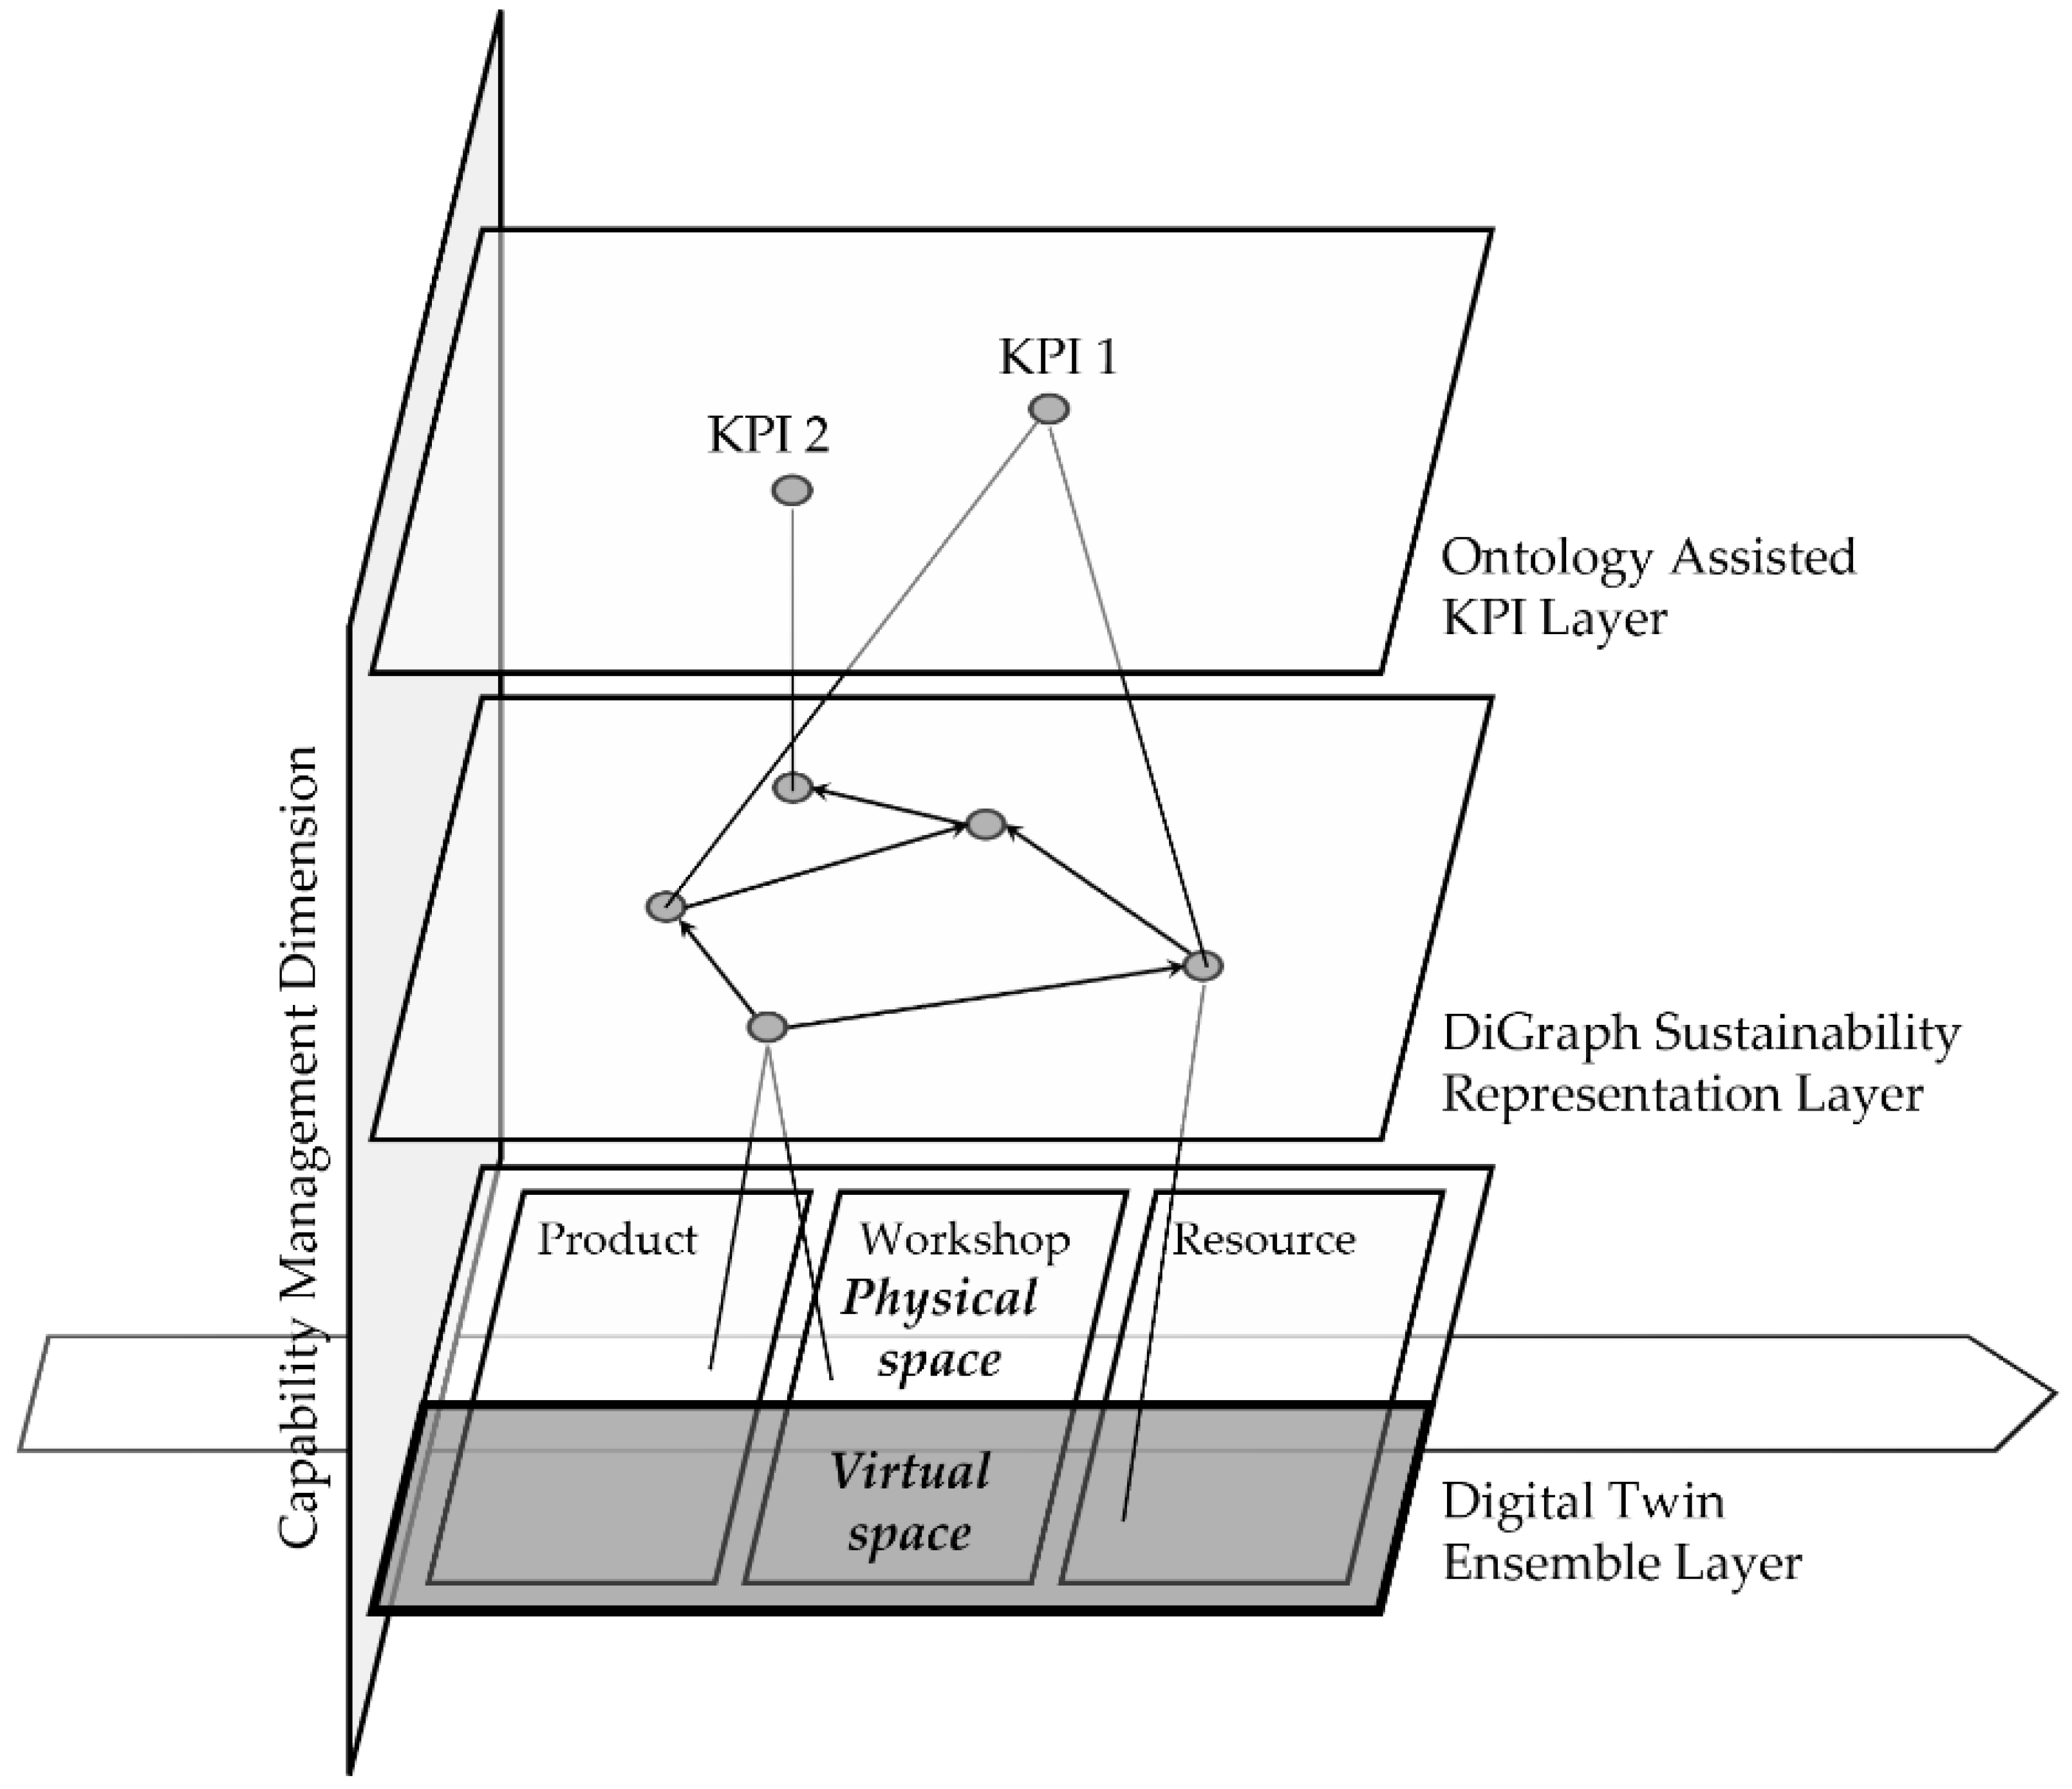
4.1. Hierarchical System Modelling for Sustainable Production

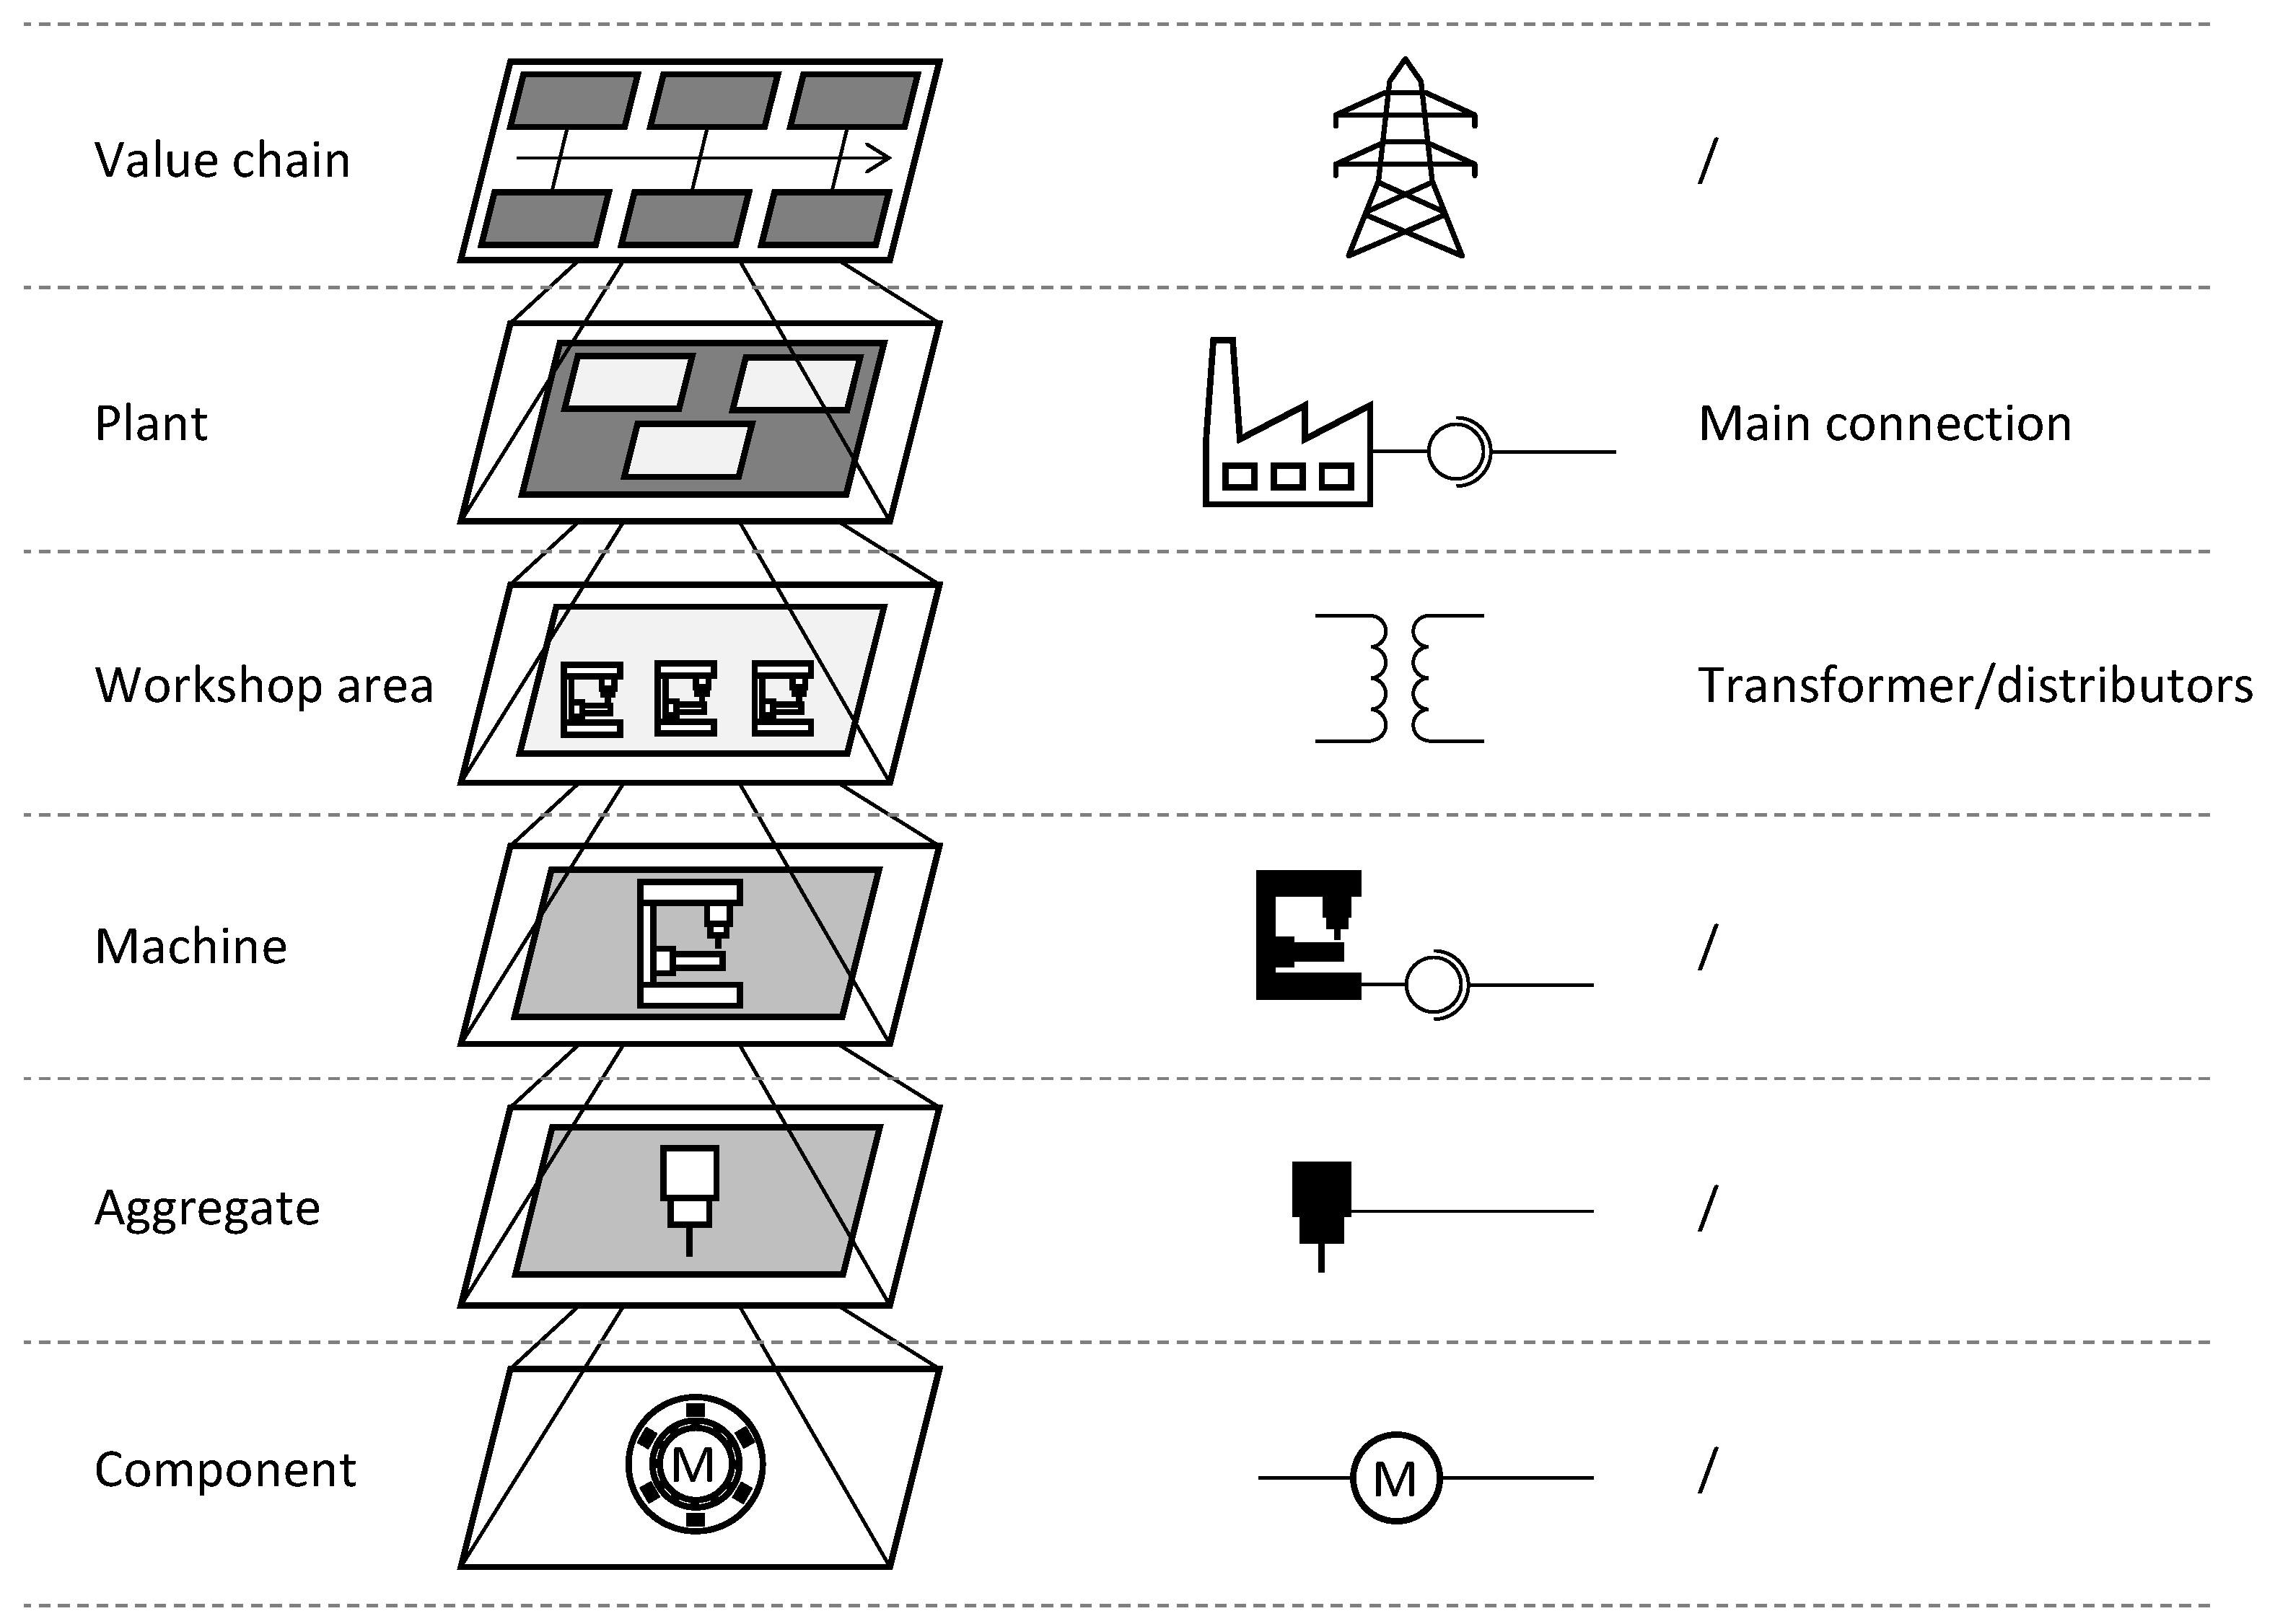
4.1.1. Hierarchical Structure with the Digital Twin Level
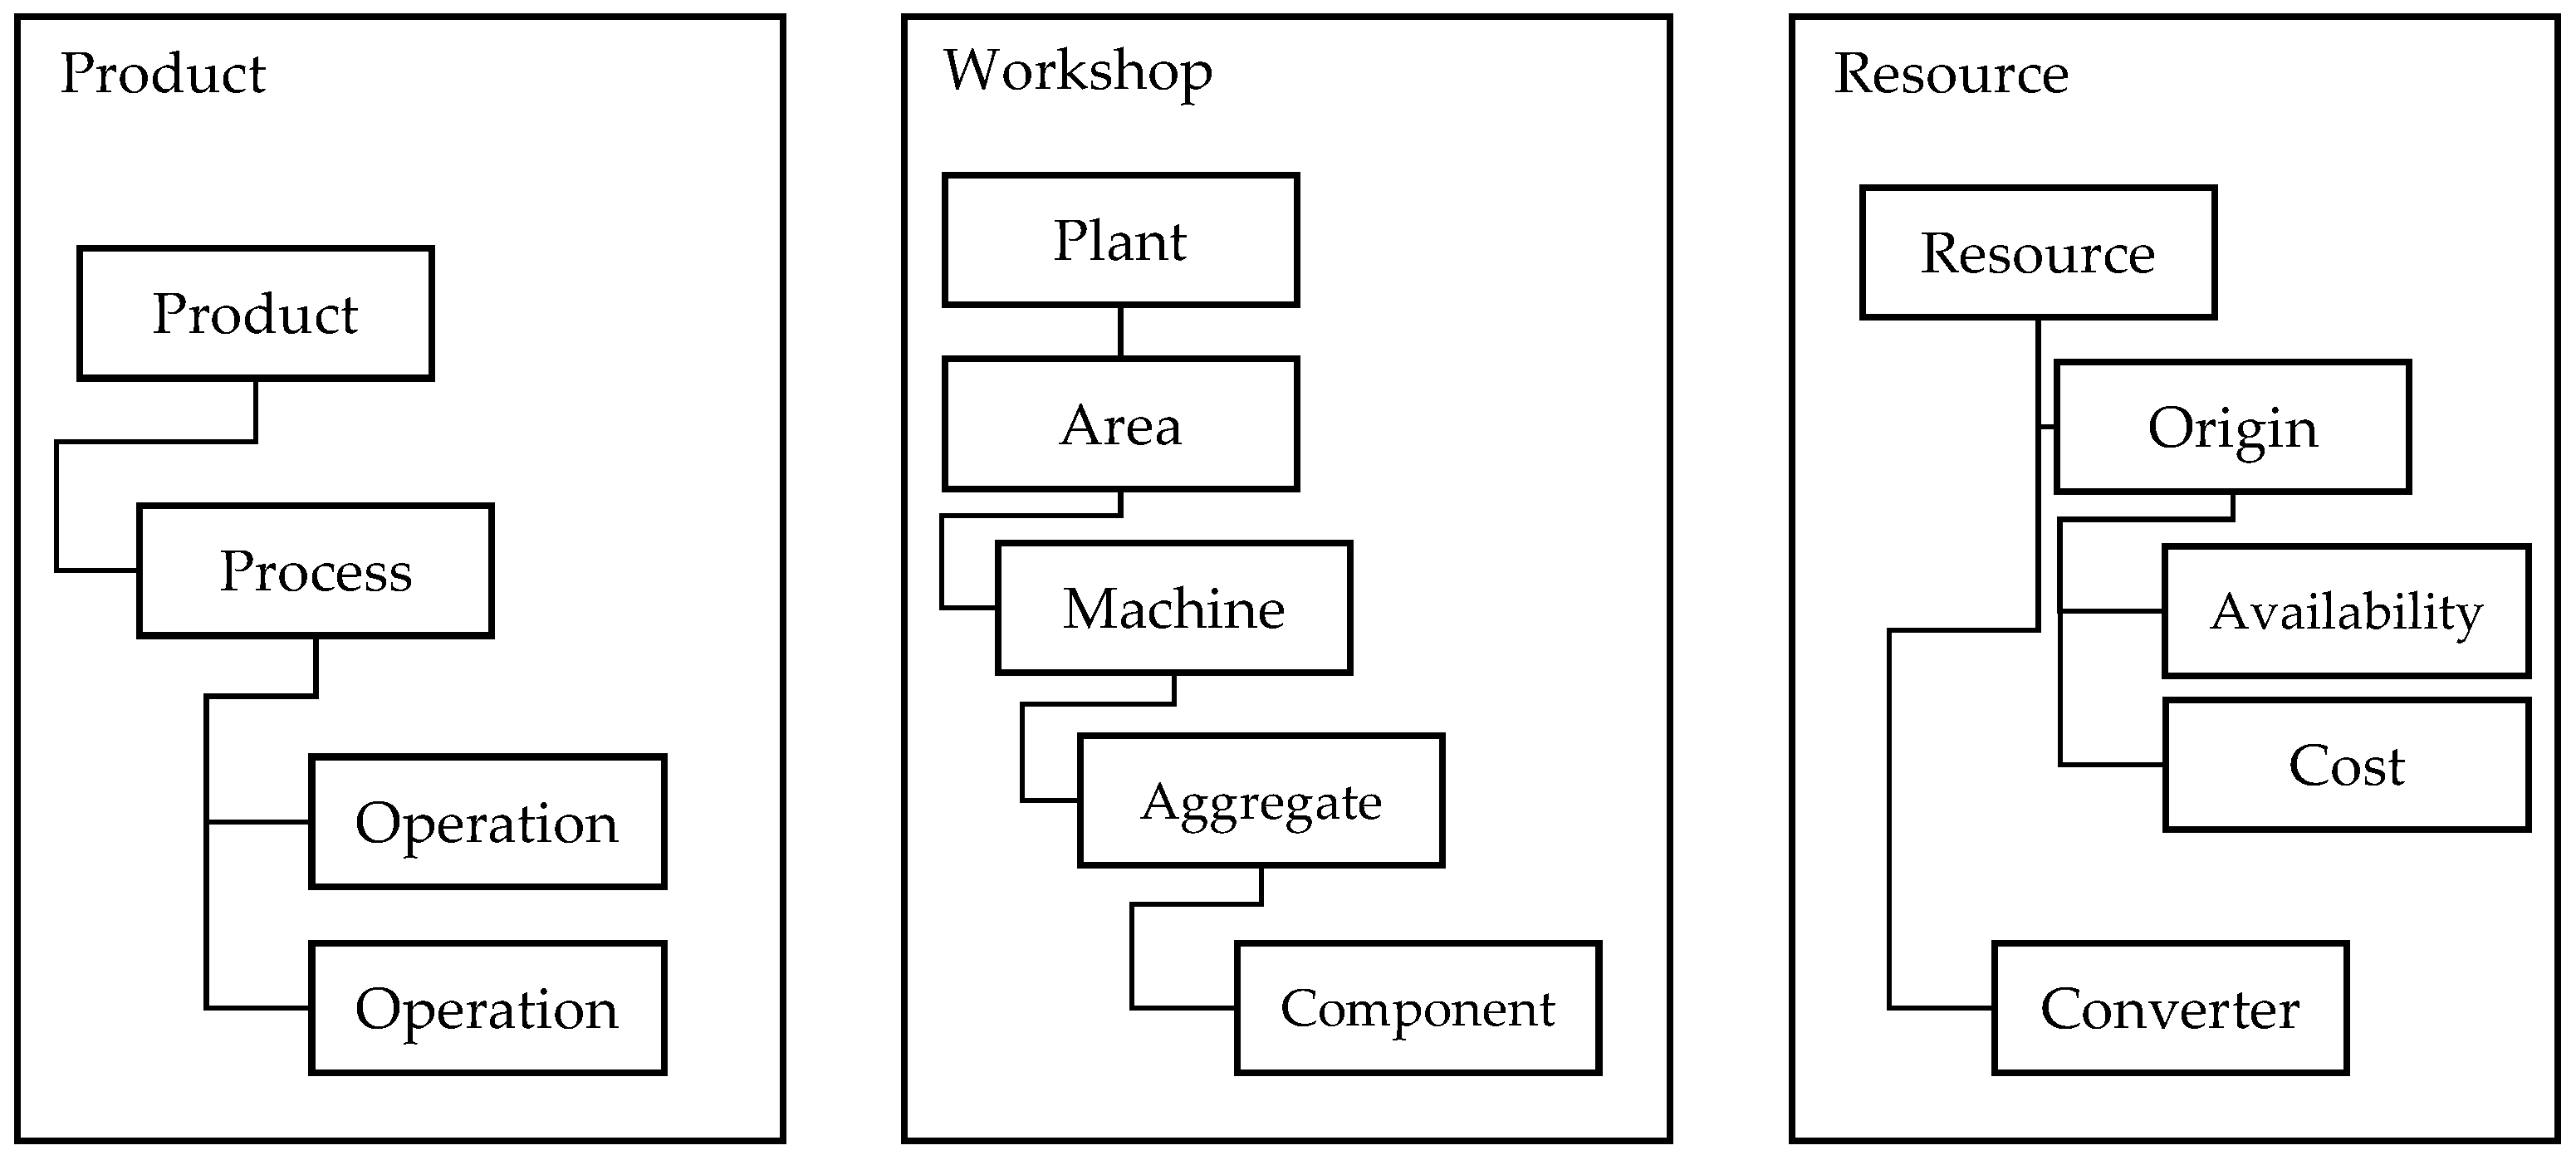
In order to achieve a classification for energy allocation, the considered EnerMan production system must be divided into hierarchical levels. For this purpose, reference points from the various international standards and scientific literature [81] were researched. The literature was chosen to represent a flexible and sustainable manufacturing system, with aspects focusing on material or information flow, hierarchical structuring, as well as process modelling. As the levels and naming conventions differ between the found reference points, a merge was proposed. The merge aimed to maximize the congruent reference points while minimizing the needed levels. Thus, the levels relevant to EnerMan were a composition of these sources, and were identified as follows [82]:
  • Value chain
  • Plant
  • Workshop area
  • Machine
  • Aggregate
  • Component
One difficulty in energy flow allocation is the lack of possibility to allocate the consumed energy, based on the production–internal energy distribution network, as pointed out by Liebl. Although the energy distribution network can also be classified into hierarchical levels, the structure may not be aligned with zones. Furthermore, from the machine level downwards, allocation is no longer possible through the distribution system and it must be allocated as far as possible by means of sensors, detection and allocation logic. Figure 6 visualizes the electricity distribution network contrary to the hierarchical structure. It is implied that additional sensing and energy flow tracing is required for the existing distribution sensors [82].

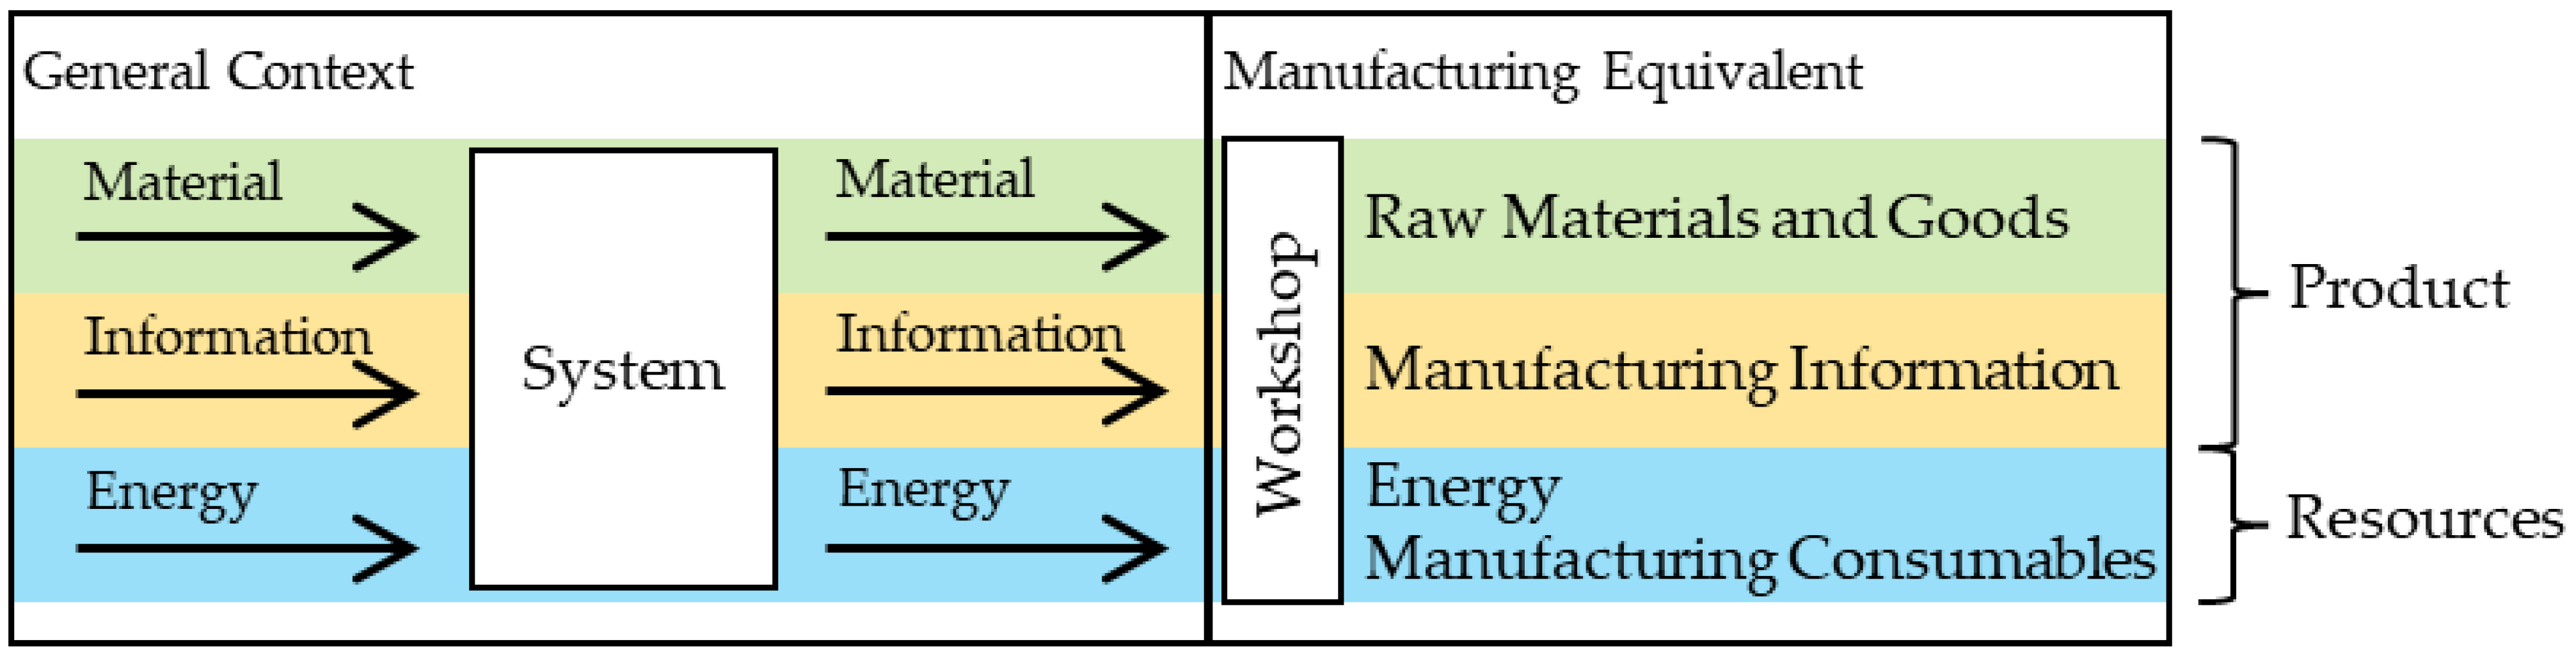
4.1.2. Product-Workshop-Resource Model

Based on the hierarchical system structure, two additional views will be considered: the product view and the resource view. The summarized product–workshop–resource model will be proposed (see Figure 7). The relevant aspects in the context of the PWR information model are as follows:
  • energy sustainability modelling;
  • energy cost forecasting;
  • energy consumption environmental impact modelling;
  • energy flexibility;
  • energy types and their attributes (e.g., volatility);
  • the data flow between the modules/models/levels through the defined interfaces.

Each View Follows a Specific Purpose

The workshop view is the only view that is interconnected with the other views. In the workshop, the existent static, non-consumable manufacturing equipment is present. The plant and its representative production areas are mainly used for the tracing and allocation of energy flows. The production areas contain energy consumers in the form of machines and respective aggregates. These entities can contain specific parameters regarding their current status and wear level, or provide a data interface. Components, however, can be underlying to aggregates or standalone. Therefore, fixtures are also classified as components, but can be used in combination with different aggregates respective of machines. Hybrid components, e.g., batteries, can also be modelled as aggregates or components. The related energy exchanges happen in the resource section.
The product view provides the necessary manufacturing information. As products are highly individual, cross-pilot templating is not leveraged in this case. Instead, products and processes are defined as blueprints, which can be overridden or parametrized when being instantiated as manufacturing job. In this definition, a process occupies a machine and can, therefore, be used to indicate machine occupancy. Processes itself consist of individual operations, which can utilize different sets of equipment. An example, therefore, would be the process of milling. The milling process happens on a defined milling machine. However, it can consist of a roughing and a smoothing operation, which need different milling tools at a minimum. In addition, different fixtures could be included within the equipment set. The operation steps also include all the relevant manufacturing information in order to control the specified equipment set.
The resource view only interfaces with the workshop area and is, therefore, independent of the products’ manufacturing information. In fact, the resource view is only coupled with the components as all the energy flow is assumed to happen on the component level. With this approach, components can provide multiple resource conversions. Such resource conversions are also meant to be templated and to be coupled with behavioral models. Resources themselves can represent not only energy, but also other manufacturing consumables that allow the allocation of CO2 equivalent emissions through resource wear.

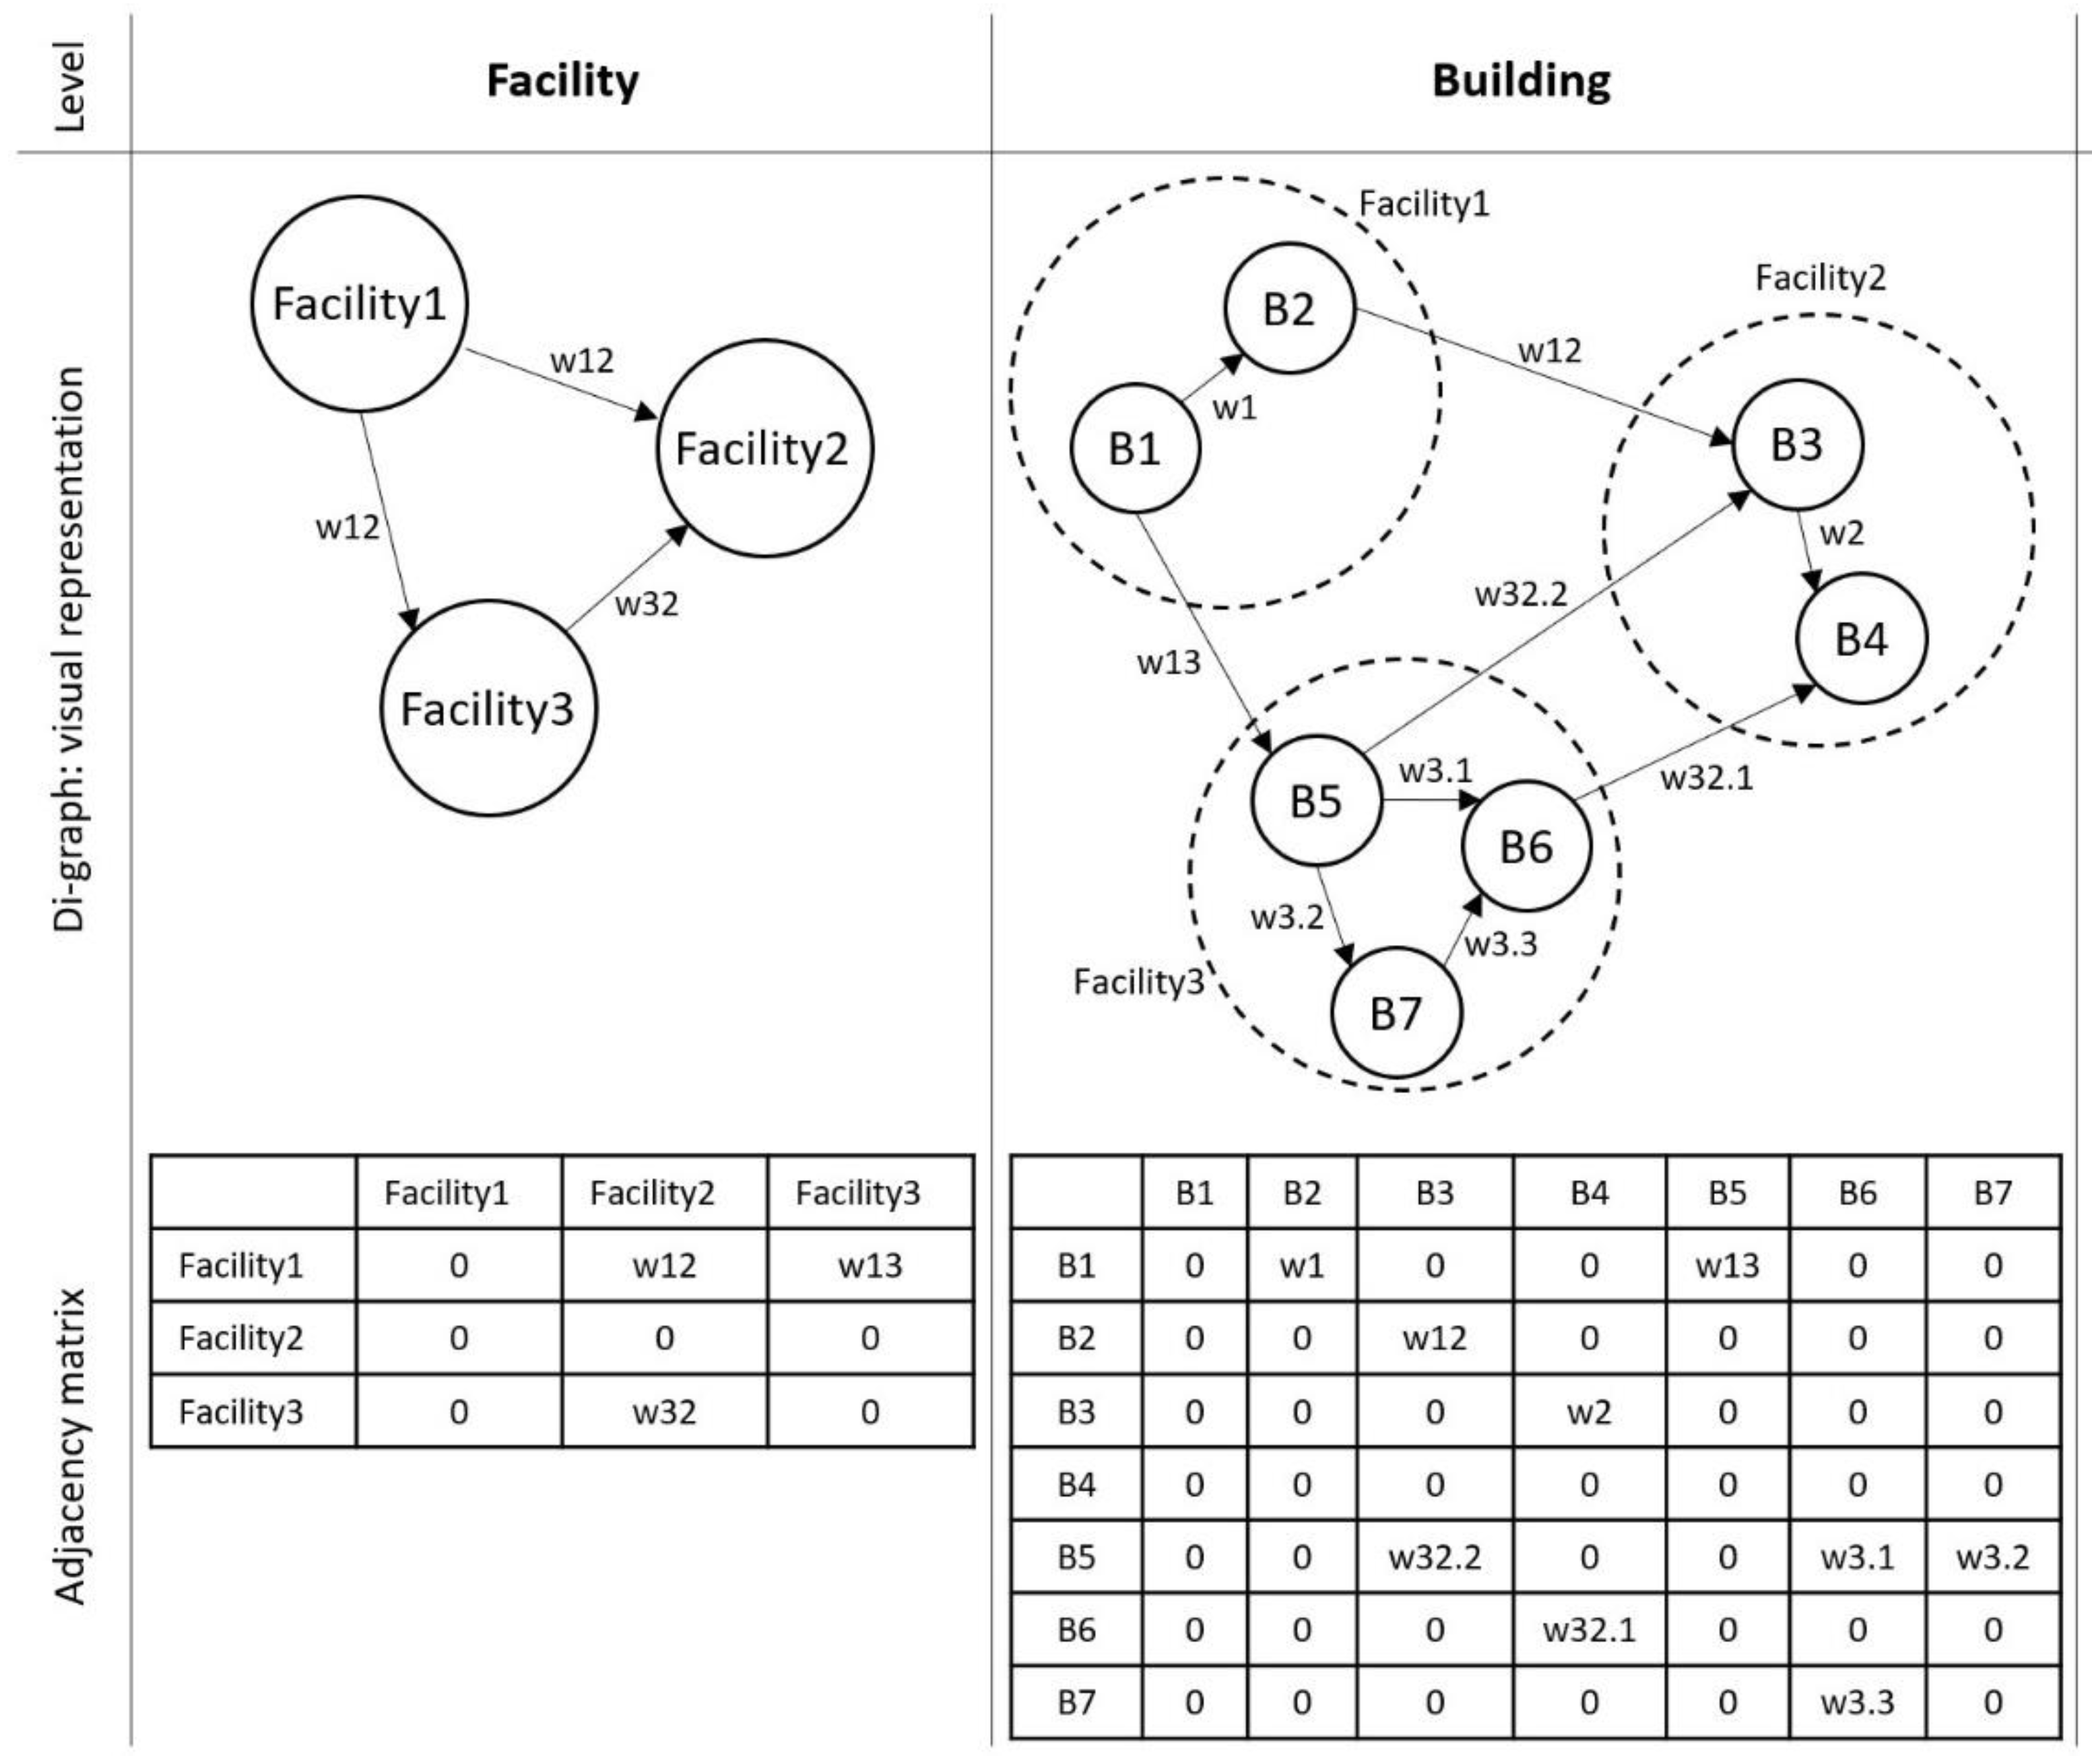
4.2. Graph-Based Representation for Sustainability, Management, and Footprint Bonds Mapping

In recent decades, many firms and manufactures have developed strategies to improve the environmental performance of their activities. The main objective is to minimize the carbon emissions linked to the production activities. The total amount of carbon emissions for a product is not only related to the manufacturer’s line, but also to the supply chain. Low-carbon production adopts all sustainability strategies to achieve the company’s objectives for reducing the impact on climate change. Emissions related to a single product are affected by the production systems and logistic organization of the involved companies, and by many manufacturing parameters for each company. The sustainability problem is characterized by multi-relations among a large set of variables; these relations are often ambiguous in the context of global change. In such a context, sustainable production is a complex activity that requires approaches, methods, and tools for facing, managing, tracing, and visualizing such complexity.
Graph theory provides powerful methods and tools for dealing with complexity and modelling many problems in mathematics, engineering, computer science, economics, sociology, linguistics, and sustainability. The theory is based on graphs that can be used to represent relationships by means of binary relations.
A simple graph G = ( V , E ) consists of a set of vertices V = { v 1 ,   v 2 , } and a set of edges E = { e 1 , e 2 , } , such that each generic edge e k consists of an unordered pair of vertices ( v i , v j ) that are the ends of e . The numbers of vertices and edges are called the order and size of G, respectively [83]. When the direction of the relations is important, the directed graphs (DiGraphs) are required. A di-graph G is different from the simple graph due to the edge e k , which consists of an ordered pair of vertices. In this case, the directed edge is named arc [84].
Graph theory provides two main matrices for recording and managing the data:
  • adjacency matrix A = [ a i j ] —is an n   x   n matrix where n is the order of the graph. a i j = 1 if there is an arc from the i t h vertex to the j t h vertex, otherwise, a i j = 0 ;
  • incidence matrix M = [ m i j ] —is an n   x   m matrix where n is the order and m is the size of the graph. The position m i j stores the number of times that the i t h vertex and the j t h edge are incident.
Although a matrix representation is very useful to implement and record data for computer processing, visual representation is very convenient for a clearly and readable representation.
In the case of product manufacturing, the representation of DiGraphs is very powerful when combined with a multi-level representation.
Multi-level DiGraph modelling of the sustainability problem can help a company to achieve their low-carbon objectives. The present paper proposes a multi-level model of the sustainability problem, characterized by a DiGraph representation at each level:
  • facility level—companies’ facilities involved in the manufacturing of a product;
  • building level—all buildings that compose the facilities;
  • line level—production lines for each building;
  • device level—single device involved into production line.
The proposed framework allows the definition of relationships: (i) at each level among vertices belonging to the same DiGraph; and (ii) among levels through vertices belonging to different DiGraphs. The two types of relations, organized by means of the adjacency and incidence matrix, allow one to record, manage, map, and trace the relations among the levels. The visual representation of DiGraphs allows one to easily represent the sustainability chain and the carbon maps by using weighted arcs (Figure 8).
According to the proposed framework (Figure 4), di-graphs represent the energy-wise data at different detailed levels, as described in Figure 6, and for different types of data. At each level, three different di-graphs represent data, as follows: consumption, carbon and cost. All di-graphs have the same structure, characterized by node and arc meanings. For example, in the consumption di-graph, nodes represent the energy consumption of each facility/plant, while arcs represent the energy consumption of the logistics among them. Moving down through the levels, the structure and data are detailed concurrently up to the last level, composed of the smallest elements. Di-graph architecture is then duplicated in order to obtain a twin of the forecasted data. Finally, the di-graph architecture is composed of two sets of di-graphs at each level; a set to describe the monitored data and another one to describe the forecasted data. An example of forecasting is provided in Section 4.4.

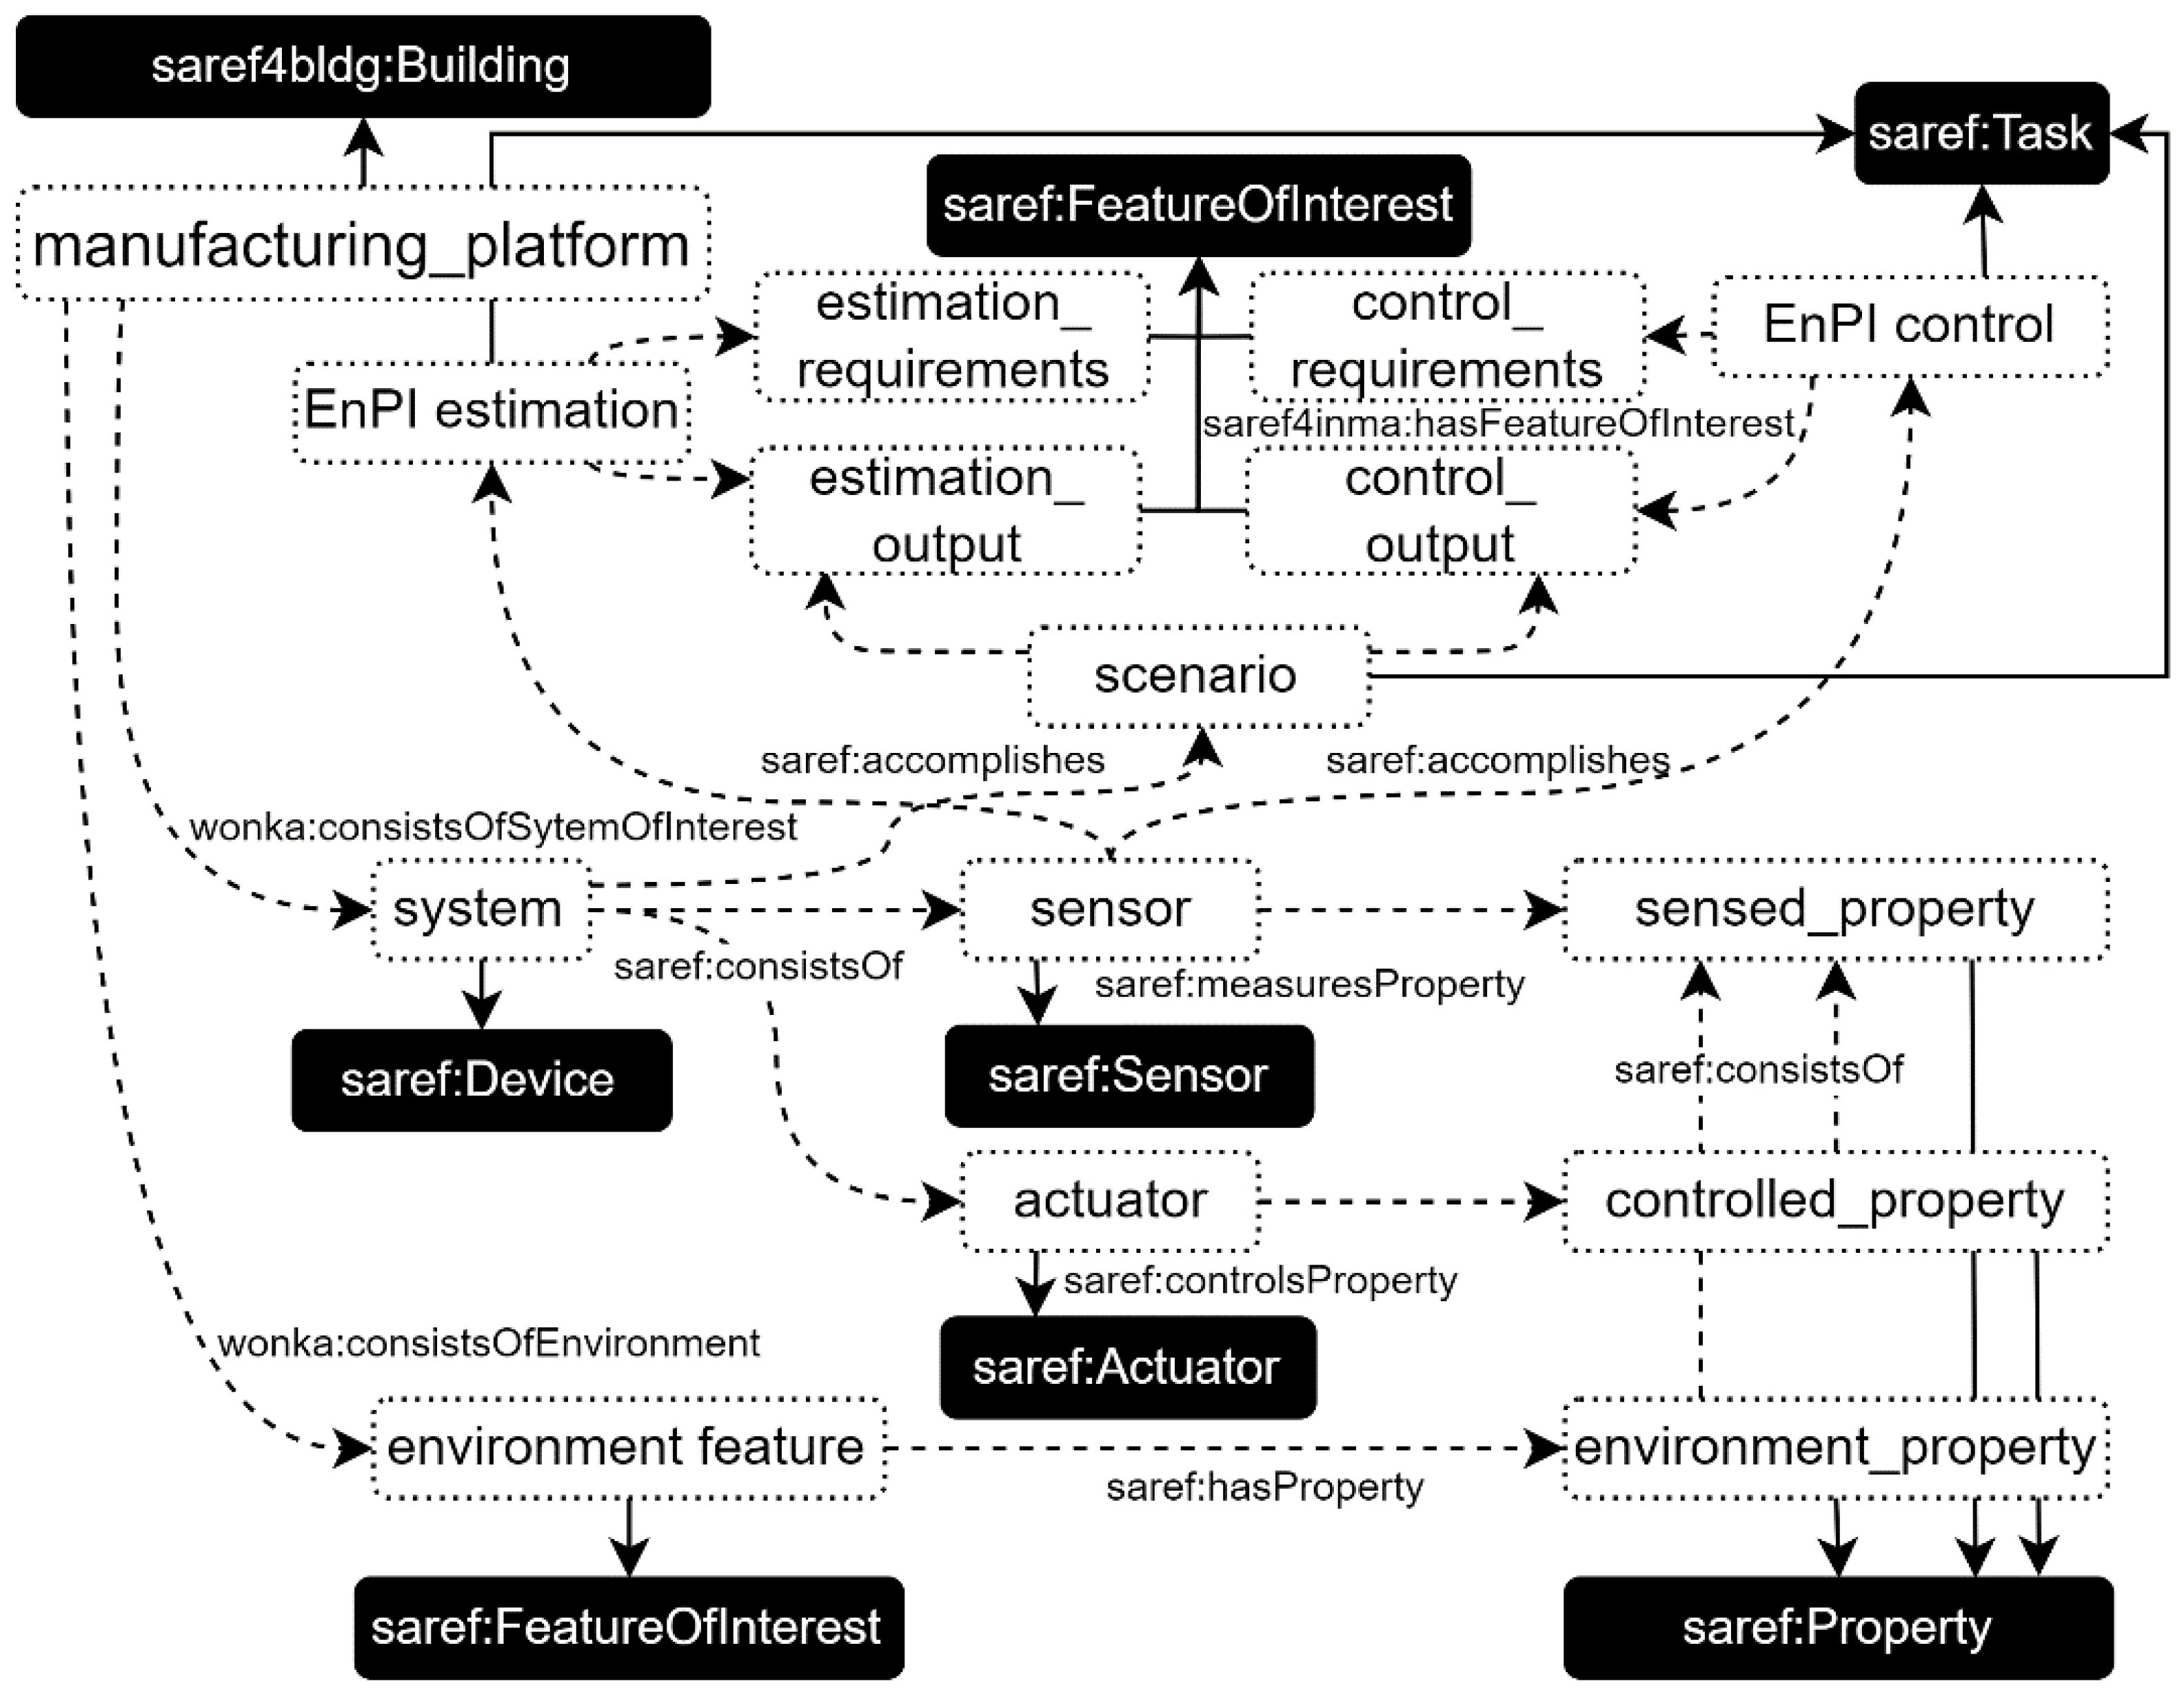
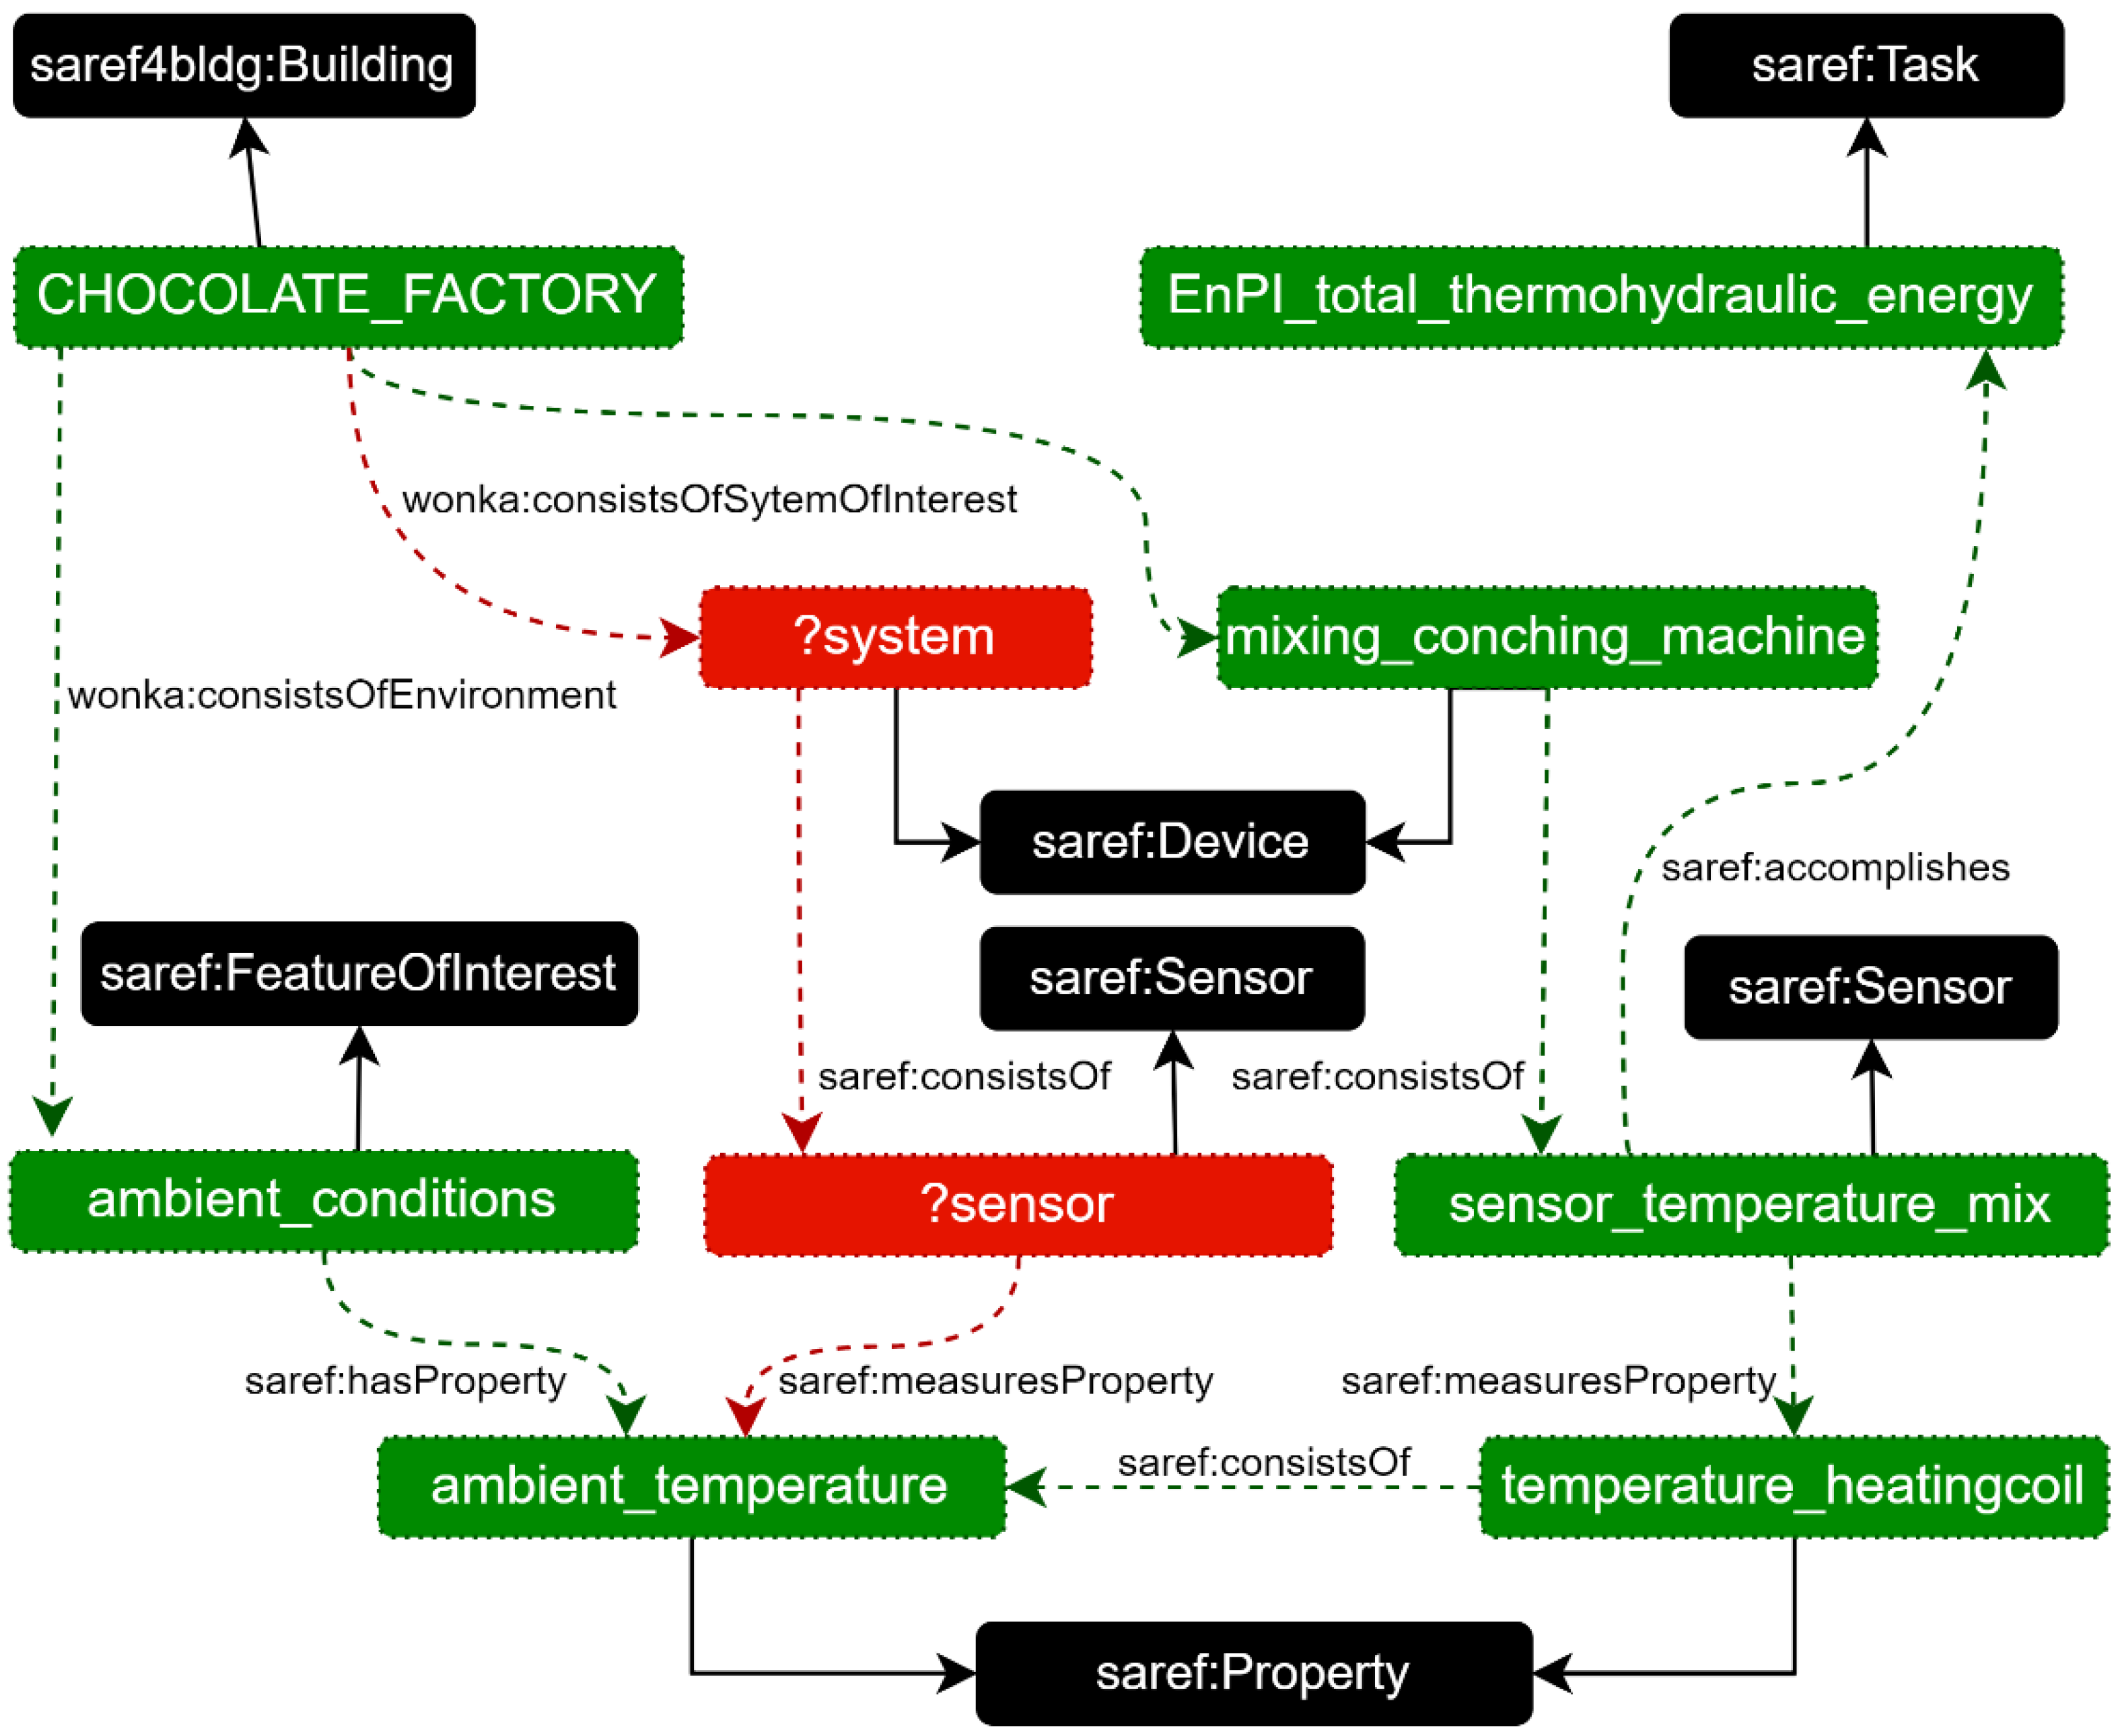
4.3. Ontological View to Support EnPI Evaluation Process

The contribution proposed in this section aims to evaluate the extent to which a scientific approach can be applied to an industrial use case using a previously developed ontology-based V&V approach, with a specific focus on the evaluation process of Energy Performance Indicators (EnPIs). The developments within the proposed digital twin framework have to be widely applicable to a variety of industrial manufacturing companies. These companies differ in terms of systems and environments, application area, technological maturity level and specific constraints [85]. The digital twin presented here is a smart connected product with capabilities ranging from monitoring to optimization, according to the classification of Porter and Heppelmann [86]. The underlying scientific and technological developments must remain generic so as to apply to heterogeneous systems and applications.
A way to manage this genericity issue, with respect to heterogeneous systems, is to use ontologies. Indeed, ontologies provide a unified framework that hosts a generic semantic representation. This framework allows the sharing of structured knowledge from different viewpoints, whatever the stakeholders’ needs and their context. As a result, an ontology can provide the necessary depth to represent similar artefacts of varied systems. Uschold and Gruninger have proposed a classification for ontologies [87] and state that an ontology offers four levels of formalization, of which only the formal level can support deductive mechanisms, particularly for the solving of system engineering problems.
The use of ontologies for energy management applications is not new. Numerous ontologies have been proposed to describe cyber-physical systems and capture their physical and energy behaviors, while operating within simplified representations [88,89,90]. That is, these descriptions are lightweight and optimized for human or automated analysis. Ontology-based approaches have been designed in energy management research, so as to leverage knowledge representations for decision-making in optimization tasks [91] and data integration, interoperability and reasoning [92]. Ontologies have also been widely applied to smart homes and building energy management. This enabled the computation of energy performance metrics and correlated variables, with a semantic aggregation of data (e.g., temperature and energy consumption readings) [93], system surveillance [94], and a meaningful building EnPI for each stakeholder [95]. Beyond building monitoring, modelling and control aspects have also been investigated in the literature [96,97]. Overall, an ontology remains an abstract concept with a theoretical background. Leveraging such a framework in new applications is not straightforward and requires careful adjustments.
In this context, we propose the application of the WONKA (Verification and Validation with Ontology and Knowledge-based Approach) framework, detailed in [98], to continuously assess the applicability of a given scientific approach to an industrial use case. In this section, we consider the following case-study: is the digital twin capable of estimating and controlling an EnPI of interest for a given manufacturing system? EnPIs are usually computed from sensor data, sometimes supplemented with physical models. Based on these EnPIs, sustainable energy management consists of (but is not limited to) activating or controlling actuators in real-time, or tuning control parameters. EnPI evaluation depends on the availability and properties of the relevant sensors on the studied manufacturing system and its configuration.
Within the EnerMan scope and its sustainability objectives, we have investigated ontologies in which manufacturing systems and their sensing behavior can be accurately expressed. Focusing on energy sustainability, various ontologies relate to energy evaluation and management in manufacturing [99,100] or manufacturing factory sustainability [101,102,103]. Some ontologies address dynamical systems, including control [97], condition monitoring [104,105] and prognostic [106] aspects, and support the description and use of the interactions between the related sensors and actuators [107]. Finally, numerous manufacturing-related ontologies [108], such as MASON [109] or ExtruONT [110], detail production operations, systems, resources and plant layouts; yet, these ontologies focus on production management, and not on the physical behavior of a plant’s manufacturing systems. In fact, many of the latter ontologies are aligned with the Sensor, Observation, Sample and Actuator (SOSA) ontology [111] or one of its extensions, namely SSN and DUL [112]. Together with the SAREF module SAREF4INMA [113], these ontologies accurately describe the physical interactions between manufacturing entities.
The methodology presented in this paper is based on an ontology inherited from SAREF and SAREF4INMA, which is considered sufficient and appropriate for the purpose of this study, and is designed in Protégé [114]. Once the ontology is built, the studied system can be formally instantiated, including its properties and values, before defining the associated relationships. These axioms form the knowledge base (KB). An ontology contains a limited number of concepts and relationships, each of which may have multiple purposes. An implementation blueprint is presented in Figure 9, thus avoiding misinterpretations when instantiating the proposed ontology.
Following WONKA’s V&V processes, requirements are elicited in order to ensure that EnPIs can be both estimated and controlled given the current configuration and properties of a manufacturing system. These requirements are presented in (Table 3), then formalized as ontology-compliant queries, i.e., expressed as formal statements using the ontology’s concepts and relationships. The knowledge base is thus queried using WONKA’s querying engine.
Therefore, the Resource Description Framework (RDF) is used and these requirements have been formally expressed as queries using the Simple Protocol And RDF Query Language (SPARQL). Such a query can be parsed and visually represented as an RDF graph, as illustrated in Figure 9 (below) with Req 3, to verify whether a sensor on the chocolate manufacturing system is available to evaluate the thermohydraulic energy consumed (EnPI).
Once the ontology is designed, the knowledge graph (instantiated) and the queries are established; our approach consists of two iterative steps: (i) evaluating to what extent the considered manufacturing system can fulfill the defined EnPI-related requirements, and (ii) offering recommendations to augment or modify the manufacturing system of interest, so as to increase the requirement satisfaction rate. More specifically, the proposed mechanism highlights discrepancies between a requirement (as an RDF graph) and its instantiation, with each result of the SPARQL query applied to the knowledge graph. When a requirement is not fulfilled, the instantiation is only partial, making it possible to pinpoint erroneous and missing object properties, as well as missing individuals. Requirement compliance can be assessed at runtime, thus ensuring the applicability of the approach at all times, in spite of the digital maturity of the use case and changes made to it over time.
Finally, this ontological approach, applied to the EnPI evaluation here, could be used to meet many other objectives regarding the preliminary verification and validation processes, based on a knowledge base.

4.4. Cost Digital Twin

In the framework, the energy cost describes a cross-cutting aspect and will be presented here in detail.

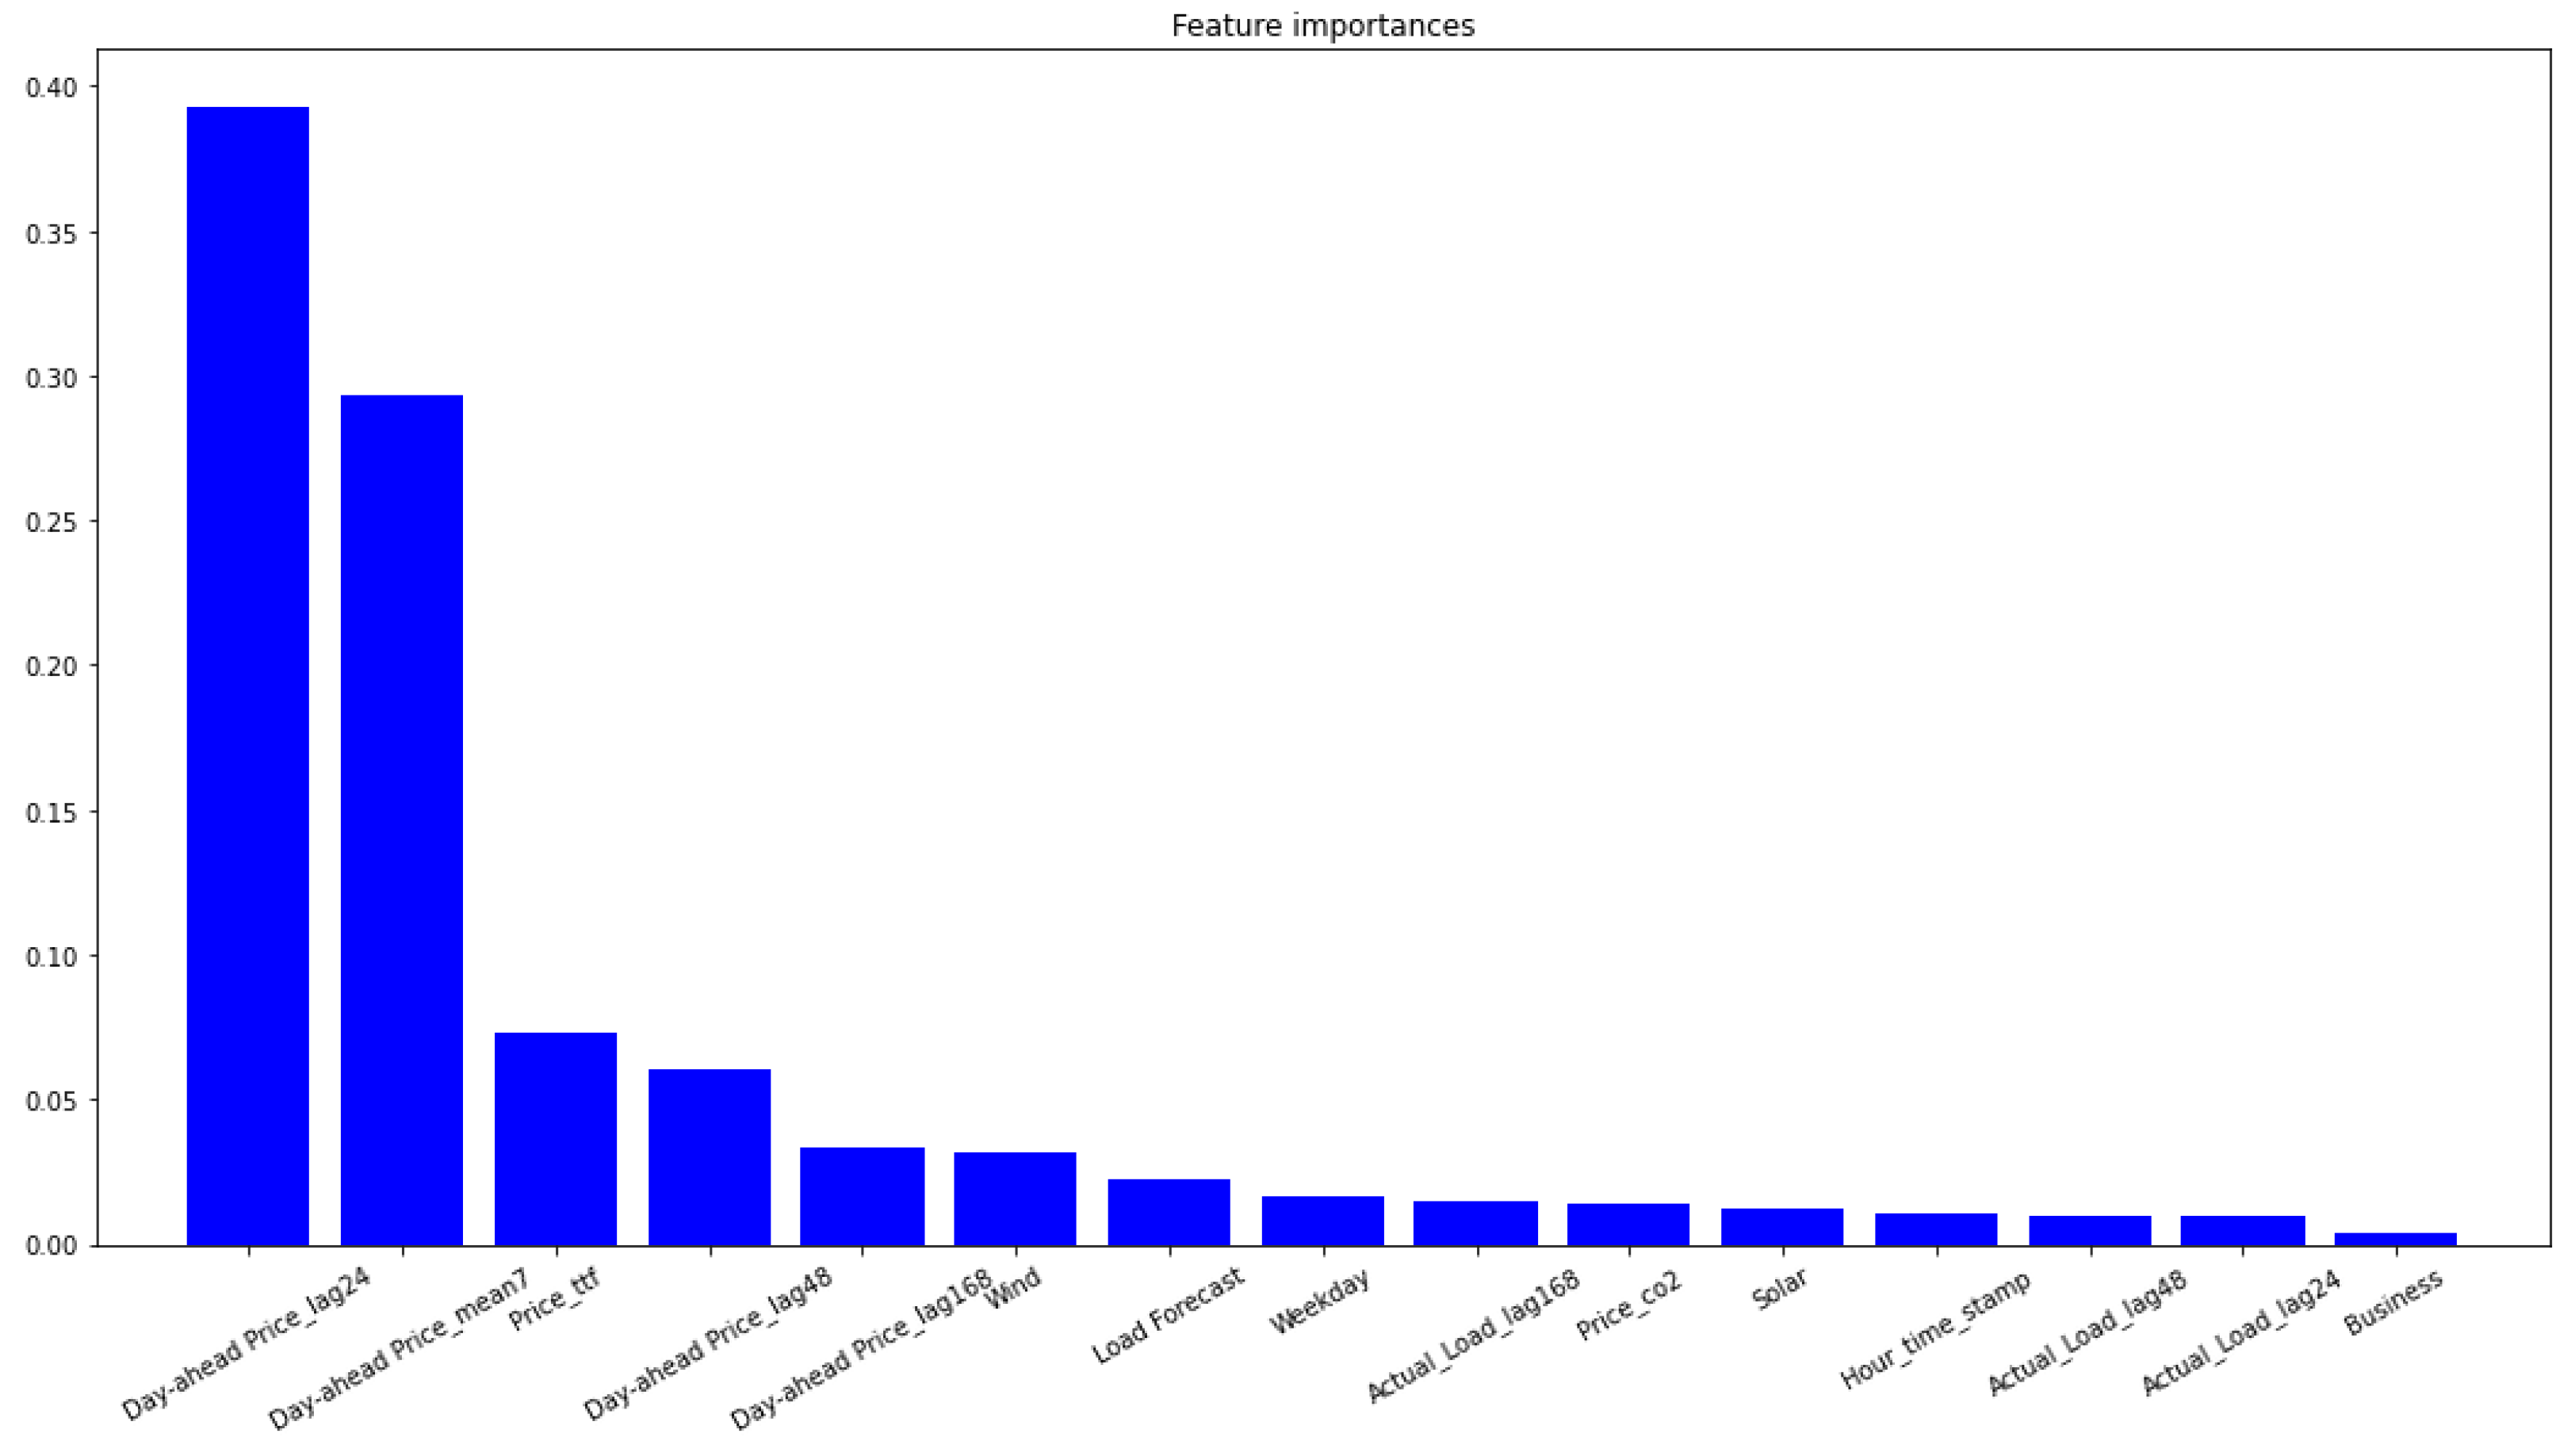
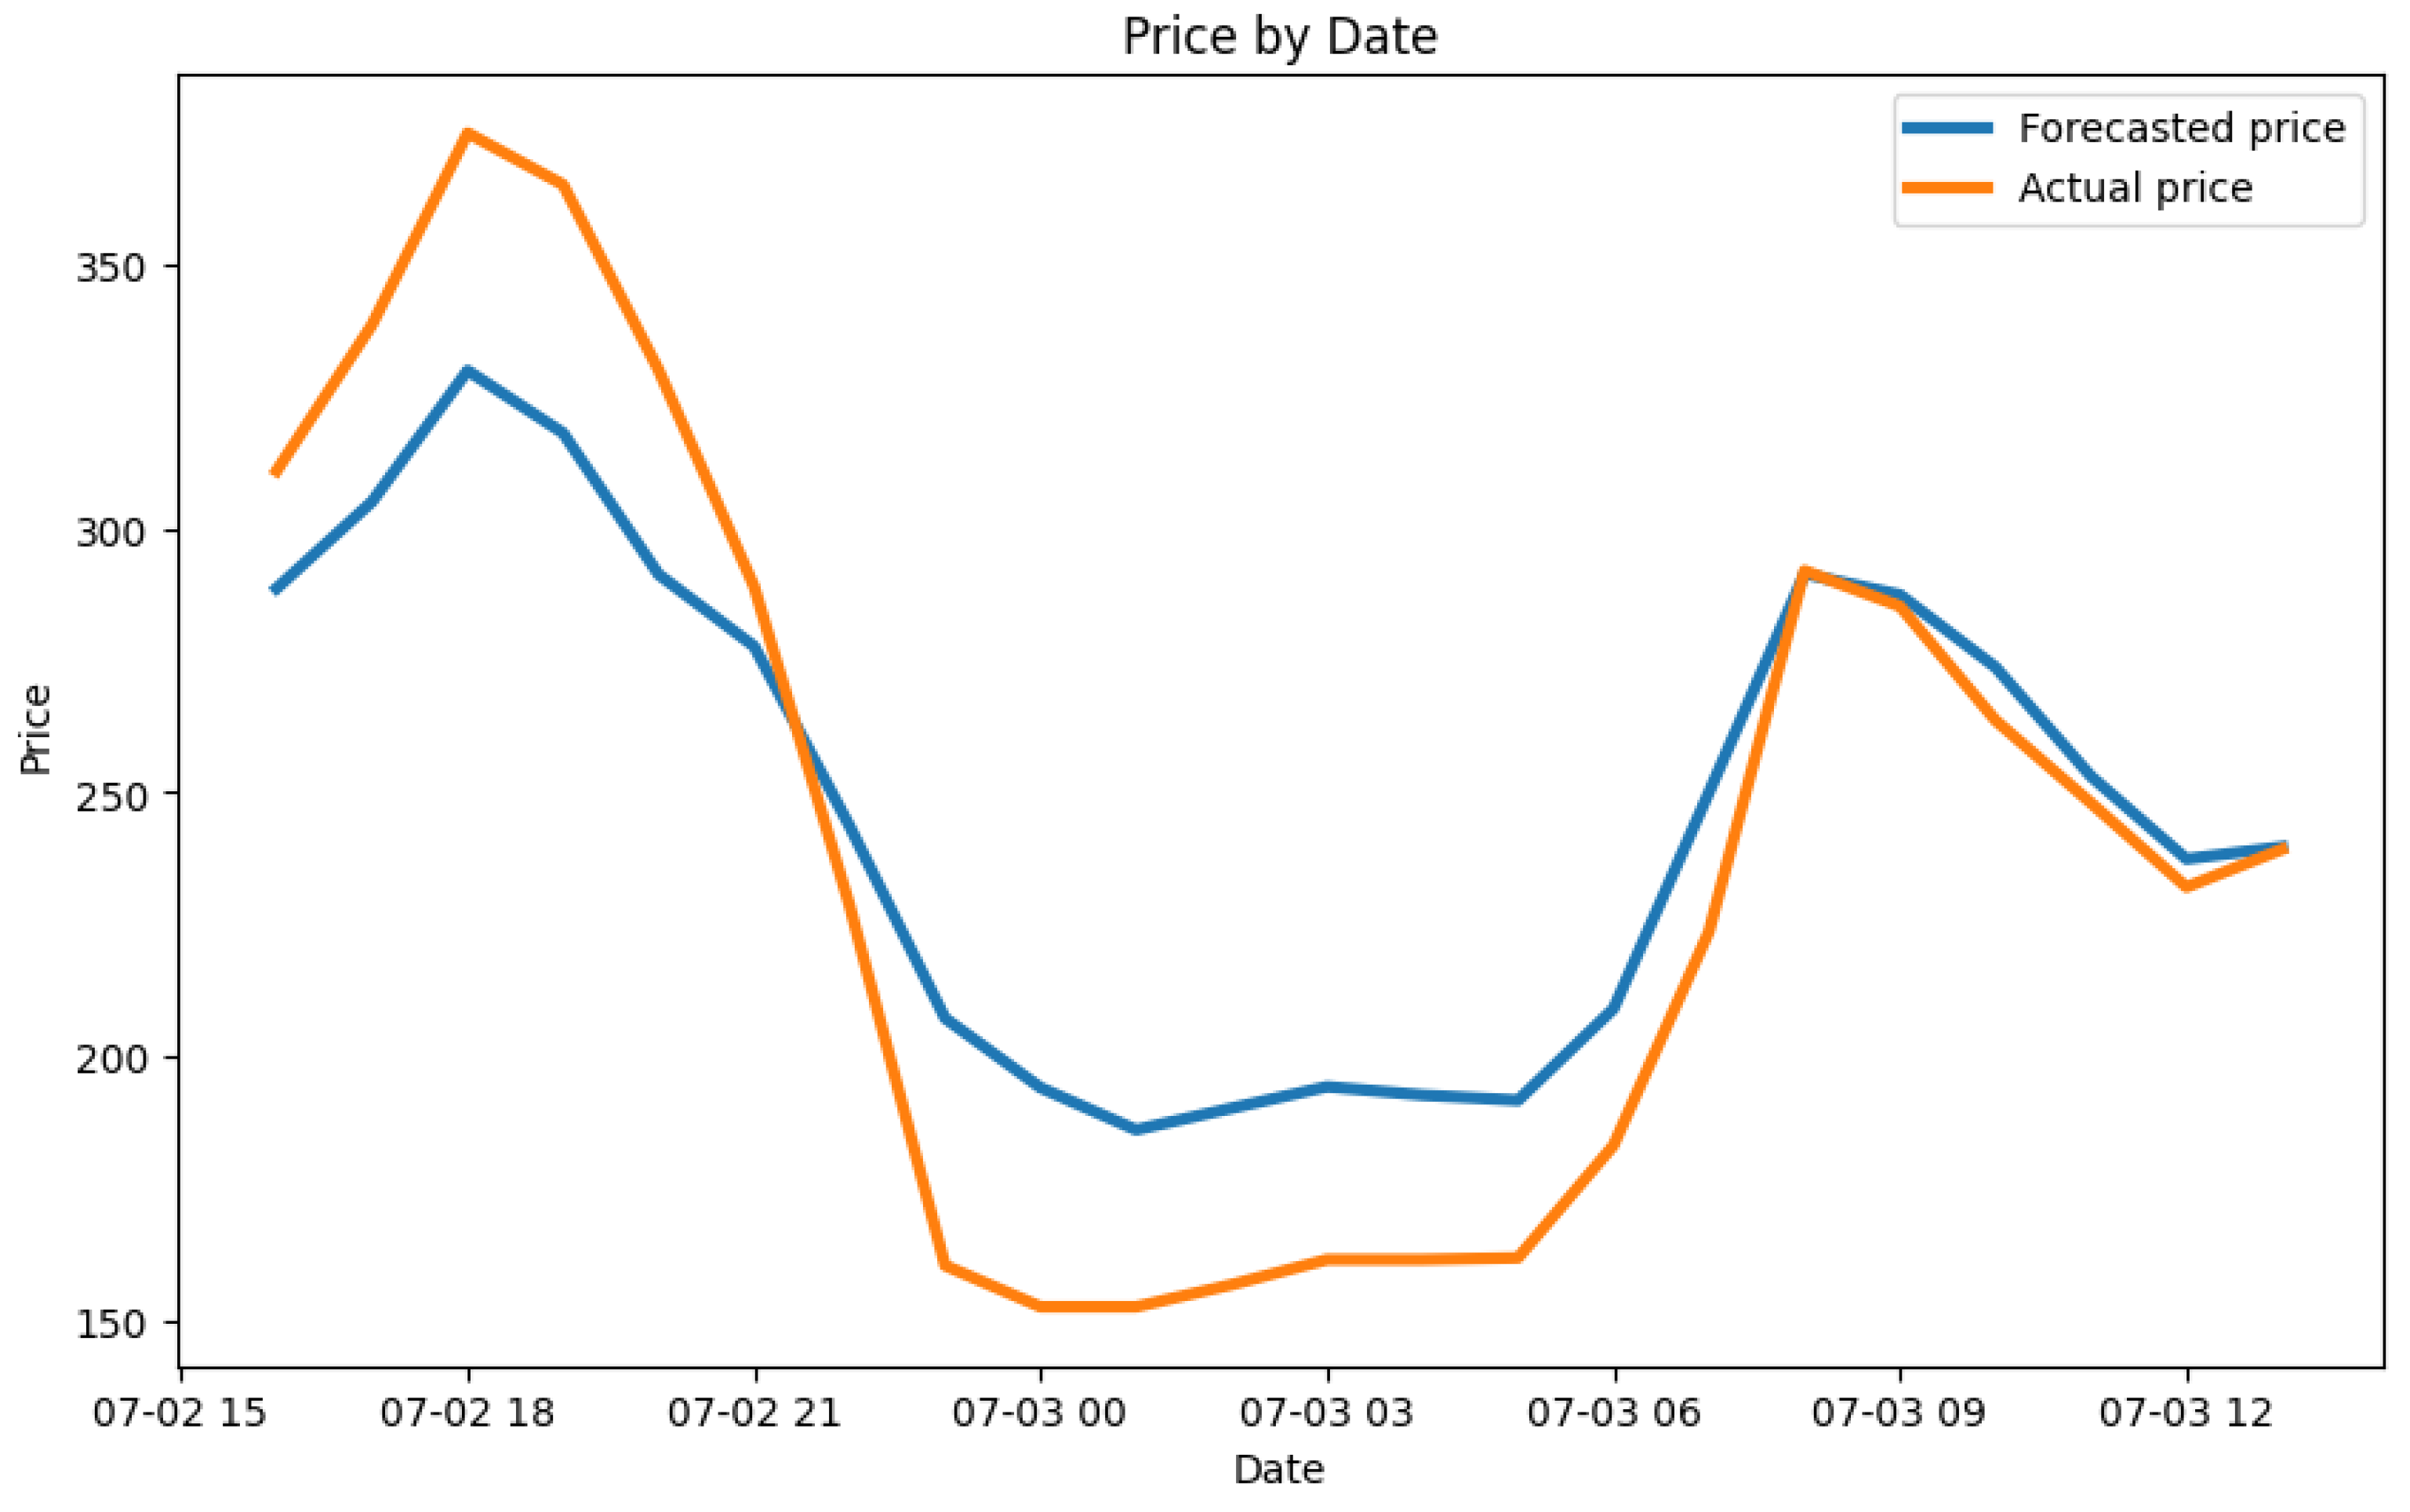
4.4.1. Energy Cost Market Forecasting

Electricity energy prices and the source mix exhibit variability and are affected by multiple features, such as the time of the day and the time of the year. Synchronizing high-energy demanding production tasks with high renewable energy availability periods is of the upmost importance for sustainable industrial production. Figure 10 presents a typical monthly and intraday electricity production variability [115]. The high renewable production mix for a given time period also has a positive effect on the electricity market prices. To achieve sustainability, the variability of energy production and electricity market prices should be incorporated in the production scheduling process [116].
A day-ahead electricity market price forecaster was developed in the context of our work with the EnerMan project. The forecasting module incorporates multiple algorithms and supports multiple energy markets. For each market, it uses information from the aspects that effect market price settlement as the input. The first aspect is the estimation of the electricity production, which uses historical production prediction and the realized production, the published energy production estimations, and the connected energy markets predictions, if available. The second aspect is the estimation of the electricity demand, which uses historical consumption prediction and the realized consumption, the published energy demand, up and down reserves, and connected energy markets predictions, if available. The first two aspects represent the positive or negative direction of the price, due to surplus or a shortage in the availability of energy. The third aspect relates to the historical predictions and the realized system marginal prices of the current and connected markets, if available. The final aspect relates to weather and miscellaneous data, such as temperature, wind speed and solar radiation, which effect renewable electricity production, and the working days and year period, which affects demand.
For electricity market-related information, we used publicly available data from ENTSO-e [117] since 1 January 2018 as the input. To stabilize the prediction, we used, as additional information for each entry of the dataset for the System Marginal Price (SMP), the SMP price that had occurred 24 h, 48 h and 168 h before, as well as the average SMP price for the previous 7 days. This addition creates a rolling time window that correlates each SMP entry in the short-term (24 and 48 h entries) with the medium term (168 h) behavior of the market. Figure 11 presents the importance of the features used for the prediction of the electricity market prices. It can be observed that, due to the current variability in the behavior of the energy market participants, the most important feature components are the SMP price that occurred 24 h before and the mean SMP of the previous 7 days; these were not the most significant components if the same forecasting algorithms were used when the energy market was more stable, some years ago. The natural gas market price (TTF) is the third most important feature, and, due to high volatility, has effected electricity market prices; this is because natural gas is used for electricity production.
Details on the forecasting algorithms used to create a hybrid ensemble prediction model that exhibits a more robust performance compared to individual forecasting algorithms is presented in [118]. The individual forecasting algorithms that were used included regression methods (OLS, Ridge, Lasso), tree-based methods (Random Forest) and RNN (LSTM). Figure 12 shows an example of the predicted SMP versus the actual realized values for the Irish electricity market.

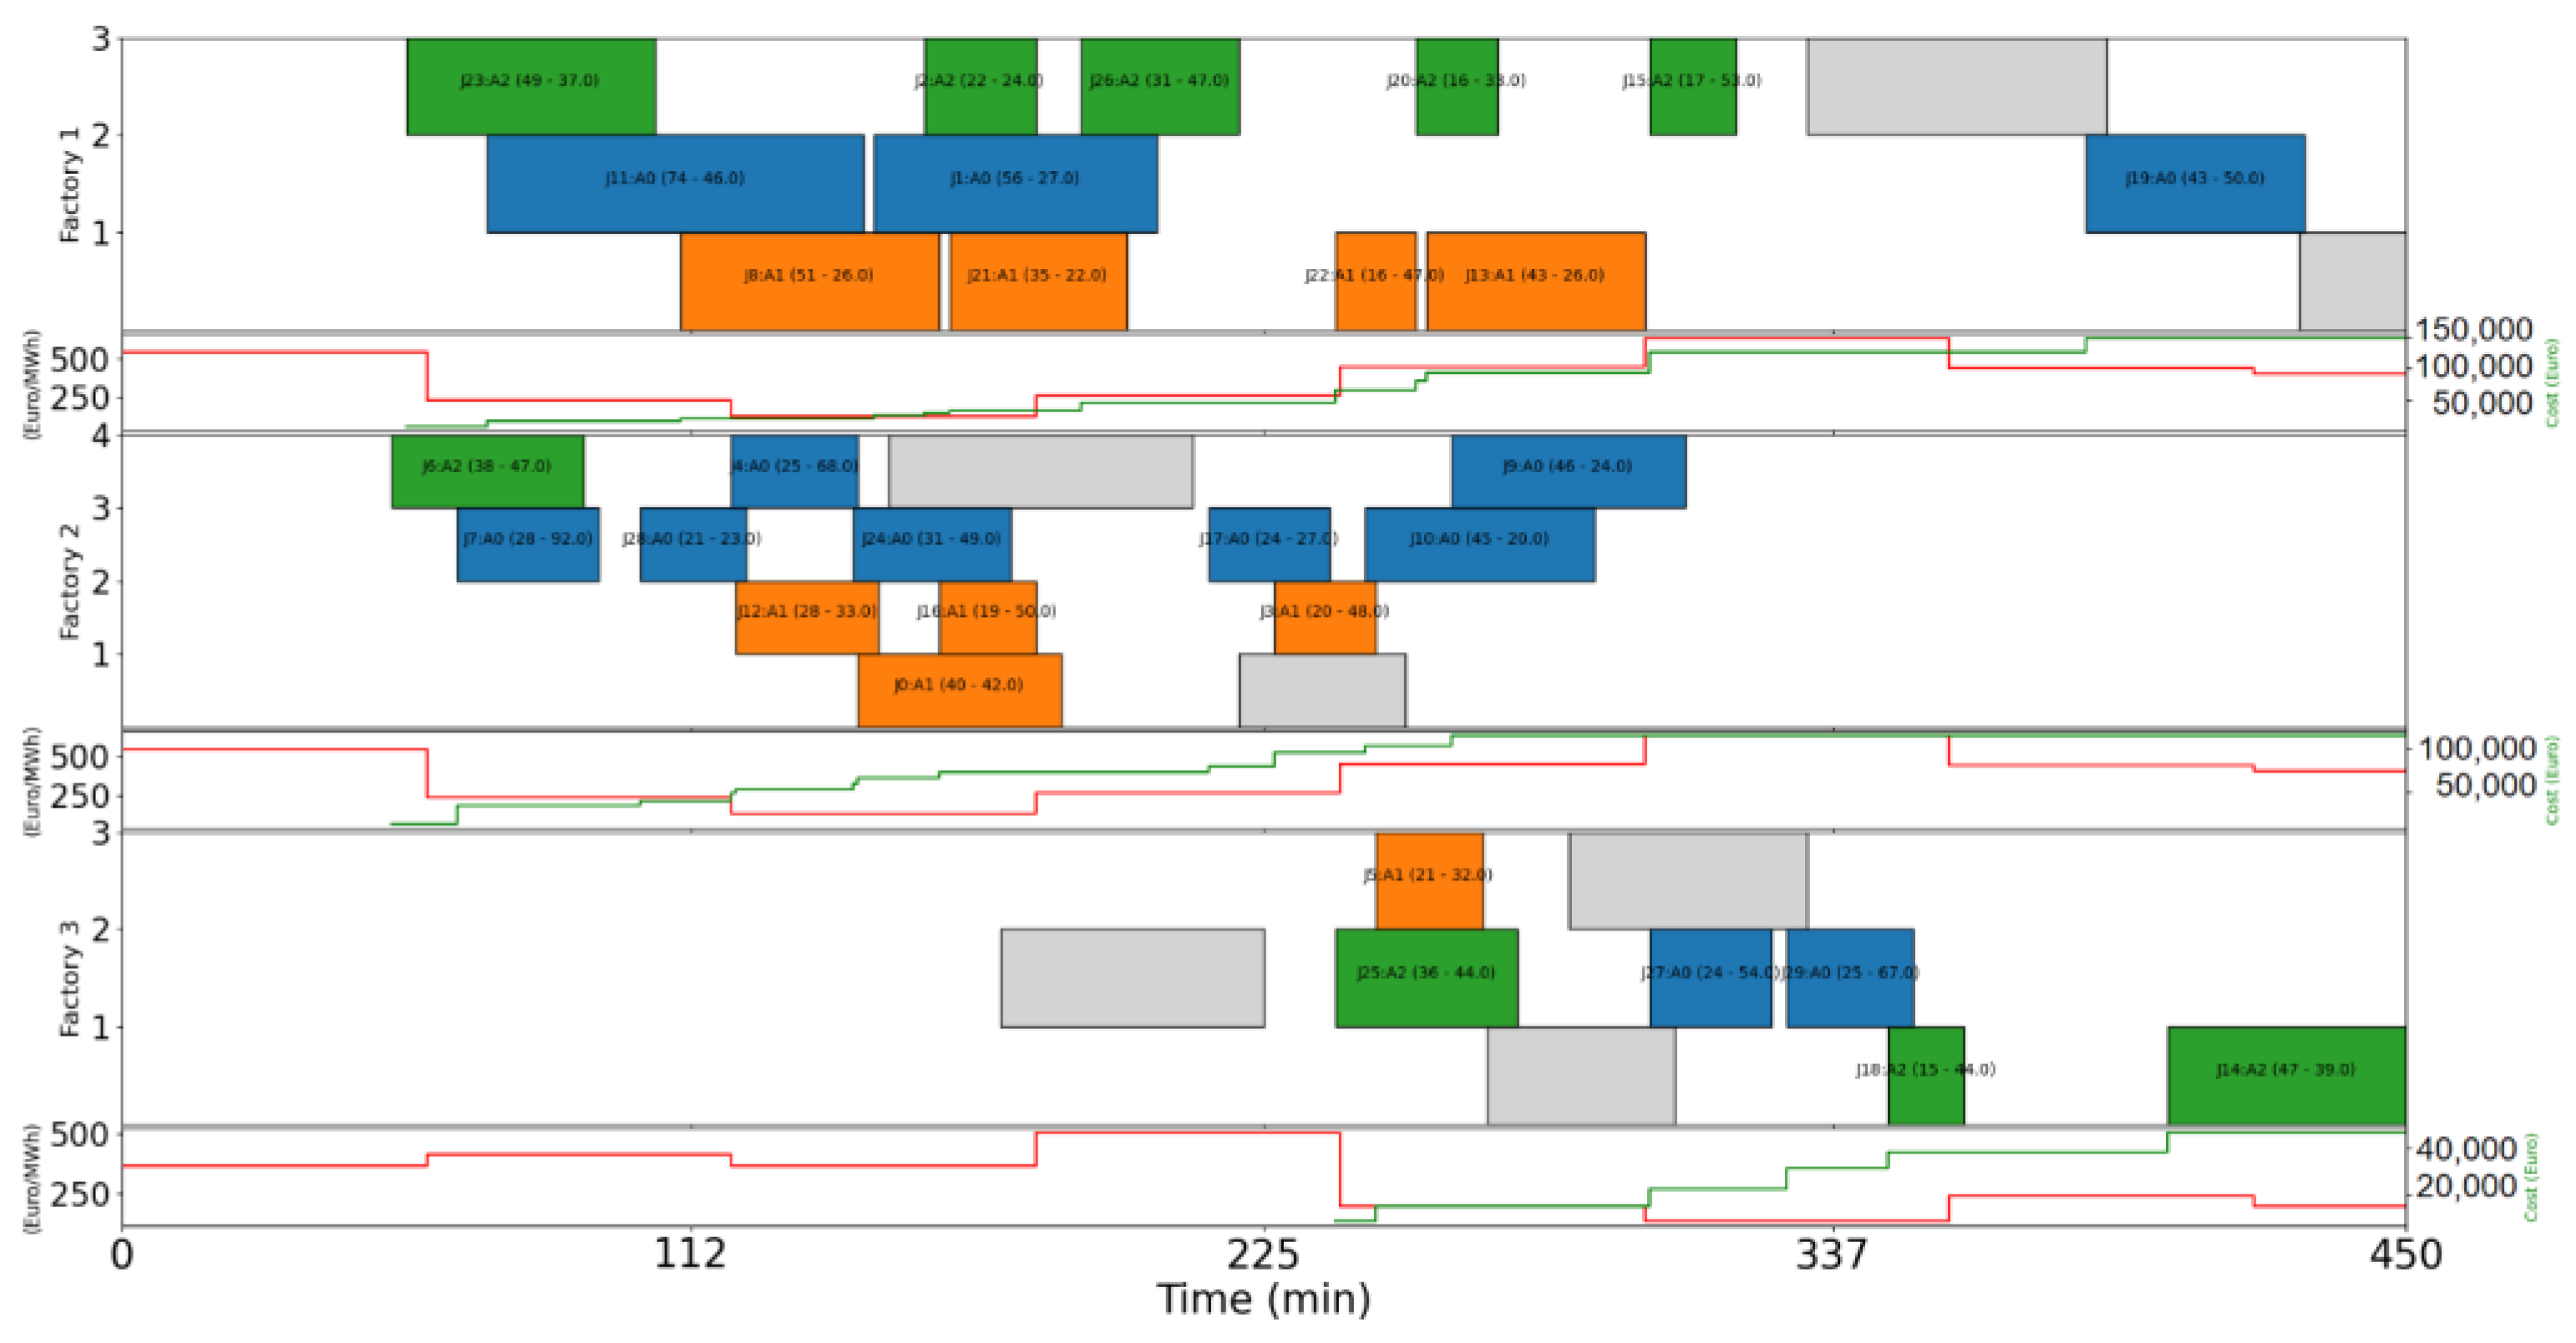
4.4.2. Energy Cost Aware Production Scheduling

Industrial sustainability and Consumer Environmental Awareness (CEA) requires that changes in the production process of energy-intensive manufacturers should urgently be implemented to reduce energy costs and the carbon footprint, driven by concerns related to climate change. As described in Section 4, a hierarchical decision-making process should be realized in order to create an energy-sustainable environment that takes into account multiple aspects. Cost components, such as energy and gas emission tariffs, intertwine with product orders, the supply chain, maintenance and personnel availability, in order to create a unique planning and scheduling problem.
Recently, a number of related research projects and relevant publications have been conducted and produced. As production scheduling is computationally demanding and solution quality is sensitive to data availability and credibility, solutions that involve multiple parties and roles are proposed. A collaboration framework between industrial enterprises and energy providers is proposed in [116]. With CEA as the primary consideration, several mathematical models are developed in [119], in order to improve energy efficiency that supports self, and shared and guaranteed savings between collaborating enterprises. A Decision Support System (DSS), which implemented energy-aware hierarchical optimization using an Iterated Local Search algorithm, was implemented in the FP7 ARTISAN project [120]. Stochasticity due to machine breakdowns was resolved using an energy-aware rescheduling method proposed in [121]. Integrated production scheduling, maintenance planning and energy control, using a NGSA-II multi-objective genetic algorithm and a hybrid mathematical model, is proposed in [122]. A collaborative, predictive and reactive energy-aware scheduling that uses a multi-agent architecture between production and energy systems is proposed in [123]. Finally, a multi-level Demand-Response (DR) framework for data-driven sustainable smart manufacturing is proposed in [124], which addresses DR flexibility at machine, shop-floor and factory levels. Energy price forecasts are signaled to the manufacturers and an adaptive production scheduling approach that considers the power usage of manufacturers in response to time-varying energy prices is presented.
In the context of the EnerMan project, an energy-aware production scheduling toolbox is developed. The toolbox consists of interchangeable and/or collaborating algorithms that share a common problem and solution representation. The developed algorithms span from heuristic ones, which exhibit extremely fast solution times and scalability; this sacrifices solution quality for an exact constraint programming model that, given enough time, can generate proven optimal solutions [125]. All developed algorithms use, as a data model, the product–workshop–resource model described in Section 4.1.2, and are able to solve a weighted multi-objective optimization model. For each problem, a number of jobs, which follow some production process, are given along with the forecasted prices described in the previous section. The optimization algorithms can generate several scheduling solutions that optimize different sustainability-related objectives (such as consumed energy, cost, CO2 emission etc.); at the end, users may select the most appropriate one to be realized.
Let J = {1, 2, …, n} be a number of jobs, F = {1,2,…,f} be a number of factories, Mf = {1, 2, …, mf} be the set of the heterogeneous machines available in each factory and M = M f be the set of all the available machines. Let i,j represent indexes of jobs, f represent the index for factories and m the index of machines. Let Pjfm and Cjfm represent the processing time and the consumed energy of each job when executed on a specific machine. Further, assume that each job can only be executed on a subset MjM. Let JmJ be the jobs that can be executed on machine m. The binary decision variable yjfm equals 1 if job j is assigned to machine m of factory f; otherwise, yjfm equals 0. Let zijfm be a binary variable that equals 1 if job i immediately precedes job j on machine m in factory f; otherwise, yjfm equals 0. Given a time horizon T where for each time period [a,b] we have forecasted the market cost of energy Mab, we create an array Ejfm for each factory f, machine m∈M and job jJm, which represents the cost for all the possible starting times of the job. Let the variables sj and ej denote the start and end time, respectively, and tj the type of job j. For each type pair ln, let Gln represent the setup time between tasks of different types, otherwise, this is 0. Finally, let L represent a very large number. The problem formulation supports multiple objectives, for example, if we want to minimize the total consumption, the objective can be formulates as follows:
min j J , m M , f F y j f m C j f m
If we want to minimize the total energy cost, the objective function can be written as follows:
min i T , j M t x i j E i j [ s i ]
A weighted sum combination of all the supported objectives can also be used in the current version. Multi-objective optimization algorithms will be considered as a future extension.
The constraints of a simplified mathematical optimization model can be formulated as follows:
j J , m M j y j f m = 1
f F ,   m M , i , j J m , i j ,   z i j f m + z j i f m 1
f F ,   m M , i , j J m , i j , z i j f m + z j i f m y i f m + y j f m 1
f F ,   m M , i , j J m , i j , s i + P i f m + G t i t j s j
f F ,   m M , i , j J m , i j , e i + P j f m + G t j t j e j L ( 3 y i f m + y j f m + z i j f m )
Equation (3) ensures that each task is assigned to exactly one machine. A non-overlapped in time execution sequence between two jobs i, j is imposed by (6) and (7), when they are assigned to the same machine.
Figure 13 presents a production scheduling solution example where for each period the energy cost is forecasted for each of the three collaborating factories (represented as a red line underneath each factory), and the setup costs between the consecutive tasks of different types (shown in graphical form as different colors) on the same machine are very high. The optimization algorithm created a solution that was considered cost optimal, implicitly clustering tasks of the same type, while still taking into account all other constraints and the energy cost variability.

5. Conclusions

In recent years, the use of energy in production is an important activity. The presentations in this paper show very clearly that the solutions cannot be achieved through individual activities, but that different aspects must be brought together. Especially for the modelling and simulation of the impacts (environment, costs), different methods have to be integrated, which include the hierarchical description of the whole system, the interactions between the product and the production system, as well as the cost-technical considerations. The presented framework now shows the possibilities of how companies might systematically implement this. In the context of the H2020-project EnerMan, the implementation of this is currently taking place.

Author Contributions

The conceptualization of the paper was performed by P.H. and D.L. All authors contributed to Section 1 (Instruction) and Section 2 (Background). P.H., D.L. and P.K. contributed mainly to Section 3 (Framework) and Section 4.1 (Hierarchical System Modelling). S.P., F.V. and A.R. prepared mainly Section 4.2 (Graph-Based Representation). O.P. and R.D., main contribution is in Section 4.3 (Ontological View). P.A., M.B. and A.B., main contribution is in Section 4.4 (Cost Digital Twin Energy). The work after was completed collaboratively, with all authors participating in the various stages of creation and internal review. All authors have read and agreed to the published version of the manuscript.

Funding

This research was funded by the European Union’s Horizon 2020 Research and Innovation Programme under Grant Agreement No. 958478.

Data Availability Statement

Not applicable.

Conflicts of Interest

The authors declare no conflict of interest.

References

  1. Mechatronic Futures; Hehenberger, P.; Bradley, D. (Eds.) Springer International Publishing: Cham, Switzerland, 2016; ISBN 978-3-319-32154-7. [Google Scholar]
  2. Porter, M.E.; Heppelmann, J.E. How Smart, Connected Products Are Transforming Competition. Harv. Bus. Rev. 2014, 92, 64–89. [Google Scholar]
  3. Porter, M.E.; Heppelmann, J.E. How Smart, Connected Products Are Transforming Companies. Harv. Bus. Rev. 2015, 93, 96–114. [Google Scholar]
  4. Rödger, J.-M.; Beier, J.; Schönemann, M.; Schulze, C.; Thiede, S.; Bey, N.; Herrmann, C.; Hauschild, M.Z. Combining Life Cycle Assessment and Manufacturing System Simulation: Evaluating Dynamic Impacts from Renewable Energy Supply on Product-Specific Environmental Footprints. Int. J. Precis. Eng. Manuf.-Green Technol. 2021, 8, 1007–1026. [Google Scholar] [CrossRef]
  5. Katrakazas, P.; Costantino, M.; Magnea, F.; Moore, L.; Ismail, A.; Bourithis, E.; Taşkın, H.B.; Özen, Z.T.; Sarı, İ.A.; Pissaridi, K.; et al. An Equifinality Energy Management Framework in Terms of Benchmarking Practices and Expectations: The EnerMan Project Outlook. Systems 2021, 10, 2. [Google Scholar] [CrossRef]
  6. Blessing, L.T.M.; Chakrabarti, A. DRM, a Design Research Methodology; Springer: London, UK, 2009; ISBN 978-1-84882-586-4. [Google Scholar]
  7. Rosen, M.A. Energy Sustainability: A Pragmatic Approach and Illustrations. Sustainability 2009, 1, 55–80. [Google Scholar] [CrossRef]
  8. Purvis, B.; Mao, Y.; Robinson, D. Three Pillars of Sustainability: In Search of Conceptual Origins. Sustain. Sci. 2019, 14, 681–695. [Google Scholar] [CrossRef]
  9. Thomas, K.D. Handbook of Research on Sustainable Development and Economics; IGI Global: Hershey, PA, USA, 2015. [Google Scholar]
  10. Duflou, J.R.; Sutherland, J.W.; Dornfeld, D.; Herrmann, C.; Jeswiet, J.; Kara, S.; Hauschild, M.; Kellens, K. Towards Energy and Resource Efficient Manufacturing: A Processes and Systems Approach. CIRP Ann. 2012, 61, 587–609. [Google Scholar] [CrossRef]
  11. Voorspools, K. Sustainability of the Future; Rethinking the Fundamentals of Energy Research. Renew. Sustain. Energy Rev. 2004, 8, 599–608. [Google Scholar] [CrossRef]
  12. Kutscher, C.F.; Milford, J.B.; Kreith, F. Principles of Sustainable Energy Systems, 3rd ed.; Energy Systems; CRC Press: Boca Raton, FL, USA, 2019; p. 655. [Google Scholar]
  13. Li, W.; Fan, S. Radiative Cooling: Harvesting the Coldness of the Universe. Opt. Photonics News 2019, 30, 32–39. [Google Scholar] [CrossRef]
  14. Raman, A.P.; Anoma, M.A.; Zhu, L.; Rephaeli, E.; Fan, S. Passive Radiative Cooling below Ambient Air Temperature under Direct Sunlight. Nature 2014, 515, 540–544. [Google Scholar] [CrossRef]
  15. Lingmin, C.; Jiekang, W.; Fan, W.; Huiling, T.; Changjie, L.; Yan, X. Energy Flow Optimization Method for Multi-Energy System Oriented to Combined Cooling, Heating and Power. Energy 2020, 211, 118536. [Google Scholar] [CrossRef]
  16. Afgan, N.H.; Carvalho, M.G.; Hovanov, N.V. Energy System Assessment with Sustainability Indicators. Energy Policy 2000, 28, 603–612. [Google Scholar] [CrossRef]
  17. Moldavska, A.; Welo, T. A Holistic Approach to Corporate Sustainability Assessment: Incorporating Sustainable Development Goals into Sustainable Manufacturing Performance Evaluation. J. Manuf. Syst. 2019, 50, 53–68. [Google Scholar] [CrossRef]
  18. Unver, U.; Kara, O. Energy Efficiency by Determining the Production Process with the Lowest Energy Consumption in a Steel Forging Facility. J. Clean. Prod. 2019, 215, 1362–1370. [Google Scholar] [CrossRef]
  19. Boyd, G.; Dutrow, E.; Tunnessen, W. The Evolution of the ENERGY STAR® Energy Performance Indicator for Benchmarking Industrial Plant Manufacturing Energy Use. J. Clean. Prod. 2008, 16, 709–715. [Google Scholar] [CrossRef]
  20. Salonitis, K.; Ball, P. Energy Efficient Manufacturing from Machine Tools to Manufacturing Systems. Procedia CIRP 2013, 7, 634–639. [Google Scholar] [CrossRef]
  21. Cai, W.; Lai, K. Sustainability Assessment of Mechanical Manufacturing Systems in the Industrial Sector. Renew. Sustain. Energy Rev. 2021, 135, 110169. [Google Scholar] [CrossRef]
  22. ISO ISO 14955-1; 2017 Machine Tools—Environmental Evaluation of Machine Tools—Part 1: Design Methodology for Energy-Efficient Machine Tools. ISO: Geneva, Switzerland, 2017.
  23. ISO ISO 50006; 2014 Energy Management Systems—Measuring Energy Performance Using Energy Baselines (EnB) and Energy Performance Indicators (EnPI)—General Principles and Guidance. ISO: Geneva, Switzerland, 2014.
  24. Suganthi, L. Sustainability Indices for Energy Utilization Using a Multi-Criteria Decision Model. Energy Sustain. Soc. 2020, 10, 16. [Google Scholar] [CrossRef]
  25. Iacovidou, E.; Busch, J.; Hahladakis, J.N.; Baxter, H.; Ng, K.S.; Herbert, B.M.J. A Parameter Selection Framework for Sustainability Assessment. Sustainability 2017, 9, 1497. [Google Scholar] [CrossRef]
  26. Lee, Y.T.; Kumaraguru, S.; Jain, S.; Robinson, S.; Helu, M.; Hatim, Q.Y.; Rachuri, S.; Dornfeld, D.; Saldana, C.J.; Kumara, S. A Classification Scheme for Smart Manufacturing Systems’ Performance Metrics. Smart Sustain. Manuf. Syst. 2017, 1, 52–74. [Google Scholar] [CrossRef]
  27. Schianetz, K.; Kavanagh, L. Sustainability Indicators for Tourism Destinations: A Complex Adaptive Systems Approach Using Systemic Indicator Systems. J. Sustain. Tour. 2008, 16, 601–628. [Google Scholar] [CrossRef]
  28. Mejia, C.; Kajikawa, Y. The Academic Landscapes of Manufacturing Enterprise Performance and Environmental Sustainability: A Study of Commonalities and Differences. Int. J. Environ. Res. Public Health 2021, 18, 3370. [Google Scholar] [CrossRef] [PubMed]
  29. Bullard, C.W.; Penner, P.S.; Pilati, D.A. Net Energy Analysis: Handbook for Combining Process and Input-Output Analysis. Resour. Energy 1978, 1, 267–313. [Google Scholar] [CrossRef]
  30. Crawford, R.H.; Bontinck, P.-A.; Stephan, A.; Wiedmann, T.; Yu, M. Hybrid Life Cycle Inventory Methods—A Review. J. Clean. Prod. 2018, 172, 1273–1288. [Google Scholar] [CrossRef]
  31. Collinge, W.O.; Landis, A.E.; Jones, A.K.; Schaefer, L.A.; Bilec, M.M. Dynamic Life Cycle Assessment: Framework and Application to an Institutional Building. Int. J. Life Cycle Assess. 2013, 18, 538–552. [Google Scholar] [CrossRef]
  32. Frischknecht, R.; Wyss, F.; Büsser Knöpfel, S.; Lützkendorf, T.; Balouktsi, M. Cumulative Energy Demand in LCA: The Energy Harvested Approach. Int. J. Life Cycle Assess. 2015, 20, 957–969. [Google Scholar] [CrossRef]
  33. Martinez-Pabon, M.; Eveleigh, T.; Tanju, B. Optimizing Residential Energy Management Using an Autonomous Scheduler System. Expert Syst. Appl. 2018, 96, 373–387. [Google Scholar] [CrossRef]
  34. Beaudin, M.; Zareipour, H. Home Energy Management Systems: A Review of Modelling and Complexity. In Energy Solutions to Combat Global Warming; Zhang, X., Dincer, I., Eds.; Lecture Notes in Energy; Springer International Publishing: Cham, Switzerland, 2017; pp. 753–793. ISBN 978-3-319-26950-4. [Google Scholar]
  35. Agostinelli, S.; Cumo, F.; Guidi, G.; Tomazzoli, C. Cyber-Physical Systems Improving Building Energy Management: Digital Twin and Artificial Intelligence. Energies 2021, 14, 2338. [Google Scholar] [CrossRef]
  36. Roe, C.; Meliopoulos, S.; Entriken, R.; Chhaya, S. Simulated Demand Response of a Residential Energy Management System. In Proceedings of the IEEE 2011 EnergyTech, Cleveland, OH, USA, 25–26 May 2011; pp. 1–6. [Google Scholar]
  37. Infield, D.G.; Short, J.; Horne, C.; Freris, L.L. Potential for Domestic Dynamic Demand-Side Management in the UK. In Proceedings of the 2007 IEEE Power Engineering Society General Meeting, Tampa, FL, USA, 24–28 June 2007; pp. 1–6. [Google Scholar]
  38. Erol-Kantarci, M.; Mouftah, H.T. Wireless Sensor Networks for Cost-Efficient Residential Energy Management in the Smart Grid. IEEE Trans. Smart Grid 2011, 2, 314–325. [Google Scholar] [CrossRef]
  39. Tomazzoli, C.; Scannapieco, S.; Cristani, M. Internet of Things and Artificial Intelligence Enable Energy Efficiency. J. Ambient. Intell. Humaniz. Comput. 2020. [Google Scholar] [CrossRef]
  40. Leherbauer, D.; Hehenberger, P. Modeling the Energy Flexible Job Shop with a Disaggregated Load Approach for Changeable Manufacturing. Procedia Comput. Sci. 2023, 217, 1225–1233. [Google Scholar] [CrossRef]
  41. Clarke, J.A.; Cockroft, J.; Conner, S.; Hand, J.W.; Kelly, N.J.; Moore, R.; O’Brien, T.; Strachan, P. Simulation-Assisted Control in Building Energy Management Systems. Energy Build. 2002, 34, 933–940. [Google Scholar] [CrossRef]
  42. Sassanelli, C.; Arriga, T.; Zanin, S.; D’Adamo, I.; Terzi, S. Industry 4.0 Driven Result-Oriented PSS: An Assessment in the Energy Management. Int. J. Energy Econ. Policy 2022, 12, 186–203. [Google Scholar] [CrossRef]
  43. Anvari-Moghaddam, A.; Monsef, H.; Rahimi-Kian, A. Cost-Effective and Comfort-Aware Residential Energy Management under Different Pricing Schemes and Weather Conditions. Energy Build. 2015, 86, 782–793. [Google Scholar] [CrossRef]
  44. Turan, E.; Konuşkan, Y.; Yıldırım, N.; Tunçalp, D.; İnan, M.; Yasin, O.; Turan, B.; Kerimoğlu, V. Digital Twin Modelling for Optimizing the Material Consumption: A Case Study on Sustainability Improvement of Thermoforming Process. Sustain. Comput. Inform. Syst. 2022, 35, 100655. [Google Scholar] [CrossRef]
  45. Grieves, M.; Vickers, J. Digital Twin: Mitigating Unpredictable, Undesirable Emergent Behavior in Complex Systems. In Transdisciplinary Perspectives on Complex Systems: New Findings and Approaches; Kahlen, F.-J., Flumerfelt, S., Alves, A., Eds.; Springer International Publishing: Cham, Switzerland, 2017; pp. 85–113. ISBN 978-3-319-38756-7. [Google Scholar]
  46. Shafto, M.; Conroy, M.; Doyle, R.; Glaessgen, E.; Kemp, C.; LeMoigne, J.; Wang, L. DRAFT Modeling, Simulation, Information Technology & Processing Roadmap: Technology Area 11; National Aeronautics and Space Administration: Washington, DC, USA, 2010. [Google Scholar]
  47. Caputo, F.; Greco, A.; Fera, M.; Macchiaroli, R. Digital Twins to Enhance the Integration of Ergonomics in the Workplace Design. Int. J. Ind. Ergon. 2019, 71, 20–31. [Google Scholar] [CrossRef]
  48. Liu, Q.; Zhang, H.; Leng, J.; Chen, X. Digital Twin-Driven Rapid Individualised Designing of Automated Flow-Shop Manufacturing System. Int. J. Prod. Res. 2019, 57, 3903–3919. [Google Scholar] [CrossRef]
  49. Tao, F.; Sui, F.; Liu, A.; Qi, Q.; Zhang, M.; Song, B.; Guo, Z.; Lu, S.C.-Y.; Nee, A.Y.C. Digital Twin-Driven Product Design Framework. Int. J. Prod. Res. 2019, 57, 3935–3953. [Google Scholar] [CrossRef]
  50. Knapp, G.L.; Mukherjee, T.; Zuback, J.S.; Wei, H.L.; Palmer, T.A.; De, A.; DebRoy, T. Building Blocks for a Digital Twin of Additive Manufacturing. Acta Mater. 2017, 135, 390–399. [Google Scholar] [CrossRef]
  51. Leng, J.; Zhang, H.; Yan, D.; Liu, Q.; Chen, X.; Zhang, D. Digital Twin-Driven Manufacturing Cyber-Physical System for Parallel Controlling of Smart Workshop. J. Ambient. Intell. Humaniz. Comput. 2019, 10, 1155–1166. [Google Scholar] [CrossRef]
  52. Malik, A.A.; Bilberg, A. Digital Twins of Human Robot Collaboration in a Production Setting. Procedia Manuf. 2018, 17, 278–285. [Google Scholar] [CrossRef]
  53. Zhao, R.; Yan, D.; Liu, Q.; Leng, J.; Wan, J.; Chen, X.; Zhang, X. Digital Twin-Driven Cyber-Physical System for Autonomously Controlling of Micro Punching System. IEEE Access 2019, 7, 9459–9469. [Google Scholar] [CrossRef]
  54. Aivaliotis, P.; Georgoulias, K.; Arkouli, Z.; Makris, S. Methodology for Enabling Digital Twin Using Advanced Physics-Based Modelling in Predictive Maintenance. Procedia CIRP 2019, 81, 417–422. [Google Scholar] [CrossRef]
  55. Magargle, R.; Johnson, L.; Mandloi, P.; Davoudabadi, P.; Kesarkar, O.; Krishnaswamy, S.; Batteh, J.; Pitchaikani, A. A Simulation-Based Digital Twin for Model-Driven Health Monitoring and Predictive Maintenance of an Automotive Braking System. In Proceedings of the 12th International Modelica Conference, Prague, Czech Republic, 15–17 May 2017. [Google Scholar]
  56. Xu, Y.; Sun, Y.; Liu, X.; Zheng, Y. A Digital-Twin-Assisted Fault Diagnosis Using Deep Transfer Learning. IEEE Access 2019, 7, 19990–19999. [Google Scholar] [CrossRef]
  57. Liu, M.; Fang, S.; Dong, H.; Xu, C. Review of Digital Twin about Concepts, Technologies, and Industrial Applications. J. Manuf. Syst. 2021, 58, 346–361. [Google Scholar] [CrossRef]
  58. Tao, F.; Zhang, H.; Liu, A.; Nee, A.Y.C. Digital Twin in Industry: State-of-the-Art. IEEE Trans. Ind. Inform. 2019, 15, 2405–2415. [Google Scholar] [CrossRef]
  59. Yildiz, E.; Møller, C.; Bilberg, A. Demonstration and Evaluation of a Digital Twin-Based Virtual Factory. Int. J. Adv. Manuf. Technol. 2021, 114, 185–203. [Google Scholar] [CrossRef]
  60. Calabuig-Moreno, R.; Temes-Cordovez, R.; Orozco-Messana, J. Neighbourhood Digital Modelling of Energy Consumption for Carbon Footprint Assessment. In Sustainability in Energy and Buildings 2021; Littlewood, J.R., Howlett, R.J., Jain, L.C., Eds.; Springer: Singapore, 2022; pp. 541–551. [Google Scholar]
  61. Barni, A.; Fontana, A.; Menato, S.; Sorlini, M.; Canetta, L. Exploiting the Digital Twin in the Assessment and Optimization of Sustainability Performances. In Proceedings of the 2018 International Conference on Intelligent Systems (IS), Funchal, Portugal, 25–27 September 2018; pp. 706–713. [Google Scholar]
  62. A European Green Deal. Available online: https://ec.europa.eu/info/strategy/priorities-2019-2024/european-green-deal_en (accessed on 26 September 2022).
  63. Ortega-Gras, J.-J.; Bueno-Delgado, M.-V.; Cañavate-Cruzado, G.; Garrido-Lova, J. Twin Transition through the Implementation of Industry 4.0 Technologies: Desk-Research Analysis and Practical Use Cases in Europe. Sustainability 2021, 13, 13601. [Google Scholar] [CrossRef]
  64. Hehenberger, P.; Habib, M.; Bradley, D. EcoMechatronics: Challenges for Evolution, Development and Sustainability, 1st ed.; 2022 edition; Springer: Berlin/Heidelberg, Germany, 2022; ISBN 978-3-031-07554-4. [Google Scholar]
  65. THE 17 GOALS | Sustainable Development. Available online: https://sdgs.un.org/goals (accessed on 26 September 2022).
  66. Hehenberger, P. Perspectives on Hierarchical Modeling in Mechatronic Design. Adv. Eng. Inform. 2014, 28, 188–197. [Google Scholar] [CrossRef]
  67. Verein Deutscher Ingenieure e.V. VDI 4605—Evaluation of Sustainability; VDI-Gesellschaft Energie und Umwelt, Beuth Verlag: Berlin, Germany, 2017. [Google Scholar]
  68. Cimino, C.; Negri, E.; Fumagalli, L. Review of Digital Twin Applications in Manufacturing. Comput. Ind. 2019, 113, 103130. [Google Scholar] [CrossRef]
  69. Kritzinger, W.; Karner, M.; Traar, G.; Henjes, J.; Sihn, W. Digital Twin in Manufacturing: A Categorical Literature Review and Classification. Ifac-PapersOnline 2018, 51, 1016–1022. [Google Scholar] [CrossRef]
  70. Xiang, F.; Zhang, Z.; Zuo, Y.; Tao, F. Digital Twin Driven Green Material Optimal-Selection towards Sustainable Manufacturing. Procedia CIRP 2019, 81, 1290–1294. [Google Scholar] [CrossRef]
  71. Lo, C.K.; Chen, C.H.; Zhong, R.Y. A Review of Digital Twin in Product Design and Development. Adv. Eng. Inform. 2021, 48, 101297. [Google Scholar] [CrossRef]
  72. Zheng, P.; Sivabalan, A.S. A Generic Tri-Model-Based Approach for Product-Level Digital Twin Development in a Smart Manufacturing Environment. Robot. Comput.-Integr. Manuf. 2020, 64, 101958. [Google Scholar] [CrossRef]
  73. Zhang, C.; Ji, W. Digital Twin-Driven Carbon Emission Prediction and Low-Carbon Control of Intelligent Manufacturing Job-Shop. Procedia CIRP 2019, 83, 624–629. [Google Scholar] [CrossRef]
  74. Bao, J.; Guo, D.; Li, J.; Zhang, J. The Modelling and Operations for the Digital Twin in the Context of Manufacturing. Enterp. Inf. Syst. 2019, 13, 534–556. [Google Scholar] [CrossRef]
  75. Armendia, M.; Cugnon, F.; Berglind, L.; Ozturk, E.; Gil, G.; Selmi, J. Evaluation of Machine Tool Digital Twin for Machining Operations in Industrial Environment. Procedia CIRP 2019, 82, 231–236. [Google Scholar] [CrossRef]
  76. Wang, X.V.; Wang, L. Digital Twin-Based WEEE Recycling, Recovery and Remanufacturing in the Background of Industry 4.0. Int. J. Prod. Res. 2019, 57, 3892–3902. [Google Scholar] [CrossRef]
  77. Lim, K.Y.H.; Zheng, P.; Chen, C.-H. A State-of-the-Art Survey of Digital Twin: Techniques, Engineering Product Lifecycle Management and Business Innovation Perspectives. J. Intell. Manuf. 2020, 31, 1313–1337. [Google Scholar] [CrossRef]
  78. Monostori, L.; Kádár, B.; Bauernhansl, T.; Kondoh, S.; Kumara, S.; Reinhart, G.; Sauer, O.; Schuh, G.; Sihn, W.; Ueda, K. Cyber-Physical Systems in Manufacturing. CIRP Ann. 2016, 65, 621–641. [Google Scholar] [CrossRef]
  79. Twin-Control: A Digital Twin Approach to Improve Machine Tools Lifecycle; Armendia, M.; Ghassempouri, M.; Ozturk, E.; Peysson, F. (Eds.) Springer Nature: Berlin/Heidelberg, Germany, 2019. [Google Scholar]
  80. Graßl, M. Bewertung der Energieflexibilität in der Produktion; Forschungsberichte IWB; Utz: München, Germany, 2015. [Google Scholar]
  81. Wiendahl, H.-P.; ElMaraghy, H.A.; Nyhuis, P.; Zäh, M.F.; Wiendahl, H.-H.; Duffie, N.; Brieke, M. Changeable Manufacturing—Classification, Design and Operation. CIRP Ann. 2007, 56, 783–809. [Google Scholar] [CrossRef]
  82. Liebl, C. Systematische Energiedatenerfassung in der Produktion; TU München: München, Germany, 2019. [Google Scholar]
  83. Bondy, A.; Murty, U.S.R. Graph Theory; Springer: Berlin/Heidelberg, Germany, 2008; ISBN 978-1-84996-690-0. [Google Scholar]
  84. Deo, N. Graph Theory with Applications to Engineering and Computer Science, 1st ed.; Dover Publications: Mineola, NY, USA, 2011; ISBN 978-0-486-80793-5. [Google Scholar]
  85. Sassanelli, C.; Rossi, M.; Terzi, S. Evaluating the Smart Maturity of Manufacturing Companies along the Product Development Process to Set a PLM Project Roadmap. Int. J. Prod. Lifecycle Manag. 2020, 12, 185–209. [Google Scholar] [CrossRef]
  86. Porter, M.E.; Heppelmann, J.E. The Operations and Organizational Structure of FIrms Are Being Radically Reshaped by Products’ Evolution into Intelligent, Connected Devices. Harv. Bus. Rev. 2015, 93, 96–114. [Google Scholar]
  87. Uschold, M.; Grüninger, M. Ontologies: Principles, Methods and Applications. Knowl. Eng. Rev. 1996, 11, 93–136. [Google Scholar] [CrossRef]
  88. Küçük, D.; Küçük, D. OntoWind: An Improved and Extended Wind Energy Ontology. arXiv 2018, arXiv:1803.02808 [cs]. [Google Scholar]
  89. Steinmetz, C.; Rettberg, A.; Ribeiro, F.G.C.; Schroeder, G.; Pereira, C.E. Internet of Things Ontology for Digital Twin in Cyber Physical Systems. In Proceedings of the 2018 VIII Brazilian Symposium on Computing Systems Engineering (SBESC), Salvador, Brazil, 5–8 November 2018; pp. 154–159. [Google Scholar]
  90. Ali, N.; Hong, J.-E. Failure Detection and Prevention for Cyber-Physical Systems Using Ontology-Based Knowledge Base. Computers 2018, 7, 68. [Google Scholar] [CrossRef]
  91. Kontopoulos, E.; Martinopoulos, G.; Lazarou, D.; Bassiliades, N. An Ontology-Based Decision Support Tool for Optimizing Domestic Solar Hot Water System Selection. J. Clean. Prod. 2016, 112, 4636–4646. [Google Scholar] [CrossRef]
  92. Sayah, Z.; Kazar, O.; Lejdel, B.; Laouid, A.; Ghenabzia, A. An Intelligent System for Energy Management in Smart Cities Based on Big Data and Ontology. Smart Sustain. Built Environ. 2021, 10, 169–192. [Google Scholar] [CrossRef]
  93. Corry, E.; Pauwels, P.; Hu, S.; Keane, M.; O’Donnell, J. A Performance Assessment Ontology for the Environmental and Energy Management of Buildings. Autom. Constr. 2015, 57, 249–259. [Google Scholar] [CrossRef]
  94. Bonino, D.; Corno, F.; De Russis, L. PowerOnt: An Ontology-Based Approach for Power Consumption Estimation in Smart Homes. In Internet of Things. User-Centric IoT; Giaffreda, R., Vieriu, R.-L., Pasher, E., Bendersky, G., Jara, A.J., Rodrigues, J.J.P.C., Dekel, E., Mandler, B., Eds.; Springer International Publishing: Cham, Switzerland, 2015; pp. 3–8. [Google Scholar]
  95. Li, Y.; García-Castro, R.; Mihindukulasooriya, N.; O’Donnell, J.; Vega-Sánchez, S. Enhancing Energy Management at District and Building Levels via an EM-KPI Ontology. Autom. Constr. 2019, 99, 152–167. [Google Scholar] [CrossRef]
  96. Tomašević, N.M.; Batić, M.Č.; Blanes, L.M.; Keane, M.M.; Vraneš, S. Ontology-Based Facility Data Model for Energy Management. Adv. Eng. Inform. 2015, 29, 971–984. [Google Scholar] [CrossRef]
  97. Milis, G.M.; Panayiotou, C.G.; Polycarpou, M.M. SEMIoTICS: Semantically Enhanced IoT-Enabled Intelligent Control Systems. IEEE Internet Things J. 2019, 6, 1257–1266. [Google Scholar] [CrossRef]
  98. Delabeye, R.; Penas, O.; Plateaux, R. Scalable Ontology-Based V&V Process for Heterogeneous Systems and Applications. In Proceedings of the ACM/IEEE 25th International Conference on Model Driven Engineering Languages and Systems, Montreal, QC, Canada, 16–21 October 2022. [Google Scholar]
  99. Cuenca, J.; Larrinaga, F.; Curry, E. A Unified Semantic Ontology for Energy Management Applications. In Proceedings of the WSP/WOMoCoE@ ISWC, Vienna, Austria, 22 October 2017. [Google Scholar]
  100. Wicaksono, H.; Jost, F.; Rogalski, S.; Ovtcharova, J. Energy Efficiency Evaluation in Manufacturing Through an Ontology-Represented Knowledge Base. Intell. Syst. Account. Financ. Manag. 2014, 21, 59–69. [Google Scholar] [CrossRef]
  101. Borsato, M. Bridging the Gap between Product Lifecycle Management and Sustainability in Manufacturing through Ontology Building. Comput. Ind. 2014, 65, 258–269. [Google Scholar] [CrossRef]
  102. Gagliardo, S.; Giannini, F.; Monti, M.; Pedrielli, G.; Terkaj, W.; Sacco, M.; Ghellere, M.; Salamone, F. An Ontology-Based Framework for Sustainable Factories. Comput.-Aided Des. Appl. 2015, 12, 198–207. [Google Scholar] [CrossRef]
  103. Giovannini, A.; Aubry, A.; Panetto, H.; Dassisti, M.; El Haouzi, H. Ontology-Based System for Supporting Manufacturing Sustainability. Annu. Rev. Control 2012, 36, 309–317. [Google Scholar] [CrossRef]
  104. Baader, F. Ontology-Based Monitoring of Dynamic Systems. In Proceedings of the Fourteenth International Conference on the Principles of Knowledge Representation and Reasoning, Vienna, Austria, 4 May 2014. [Google Scholar]
  105. Cao, Q.; Zanni-Merk, C.; Reich, C. Ontologies for Manufacturing Process Modeling: A Survey; Springer International Publishing: Cham, Switzerland, 2018. [Google Scholar]
  106. Nuñez, D.L.; Borsato, M. OntoProg: An Ontology-Based Model for Implementing Prognostics Health Management in Mechanical Machines. Adv. Eng. Inform. 2018, 38, 746–759. [Google Scholar] [CrossRef]
  107. Compton, M.; Barnaghi, P.; Bermudez, L.; García-Castro, R.; Corcho, O.; Cox, S.; Graybeal, J.; Hauswirth, M.; Henson, C.; Herzog, A.; et al. The SSN Ontology of the W3C Semantic Sensor Network Incubator Group. J. Web Semant. 2012, 17, 25–32. [Google Scholar] [CrossRef]
  108. Panetto, H.; Dassisti, M.; Tursi, A. ONTO-PDM: Product-Driven ONTOlogy for Product Data Management Interoperability within Manufacturing Process Environment. Adv. Eng. Inform. 2012, 26, 334–348. [Google Scholar] [CrossRef]
  109. Lemaignan, S.; Siadat, A.; Dantan, J.-Y.; Semenenko, A. MASON: A Proposal for an Ontology of Manufacturing Domain. In Proceedings of the IEEE Workshop on Distributed Intelligent Systems: Collective Intelligence and Its Applications (DIS’06), IEEE, Prague, Czech Republic, 15–16 June 2006; pp. 195–200. [Google Scholar]
  110. Ramírez-Durán, V.J.; Berges, I.; Illarramendi, A. ExtruOnt: An Ontology for Describing a Type of Manufacturing Machine for Industry 4.0 Systems. Semant. Web 2020, 11, 887–909. [Google Scholar] [CrossRef]
  111. Janowicz, K.; Haller, A.; Cox, S.J.D.; Le Phuoc, D.; Lefrançois, M. SOSA: A Lightweight Ontology for Sensors, Observations, Samples, and Actuators. J. Web Semant. 2019, 56, 1–10. [Google Scholar] [CrossRef]
  112. Haller, A.; Janowicz, K.; Cox, S.; Lefrançois, M.; Taylor, K.; Le Phuoc, D.; Lieberman, J.; García-Castro, R.; Atkinson, R.; Stadler, C. The Modular SSN Ontology: A Joint W3C and OGC Standard Specifying the Semantics of Sensors, Observations, Sampling, and Actuation. Semant. Web–Interoperability Usability Appl. 2018, 10, 9–32. [Google Scholar] [CrossRef]
  113. de Roode, M.; Fernández-Izquierdo, A.; Daniele, L.; Poveda-Villalón, M.; García-Castro, R. SAREF4INMA: A SAREF Extension for the Industry and Manufacturing Domain. Semant. Web 2020, 11, 911–926. [Google Scholar] [CrossRef]
  114. Musen, M.A. The Protégé Project: A Look Back and a Look Forward. AI Matters 2015, 1, 4–12. [Google Scholar] [CrossRef]
  115. Gerke, B.F.; Gallo, G.; Smith, S.J.; Liu, J.; Alstone, P.; Raghavan, S.; Schwartz, P.; Piette, M.A.; Yin, R.; Stensson, S. The California Demand Response Potential Study, Phase 3: Final Report on the Shift Resource through 2030. Lawrence Berkeley National Laboratory. Available online: https://escholarship.org/uc/item/7bx121k6 (accessed on 20 November 2022).
  116. Mourtzis, D.; Boli, N.; Xanthakis, E.; Alexopoulos, K. Energy Trade Market Effect on Production Scheduling: An Industrial Product-Service System (IPSS) Approach. Int. J. Comput. Integr. Manuf. 2021, 34, 76–94. [Google Scholar] [CrossRef]
  117. European Association for the Cooperation of Transmission System Operators (TSOs) for Electricity ENTSO-E Transparency Platform. Available online: https://transparency.entsoe.eu/ (accessed on 2 February 2023).
  118. Plakas, K.; Karampinis, I.; Alefragis, P.; Birbas, A.; Birbas, M.; Papalexopoulos, A. A Forecasting Model for Predicting Electricity Day-Ahead Market Prices for Scheduling Industrial Applications. In Proceedings of the 13th Mediterranean Conference on Power Generation, Transmission, Distribution and Energy Conversion, Valletta, Malta, 7–9 November 2022. [Google Scholar]
  119. Ouyang, J.; Fu, J. Optimal Strategies of Improving Energy Efficiency for an Energy-Intensive Manufacturer Considering Consumer Environmental Awareness. Int. J. Prod. Res. 2020, 58, 1017–1033. [Google Scholar] [CrossRef]
  120. Plitsos, S.; Repoussis, P.P.; Mourtos, I.; Tarantilis, C.D. Energy-Aware Decision Support for Production Scheduling. Decis. Support Syst. 2017, 93, 88–97. [Google Scholar] [CrossRef]
  121. Nouiri, M.; Bekrar, A.; Trentesaux, D. Towards Energy Efficient Scheduling and Rescheduling for Dynamic Flexible Job Shop Problem. Ifac-PapersOnline 2018, 51, 1275–1280. [Google Scholar] [CrossRef]
  122. Cui, W.; Sun, H.; Xia, B. Integrating Production Scheduling, Maintenance Planning and Energy Controlling for the Sustainable Manufacturing Systems under TOU Tariff. J. Oper. Res. Soc. 2020, 71, 1760–1779. [Google Scholar] [CrossRef]
  123. Nouiri, M.; Trentesaux, D.; Bekrar, A. Towards Energy Efficient Scheduling of Manufacturing Systems through Collaboration between Cyber Physical Production and Energy Systems. Energies 2019, 12, 4448. [Google Scholar] [CrossRef]
  124. Ma, S.; Zhang, Y.; Liu, Y.; Yang, H.; Lv, J.; Re, S. Data-Driven Sustainable Intelligent Manufacturing Based on Demand Response for Energy-Intensive Industries. J. Clean. Prod. 2020, 274, 123155. [Google Scholar] [CrossRef]
  125. Alefragis, P.; Plakas, K.; Karampinis, I.; Valouxis, C.; Birbas, M.; Birbas, A.; Gogos, C. Sustainable Energy Aware Industrial Production Scheduling. In Proceedings of the 13th International Conference on the Practice and Theory of Automated Timetabling, PATAT 2022, Leuven, Belgium, 30 August–2 September 2022; pp. 256–264. [Google Scholar]
Figure 1. Applied Research Methodology within this paper (based on Design Research Methodology DRM) [6].
Systems 11 00100 g001
Figure 2. Energy sustainability spectrum.
Systems 11 00100 g002
Figure 3. Scoped Models within the EnerMan System Analysis and Prediction.
Systems 11 00100 g003
Figure 4. Overview of the conceptual Framework.
Systems 11 00100 g004
Figure 5. Derivation of the Product–Workshop–Resource Representation.
Systems 11 00100 g005
Figure 6. Hierarchical versus electrotechnical levels within manufacturing environment (adapted from Liebl [82]).
Systems 11 00100 g006
Figure 7. Product–workshop–resource model.
Systems 11 00100 g007
Figure 8. Multi-level di-graph representation: an example of facility and building levels.
Systems 11 00100 g008
Figure 9. Implementation blueprint for instantiating the ontology (above), querying mechanism applied to requirement Req 3 (missing or erroneous instances in red, valid items in green) (below).
Systems 11 00100 g009aSystems 11 00100 g009b
Figure 10. Daily and monthly Electricity Production variability.
Systems 11 00100 g010
Figure 11. Parameter Importance Analysis.
Systems 11 00100 g011
Figure 12. Hybrid Energy Market Price Forecasting.
Systems 11 00100 g012
Figure 13. Production Scheduling Solution Example.
Systems 11 00100 g013
Table 1. Energy Sustainability parameters and metrics overview by system level and impact type.
Level NaturePlantProduction LineMachine
or Sub-Systems
Energy Performance/TechnicalEnergy reuse, recycling
Green Supply Chain
Circular economy
Cycle timeEfficiency/Energy heat losses
Energy load profile
Performance
Energy Consumption (EC) and related expressions (OEE/EC; EC/Product; EC/line)
EconomicEnergy costs
Energy sufficiency
Energy generation
Waste costs
Energy investment costEfficiency (i.e., energy cost/unit of product)
EnvironmentalEnergy sources (renewable or not) CO2 emission
Table 2. Energy Sustainability parameters and metrics overview, implementation in residential and industrial applications.
DriverResidentialIndustrial
Type of technologySmart meter
Home automation systems
Renewable energy systems
Building management systems
Industrial control systems
Power monitoring and control systems
Process planning and scheduling
Renewable energy systems
Key performance
indicators
Energy costs
User comfort (e.g., [34,43])
Energy sustainability (cf. Table 1)
Energy costs
Energy consumption
Process dependenciesLargely independent appliancesOften interdependent process sequences and jobs
User involvementHigh-level inclusion of homeownerLow-level inclusion of specialists
Table 3. Requirements related to the evaluation of manufacturing system suitability regarding EnPI provision (extracted).
RequirementRelated Question for Query
Req 1For each EnPI within a system of interest, is there at least one sensor monitoring the corresponding required observable properties?
Req 2For the sake of EnPI estimation accuracy, does each sensor measurement respect Shannon’s theorem, i.e., does each acquisition system have a sampling rate at least twice the maximum frequency of the signals it monitors ?
Req 3For reliability sake, are all the external factors affecting the considered EnPIs either measured or estimated? (e.g., ambient temperature, etc.)
Req 4Is there at least one implementable control loop (a collection of actuators, controllers and acquisition systems) capable of controlling the considered EnPI?
Disclaimer/Publisher’s Note: The statements, opinions and data contained in all publications are solely those of the individual author(s) and contributor(s) and not of MDPI and/or the editor(s). MDPI and/or the editor(s) disclaim responsibility for any injury to people or property resulting from any ideas, methods, instructions or products referred to in the content.

