1. Introduction
The ultimate goal of modern listed companies is to maximize enterprise value, but shareholders are often unable to personally manage the daily business activities of enterprises due to their own lack of relevant professional knowledge or having no free time, so they need to entrust professionals to manage the enterprises, and the relationship between shareholders and managers arises from the commission and agency. The shareholders entrust the management personnel to manage the enterprise on their behalf, which will inevitably generate certain agency costs, mainly in two aspects. On the one hand, the shareholders have to supervise the behavior of the management personnel or have to motivate the management personnel to make beneficial actions for the enterprise, and on the other hand, the unavoidable costs incurred by the external professional management personnel to manage the enterprise. The existence of agency costs can greatly affect the performance of business activities, especially financial performance, so it is meaningful to study agency costs to improve the financial performance of the company.
State−owned enterprises, especially wholly state−owned enterprises (SOEs), have high agency costs due to the “lack of owner” problem of universal property rights [
1], which has led to several rounds of SOE reforms [
2]. The 2013 mixed ownership reform (hereinafter referred to as mixed reform) aims to improve the property rights structure of SOEs by introducing non−public capital, playing the role of non−state shareholders to monitor and discipline SOE executives, and reducing agency costs [
3]. At present, China is in a period of deepening structural reform of SOEs, with hybridization being an important breakthrough. Exploring the effect of the hybridization strategy to reduce agency costs of SOEs and the proportional setting of strategy indicators when the effect is optimal can further test the effectiveness of the current hybridization policy and provide a theoretical basis for the next step of deepening the hybridization of SOEs. Currently, hybrid reform mainly adopts three strategies of equity mix [
4], executive assignment [
5], and employee stock ownership plan implementation [
6,
7].
There are controversies in academic circles about the necessity of equity mix in SOEs, and scholars in support of the theory, represented by Weiying Zhang, argue that SOE mix reduces policy burden and excessive indebtedness, can promote innovation [
8,
9], enhance the performance sensitivity of SOE executive compensation [
10], strengthen the quality of accounting information [
11], and improve their economic efficiency [
12,
13] while boosting the macroeconomic growth rate [
14]. Opposition scholars, represented by Justin Yifu Lin, argue that SOE hybrid reform leads to more severe budgetary soft constraints, private interests due to control rights [
15], the presence of state−owned shares or executive political affiliates exhibit wasteful resources, and excessive reduction in the proportion of state−owned shares is not conducive to improving corporate performance [
16], which will eventually result in the loss of state−owned assets as the hybrid reform advances [
17]. An important policy goal of SOE hybrid reform is to improve the ownership structure of SOEs and alleviate the agency problem of SOEs, and scholars have explored whether the SOE equity mix can reduce agency costs based on traditional econometric statistical methods. Cao Yue et al. [
18] found that it is difficult for SOEs to improve the quality of internal control by only achieving equity diversity, and only when hybrid SOEs form certain equity checks and balances can non−state shareholders improve corporate governance [
19], supervise and restrain management’s cost−manipulation behavior for self−interest motives [
20], inhibit agency conflicts [
21], and thus reduce agency costs.
Scholars on SOEs’ hybrid reform strategies have shifted from the equity mix perspective to the executive appointment dimension, and Cai Guilong et al. [
10] found that it is difficult for non−state shareholders to form checks and balances on SOEs’ hands due to their low shareholding in SOEs under the logic of equity and control parity. Given this, Zhu Jigao [
22] proposed that equity and control as two independent tools can be used separately to solve the current problem of non−state capital in SOEs without the right (control) to change the decision−making of the state capital. The involvement of non−state shareholders in the senior governance of SOEs by appointing executives is consistent with the logic of non−reciprocal configuration of control and ownership [
16], and the actual participation of non−state shareholders in the exercise of power in SOEs’ business decisions can significantly improve the quality of internal control of SOEs, improve the quality of internal control of competitive SOEs and local SOEs, and effectively reduce the agency costs of SOEs [
23]. Further, the effect of non−state shareholders in reducing SOE agency costs is more prominent when they have excess power to appoint executives relative to their equity [
24].
At present, scholars at home and abroad have conducted less research from the perspective of employee stock ownership plans as a strategy for SOEs’ mixed reform, and there is a lack of research on SOEs’ agency costs. As a breakthrough in hybrid reform, employee stock ownership plans should have a more positive effect in theory, but due to the insufficient incentive of employee stock ownership plans, it is difficult to improve the agency problem of SOEs by implementing employee stock ownership plans in hybrid reform [
25]. It is necessary to conduct further research on the hybrid effect of employee stock ownership plans to support the optimization of employee stock ownership programs.
In summary, domestic and foreign scholars have conducted rich research on SOEs’ hybrid reform based on traditional econometric statistical methods [
26], but there is room for research. First, the privatization process of SOEs abroad was concentrated in the 1990s, and the differences in economic systems and privatization methods make it difficult to apply foreign experience to China, where SOE hybrid reform has entered a deepening phase, among which employee stock ownership plans are the most typical, and employee stock ownership plans in China, as an important system of SOE hybrid reform, differ significantly from foreign system design, and the system implementation effects are bound to be different. Secondly, there is controversy about the necessity of mixed reform, and there is an urgent need to demonstrate the effect of mixed reform strategies. The investigation of the optimal ratio of mixed reform strategy indicators can effectively address the concerns raised by scholars who oppose mixed reform. Once again, domestic and foreign scholars have not paid enough attention to employee stock ownership as a mixed reform strategy for SOEs, and fewer scholars have compared the differences in the effect of different mixed reform strategies in reducing agency costs of SOEs. Finally, the current literature explores the economic consequences of mixed reform based on traditional econometric and statistical methods, and the research methods need to be enriched and the accuracy needs to be improved.
With the development of emerging technologies, machine learning has gained much attention for its superior performance in traditional industries, especially in data processing [
27,
28]. Based on the differences in domestic and foreign institutional systems, the difficulty of learning from foreign experiences, the controversies about the necessity of mixed reform of SOEs in China, and the lack of attention to employee stock ownership as a mixed reform strategy, this paper innovatively constructs a model based on machine learning algorithms to explore the effects of mixed reform strategies on agency costs of SOEs, and identifies the optimal ratio settings of mixed reform strategy indicators while testing the effectiveness of policies. In this paper, we investigate the impact of the hybrid reform strategy on the agency costs of SOEs from three dimensions: equity mix, executive assignment, and employee shareholding, among which, equity mix is based on three perspectives: breadth, depth, and checks and balances of equity mix and the indicator design are comprehensive and rich. In addition, compared with the traditional econometric statistical methods, this paper combines previous studies to compare and analyze the regression performance of various algorithms. The main ones are the bag−boosting algorithm, the long and short−term memory neural network algorithm, and ridge regression [
29]. Among them, the long and short−term memory neural network algorithm and the ridge regression algorithm have been researched by previous authors, and the application of the bag−boosting algorithm on the agency costs of SOEs is the focus of this paper. This method can obtain the proportional settings of different indicators when the effect of reducing SOE agency costs is optimal, and it can verify the effectiveness of current hybrid reform policies while analyzing the next hybrid reform directions and strategies for policymakers and SOE managers concerning the current situation of hybrid reform.
Domestic and foreign scholars have studied agency costs from a variety of perspectives. Some domestic scholars use statistical methods to measure agency costs from the perspective of the internal contract system and find that agency costs largely affect the efficiency of enterprises; some study the relationship between family business management and agency costs; some study directly from the root cause of agency costs, the agency problem; other scholars study the relationship between equity concentration and checks and balances and agency costs and find that in enterprises of different nature, the relationship between the two is different. In addition to the relationship between the quality of financial reporting and the two types of agency costs, agency costs also vary depending on the nature of the enterprise. Improving the quality of internal control and moderating debt can also help to reduce agency costs between management and shareholders. Some foreign scholars also believe that debt affects agency costs, in addition to the innovative and ownership structure of the enterprise, the separation of powers also affects agency costs. The purpose of this paper is to explore the influence model of multiple influencing factors on enterprise agency costs through an advanced machine learning algorithm and to obtain the influence law of different influencing factors on enterprise agency costs. In other words, this paper focuses more on the analysis of empirical research, aiming to explore the impact of agency costs on enterprises through empirical analysis, so as to provide reference and new solution ideas for the government to formulate policies and enterprises to plan development strategies. Therefore, this paper focuses more on the construction of the algorithm and the measurement of indicators.
2. Research Framework and Algorithm Design
2.1. Research Framework
This paper explores the effects of three SOE hybrid strategies on agency costs based on various machine learning algorithms, among which the model constructed based on the bag−boosting algorithm can tap the ratio setting when the effect of strategy indicators is optimal, which is one of the focuses of this research paper. The research process of this paper can be extracted into four parts: data preprocessing, constructing a model and optimizing it, model prediction, and conclusion. The research framework is shown in
Figure 1.
Data pre−processing: The data were crawled and downloaded from the websites of the Shenzhen Stock Exchange, Shanghai Stock Exchange, Baidu, and Juchao Information, as well as the Wind Financial Research Database and CASPAR Database for SOE mixed reform strategies and enterprise−related financial data. Among them, there are 3 dimensions of mixed reform strategies, counting 16 feature values (m−values in
Figure 1).
The model was constructed and optimized. A total of 80% of the data in sample set D are used for training and 20% for prediction. In the training process, the weighted combination of the boosting and bagging training model is used to obtain the bag−boosting model by setting the model−seeking conditions. The performance of the bag−boosting model is also evaluated by comparing it with the prediction effects of Ridge Regression and LSTM.
Model prediction: Concerning the maximum and minimum values of m in the sample set D, the changes in the agency costs of SOEs are predicted when a certain eigenvalue changes in a certain range in the form of random numbers, and the proportion setting when the effect of each eigenvalue is optimal is explored.
Conclusion: The prediction results are analyzed to provide managerial suggestions for improving the current stage of the hybrid system and reducing the agency costs of SOEs.
2.2. Algorithm Design
Bag−boosting is a weighted combined model of boosting and bagging training models. Among them, boosting is a method of generating sequences serially with strong dependencies between individual learners, and bagging is a method of generating sequences in parallel without strong dependencies between individual learners. The combined model notation is defined in
Table 1 below.
In the derivation of the formula for serially generated strong learners, the strong learners under strong dependencies among individual learners are derived by optimizing the exponential loss function. That is, the exponential loss function of Equation (2) is minimized by a linear combination of the basic learners, see Equation (1).
The first basic classifier
is obtained based on the initial data; thereafter,
is generated iteratively, and when the basic classifier
is generated based on the distribution
, this basic classifier weight
should be such that
minimizes the exponential loss function, i.e.,
where
. Consider the derivative of the exponential loss function.
Letting the above equation be zero yields the classifier weight update formula.
After obtaining
, the sample distribution will be adjusted so that the next round of the basic learner
corrects all the errors of
, minimizing
can be simplified by minimizing the following Equation (6).
Let
. The above equation can be approximated using the
Taylor expansion as Equation (7).
Thus, the ideal basic learner is obtained.
where
is a constant and let
denote a distribution.
According to the definition of mathematical expectation, it is equivalent to the following definition.
Since
, one can have the following definitions.
Then the ideal basic learner can be transformed into the following equation.
It follows that the ideal
will minimize the error function under the distribution
. Therefore, the weak classifier will be trained based on the distribution
and the error against
should be less than 0.5. This is to some extent similar to the residual approximation idea. Considering the relationship between
and
, the sample distribution update formula is obtained.
Similarly, in the derivation of the formula for the parallel generative strong learner, the probability that a sample is always not collected in k samples is when making a put−back sampling in a data set containing k samples, taking the limit to obtain.
The above equation illustrates that about 63.2% of the samples in the initial training set appear in the sampling set, leaving 36.8% of the samples available as the validation set for out−of−bag estimation of the generalization performance. Let denote the actual training sample set used by and denote the out−of−bag estimation of sample x.
The out−of−wrap estimate of the generalization error is given by the following equation.
Based on the above model, a decision tree is introduced as the basic learner, while random attribute selection is introduced in the training process. The traditional decision tree selects an optimal attribute in the attribute set of the current node (assuming there are d attributes) when choosing the attributes for division, while the model in this paper selects a random subset containing k attributes in the attribute set of each node of the base decision tree, and then selects an optimal attribute from this subset for division, and here the parameter k controls the degree of randomness introduced. If k = d, the construction of the base decision tree is the same as the traditional decision tree. If k = 1, an attribute is randomly selected for division. In general, .
The basic learner diversity of the model in this paper comes not only from sample perturbations but also from attribute perturbations, which allows the generalization performance of the final integration to be further enhanced by the increase in the degree of variation among individual learners.
The basic learners generated under the weighted serial and parallel algorithms are given higher weights to the better−performing models to obtain the combined bag−boosting model, and the algorithm process is shown in
Figure 2 below.
In the process of parallel generation of basic learners by the bagging algorithm, firstly, t (t < m) subsets are selected uniformly and with put−back from the training set of size n as the new training set using the self−service sampling method. Secondly, t−tree models are trained using the regression algorithm. Finally, the summary model is obtained by averaging.
The boosting algorithm serially generates the basic learner process. First, it is assumed that the training data set has a uniform weight distribution, i.e., each training sample plays the same role in the learning of the basic classifier, and this assumption ensures that the basic classifier can be learned on the original data in step one. Second, the training sample distribution is adjusted according to the performance of the basic classifier, so that subsequent training focuses more on the training samples that the basic classifier does wrong, and the weight distribution of the training data is updated to prepare for the next round. Next, the previous step is repeated at time , and the basic classifier is learned repeatedly using the training dataset with weight , and the classification error value of the basic classifier on the weighted training dataset is calculated. Finally, the linear weighted combination of the T basic classifiers is implemented.
3. Data Processing and Index Measurement
3.1. Data Processing
In 2008, China implemented the shareholding reform, which enabled non−state capital to achieve universal participation in state−owned listed companies. After excluding data from the samples with missing financial, ST, PT, and main variables, there were 953 remaining. Of the listed SOEs, most of them are invested by different investment institutions. From the results of previous studies, it can be found that the average exit time of investment institutions in the process of investment is about 1 year. This means that there is a time lag for firms to obtain performance, which will also give a lag time for their agency costs. Therefore, given that the current latest sample data is 2021, with a one−year lag time, the final time interval chosen is 2008–2020. The reason for choosing SOEs as the research object in this paper is that the data on that part of SOEs are more complete in the current publicly available data on listed enterprises in mainland China. If privately listed enterprises are chosen as the research object, the number of enterprises meeting all indicators is small. In addition, the number of enterprises under each type is small, which would make the research results not generalizable. Although the research object of this paper is SOEs, this paper is mainly concerned with the empirical method of research. The purpose of this paper is to explore the use of nonlinear machine learning arithmetic to construct regression models of firms’ agency costs. More attention is paid to the applicability of the empirical method rather than the data itself. In this paper, the data on company finance and employee stock ownership plan implementation are obtained from Wind Financial Research Database; the data on the equity mix of mixed reform of state−owned enterprises are mainly from the CAMAR database, annual reports disclosed by Shenzhen and Shanghai Stock Exchanges and websites such as Baidu and Tian−eye search; the data on executive assignments are mainly from CAMAR database, annual reports disclosed by Shenzhen and Shanghai Stock Exchanges and Juchao Information Database; the data on executive assignments are mainly obtained from CAMAR database, annual reports disclosed by Shenzhen and Shanghai stock exchanges and Juchao information database. To address the issue of the absence of descriptive statistics for sample data, this paper is concerned with the study of empirical analysis methods rather than the data itself. In this paper, a nonlinear machine learning approach is used to construct a regression model and use it for the prediction of unknown data. The advantage of this method is that only the original data need to be input into the model, and the model will automatically learn from the original data to obtain the implied patterns in the data, thus eliminating the need for human statistical analysis of the data. In addition, when the data is analyzed statistically by humans, personal subjective will is added to the statistical criteria, which makes the results not generalizable. Thus, the findings of the manuscript cannot be generalized more widely. Furthermore, the descriptive statistical analyses were all in preparation for the correlation analysis after the subsequent linear regression modeling analysis, which was not performed in this paper, and, therefore, the descriptive statistical analyses were not significant for the analysis of the results.
3.2. Index Measurement
The process of selecting and constructing indicators is shown in
Figure 3 below, and the whole process is divided into four steps: acquisition of data and construction of indicators for equity mix, acquisition of data and construction of indicators for executive assignments, acquisition of data and construction of indicators for employee stock ownership plan, and acquisition of data and construction of indicators for sample set D.
Equity mixed data acquisition and index construction: Firstly, we downloaded the file of actual controllers of listed companies from the CSMAR database and excluded the samples of ST, PT, and financial real estate companies. Secondly, the sample of companies whose actual controllers are state−owned enterprises were screened out, i.e., the sample companies with label values of “1100”, “2000”, “2100”, and “2120” were retained. Then, we downloaded the top ten shareholders of the screened SOEs from the CSMAR database to obtain the shareholder names, shareholding numbers, and shareholding ratios. Then, we crawled the text of shareholders and actual controllers in the annual reports disclosed by the sample SOEs in Shenzhen and Shanghai stock exchanges based on Python, and manually compared and sorted out whether there were concerted actors or related shareholders among the top ten shareholders, and if there were, the shareholding ratio of both was summed up and used as the final shareholding ratio of one of the shareholders. Finally, the values of each indicator of the mixed equity of SOEs were calculated.
It is easy to find from previous studies [
9,
10,
11] that the equity mix indicators are selected considering both the depth of mix (such as the shareholding ratio of the first largest non−state shareholder (shr1th), the shareholding ratio of all non−state shareholders among the top ten shareholders (shrt), and whether the first largest non−state shareholder is the controlling shareholder dummy variable (k1th)) and the breadth of mix and checks and balances (such as the type of shareholding among the top ten shareholders (catg) as well as equity checks and balances (ebal)). Here, the equity types cover four categories: state−owned shareholders, private shareholders (domestic non−state−owned corporate legal persons, domestic natural persons), foreign shareholders (foreign corporate legal persons, foreign natural persons), and others. If there is only one type of shareholder, the value is 1. If there are two types of shareholders, the value is 2. And so on, the range of equity types is 1 to 4.
Executive appointment data acquisition and index construction: Firstly, based on the top ten shareholders document compiled in the first step, we downloaded the data of directors and supervisors of sample SOEs from the CSMAR database, including the number and names of directors and supervisors. Secondly, based on Python software, we crawled the content of the annual reports disclosed by the sample SOEs in Shenzhen and Shanghai stock exchanges regarding the information of senior executives, and used the information of senior executives in the Juchao information website as supplementary and auxiliary verification materials. Further, we determined whether there is a relationship between the executives of the sample SOEs and the top ten shareholders. The relationship mainly covers three cases: (1) The executives of the sample SOEs have worked in other enterprises held by the top ten shareholders. (2) The executives of the sample SOEs have worked in the affiliated enterprises of the other enterprises held by the top ten shareholders. (3) The executives of the sample SOEs have worked in another enterprise jointly owned by the top ten shareholders. Finally, the values of each indicator of SOEs’ hybrid executive assignments were calculated.
From previous studies [
22,
23,
24], it is known that executive assignment indicators are usually calculated using the presence of a dummy variable for the presence of directors appointed by non−state shareholders in the board of directors (ifad), the number of directors appointed by non−state shareholders among the top ten shareholders (adnum), the number of supervisors appointed by non−state shareholders among the top ten shareholders (asnum), the number of executives appointed by non−state shareholders among the top ten shareholders (aenum) The number of directors appointed by non−state shareholders among the top ten shareholders (adrat), the proportion of supervisors appointed by non−state shareholders among the top ten shareholders (asrat), the proportion of executives appointed by non−state shareholders among the top ten shareholders (aerat), and the total proportion of directors, supervisors and executives appointed by non−state shareholders among the top ten shareholders (adserat) are measured by eight indicators.
Employee stock ownership plan data acquisition and index construction: First, the data on the implementation of employee stock ownership plans implemented by sample SOEs up to 31 December 2020 were obtained from the Wind Financial Research Database. Based on the previous research results [
8,
9,
10], the dummy variables of employee stock ownership plan implementation (esop) and the proportion of employee stock ownership plan implementation share capital and the total company share capital (imprat) indicators are constructed. In addition, this paper considers that the frequency of employee stock ownership plan implementation is an important factor affecting the number of employees holding company shares and the employees’ rights to monitor and restrain the behavior of executives, so this paper innovatively adds the indicator of the number of times an employee stock ownership plan is implemented (esopnum) in a listed company within one year. The value of esopnum is 1 if a listed company implements it only once a year, and 2 if it implements it twice. And so on, the range of this indicator is 1–3.
Data acquisition and index construction for sample set D: First, the research results of Gong et al. showed [
11] that the overhead rate of a firm is used as a proxy variable for agency costs, and the overhead rate (G&A) = overhead/main business revenue. For this purpose, this paper obtained data on the overhead expenses and main business income of sample SOEs from the Wind Financial Research Database and calculated the overhead rate. Next, the data generated in the first three steps were matched with the overhead rate data based on Python software using “stock” and “year” as indexes. The sample values with missing main variables were removed while matching. Finally, the data set D containing the sample values of
X and
Y was aggregated. The 16 evaluation indicators selected in this paper are summarized from published data and the results of previous studies. For the issue of references of variable definitions, relevant references have been made in the previous index construction, and the same index has different descriptions in different literature. Therefore, the definition of variables in this paper is a summary of the research results of several scholars, rather than a single citation of a certain piece of literature. Therefore, the references cited in this paper are placed in the explanatory description of the variables rather than listed in the table. After the index construction is completed, the specific variables of the final selected indexes in this paper are defined in
Table 2.
4. Evaluation and Analysis of Model Effects
After the models and indicators are constructed, the pre−processed data are brought into bag−boosting, ridge regression, and LSTM models for training. During the training process, to ensure that the training can meet the expectation, the mean squared error (MSE) value is used as the training effect evaluation function. The training effects of the combined bag−boosting model with different training times are shown in
Figure 4.
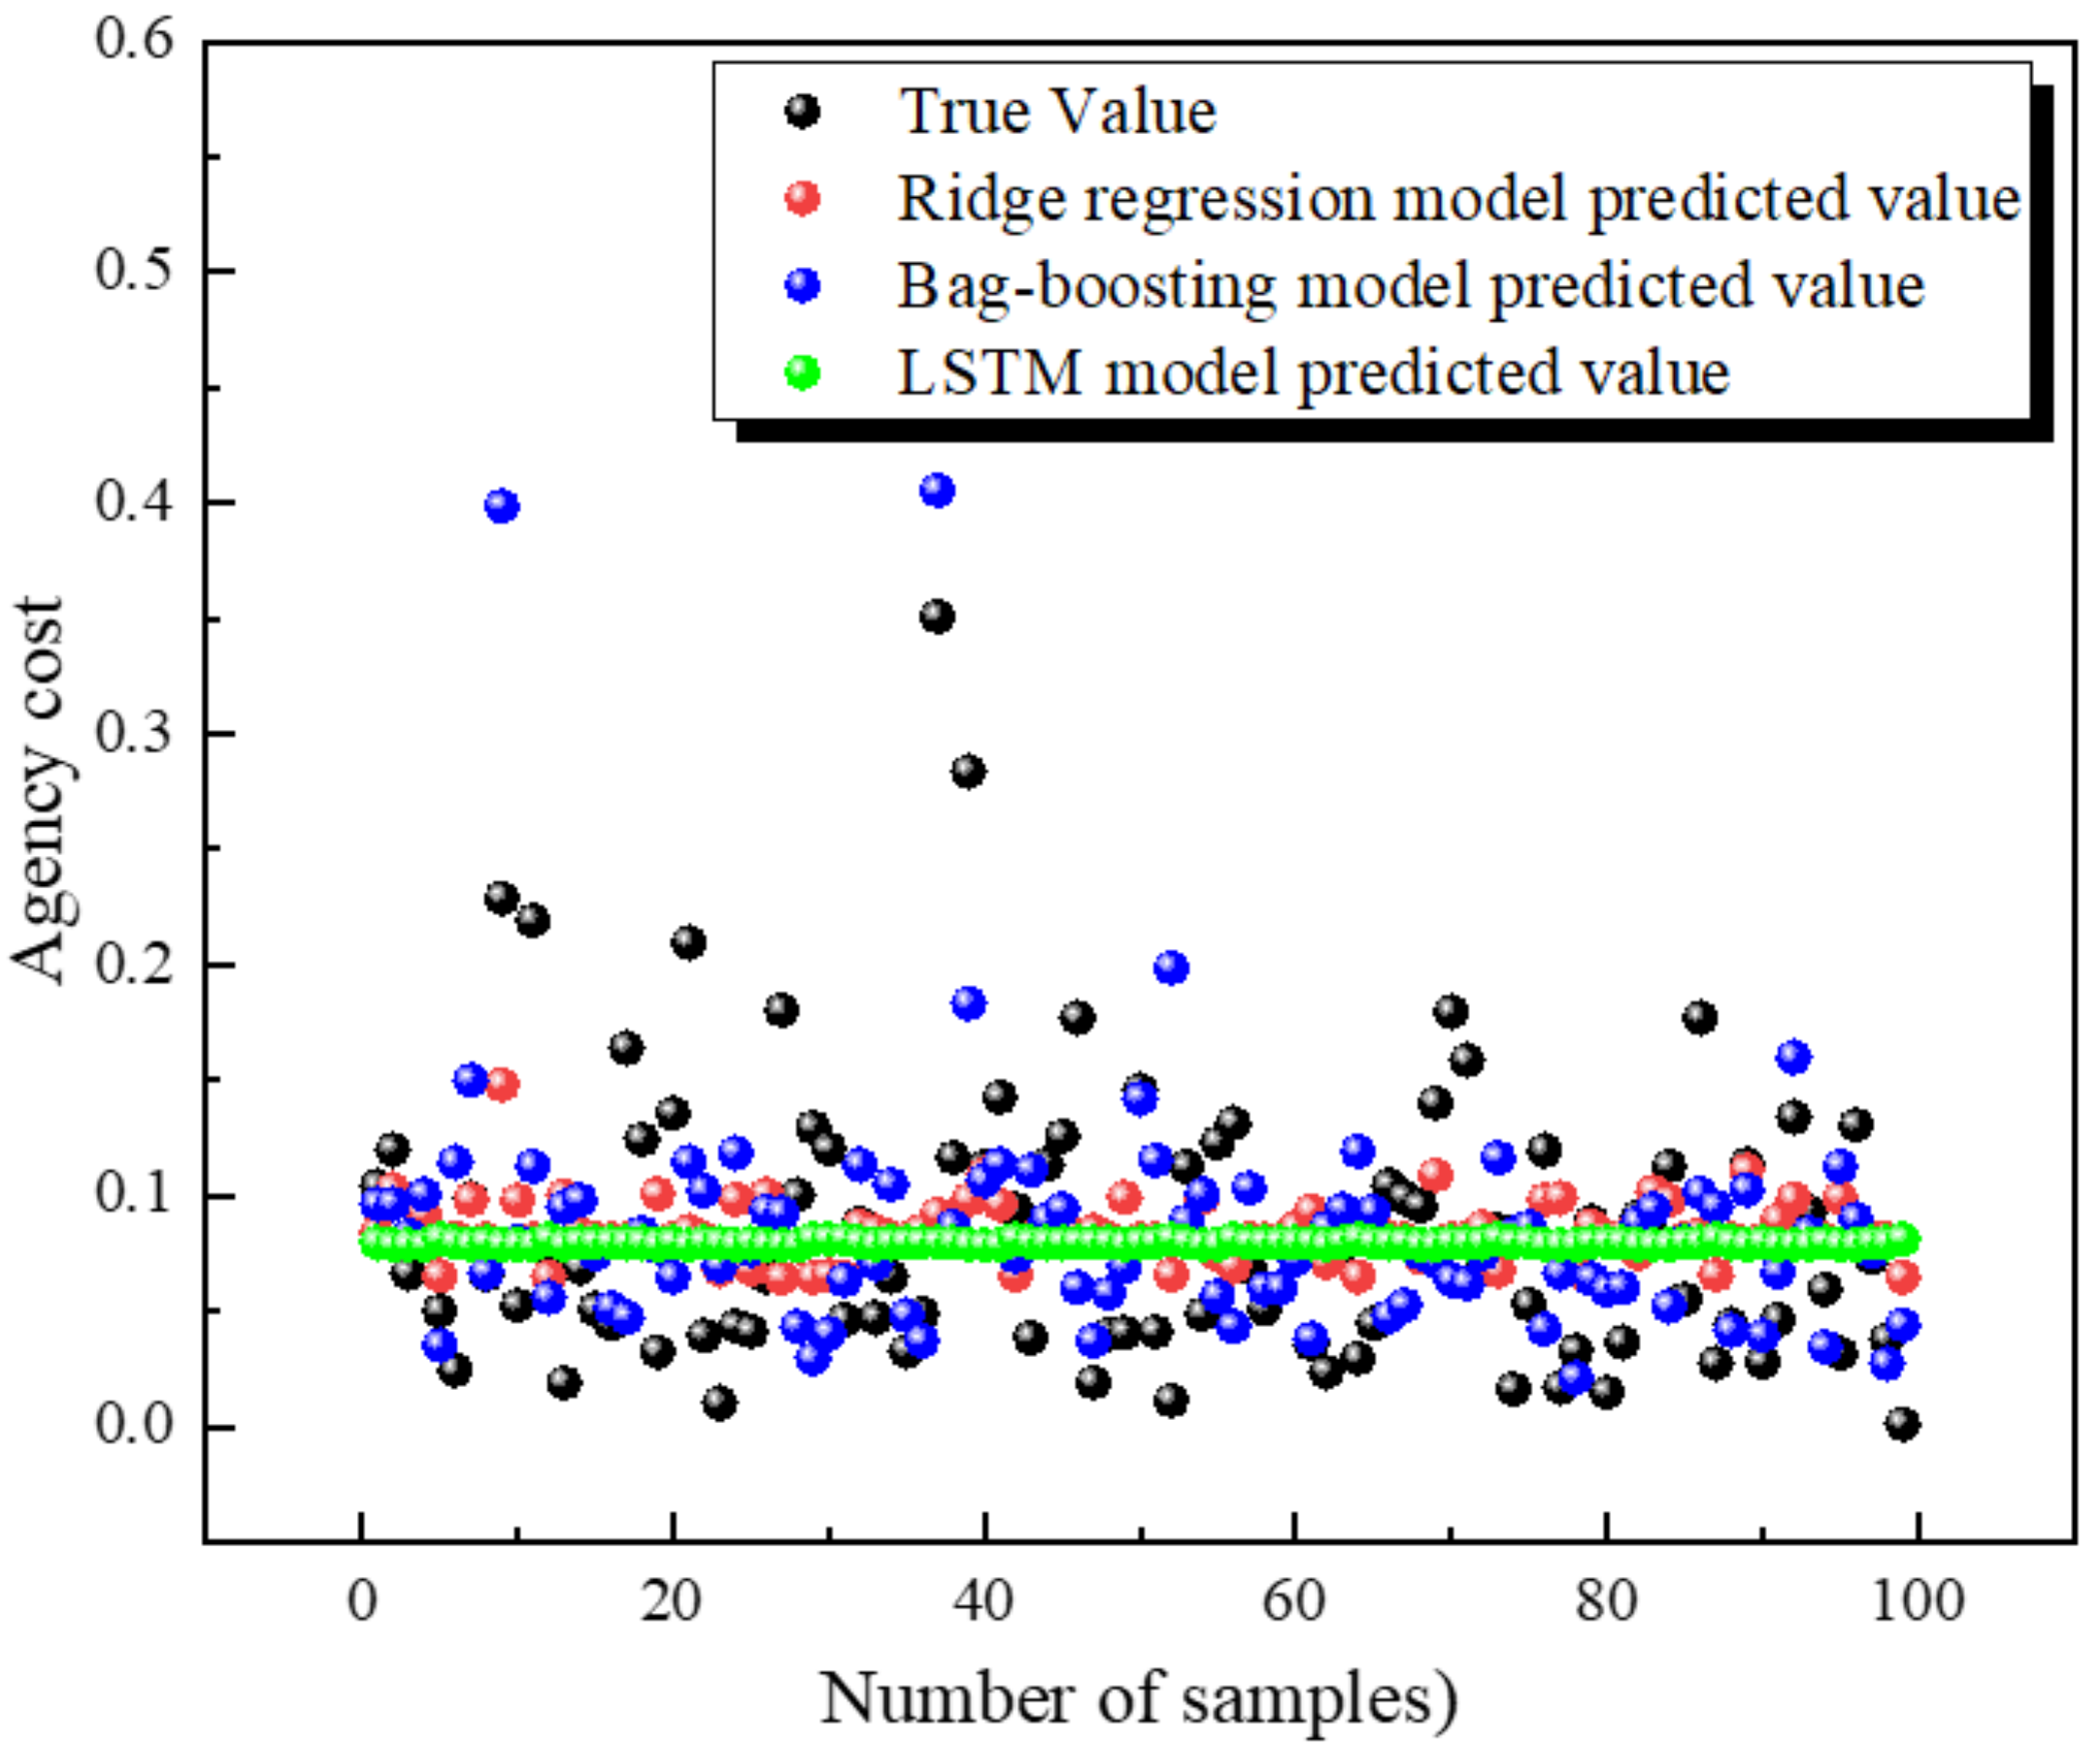
Within the training cycle [0,1,2,3,4,5], the MSE value has been in a decreasing trend with a large rate of decrease, which proves that the bag−boosting model adjusts the nodes and node weights drastically at this stage when integrating the CART tree. However, as the prediction period continues to increase, the rate of change of the MSE value slows down, and at this time the bag−boosting model is in the fine−tuning stage for internal nodes and weights, and after the MSE value reaches about 0.011 (reaching the expected value), the bag−boosting model stops training, proving that the model has reached the optimal state. After the training of the model was completed, the performance of the bag−boosting model was evaluated by predicting the real samples and comparing the prediction results of the model with those of the ridge regression and LSTM models. The comparison of the prediction effects of the three models is shown in
Figure 5.
Figure 5 shows the prediction scatter plots of the LSTM neural network, ridge regression, and bag−boosting models, respectively. It is easy to see that the predicted values of the LSTM model differ significantly from the true value distribution under the data structure of this paper, which means that the prediction effect of the model is poor. From the prediction results of the ridge regression model, we can see that the model can only simulate about 1/3 of the real values of the samples, and the prediction effect is average. The scatter plot of the prediction of the bag−boosting combined model proposed in this paper shows that the combined model can simulate most of the sample’s true values, and the prediction effect is better. Numerically, the predicted values of the LSTM model are distributed around 0.075, with a relatively smooth distribution and a large difference with the trend of the real values, and the model prediction effect is extremely poor. The prediction trend of the ridge regression model is also relatively small, and it is difficult to simulate the trend of the real value, and the model prediction effect is average. The trend of the predicted value of the bag−boosting model is generally consistent with the trend of the real value, and the model prediction effect is good. However, there are still a small number of intervals where the two trends do not fully match, which indicates that there is still room for improvement in the machine learning training model. Further improvements will be made in the optimization of the model later. The combined prediction effect of the three models shows that the combined bag−boosting model proposed in this paper has better prediction performance and a better fitting effect on the real value of the sample, which is an improvement of the existing model.
6. Conclusions
To solve the problem of high agency costs of SOEs, mixed ownership reform was proposed in 2013 aiming to introduce non−state capital, improve the ownership structure of SOEs, and play the role of supervision and restraint of non−state shareholders on the agency behavior of SOE managers. There are three main strategies for the mixed reform of differentiated SOEs: first, equity mix; second, executive assignment; and third, employee stock ownership plan implementation. This paper constructs a bag−boosting combination model to test the impact of hybrid reform strategies on SOEs’ agency costs and explores the indicator ratio setting when the effect of hybrid reform strategies to reduce SOEs’ agency costs is optimal, taking the A−share state−owned listed companies from 2008 to 2020 as a sample, and the study concludes. The following four main conclusions are drawn: (1) the introduction of non−state shareholders in the mixed reform of SOEs, in which the shareholding ratio of the first largest non−state shareholder has a sin function trend on the agency costs of SOEs, in order to avoid non−state shareholders using SOE resources to seek to maximize their own interests, their shareholding ratio should be set between 4.5% and 25.2%. When SOEs become private capital holding enterprises, the agency cost shows a decreasing trend. (2) tNon-state shareholders appointing supervisors into SOEs will play a supervisory and restraining role in the behavior of SOE managers. After the proportion of appointed supervisors reaches 40%, the supervisors’ duties under the supervisory effect will have a better suppression effect on the agency costs of SOEs; (3) The special nature of SOEs makes them enjoy government subsidies and other political resources, and when non−state shareholders appoint executives to truly participate in SOEs’ business decisions, the self−interest of executives will make SOEs’ agency costs rise, and when the appointment ratio reaches 37.5%, SOEs’ agency costs remain stable at a high level. (4) After employees hold SOEs’ shares and become shareholders, they actively exercise their supervisory functions to suppress SOEs’ agency conflicts and thus reduce SOEs’ agency costs.
Synthesizing the findings of this paper and the actual situation of mixed reform, the following suggestions are obtained: first, the government should improve the mixed reform system at the policy level, lower the threshold for non−state capital to enter SOEs, steadily advance the process of mixed reform of SOEs layer by layer, include the reform of SOEs in monopolistic industries, create a fair competitive market environment for non−state capital, and at the same time encourage non−state shareholders to actively play a governance role to improve the agency problem of SOEs. Second, in the process of deepening reform, SOEs should insist on adopting a mixed equity strategy, effectively motivate employees to hold company shares and participate in corporate governance, and in the process of promoting mixed reform, not only stay at the level of introducing non−state capital, but also substantially empower non−state shareholders and improve their right to appoint supervisors to SOEs, and non−state shareholders realize the combination of participation and control in order to effectively restrain SOE managers and achieve the purpose of mixed reform to reduce the agency cost of SOEs.
Corporate agency costs are the costs incurred between shareholders and corporate management due to the existence of a principal−agent relationship, that is, the cost of management managing the business in place of shareholders. Higher agency costs may create the right environment for management to play favorites and misappropriate corporate interests, which in turn may lead to impaired corporate performance. Lower agency costs, on the other hand, often mean that management can only receive lower returns, which may make management less motivated to fulfill the obligations of the principal−agent relationship and less willing to take the trouble to manage the enterprise, which may also lead to the impairment of the enterprise’s interests, so it is necessary to explore the relationship between agency costs and corporate financial performance. However, different firms have different shareholders and different shareholding structures, and the shareholders’ decision−making style and supervision may lead to different patterns of agency costs on financial performance among different firms, so subsequent studies will focus more on the relationship between agency costs and financial performance, and the role of shareholding structure in it.


