Article

DVS: A Drone Video Synopsis towards Storing and Analyzing Drone Surveillance Data in Smart Cities

Department of Computer and Information Security, and Convergence Engineering for Intelligent Drone, Sejong University, Seoul 05006, Korea
*
Author to whom correspondence should be addressed.
Systems 2022, 10(5), 170; https://doi.org/10.3390/systems10050170
Submission received: 14 August 2022 / Revised: 16 September 2022 / Accepted: 25 September 2022 / Published: 27 September 2022
(This article belongs to the Special Issue Implementing Smart Cities with Advanced Sensors Systems)

Abstract

:
The commercialization and advancement of unmanned aerial vehicles (UAVs) have increased in the past decades for surveillance. UAVs use gimbal cameras and LIDAR technology for monitoring as they are resource-constrained devices that are composed of limited storage, battery power, and computing capacity. Thus, the UAV’s surveillance camera and LIDAR data must be analyzed, extracted, and stored efficiently. Video synopsis is an efficient methodology that deals with shifting foreground objects in time and domain space, thus creating a condensed video for analysis and storage. However, traditional video synopsis methodologies are not applicable for making an abnormal behavior synopsis (e.g., creating a synopsis only of the abnormal person carrying a revolver). To mitigate this problem, we proposed an early fusion-based video synopsis. There is a drastic difference between the proposed and the existing synopsis methods as it has several pressing characteristics. Initially, we fused the 2D camera and 3D LIDAR point cloud data; Secondly, we performed abnormal object detection using a customized detector on the merged data and finally extracted only the meaningful data for creating a synopsis. We demonstrated satisfactory results while fusing, constructing the synopsis, and detecting the abnormal object; we achieved an mAP of 85.97%.

1. Introduction

In recent years, autonomous unmanned aerial vehicles (UAVs) and drones have been armed with complex navigation devices, light detection and ranging (LiDAR), and high-resolution cameras. It supports a wide range of applications such as surveillance and mapping [1], safety and search [2], and construction examination [3]. Furthermore, different drone components in vision-based UAVs work together to detect a single object, such as a person or vehicle [4]. UAVs help to monitor the progression of catastrophic events such as floods, earthquakes, and unnatural disasters. Real-time monitoring of such events allows the civil authority to make appropriate decisions. Most recently, in a few studies, multiple drones coordinate to accomplish a single task such as search and rescue [5]. In multiple drone scenarios, parallel synchronization of the drones in a mixed-initiative is accommodated with a human operator. Such scenarios require a high level of communication and coordination between the UAVs and the human operator. Drone surveillance is a reliable source to reach out at the endpoint to monitor the progress of natural disasters. The drone surveillance system functionality enhances the dynamic monitoring in smart cities. The smart cities’ infrastructures are equipped with cameras for surveillance and are configured with sensors such as LiDAR and RADAR for providing 3D view surveillance. Drones enabled with LiDAR offer a 360 °C view of an object, which helps monitor and track the object in real-time. Thus, drone involvement in smart cities has emerged as they support functionality such as parcel delivery, emergency healthcare, traffic monitoring, policing, and firefighting.
Vision-based smart UAVs are highly equipped with gimble cameras and LiDAR technology for monitoring a single object or an entire event. The UAV’s vision hardware is configured based on the environment in which it will work (i.e., drone-enabled with a night vision camera and an infrared sensor for nighttime surveillance). Sensor fusion is carried out in most smart UAVs to manage onboard resources effectively and efficiently. Mainly, drones gathered two types of data: point cloud data (i.e., 3D LiDAR) and camera video feed data (i.e., 2D images). The video feed gathered by the cameras mounted on the drones consumes a larger storage space; most of the content in the feed is inactivity or an empty patch of no information. As a result, it takes a tremendous amount of time to analyze and find a piece of helpful information in the gathered video footage from the drone.
The significant challenge while deploying vision and intelligence for a coordinated drone infrastructure are (1) The flight time of the drone is limited as they are powered by lightweight batteries [6], (2) they possess a minimal computation capacity [6], and (3) synchronization with multiple components such as LiDAR, gimble cameras, global navigation satellite system (GNSS), their respective inputs and outputs on limited storage space is challenging [7]. In smart cities, public space security and safety are monitored by traditional security cameras in coordination with drone flight stations, as depicted in Figure 1.
However, these cameras have a limited field of view (FoV) for monitoring the object. In real case scenarios, the camera loses a detected object as the object is moved away from the FoV. In past years, it has been seen that most of the terrorist attacks, assassinations, and trespassing could have been stopped if detected earlier. A study published by the united nations office on drugs and crime (UNODC) suggests that objects such as guns are used to commit a crime or disturb a public space [8].
Traditional surveillance cameras cannot monitor objects on the move as they have a limited field of view at a fixed location; the continuous monitoring of the object can be achieved using drone surveillance [9,10]. Therefore, this paper proposes a technique for continuously monitoring, detecting, and extracting only the desired abnormal object in the early fusion data (i.e., a person carrying a handgun), thus creating an abnormal content drone video synopsis. Most studies use video synopsis [11] and summarization [12] terms interchangeably. However, video summarization deals with creating a summary of video content based on the timeline, thus resulting in a condensed video. In contrast, the video synopsis deals with shifting all the foreground objects in time and domain space for creating a condensed video. The widely accepted study is a video synopsis for making a shorter meaningful video. Traditional video synopsis is proposed for single-view camera scenarios where the FoV is limited. This synopsis is created for events such as walking, driving, and running; thus, conventional video synopsis frameworks are not applicable to drones’ data as the FoV is limited. Therefore, in this study, to find an efficient resource-constrained reliable solution for detecting and extracting the abnormal object from early fused data for creating a small video for analysis, we proposed a drone video synopsis (DVS). The main contribution of the work is summarized as follows:
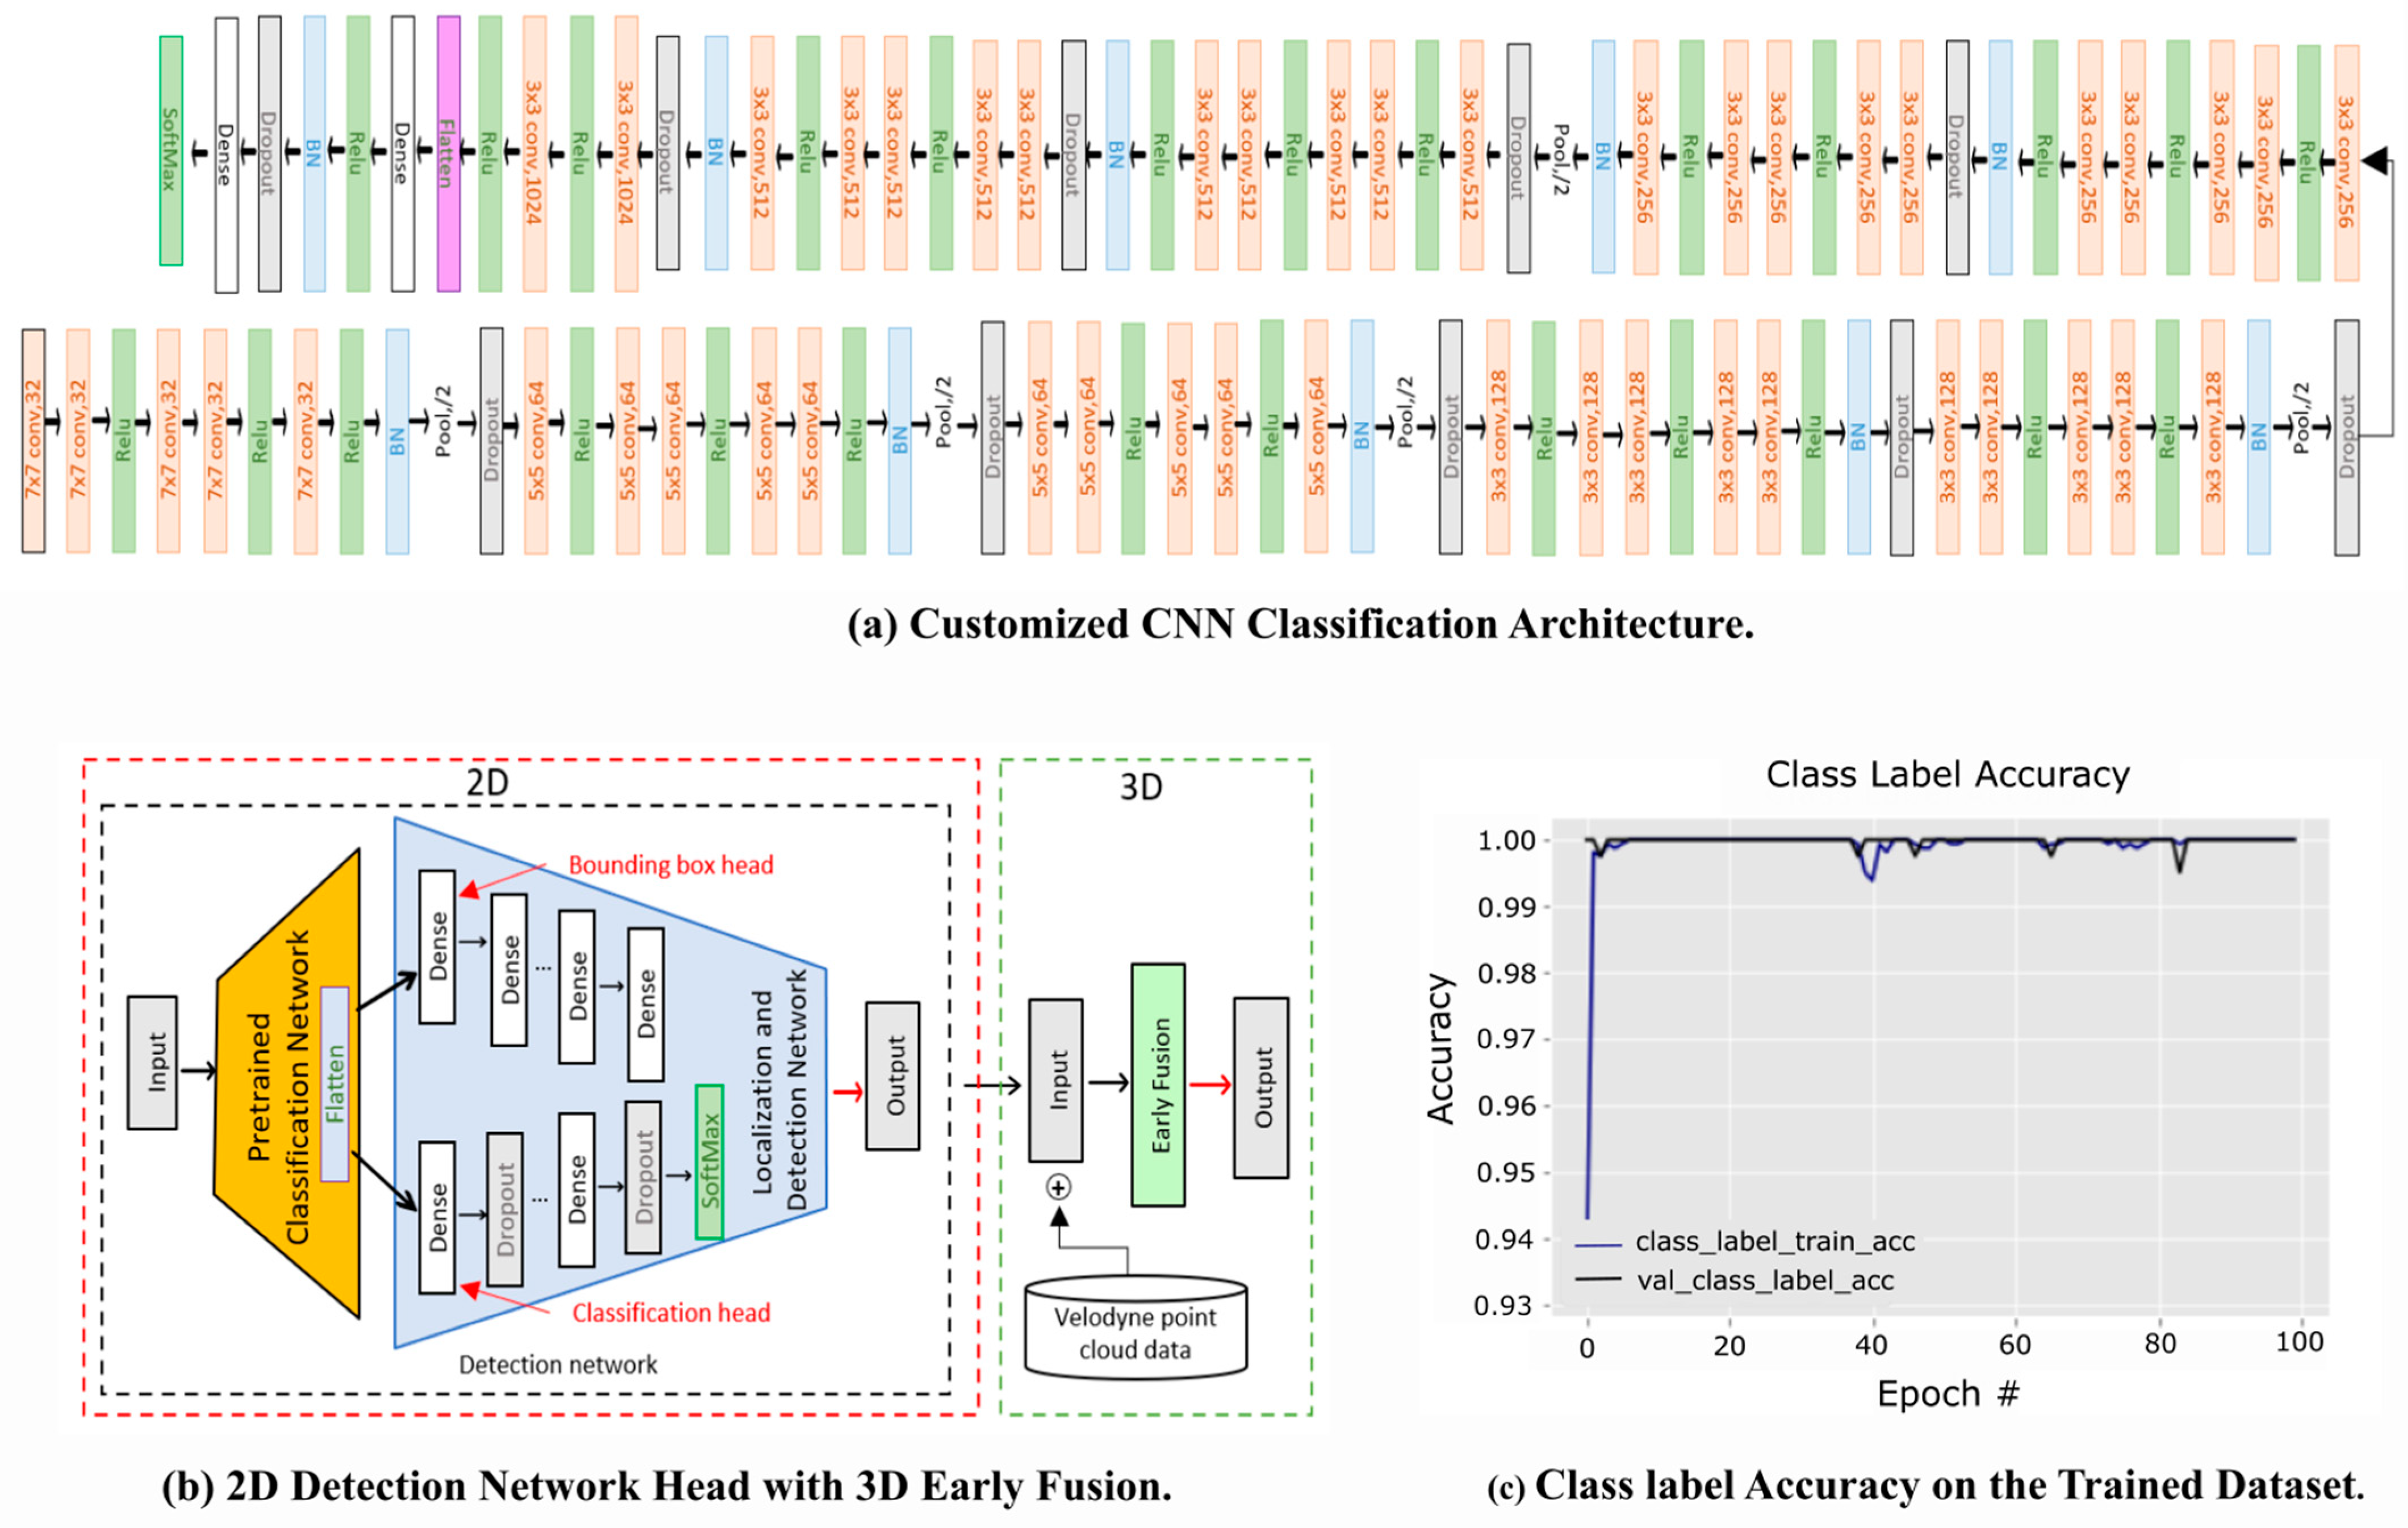
  • We introduced a new customized classification CNNs model for classifying abnormal objects. In addition, we fused a lightweight detector network on top of the classification head for performing object detection and classification. Finally, the proposed model has been trained and evaluated on the benchmark dataset.
  • We performed early fusion on the gimble camera 2D data and 3D point cloud LiDAR data to locate the abnormal object using customized CNN. We tracked the fused abnormal object tube for constructing a synchronized smooth synopsis. Furthermore, the model was tested on lightweight drones such as Tello, Parrot Mambo, Mavic 2, Mavic 3, and Anafi Parrot
  • Extensive experiments exhibit supercilious execution of our model on different lightweight drones. Calibrating the frames to extract the background and align the foreground abnormal object network has significantly reduced the flickering effect. Finally, stitching was performed on the foreground and respective background, thus creating a compact drone video synopsis.
To our knowledge, this is the first study to construct the abnormal object drone video synopsis, in which we tried to extract only the abnormal object tube from the fused video data, thus just obtaining a meaningful data feed for analysis. The outline of this paper is organized as follows: we first reviewed related methods in Section 2, then a detailed description of our proposed framework and its respective context is described in Section 3. Section 4 experimentally validates the potential efficiency of our proposed methods. Section 5 concludes the study.

2. Related Work

In this section, we first review related work on traditional video synopsis methodologies and discuss object detection in drones.

2.1. Traditional Video Synopsis Methodologies

Since 2006, video synopsis has been one of the crucial methods of video condensation in computer vision. In addition, a video synopsis is constructed for offline and online-based infrastructure. Offline means the live video feed becomes stored on a storage device, and then the synopsis process takes place, whereas online, the synopsis process is carried out on the live feed, thus resulting in a condensed video. The single-camera view states that the synopsis process is carried on a single camera FoV. Abnormal content-based synopsis deals with criteria-based condensation in which the synopsis is created for a particular scenario. Based on the deployment, we have categorized these studies as offline + single camera view + object-based, online + single camera view + object-based, and offline + single camera view + abnormal content-based.
Initially, Rav-Acha et al. [13] proposed a low-level optimization technique that was used in the low-level synopsis framework based on Markov random field (MRF). Using the simulated annealing, they tracked the action while shifting the object in time and domain space. On the other hand, Pritch et al. [14] constructed an endless synopsis using the query-based approach keeping in mind the collision of the object problem. They implemented a set theory approach to reduce collision and thus extract tubes using the mean shift algorithm; however, their method was computationally expensive. Therefore, it made it challenging to construct a synopsis in a real-world video surveillance application. In another study, Pritch et al. [15] combined the activities from different spaces by maintaining the spatial location using a nonchronological to reduce memory consumption. Their approach analyzed temporal and spatial video sequences and extracted only the informative video sequence. For constructing a simple synopsis, they have only considered moving objects. In contrast, Wang et al. [16] proposed faster browsing of synopsis by implementing inter-frame coding and an intra-frame coding concept, which boosted the video browsing scale. Unlike the temporal shifting, Nie et al. [17] suggested a shift in both the temporal and spatial axis of activities moved to create a condensed video in compact synopsis using an alpha-beta cut; understanding the outline was tricky in this study because of the background. Finally, Li et al. [18] extracted a small clip of activities and found a relationship among them using a greedy approach in the effective synopsis technique. Moussa and Shoitan [19] incorporated a convolution neural network (CNN) model to detect and extract the object for creating a synopsis. They used a swarm algorithm for energy minimization; however, their study suffered from high computational complexity, and thus it took lots of time to create a synopsis.
Above all mentioned are offline methods; in the online approach, essential activities are extracted using pixel-based analysis. Vural and Akgul [20] applied eye-gaze tracking for subtracting a frequency-based background; they used dynamic programming for the nonlinear image to form a pipeline to create a synopsis. Feng et al. [21] suggested an online background selection and synopsis generation using a table-driven strategy and a descriptor-based foreground; they extracted and aligned the stored object tracks. Similarly, Huang et al. [22] implemented object detection and tracking along with maximum posterior estimation for tube alignment such that the tubes were stitched using a table-driven method. They also improved the video retrieval by implementing a low complexity range tree strategy for creating a synopsis that suffers from a sufficient drop of frames. In abnormal content-based synopsis, an event-based template matching phenomenon was used to cluster a homogenous set of objects. The criteria for entry and exit were fixed in the camera. Chou et al. [23] selected that the activity beyond the template will be considered abnormal for constructing an event video synopsis. Similarly, Lin et al. [24] incorporated a local patch of occurrence to find anomalies, where they used a sequence optimization for extraction and visualizing the activities in the synopsis. Whereas Ahmed et al. [25] trained a CNN model to detect the car and bike to create a synopsis based on user query requirements, for which the background and foreground segmentation was carried out by a gaussian mixture model (GMM) using a sticky algorithm for creating a synopsis. Most of the study mentioned above suffers from high memory usage, dense input feed, background synthesis, relationship association, and collision [26]. Thus, it leaves a larger scope for improving the synopsis methodology.

2.2. Object Detection in Drones

CNN-based object detection models are more efficient and powerful than traditional handcrafted detection models such as HOG [27] and SIFT [28]. CNN automatically extract and learn high-level feature; the detection and classification model such as ResNet [29], Faster R-CNN [30], Yolov3 [31], SSD [32] have accomplished state-of-the-art result on benchmark datasets such as PASCAL VOC [33] and ImageNet [34], and so forth. However, these models’ architecture cannot take the in-depth advantage of changeable illumination conditions object semantics features captured by the drone [35], although this network is responsible for detecting multi-scale objects.
Razakarivony and Jurie [36] proposed a new dataset to test the UAV using an object detection model to locate objects such as vehicles and landmarks. Leira et al. [37] classified various images captured from the drone concerning their class labels; in their study, they built the relationship among nodes using a robot operating system (ROS). Similarly, Lee et al. [38] used a ROS package to make a robot application. Additionally, they incorporated the amazon web services platform for object detection performed by a drone using an R-CNN model to detect simple objects such as a banana, mug cup, mouse, and screwdriver. Furthermore, they tested their approach on a parrot simulator (AR. Drone 2.0) and achieved a satisfactory result.

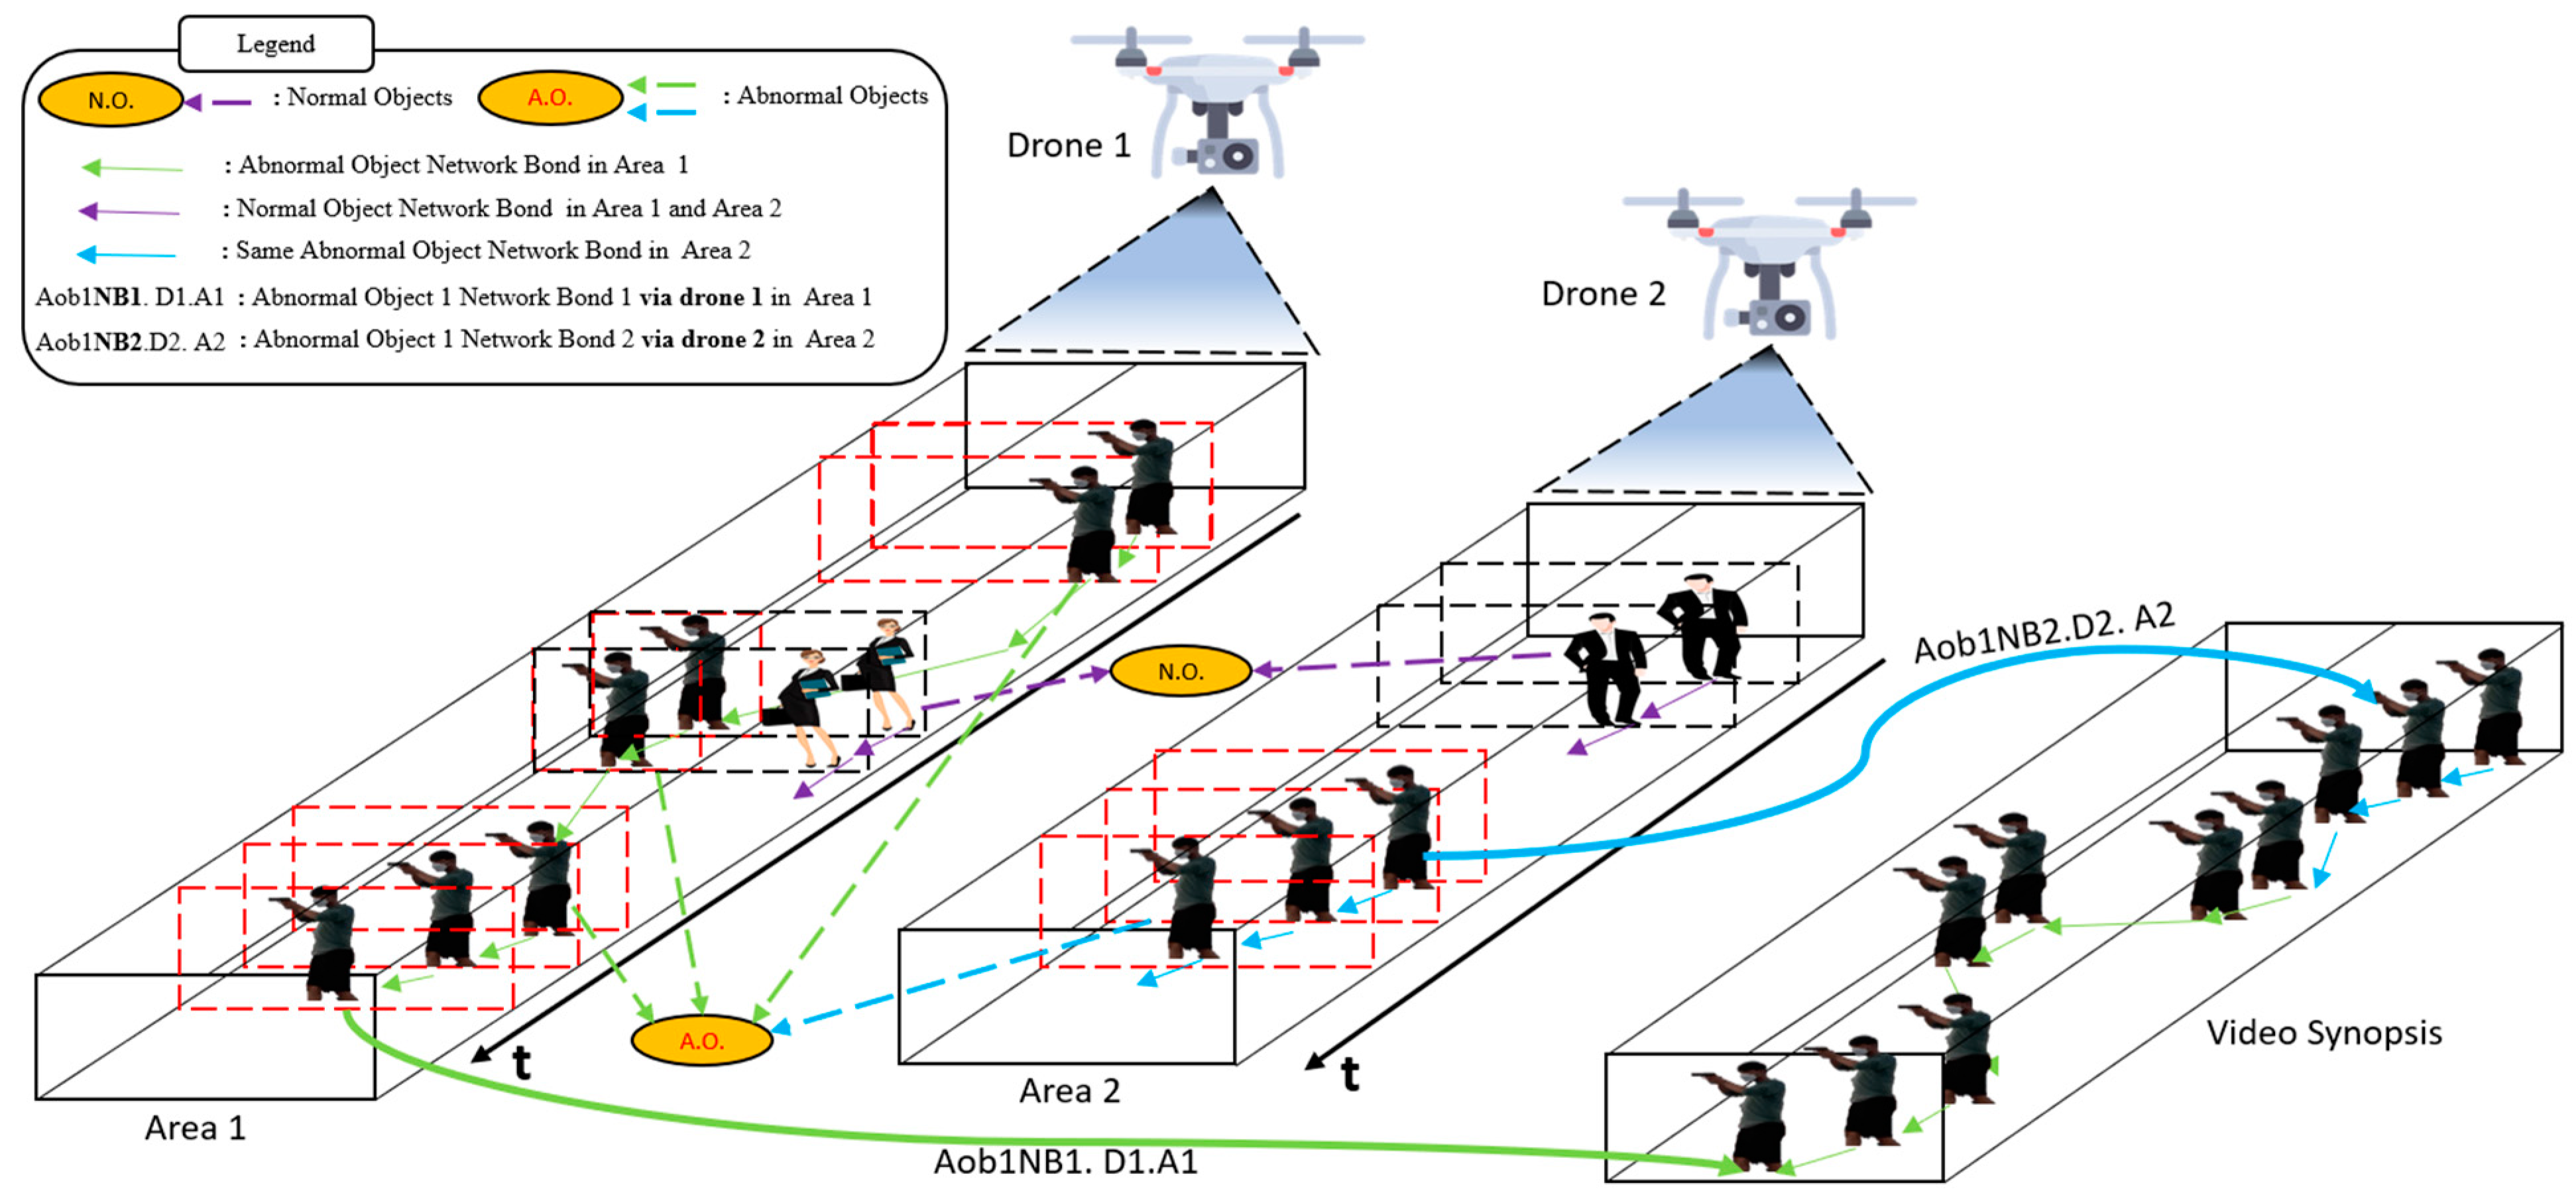
2.3. Problem Definition

Multiple drone surveillance systems are complex as they involve different sensor and ground control stations for communicating with each other and synchronizing the task. Surveillance drones are equipped with lightweight hardware to increase the flight time; thus, they possess limited storage and computational capacity. Autonomous drones are responsible for monitoring and recording 2D camera feeds, and also, they are accountable for generating and capturing the point cloud LiDAR data. This generated data causes storage scarcity. The traditional method to reduce the camera feed is video synopsis. Video synopsis is an extraction of the foreground object in time and domain space, thus creating a compact video. The existing synopsis methodology suffers from various challenges:
  • Background synthesis: Generating the chronological ordering of objects synced with the background is inconsistent. While stitching the foreground objects creates a collision and merging of the entities. It is a time and memory-intensive task; thus, these methods are insufficient for a longer dynamic video sequence [23].
  • Dense video inputs: It isn’t easy to recognize the faster-moving objects in crowded scenarios, and the distinguished relationship among them is relatively slow. Thus, the synopsis obtained is not redundant; understanding the visual content is confusing and distorted [25].
  • Demand-based synopsis: Most of the constructed video synopsis is not flexible to view as it does not meet the observer’s demands. A synopsis framework should provide a platform to build a synopsis based on the observer parameters. It will create an additional task to view only important objects based on an observer’s demand, thus creating a collision [26].
  • Wider baseline and large parallax: Stitching is one of the major components of video surveillance systems. The wider baseline angle can cause irregular artifacts and distortion as the surveillance cameras are distributed in the stitched video. Mainly parallax contributes to the ghosting and the blurring in the stitched frames. These problems can be dealt with using deep learning-based semantic matching and optimization based on seam and mesh [26].
So, to overcome these problems, in this study, we perform the fusion of sensors, that is, the 2D camera and LiDAR data; from this fused data, we just extract the abnormal object in time and domain space which is depicted in Figure 2. This is the first study to conduct a drone video synopsis, focusing mainly on constructing a synopsis only for the abnormal object.

3. DVS Framework

In this section, the DVS framework for abnormal behavior is proposed. It supports synchronous detection and extraction of only abnormal foreground objects in time and domain space, thus creating a shorter video for analysis and storage. As various components and their methodology are parallel working together to construct a DVS, we divide a DVS into two views for better understanding: (a) the system view defines the outline of the framework (b) the processing view provides the detailed functions of the framework.

3.1. System View of DVS

The DVS system view showcases various components’ amalgamation to construct the synopsis, so let V   be the resultant synopsis and f g a l l be the foreground object in the V . We have shortly summarized the system view depicted in Figure 3 in the following section.
There can be multiple objects in one single video frame. Any object’s continuous follow-up/track/path is stated as object network bond (ONB). Firstly, the drone becomes triggered by the local camera server when an abnormal object is detected; the drone flight station controls the drone via a base station. The drone server carries out object detection and early fusion on receiving the video footage and LiDAR data [39].
For performing a detection, a customized CNN model is used; the detailed configuration of the model is given in Section 3.2.1. The trajectories of the tracked O N B are maintained concerning the key timestamp, so later, they can be rearranged. For each associated video, a background is extracted, which is denoted as M b g . Then the extracted abnormal O N B are stitched with the respective background to construct the synopsis, where p t h is the frame position, n is the total number of the frame in a video, q t h is the object position in the frame, and r   t h is the abnormal object position in the frame, and r t o t a l is a total number of abnormal objects. Thus, the total number of abnormal objects in the DVS can be depicted in Equation (1).
V = p = 1 n [ M b g ×   q = 1 r t o t a l F g q p ]
The detailed functional working of the DVS is described in Section 3.2, the process view.

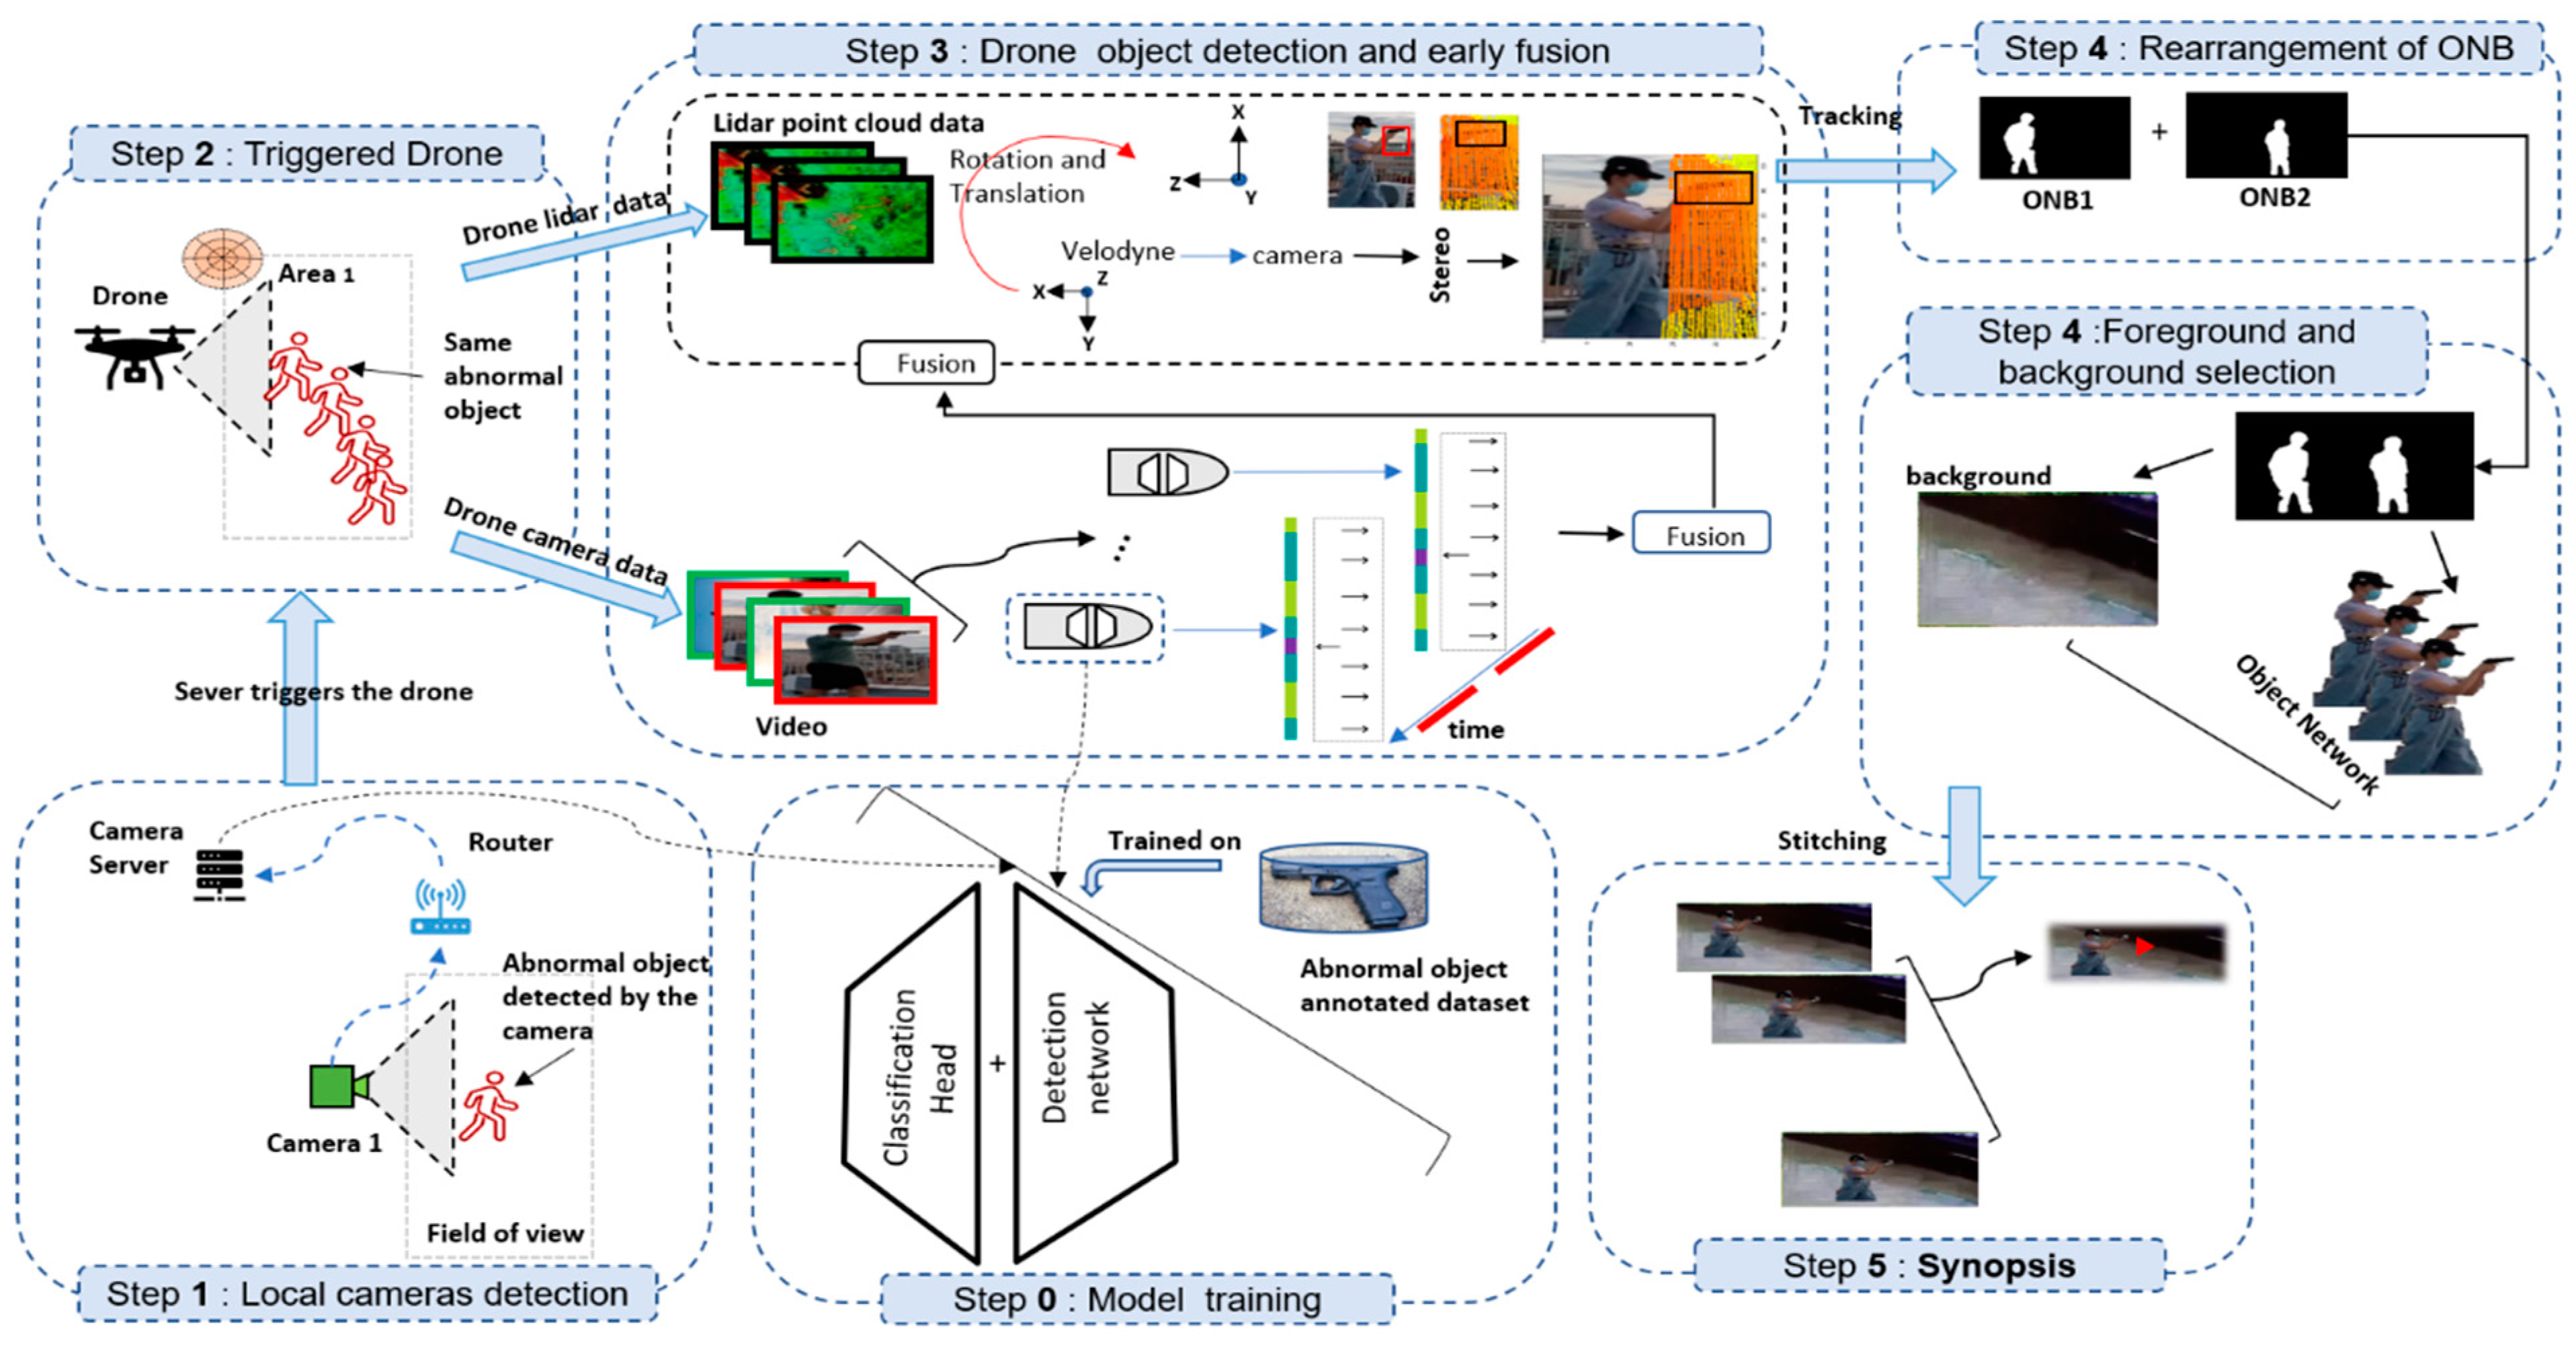
3.2. Process View of DVS

DVS process view represents the operational functioning of each component in detail. The DVS framework is split into the following steps: model training, local camera detection, triggered drone, drone object detection, and early fusion, rearrangement of ONB and foreground and background selection, and finally, synopsis as it is depicted in Figure 4.

3.2.1. Model Training

Considering the scenario, the primary goal was to detect the smaller object (e.g., a revolver). In the past years, the CNN model has achieved exceptional results on challenging datasets. However, detecting the smaller object was challenging. Therefore, we proposed a classification model; we carefully engineered all the model blocks to meet the desired goal through extensive experiments. The model consists of 47 convolutional (Conv) blocks, ten batch normalization (BN), and dropout layers for extracting the feature map. The layer arrangement is represented in Figure 5a. The classification model architecture accepts 256 × 256 × 3 as an input size and a filter of 32 with a kernel of 3 × 3 initially. BN enables training the network intensely by stabilizing the learning. A pooling of 2 × 2 is used for learning low-level features. Twenty-five percentage of dropout is applied for randomly disconnecting the nodes, thus reducing the overfitting. Rectified linear unit (RELU) is incorporated for activation. Stochastic gradient optimization (SGD) technique was used with a learning rate of ( l r = 0.005 ) to train the model on ImageNet and Pascal VOC 2007 dataset.
A lightweight detector node is depicted in Figure 5b. The pretrained classification model is fine-tuned on the Caltech-256 object category dataset [40] for detecting and classifying the anomaly object (e.g., revolver, rifle, airplane) other than this object is classified as a normal object. The detector node consists of two branches; the first branch uses a simplified multiclass bounding box for the regressor to locate the object in the frame. The second branch is responsible for classifying the object. Finally, while training the model, the Adam optimizer is used. Step 0 is a preprocessing stage in which we trained the CNN detector for classifying and locating an anomaly object. The final video synopsis classification model has been trained on the union of Pascal VOC 2007 and ImageNet dataset, and the detection head was fined tuned on the Caltech-256 object category dataset, where the training and validation class label accuracy of the model is depicted in Figure 5c.

3.2.2. Local Camera Detection

In Step 1, the local cameras perform surveillance for a fixed FoV using a pre-trained CNN detector. On detecting the anomaly object, the local camera server triggers the drone flight station server (DFSS) by sending the longitude and latitude of the location.

3.2.3. Triggered Drone

On receiving the location of the anomaly object from Step 1. In Step 2, the DFSS triggers the nearby drone by sending the longitude and latitude. Next, the drone uses a mounted global positioning system (GPS) to find the location following the GNSS standard. Then, the drone uses the CNN detector to locate the object and track the thing using the Kalman filter. As flight hours of the drone depend on the area allocated for the surveillance. On crossing the predetermined area during monitoring, the drone will send the present location of the object through depth-sensing using LiDAR. Additionally, it will send the site’s longitude, latitude, and altitude to the DFSS, further triggering another drone in the respective area for surveillance via the base station.

3.2.4. Drone Object Detection and Early Fusion

On the flight, drones extract two types of data; the first is the 2D video camera data, and the second is the point cloud data obtained from LiDAR. The drone uses the CNN detector to locate the strange object and regular object in corresponding video frames. For example, let β ( 0 ,   1 ) , where β = 0 indicates the desired anomaly object is absent in a given frame, and it is marked for exclusion and if the β = 1 , then the anomaly object is present in the given frame. Therefore, only the anomaly object frames are stored in a matrix form; all other regular objects are eliminated. Then, early fusion is performed on the stored frames, thus determining the depth of an object. Early fusion can be determined by the following steps first projecting the point cloud (3D) on the desired image (2D) and then, secondly detection and fusion. So, a point in a LiDAR coordinate is in the form of ( X , Z , Y ) ; we need to convert it to a camera state ( Z , Y , X ) , so to do this, we perform rotation and translation. Finlay, we perform a stereo rectifier and camera calibration to find a pixel in the frame ( Y , X ) . The generalized formula to project a point on an image is:
P Y = P × R 0 × R | t × P X
P Y is a point in 2D pixels, P is an intrinsic matrix, R 0 is rectification, R | T is a rotation and translation of LiDAR to camera matrix, and P X is a point in 3D. Finally, the resultant fused object is tracked using the Kalman filter in Step 3 to create an ONB in Step 4.

3.2.5. Rearrangement and Selection of Foreground and Background

Based on the obtained key timestamp of the stored fused abnormal frames. The background and foreground become extracted using pixel-based adaptive segmentation. Then, the O N B becomes constructed for each anomaly object from the obtained foreground. There can be multiple abnormal objects in the a-frame, so from r t o t a l   O N B 1 t o t a l is the first foreground anomaly object sequence, and O N B 2 t o t a l   is another anomaly object, respectively. Concerning the key timestamp sequence and the space domain (i.e., the threshold of the shift of the object from one space-time to another), the O N B rearrangement takes place in step 4. As a result, it creates a template of the background and the foreground objects.

3.2.6. Synopsis

The obtained background template and the abnormal foreground object networks are stitched together in Step 5 to construct the synopsis in the stitching process. The stitching process is initiated with a stitching pipeline, and finally, frames register and blend, thus creating a smooth shorter video.

4. Experimental Results

As there are different entities in the proposed DVS framework, thus there was a need to evaluate these entities on their respective benchmarks. We used an AMD Ryzen 5 3600X 6 core processor with a clock speed of 3.59 GHz and 16 GB Ram to train the classification and detection model. The classification model has been taught on the union of Pascal VOC 2007 and the ImageNet dataset. Pascal VOC 2007 dataset mainly contains twenty object classes, whereas the ImageNet dataset contains one thousand object classes. In addition, the Caltech-256 object category dataset that accommodates two hundred and fifty-six object classes was introduced on the detection head. We consider only aero-planes, bikes, police vans, and revolvers as abnormal objects from the trained objects while creating the abnormal drone video synopsis. We incorporated an Nvidia gigabyte GeForce RTX 2060 for graphic processing to test the model. For testing the model, we used the Logitech C920 Pro HD camera. The comparative results of the proposed model with the existing state-of-the-art models are given in Table 1. The accuracy of the classification model is 89%, and the mAP obtained by the object detector is 85.97%, the given accuracy metrics available in [41].
We tried and simulated the proposed model on lightweight drones such as Tello, Parrot Mambo, Mavic 2, Mavic 3, and Anafi Parrot in a controlled environment for validating the model on a resource-constrained device. The exchange of parameters between the different nodes was carried out using the ROS with A.R Parrot to trigger another drone node based on the GPS parameters. The Tello drone has a fixed front view camera with dimensions of 2592 × 1936, whereas the Parrot Mambo has a fixed down view camera whose dimension is 1280 × 720; during the simulation, a huge loss of pixels was seen in the video feed. Mavic 2 and Mavic 3 have a gimble camera with a degree of rotation from 135 to 100 with a dimension of 1920 × 1080 computationally; the video feed obtained from Mavic 3 is stable and better than Mavic 2. Anafi Parrot has a gimble camera with a degree of 180 and a dimension of 2704 × 1520, such that the results video feed is far more stable than other drones, and the inference result of the model on the different drones is given in Table 2. We tried to converge the models on the drone hardware to predicate the abnormal objects. At which rate the object is predicated can be determined by loading and inference, which states the computational cost [41].
We used the Velodyne KITTI dataset [43] to perform the early fusion, which consists of the point cloud and the respective gimbal camera video footage. We also used customized LiDAR point cloud data to segment an abnormal object. Visualization of the segmented abnormal objects in a LiDAR point cloud data is depicted in Figure 6. The drone mounted with LiDAR (i.e., Velodyne Puck LITE) was used to obtain the point cloud data for the abnormal object. The result of the early fusion and the object detection is illustrated in Figure 7. Firstly, we projected the point cloud on the images depicted in Figure 7(a2,b2,c2). Next, the distance of the object from the center point of projection and the detection of the objects is shown in the fourth row of Figure 7(a3,b3,c3).
While testing the model on the Tello DJI drone, the distance between the abnormal object and the drone camera was in close proximity for demonstration. Therefore, the pre-trained customized CNN model was incorporated for detection. In addition, the generated bounding box values of the abnormal object were utilized for calibrating the proportional integral derivative (PID) values. These PID values are used to stay in the center of the video frame while tracking the abnormal object, thus controlling the undershooting, and overshooting of the drone while detecting and tracking the object using the PID is shown in Figure 8.
Simulation of the drone communication with the ground station is depicted in Figure 9. On the drone side for the simulation, we used ardupilot and software in the loop (SITL), whereas the communication becomes initiated using mavlink protocol with the ground station. On the ground station, we relied on the DroneKit for passing the commands, and the mission planner provided the visualization of the drone. The simulation allows visualizing parameters such as longitude, latitude, flight height, direction, speed, and battery power concerning the drone and its surveillance area. The real-time drone parameters were communicated across different drones in the flight based on their area of surveillance.
We shot eight videos of the desired abnormal object in a controlled environment. The video consists of different challenge artifacts such as occlusion, background clutter, illumination, etc. The first video ( v 1 ) contains two anomaly objects and one normal object; the second video ( v 2 ) contains one abnormal and one normal object, and the third video ( v 3 ) only contains one abnormal object and lastly, videos ( v 4 ) ,   ( v 5 ) , ( v 6 ) ,   ( v 7 ) , and ( v 8 ) contain one abnormal and one normal object. The experimental results of the obtained synopsis for the respective video are shown in Table 3. The intermediate results of the DVS framework during the synopsis process are shown in Figure 10. The first row of Figure 10(a1,a2) indicates the extraction of the A o b 1 N B 1 f g 1 (Abnormal object 1 network bond 1) and A o b 2 N B 1 f g 2 (Abnormal object 2 network bond 1); it means that there are two abnormal objects in the video which become extracted in the form of a segmentation mask. Where Figure 10(a3) shows the summation of abnormal objects from different time and space zones ( f g 1 + f g 2 ), and Figure 10(a4) shows the extracted background (bg). Finally, the summed abnormal foreground masked object is stitched with the background ( s u m + b g ) shown in Figure 10(a5). The second row of Figure 10(b1) shows an abnormal object with a revolver, Figure 10(b2) indicates only one strange object network in the video ( A o b 1 N B 1 f g ), and Figure 10(b3) is the extracted background (bg). Whereas stitching in the synopsis is a process of combining multiple foreground masks on a background with an overlapping field of view in the space domain. We stitch the abnormal foreground object to the concerning obtained background in a sequence, thus maintaining the synchronization between the object path. Stitching the foreground mask with the background is shown in Figure 10(b4) ( f g + b g ), and a final glance of the synopsis frame is shown in Figure 10(b5) in an RGB form.
As we experimented in a very controlled environment, the quality of the obtained video was very high for the detection, so the resultant synopsis videos were without noise and distortion. As well, there was no collision as we created the synopsis for only strange objects. As it was a pilot experiment, we successfully exchanged the parameters between different components of DVS. As a result, DVS obtained a satisfactory result on the dataset for creating the synopsis.

5. Discussion

As drone video synopsis is a complex problem consisting of different sensors and methodologies to complete the synopsis task, as it’s a pilot experiment, we came across various challenges concerning fusion [44] and the coordination between the sensors [45,46]. Today, the proposed method is the only kind and the first study conducting drone video synopsis. Because of this, there is no standard benchmark to evaluate the studies on different component levels. To utilize the drone resources effectively and efficiently, therefore, we performed the fusion of LiDAR and 2D camera data, and on fused data, we used a proposed model for detecting and extracting the abnormal object, thus creating a synopsis only for the abnormal object. While performing LiDAR point cloud data fusion with the original video footage frames, we saw a flickering effect. While doing the merge, such an effect was seen when the line of sight of the video footage was not properly matched with the point cloud data.
Furthermore, we saw a drop of frames while extracting the abnormal object from Tello and Parrot Mambo drone; this effect was mainly seen because, on the flight, the drone suffered from vibration. Therefore, we focused only on extracting the abnormal object for creating the synopsis. The state-of-the-art methodology that deals with video synopsis only focuses on 2D camera data. Thus, to evaluate the study on different components level and methodologies, we used standardized datasets such as Caltech-256, ImageNet, VOC 2007, and Velodyne KITTI. Additionally, we evaluated the study on customized, challenging videos consisting of abnormal objects. Finally, we tested the proposed model on the Tello, Parrot Mambo, Mavic 2, Mavic 3, and Anafi Parrot drone.

6. Conclusions

Drone video synopsis in smart cities enables sensor fusion, which helps to manage the storage and analyze the obtained data efficiently. Hyperconnectivity in smart cities provides reliable communication between multiple drones for accomplishing a single task. This study introduces a DVS to accurately detect and extract the abnormal object by fusing the 2D camera and 3D point cloud data to construct an abnormal object synopsis. We effectively synchronized, controlled, and exchanged the parameters between all the entities of the DVS and demonstrated the use of smart city infrastructure. This has allowed us to conduct a pilot experiment in a controlled simulation successfully. As a result, we achieved an mAP of 85.97% for detection, which helped us locate and extract only the abnormal objects from the video, thus constructing a more petite abnormal object video. In DVS, there are so many components working together through extensive experiments we fine-tuned each of them to achieve the desired results. As a result, the DVS framework has constructed an abnormal synopsis without any jitteriness, distortion, or noise. Future work will implement the DVS on the matrices 300, which can carry a LiDAR payload, thus enhancing the infrastructure for real-time synopsis. Additionally, we want to train the 3D object detector on more strange objects for classification and segmentation, thus extracting a 3D object tube from different multiview to construct a panoramic view synopsis.

Author Contributions

The authors contributed to this paper as follows: P.Y.I. wrote this article, designed the system framework, and conducted experimental evaluation; Y.K. performed checks of the manuscripts; Y.-G.K. supervised and coordinated the investigation. All authors have read and agreed to the published version of the manuscript.

Funding

This work was supported by the Institute of Information and Communications Technology Planning and Evaluation (IITP) grant funded by the Korean government (MSIT) (No.2019-0-00231, Development of artificial intelligence-based video security technology and systems for public infrastructure safety).

Data Availability Statement

The data presented in this study are available on request from the corresponding author.

Conflicts of Interest

The authors declare no conflict of interest.

References

  1. Parrott, E.; Panter, H.; Morrissey, J.; Bezombes, F. A low cost approach to disturbed soil detection using low altitude digital imagery from an unmanned aerial vehicle. Drones 2019, 3, 50. [Google Scholar] [CrossRef]
  2. Doherty, P.; Rudol, P. A UAV search and rescue scenario with human body detection and geolocalization. In Proceedings of the Australasian Joint Conference on Artificial Intelligence, Gold Coast, Australia, 2–6 December 2007; pp. 1–13. [Google Scholar]
  3. Sa, I.; Hrabar, S.; Corke, P. Outdoor flight testing of a pole inspection UAV incorporating high-speed vision. In Field and Service Robotics; Springer: Cham, Switzerland, 2015; pp. 107–121. [Google Scholar]
  4. Gleason, J.; Nefian, A.V.; Bouyssounousse, X.; Fong, T.; Bebis, G. Vehicle detection from aerial imagery. In Proceedings of the 2011 IEEE International Conference on Robotics and Automation, Shanghai, China, 9–13 May 2011; pp. 2065–2070. [Google Scholar]
  5. Tang, T.; Deng, Z.; Zhou, S.; Lei, L.; Zou, H. Fast vehicle detection in UAV images. In Proceedings of the 2017 International Workshop on Remote Sensing with Intelligent Processing (RSIP), Shanghai, China, 18–21 May 2017; pp. 1–5. [Google Scholar]
  6. Kim, S.J.; Lim, G.J.; Cho, J. Drone flight scheduling under uncertainty on battery duration and air temperature. Comput. Ind. Eng. 2018, 117, 291–302. [Google Scholar] [CrossRef]
  7. Dogru, S.; Marques, L. Drone Detection Using Sparse Lidar Measurements. IEEE Robot. Autom. Lett. 2022, 7, 3062–3069. [Google Scholar] [CrossRef]
  8. United Nations Office on Drugs and Crime (UNODC). Global Study on Homicide 2019. Data: UNODC Homicide Statistics 2019. Available online: https://www.unodc.org/documents/data-and-analysis/gsh/Booklet_5.pdf (accessed on 1 March 2022).
  9. Mirzaeinia, A.; Hassanalian, M. Minimum-cost drone–nest matching through the kuhn–munkres algorithm in smart cities: Energy management and efficiency enhancement. Aerospace 2019, 6, 125. [Google Scholar] [CrossRef]
  10. Sharma, V.; You, I.; Pau, G.; Collotta, M.; Lim, J.D.; Kim, J.N. LoRaWAN-based energy-efficient surveillance by drones for intelligent transportation systems. Energies 2018, 11, 573. [Google Scholar] [CrossRef]
  11. Baskurt, K.B.; Samet, R. Video synopsis: A survey. Comput. Vis. Image Underst. 2019, 181, 26–38. [Google Scholar] [CrossRef]
  12. Gong, Y.; Liu, X. Video summarization with minimal visual content redundancies. In Proceedings of the 2001 International Conference on Image Processing (Cat. No. 01CH37205), Thessaloniki, Greece, 7–10 October 2001; pp. 362–365. [Google Scholar]
  13. Rav-Acha, A.; Pritch, Y.; Peleg, S. Making a long video short: Dynamic video synopsis. In Proceedings of the 2006 IEEE Computer Society Conference on Computer Vision and Pattern Recognition (CVPR’06), New York, NY, USA, 17–22 June 2006; pp. 435–441. [Google Scholar]
  14. Pritch, Y.; Rav-Acha, A.; Gutman, A.; Peleg, S. Webcam synopsis: Peeking around the world. In Proceedings of the 2007 IEEE 11th International Conference on Computer Vision, Rio de Janeiro, Brazil, 14–21 October 2007; pp. 1–8. [Google Scholar]
  15. Pritch, Y.; Rav-Acha, A.; Peleg, S. Nonchronological video synopsis and indexing. IEEE Trans. Pattern Anal. Mach. Intell. 2008, 30, 1971–1984. [Google Scholar] [CrossRef]
  16. Wang, S.; Liu, H.; Xie, D.; Zeng, B. A novel scheme to code object flags for video synopsis. In Proceedings of the 2012 Visual Communications and Image Processing, San Diego, CA, USA, 27–30 November 2012; pp. 1–5. [Google Scholar]
  17. Nie, Y.; Xiao, C.; Sun, H.; Li, P. Compact video synopsis via global spatiotemporal optimization. IEEE Trans. Vis. Comput. Graph. 2012, 19, 1664–1676. [Google Scholar] [CrossRef]
  18. Li, K.; Yan, B.; Wang, W.; Gharavi, H. An effective video synopsis approach with seam carving. IEEE Signal Process. Lett. 2015, 23, 11–14. [Google Scholar] [CrossRef]
  19. Moussa, M.M.; Shoitan, R. Object-based video synopsis approach using particle swarm optimization. Signal Image Video Process. 2021, 15, 761–768. [Google Scholar] [CrossRef]
  20. Vural, U.; Akgul, Y.S. Eye-gaze based real-time surveillance video synopsis. Pattern Recognit. Lett. 2009, 30, 1151–1159. [Google Scholar] [CrossRef]
  21. Feng, S.; Liao, S.; Yuan, Z.; Li, S.Z. Online principal background selection for video synopsis. In Proceedings of the 2010 20th International Conference on Pattern Recognition, Istanbul, Turkey, 23–26 August 2010; pp. 17–20. [Google Scholar]
  22. Huang, C.-R.; Chung, P.-C.J.; Yang, D.-K.; Chen, H.-C.; Huang, G.-J. Maximum a posteriori probability estimation for online surveillance video synopsis. IEEE Trans. Circuits Syst. Video Technol. 2014, 24, 1417–1429. [Google Scholar] [CrossRef]
  23. Chou, C.-L.; Lin, C.-H.; Chiang, T.-H.; Chen, H.-T.; Lee, S.-Y. Coherent event-based surveillance video synopsis using trajectory clustering. In Proceedings of the 2015 IEEE International Conference on Multimedia & Expo Workshops (ICMEW), Turin, Italy, 29 June–3 July 2015; pp. 1–6. [Google Scholar]
  24. Lin, W.; Zhang, Y.; Lu, J.; Zhou, B.; Wang, J.; Zhou, Y. Summarizing surveillance videos with local-patch-learning-based abnormality detection, blob sequence optimization, and type-based synopsis. Neurocomputing 2015, 155, 84–98. [Google Scholar] [CrossRef]
  25. Ahmed, S.A.; Dogra, D.P.; Kar, S.; Patnaik, R.; Lee, S.-C.; Choi, H.; Nam, G.P.; Kim, I.-J. Query-based video synopsis for intelligent traffic monitoring applications. IEEE Trans. Intell. Transp. Syst. 2019, 21, 3457–3468. [Google Scholar] [CrossRef]
  26. Mahapatra, A.; Sa, P.K. Video Synopsis: A Systematic Review. In High Performance Vision Intelligence; Springer: Singapore, 2020; pp. 101–115. [Google Scholar]
  27. Dalal, N.; Triggs, B. Histograms of oriented gradients for human detection. In Proceedings of the 2005 IEEE Computer Society Conference on Computer Vision and Pattern Recognition (CVPR’05), San Diego, CA, USA, 20–25 June 2005; pp. 886–893. [Google Scholar]
  28. Lowe, D.G. Distinctive image features from scale-invariant keypoints. Int. J. Comput. Vis. 2004, 60, 91–110. [Google Scholar] [CrossRef]
  29. He, K.; Zhang, X.; Ren, S.; Sun, J. Deep residual learning for image recognition. In Proceedings of the of the IEEE Conference on Computer Vision and Pattern Recognition, Las Vegas, NV, USA, 27–30 June 2016; pp. 770–778. [Google Scholar]
  30. Girshick, R.; Donahue, J.; Darrell, T.; Malik, J. Rich feature hierarchies for accurate object detection and semantic segmentation. In Proceedings of the IEEE conference on Computer Vision and Pattern Recognition, Columbus, OH, USA, 23–28 June 2014; pp. 580–587. [Google Scholar]
  31. Redmon, J.; Farhadi, A. Yolov3: An incremental improvement. arXiv 2018, arXiv:1804.02767. [Google Scholar]
  32. Liu, W.; Anguelov, D.; Erhan, D.; Szegedy, C.; Reed, S.; Fu, C.-Y.; Berg, A.C. Ssd: Single shot multibox detector. In Proceedings of the European Conference on Computer Vision, Amsterdam, The Netherlands, 11–14 October 2016; pp. 21–37. [Google Scholar]
  33. Everingham, M.; Eslami, S.; Van Gool, L.; Williams, C.K.; Winn, J.; Zisserman, A. The pascal visual object classes challenge: A retrospective. Int. J. Comput. Vis. 2015, 111, 98–136. [Google Scholar] [CrossRef]
  34. Deng, J.; Dong, W.; Socher, R.; Li, L.-J.; Li, K.; Fei-Fei, L. Imagenet: A large-scale hierarchical image database. In Proceedings of the 2009 IEEE Conference on Computer Vision and Pattern Recognition, Miami, FL, USA, 20–25 June 2009; pp. 248–255. [Google Scholar]
  35. Breckon, T.P.; Barnes, S.E.; Eichner, M.L.; Wahren, K. Autonomous real-time vehicle detection from a medium-level UAV. In Proceedings of the 24th International Conference on Unmanned Air Vehicle Systems, Bristol, UK, 30 March–1 April 2009; pp. 29.21–29.29. [Google Scholar]
  36. Razakarivony, S.; Jurie, F. Vehicle detection in aerial imagery: A small target detection benchmark. J. Vis. Commun. Image Represent. 2016, 34, 187–203. [Google Scholar] [CrossRef]
  37. Leira, F.S.; Johansen, T.A.; Fossen, T.I. Automatic detection, classification and tracking of objects in the ocean surface from UAVs using a thermal camera. In Proceedings of the 2015 IEEE Aerospace Conference, Big Sky, MT, USA, 7–14 March 2015; pp. 1–10. [Google Scholar]
  38. Lee, J.; Wang, J.; Crandall, D.; Šabanović, S.; Fox, G. Real-time, cloud-based object detection for unmanned aerial vehicles. In Proceedings of the 2017 First IEEE International Conference on Robotic Computing (IRC), Taichung, Taiwan, 10–12 April 2017; pp. 36–43. [Google Scholar]
  39. Snoek, C.G.; Worring, M.; Smeulders, A.W. Early versus late fusion in semantic video analysis. In Proceedings of the 13th Annual ACM International Conference on Multimedia, Singapore, 6–11 November 2005; pp. 399–402. [Google Scholar]
  40. Griffin, G.; Holub, A.; Perona, P. Caltech-256 Object Category Dataset. Pietro 2007. Available online: https://authors.library.caltech.edu/7694/?ref=https://githubhelp.com (accessed on 13 August 2022).
  41. Panda, D.K.; Meher, S. A new Wronskian change detection model based codebook background subtraction for visual surveillance applications. J. Vis. Commun. Image Represent. 2018, 56, 52–72. [Google Scholar] [CrossRef]
  42. Zhao, Z.-Q.; Zheng, P.; Xu, S.-t.; Wu, X. Object detection with deep learning: A review. IEEE Trans. Neural Netw. Learn. Syst. 2019, 30, 3212–3232. [Google Scholar] [CrossRef]
  43. Geiger, A.; Lenz, P.; Stiller, C.; Urtasun, R. Vision meets robotics: The kitti dataset. Int. J. Robot. Res. 2013, 32, 1231–1237. [Google Scholar] [CrossRef] [Green Version]
  44. Jensen, O.B. Drone city–power, design and aerial mobility in the age of “smart cities”. Geogr. Helv. 2016, 71, 67–75. [Google Scholar] [CrossRef]
  45. Nguyen, D.D.; Rohacs, J.; Rohacs, D. Autonomous flight trajectory control system for drones in smart city traffic management. ISPRS Int. J. Geo-Inf. 2021, 10, 338. [Google Scholar] [CrossRef]
  46. Ismail, A.; Bagula, B.A.; Tuyishimire, E. Internet-of-things in motion: A uav coalition model for remote sensing in smart cities. Sensors 2018, 18, 2184. [Google Scholar] [CrossRef] [Green Version]
Figure 1. Smart city scenario in which there are two areas, Area 1-is associated with drone 1, and Area 2 with drone 2, where the space is defined by gray and black color. In Area 1, a local camera detects the abnormal object represented as red color and triggers the drone flight station for continuous surveillance of the object. When the object moves from area 1 to area 2, the drones get triggered via the base station, creating a small abnormal object synopsis in coordination with the server.
Systems 10 00170 g001
Figure 2. There are two drones, each one associated with a camera, the input feed for area 1 begins with a first-person walking while holding a gun (abnormal object; A.O), then the same first-person (i.e., A.O) is walking along the side of women (normal object; N.O), and after a patch of inactivity again the (i.e., A.O) is seen in the reaming feed. In Area 2, the feed begins with the same abnormal object walking, and after a patch of inactivity, the second person (i.e., N.O) is walking in the remaining feed. The red dotted rectangle determines the abnormal object, and the black dotted rectangle defines the normal objects. In the drone video synopsis, we create a shorter video only by extracting the abnormal object sequentially concerning the time.
Systems 10 00170 g002
Figure 3. System view of DVS framework, where + indicates the summation.
Systems 10 00170 g003
Figure 4. Overview of the DVS framework for training the CNN model, detecting the object, performing the early fusion, and extracting the abnormal object to create the synopsis. Step 0: It’s a preprocessing step in which the customized classification CNN head and detection network are trained to detect the desired object. Step 1: A local camera detects the abnormal object using the pre-trained CNN and triggers the drone server. Step 2: With the coordination of the GNSS and base station, the drone locates the object and detects the object of interest, and follows the object until the area is under surveillance. Step 3: The drone server uses the CNN model for detecting the abnormal object on which it performs the early fusion to obtain the distance of occurrence. Step 4: The foreground ONB is aligned, and the background is extracted, which is finally stitched in Step 5 for creating the synopsis.
Systems 10 00170 g004
Figure 5. The classification and detector network is represented in (a,b), whereas (c) plots the accuracy of the detector network on the trained dataset.
Systems 10 00170 g005
Figure 6. Segmentation of abnormal objects in Velodyne LiDAR point cloud data is demonstrated in the (t1t4) time frames (i.e., the red color suggests the abnormal object, whereas the green color represents the normal or background objects).
Systems 10 00170 g006
Figure 7. Early fusion and object detection results in the images. Respective input images in the first row (ac), a point cloud of the images in the second row (a1,b1,c1), third row provides the projection of the point cloud on the image (a2,b2,c2), and the fourth row is the prediction of the detector on the fused images with the distance of occurrence from the point LiDAR mounted (a3,b3,c3).
Systems 10 00170 g007
Figure 8. PID values calibration and tracking. In the first row, (p) illustrates the Tello drone and the object, and (p1) shows the coordinates values on the flight autonomous flight control.
Systems 10 00170 g008
Figure 9. Simulation of a drone communication with the ground station using software in the loop (SITL).
Systems 10 00170 g009
Figure 10. Intermediate results of DVS framework for synopsis creation.
Systems 10 00170 g010
Table 1. Comparative results on Caltech-256 object category dataset.
MethodsTrainedAeroplaneBikeBusEstate CarPersonArmy TankPolice VanRacing CarRevolverRiflemAP
R-CNN (alex) [42]07++In68.172.866.374.258.762.353.458.627.633.857.58
R-CNN(VGG16) [42]07++In73.477.075.178.173.168.857.760.138.435.963.76
GCNN [42]07++In68.377.378.579.566.652.468.5764.834.840.663.13
SubCNN [42]07++In70.280.579.078.770.260.547.972.638.245.964.37
HyperNet [42]07++In77.483.383.187.479.170.562.476.351.650.172.12
Faster R-CNN [42]07++12++In84.979.877.575.979.674.970.879.240.552.371.54
YOLO [42]07++12++In77.067.255.963.563.560.457.860.324.538.956.9
YOLOv2 [42]07++12++In79.075.078.279.375.673.563.461.630.845.666.2
SSD300 [42]07++12++In85.182.579.184.083.779.574.681.272.951.677.42
ProposedIn-----8070.0628155.069.6
Proposed07++1278.579.579.382.281.2-----80.14
Proposed07++In81.282.783.380.084.28274758360.178.55
Proposed (V.S)07++In++Cal87.288.7----80-88-85.97
‘07++In’: is union of VOC 2007 trainval and test and ImageNet trainval. ‘07++12++In’: the union of all for train, including the VOC 2012, VOC 2007, and ImageNet. ‘07++In++Cal’: is trained on the union of VOC 2007 and ImageNet and fine-tuned on Caltech-256 and the ‘-’ indicates the absence of training on that object.
Table 2. The computational cost of detecting models on different lightweight drones. Loading and inference rate is defined in seconds.
Sr.Drone TypeCamera View
(Degree)
Camera
Dimension
Mobile NetTiny-YoloProposed
LoadingInferenceLoadingInferenceLoadingInference
1TelloFixed Front View (80)2592 × 19360.0230.0380.0190.0350.090.021
2Parrot MamboFixed Down View1280 × 7200.0210.0320.0170.0280.080.019
3Mavic 2135 to 1001920 × 10800.0190.0250.0160.0220.070.016
4Mavic 3135 to 1001920 × 10800.0140.0210.0130.0180.060.014
5Anafi Parrot1802704 × 15200.090.0160.0120.0140.040.012
Table 3. Difference between the original and the synopsis video.
VideoOriginal Video (t)Frame Rate (fps)Video Length (#Frame)Number of ObjectNumber of Abnormal ObjectDrone Video Synopsis
v13.24 min244665320.55 s
v22.20 min253300210.49 s
v31.23 min231690110.34 s
v45.24 min237231211.58 s
v53.70 min235106211.07 s
v66.38 min238786212.13 s
v78.24 min2311,362212.20 s
v87.32 min2310,097211.15 s
Publisher’s Note: MDPI stays neutral with regard to jurisdictional claims in published maps and institutional affiliations.

