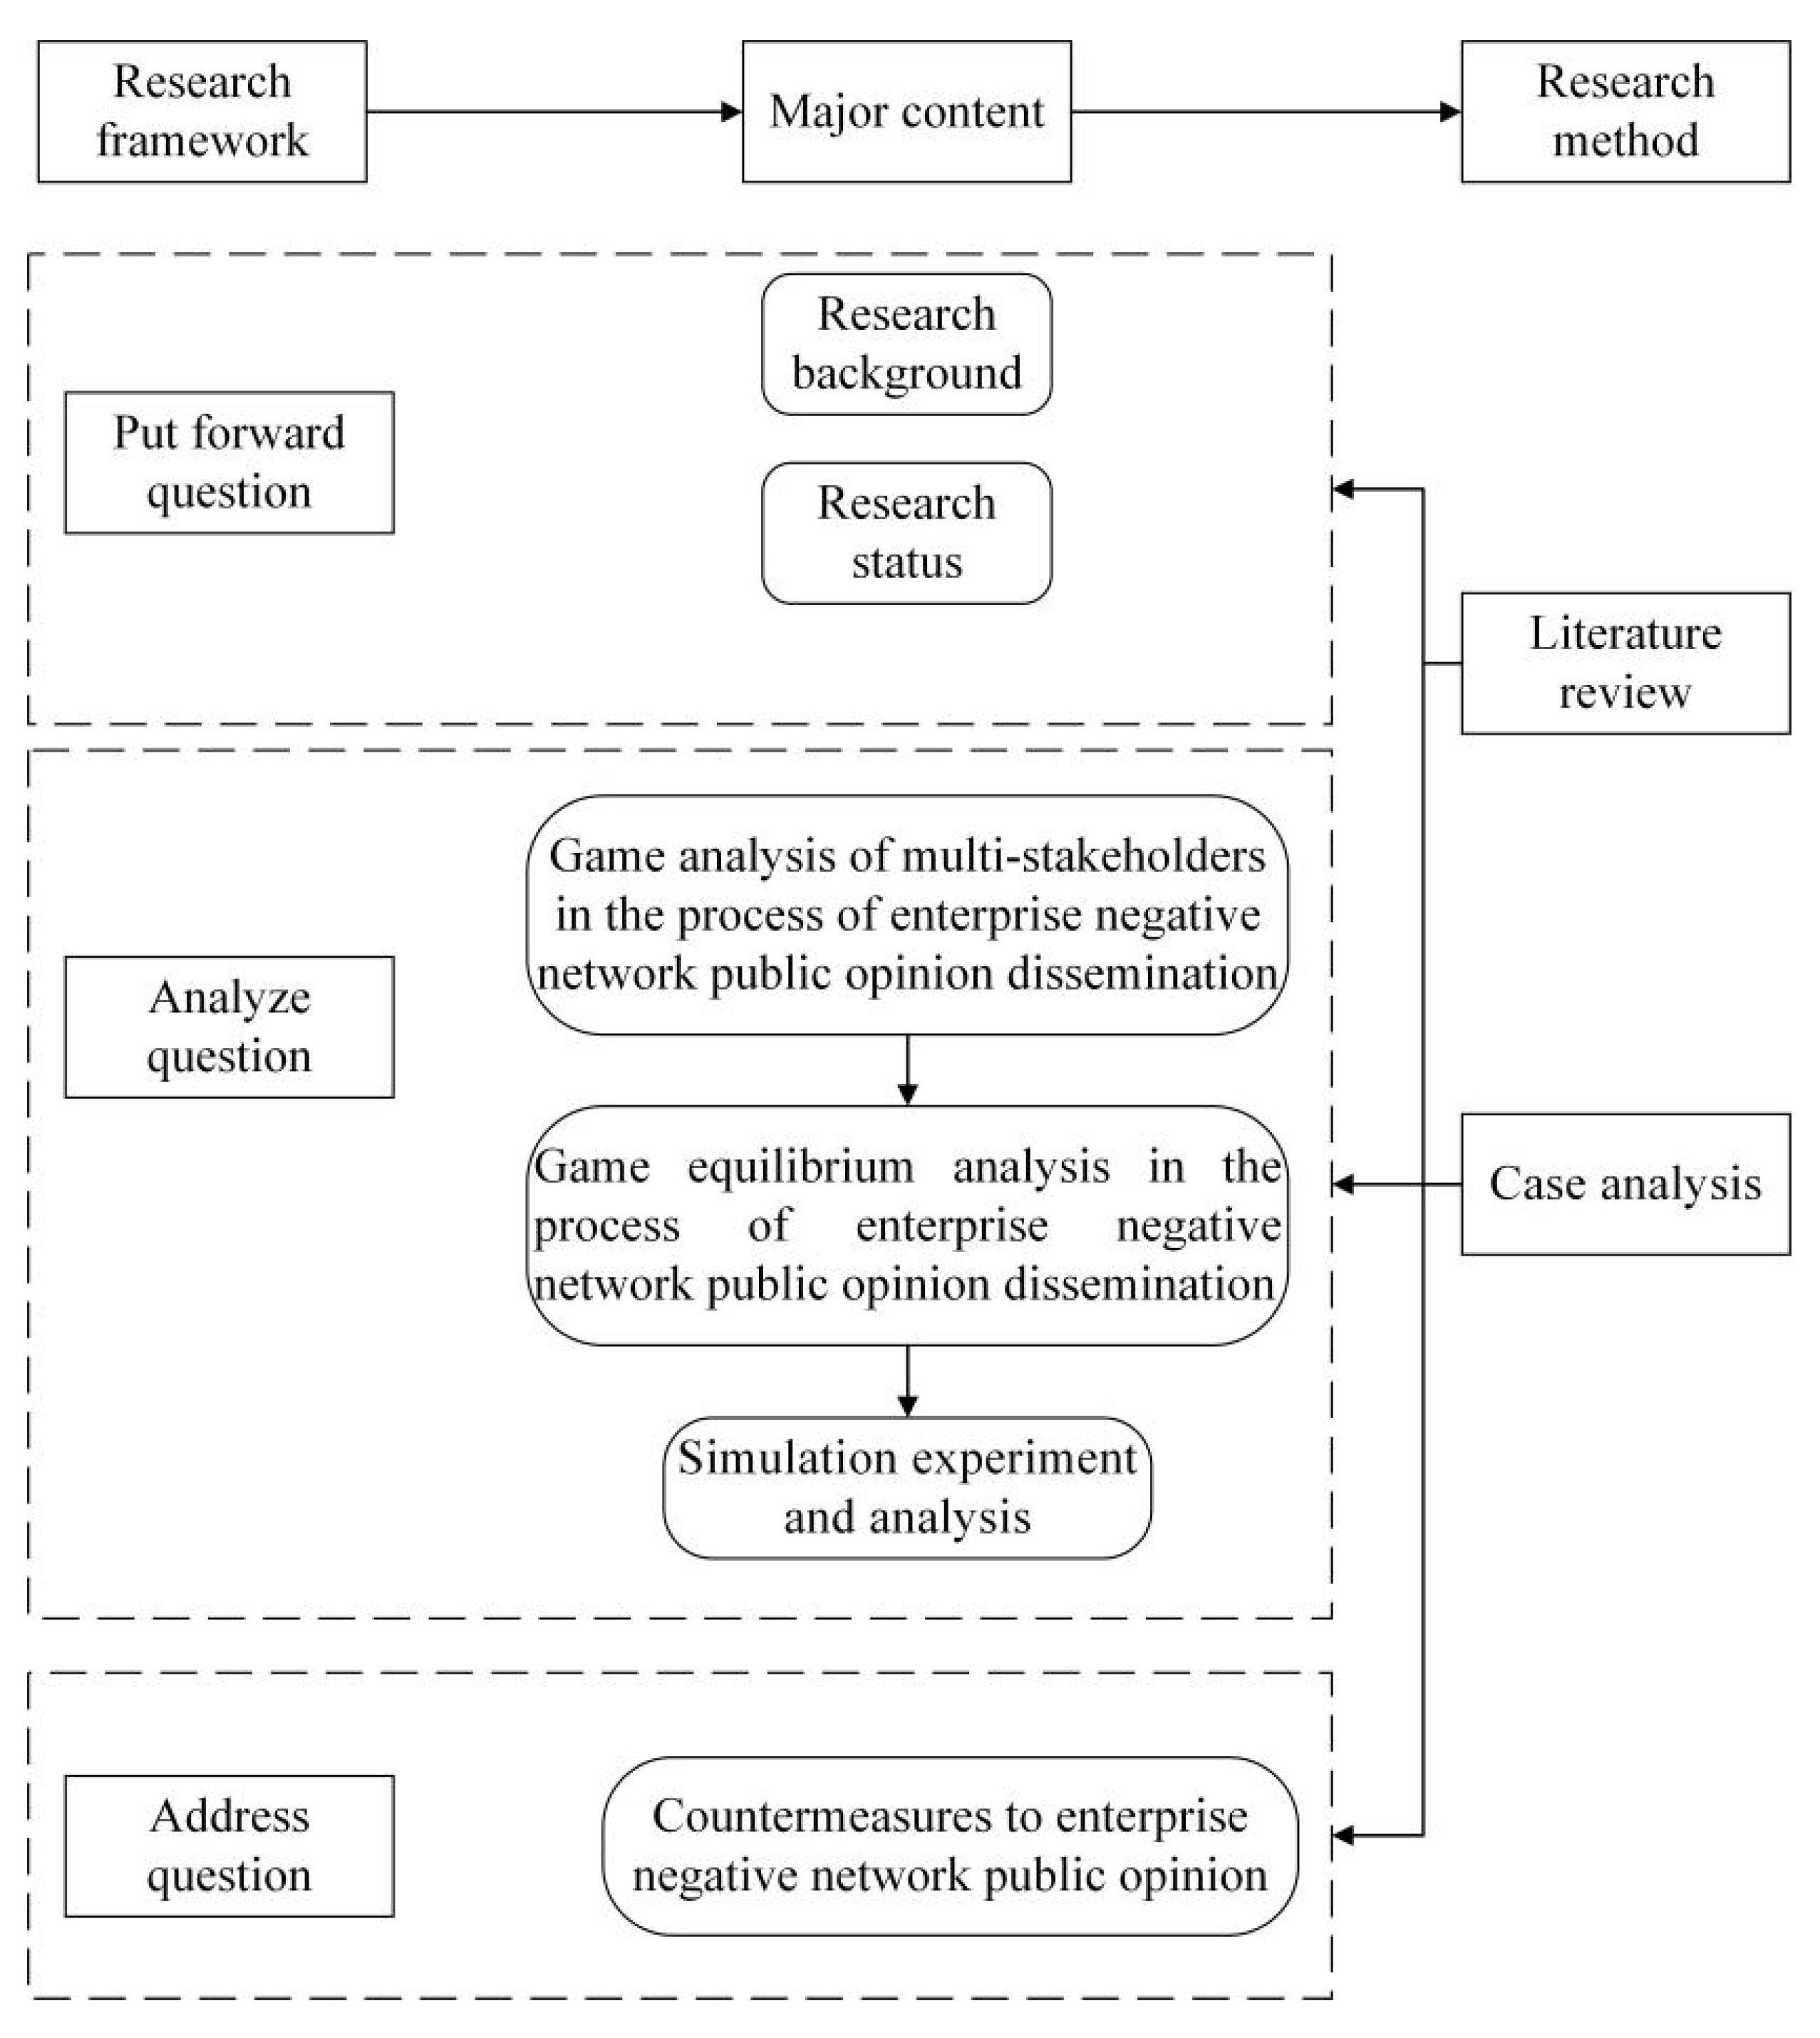
Figure 1.
Research framework.
Figure 1.
Research framework.
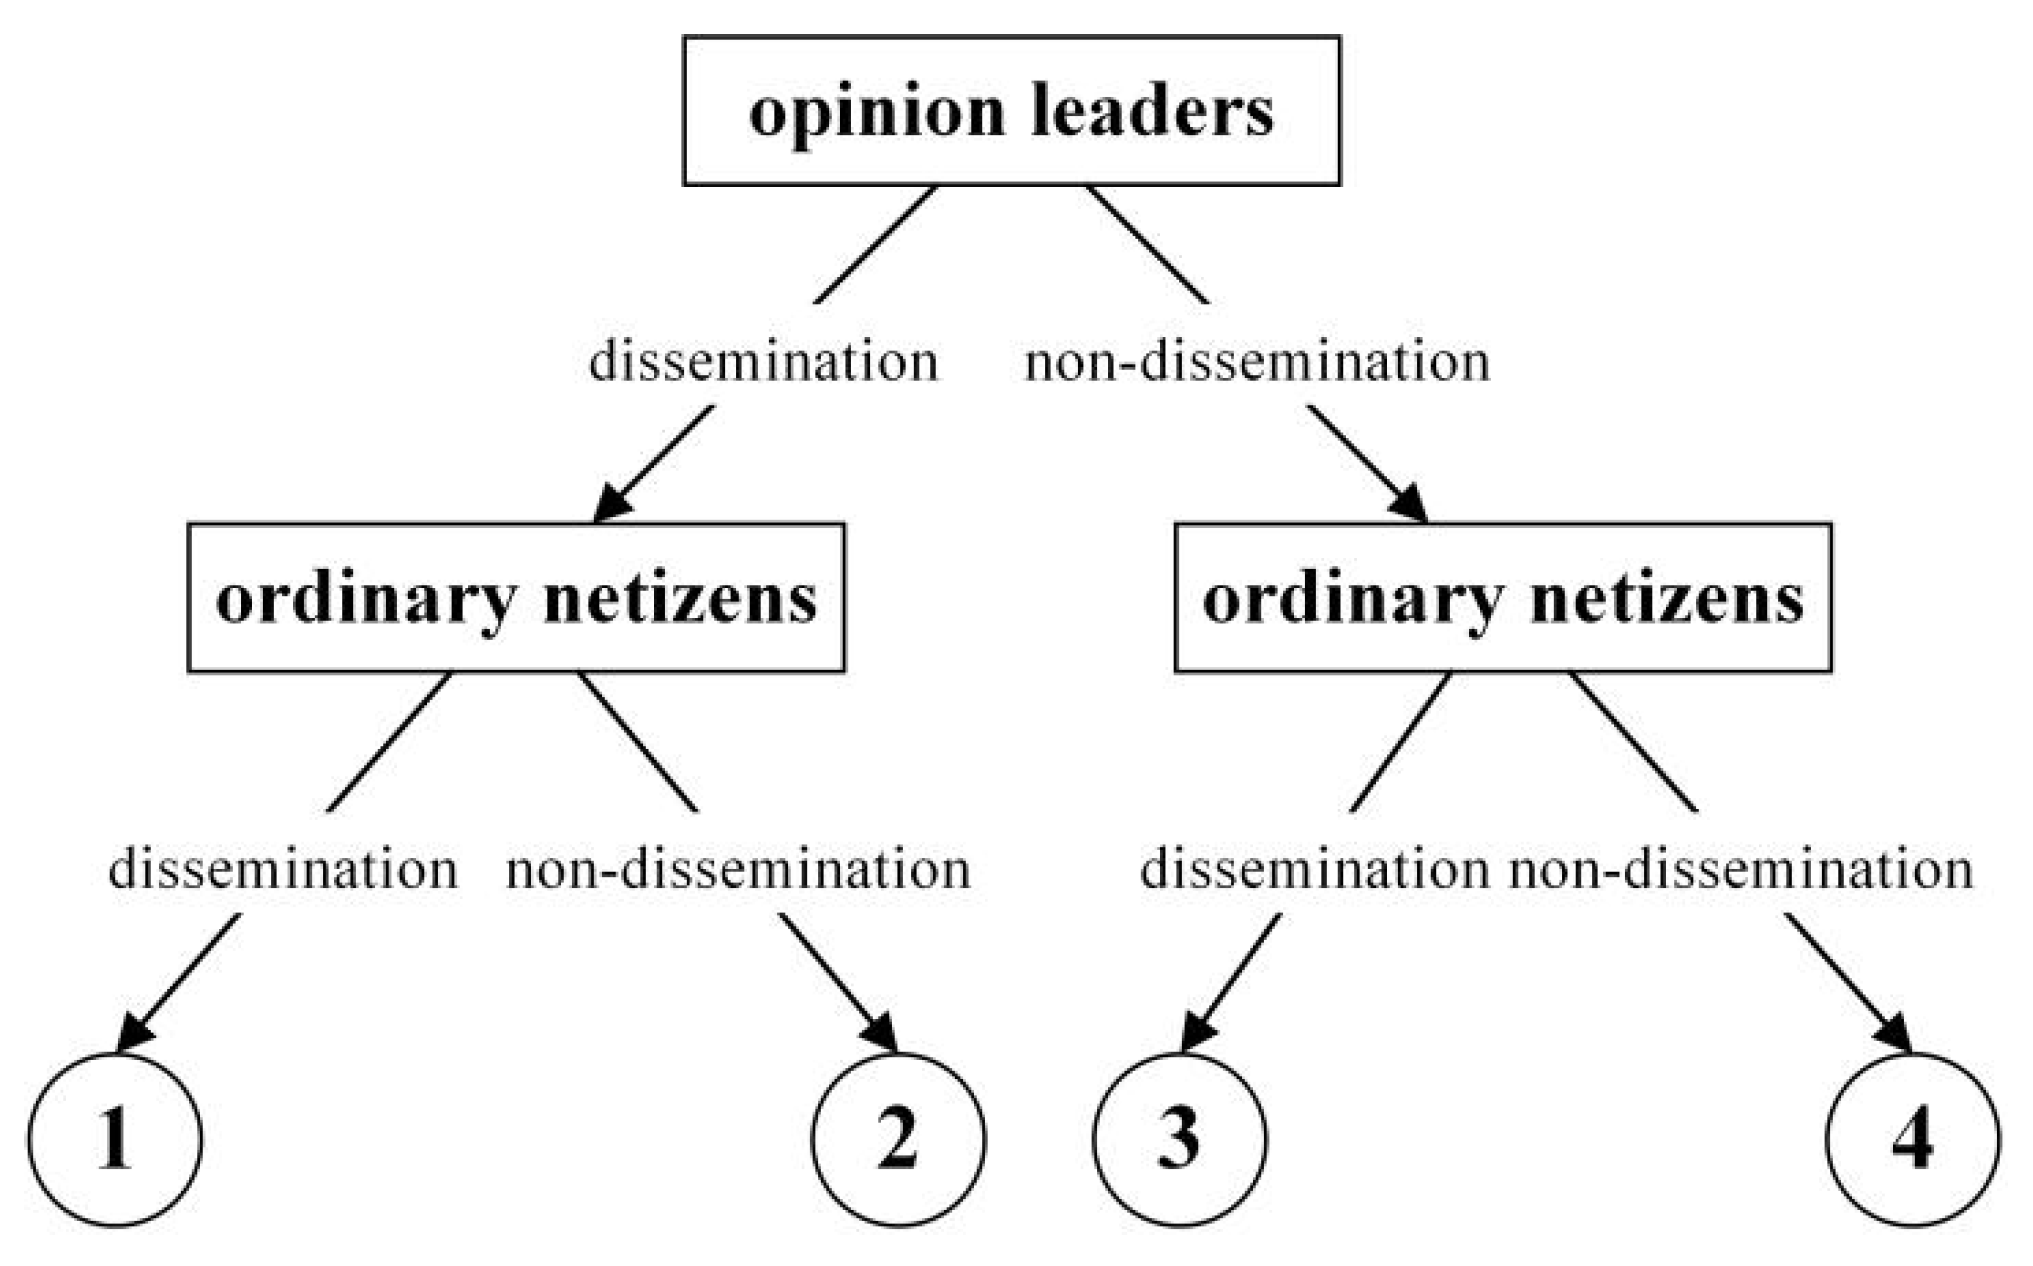
Figure 2.
Opinion leaders-ordinary netizens game tree.
Figure 2.
Opinion leaders-ordinary netizens game tree.
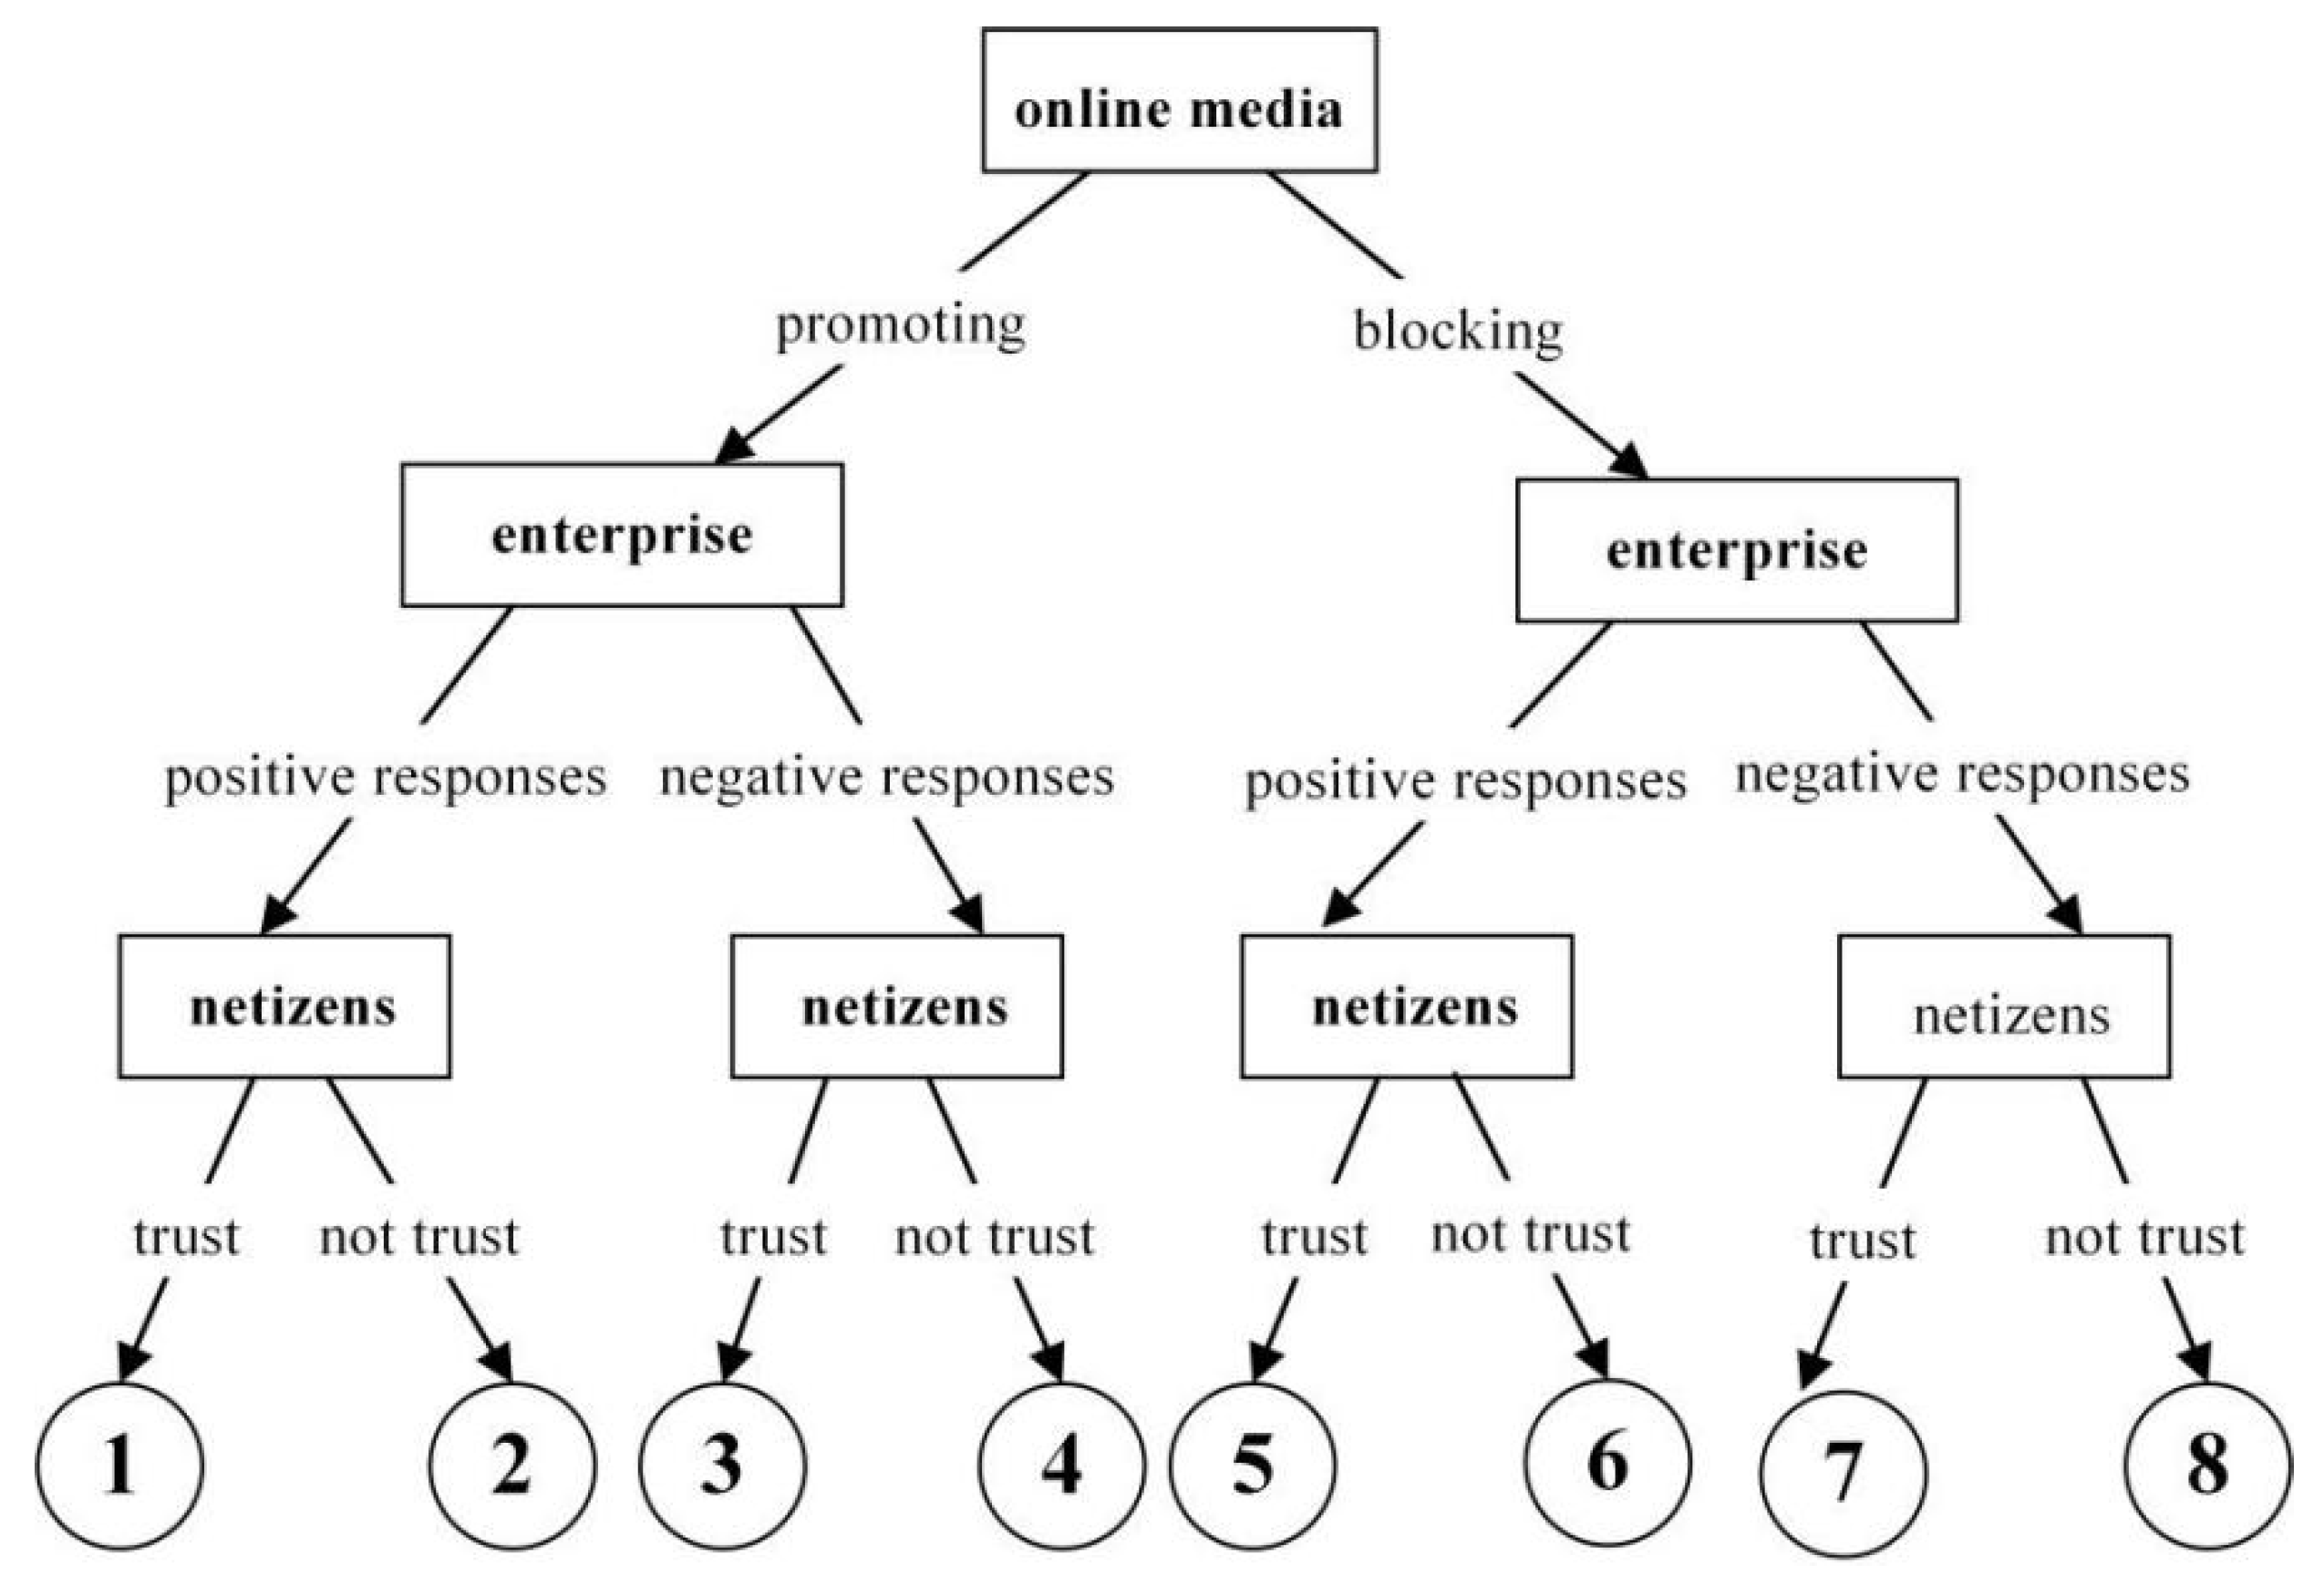
Figure 3.
Online media-opinion leaders-ordinary netizens game tree.
Figure 3.
Online media-opinion leaders-ordinary netizens game tree.
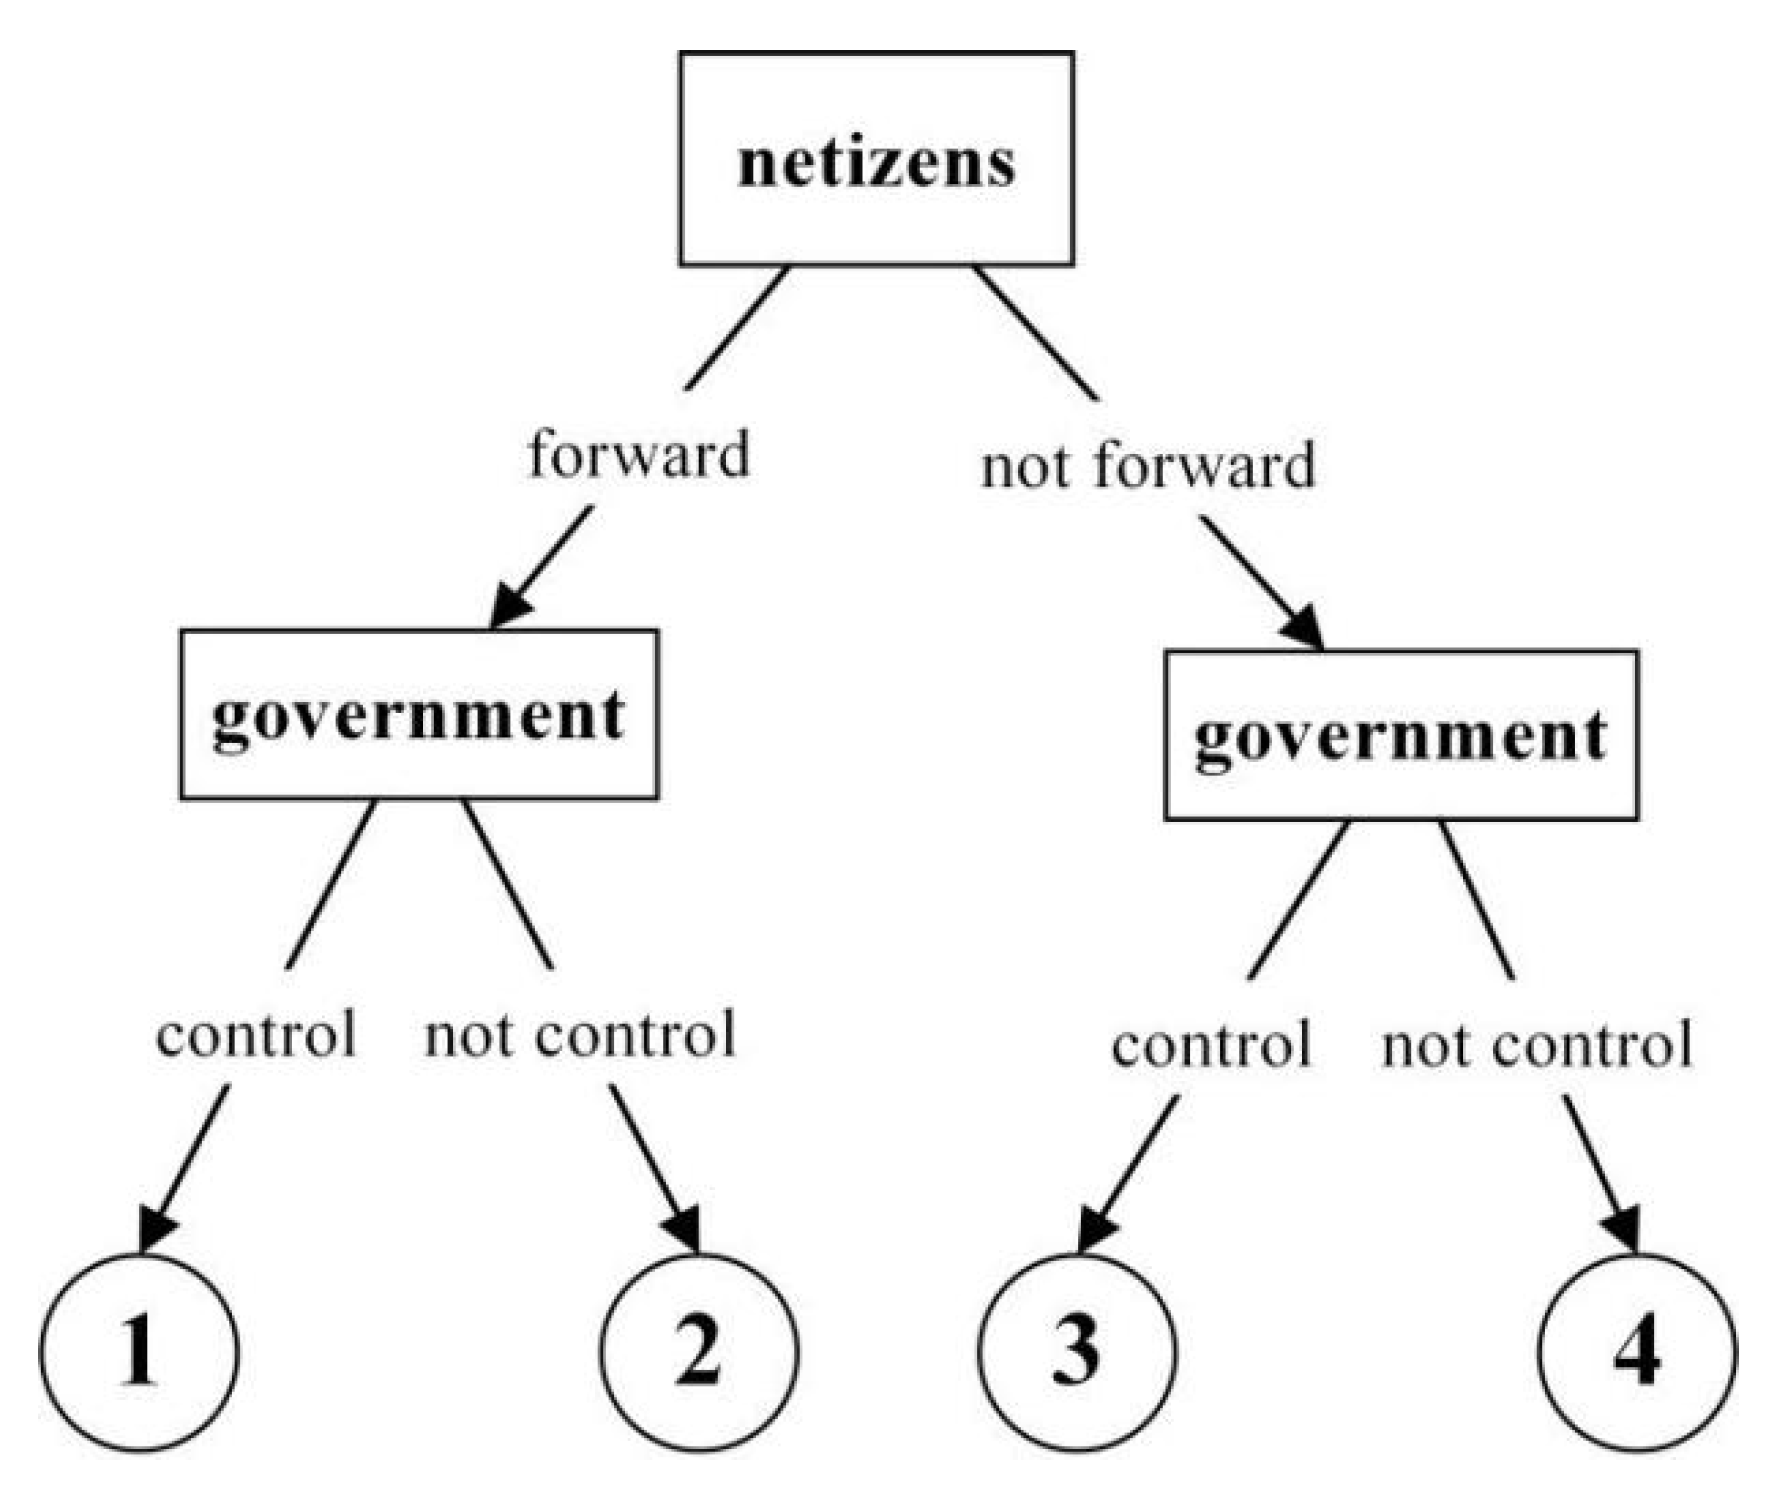
Figure 4.
Government-netizen game tree.
Figure 4.
Government-netizen game tree.
Figure 5.
Dynamic trend phase of “opinion leaders-ordinary netizens” in the formation stage.
Figure 5.
Dynamic trend phase of “opinion leaders-ordinary netizens” in the formation stage.
Figure 6.
The stable strategy evolution of “ordinary netizens-opinion leaders” in the formation stage.
Figure 6.
The stable strategy evolution of “ordinary netizens-opinion leaders” in the formation stage.
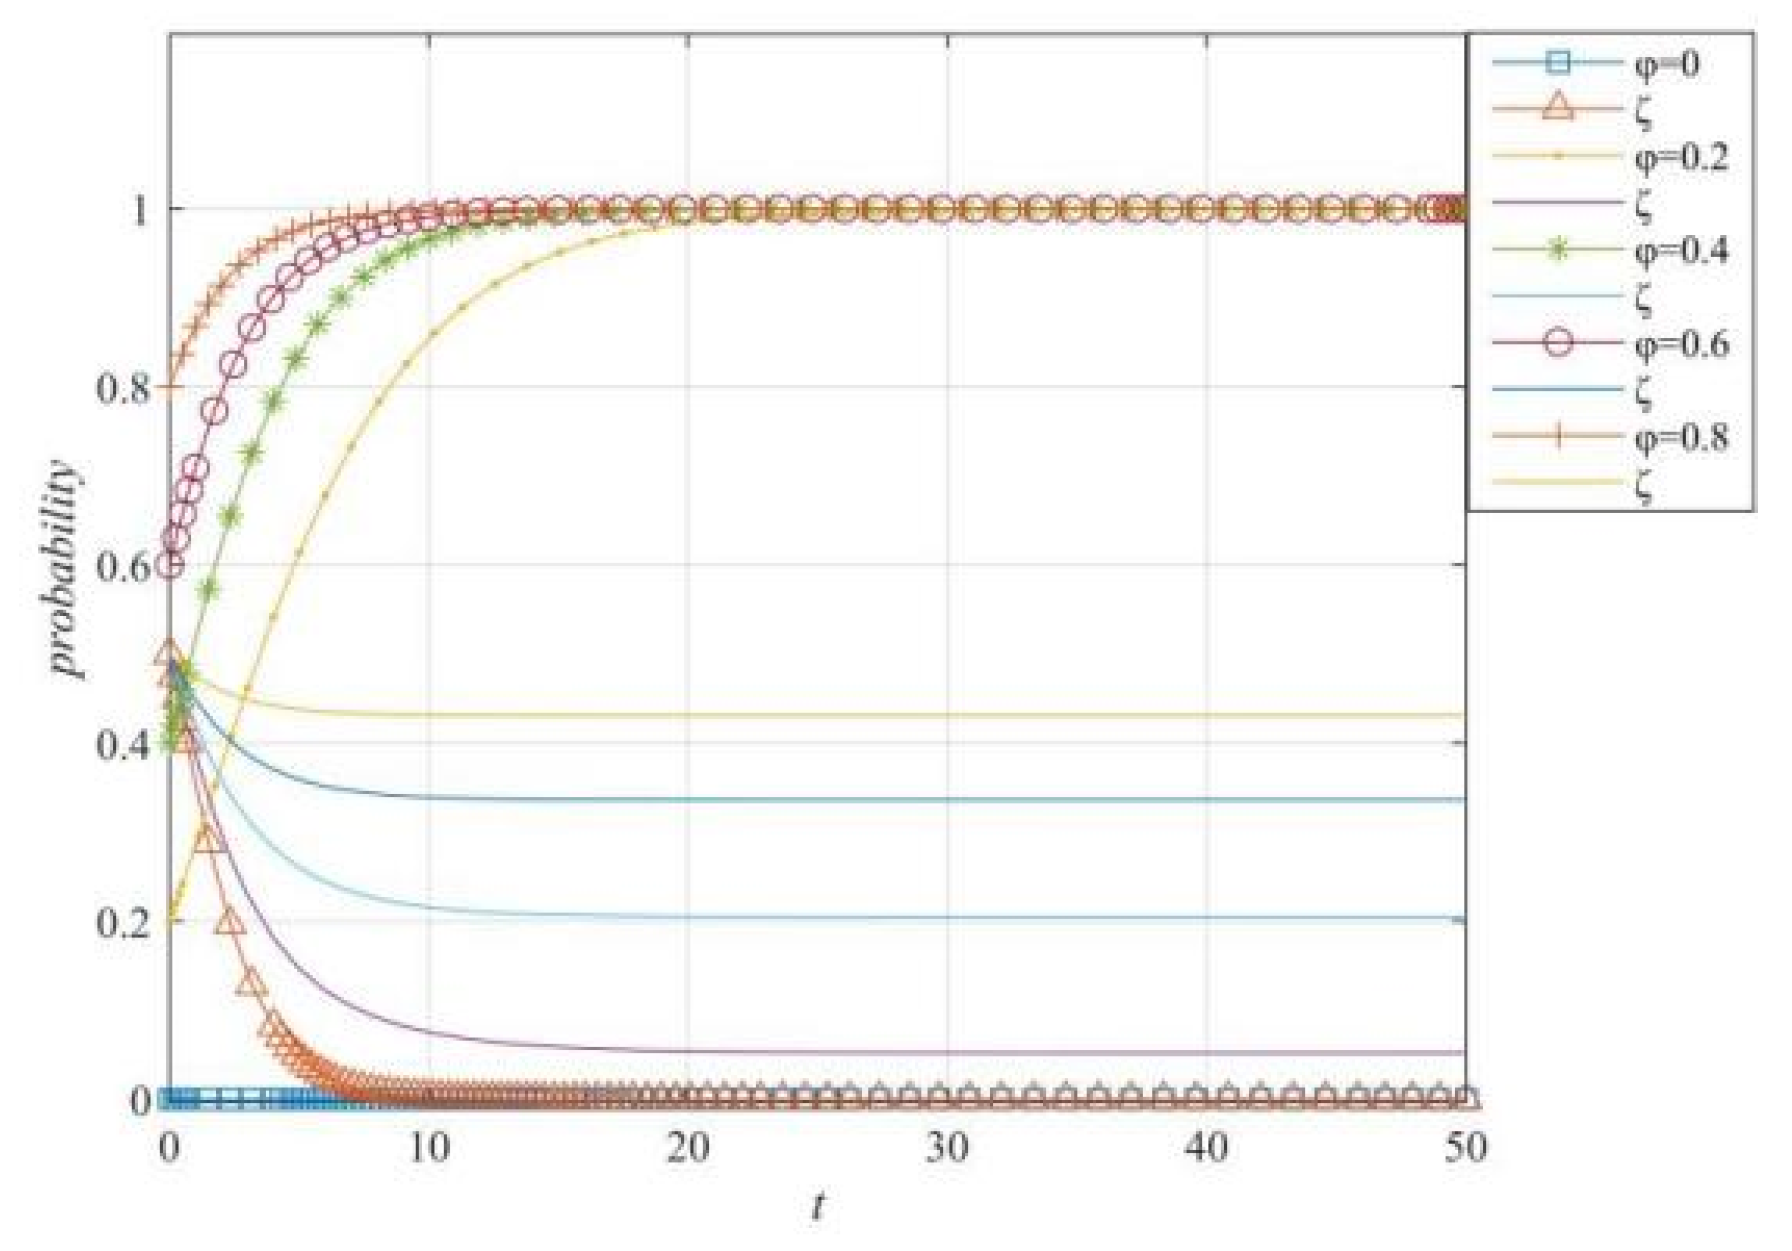
Figure 7.
φ’s change on the evolution of strategy selection made by ordinary netizens and opinion leaders.
Figure 7.
φ’s change on the evolution of strategy selection made by ordinary netizens and opinion leaders.
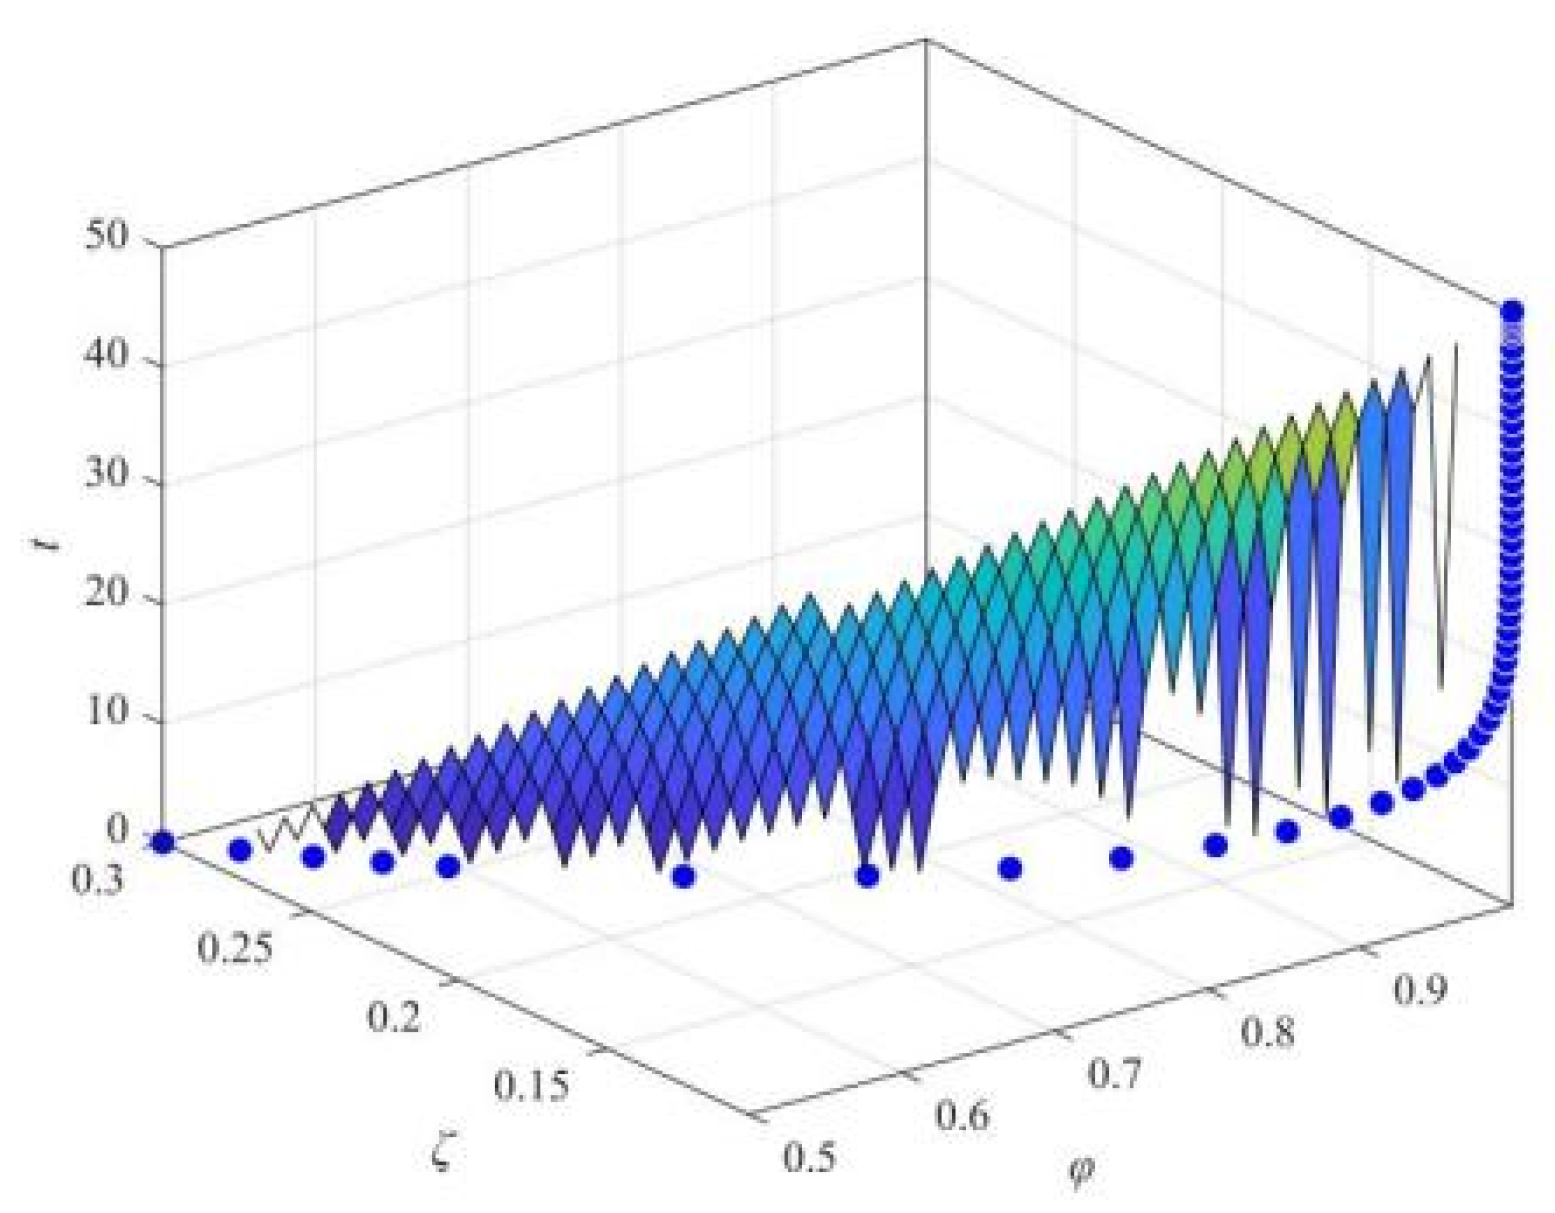
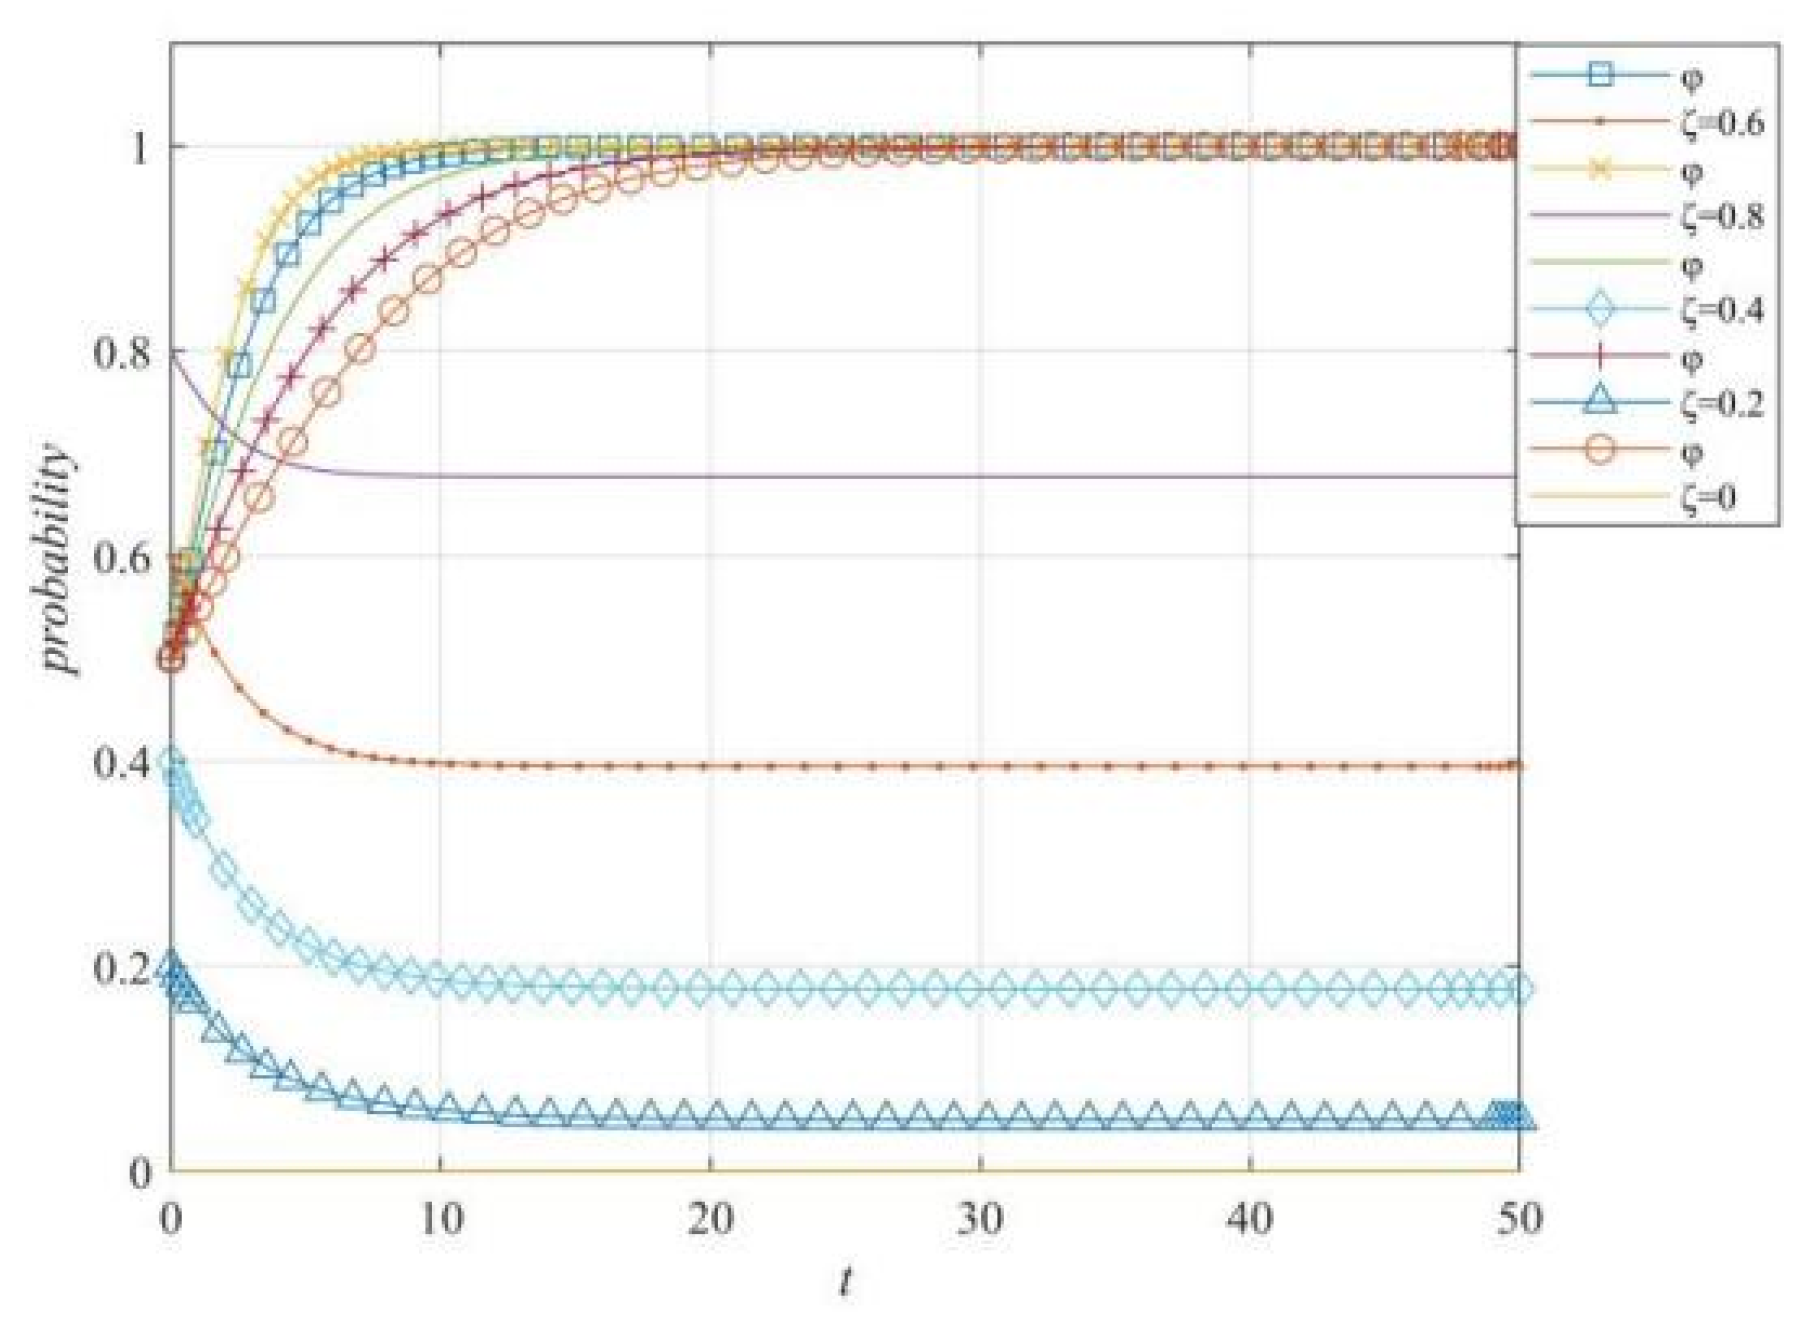
Figure 8.
ζ’s change on the evolution of strategy selection made by ordinary netizens and opinion leaders.
Figure 8.
ζ’s change on the evolution of strategy selection made by ordinary netizens and opinion leaders.
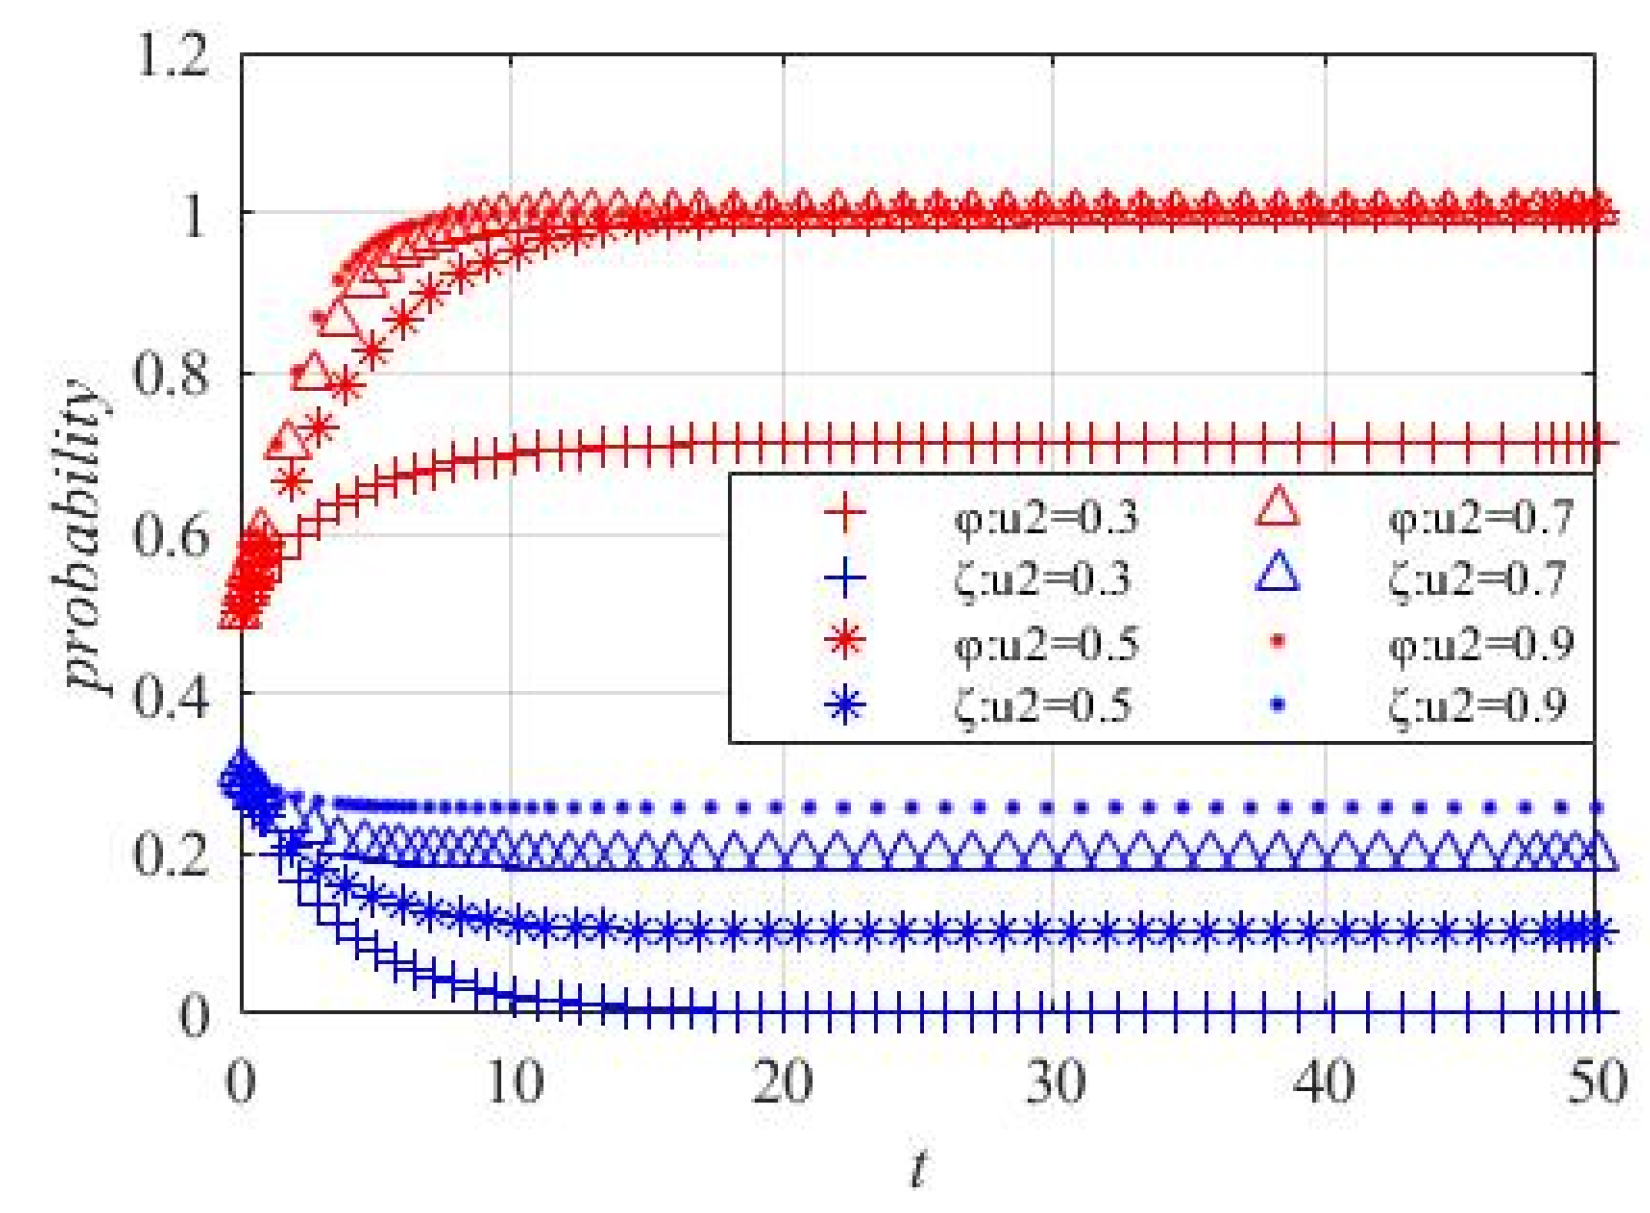
Figure 9.
U2’s change on the evolution of strategy selection made by ordinary netizens and opinion leaders.
Figure 9.
U2’s change on the evolution of strategy selection made by ordinary netizens and opinion leaders.
Figure 10.
S3’s change on the evolution of strategy selection made by ordinary netizens and opinion leaders.
Figure 10.
S3’s change on the evolution of strategy selection made by ordinary netizens and opinion leaders.
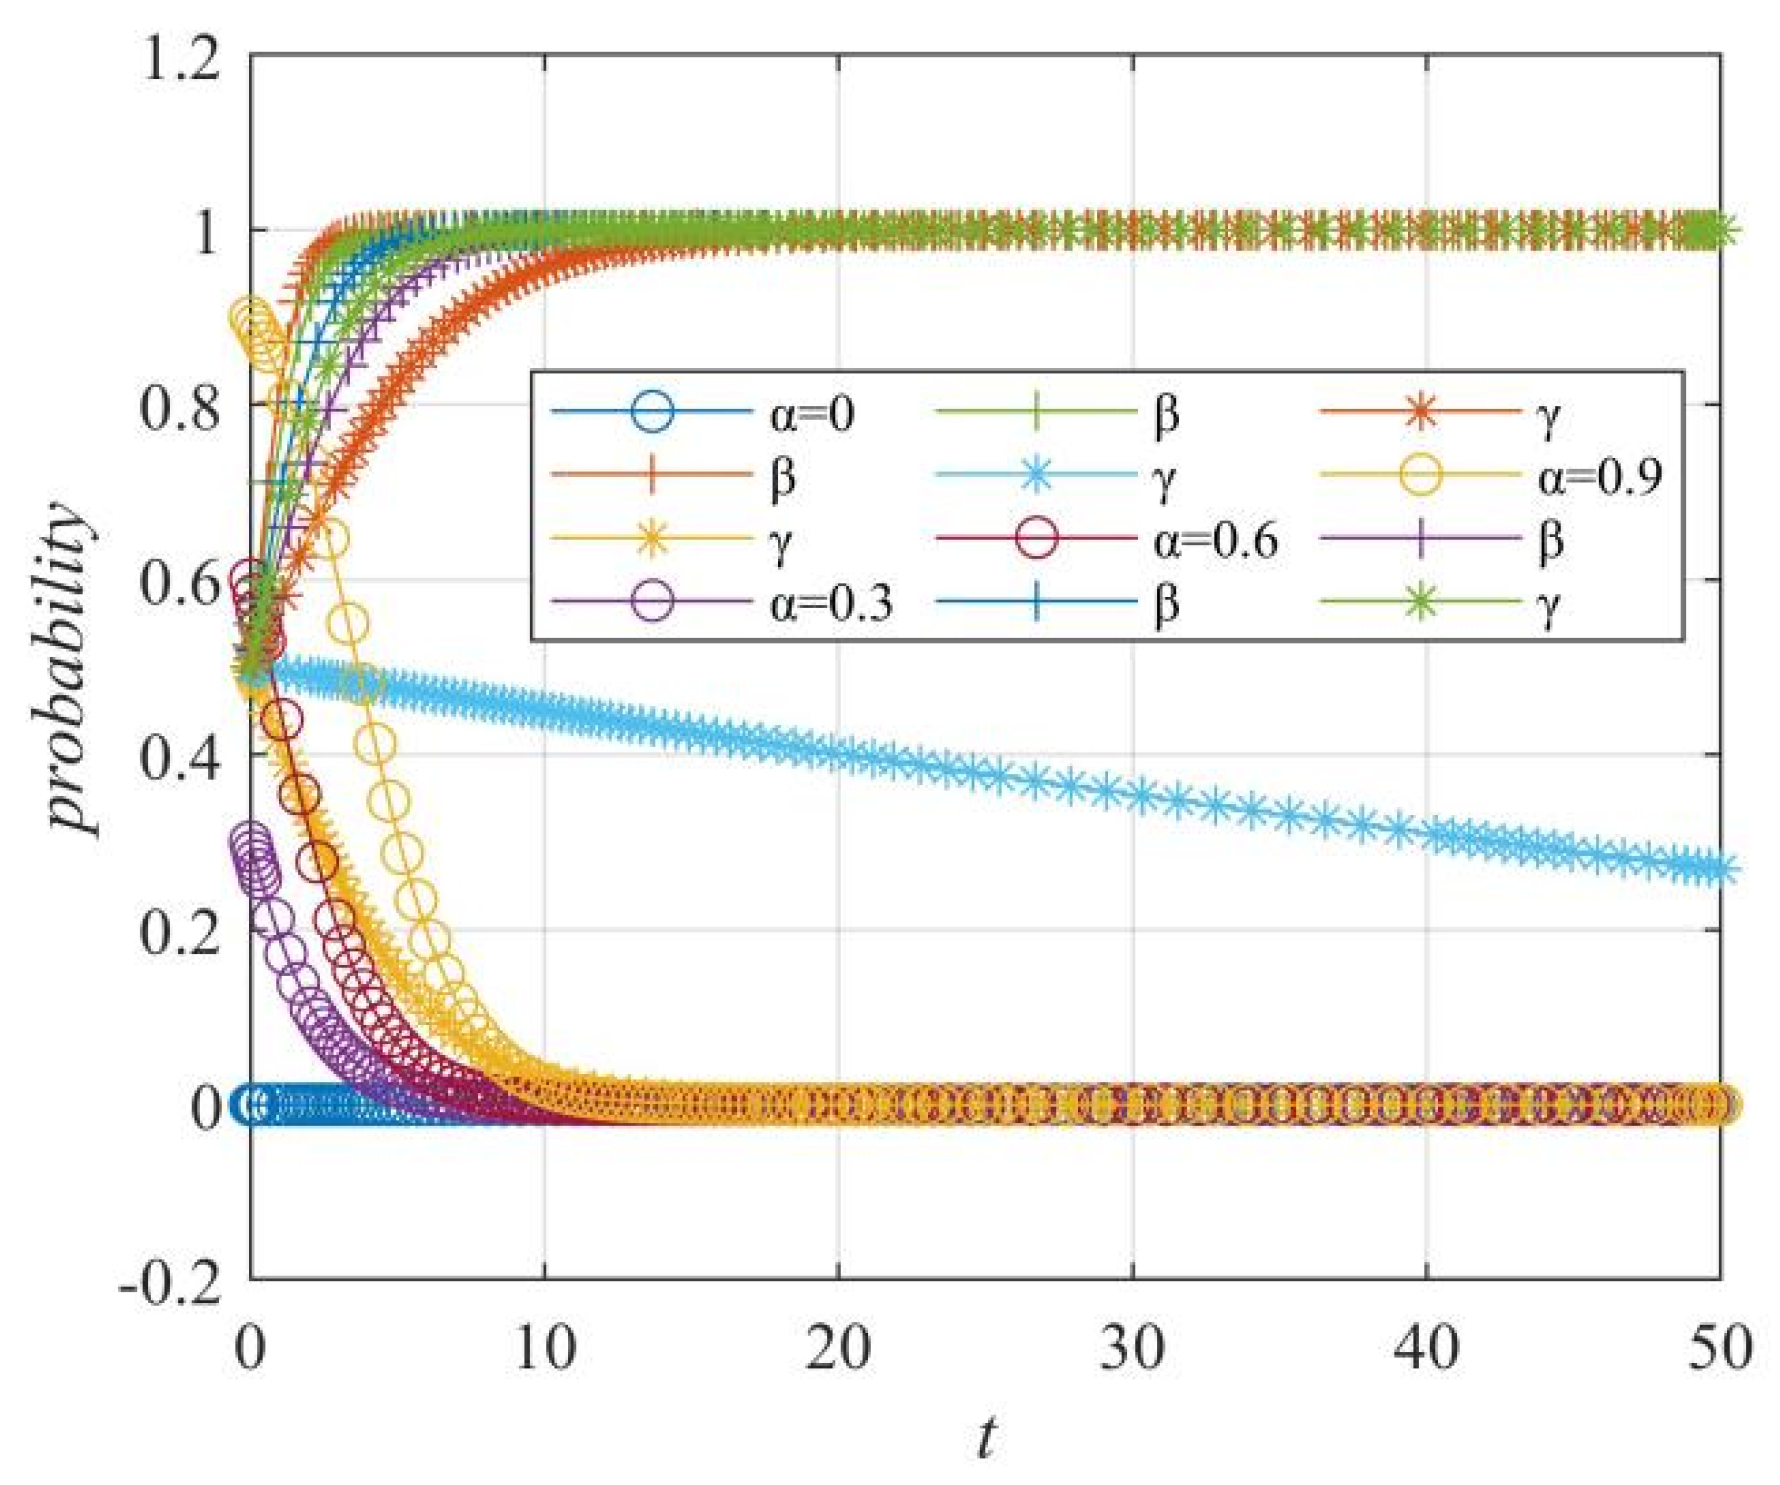
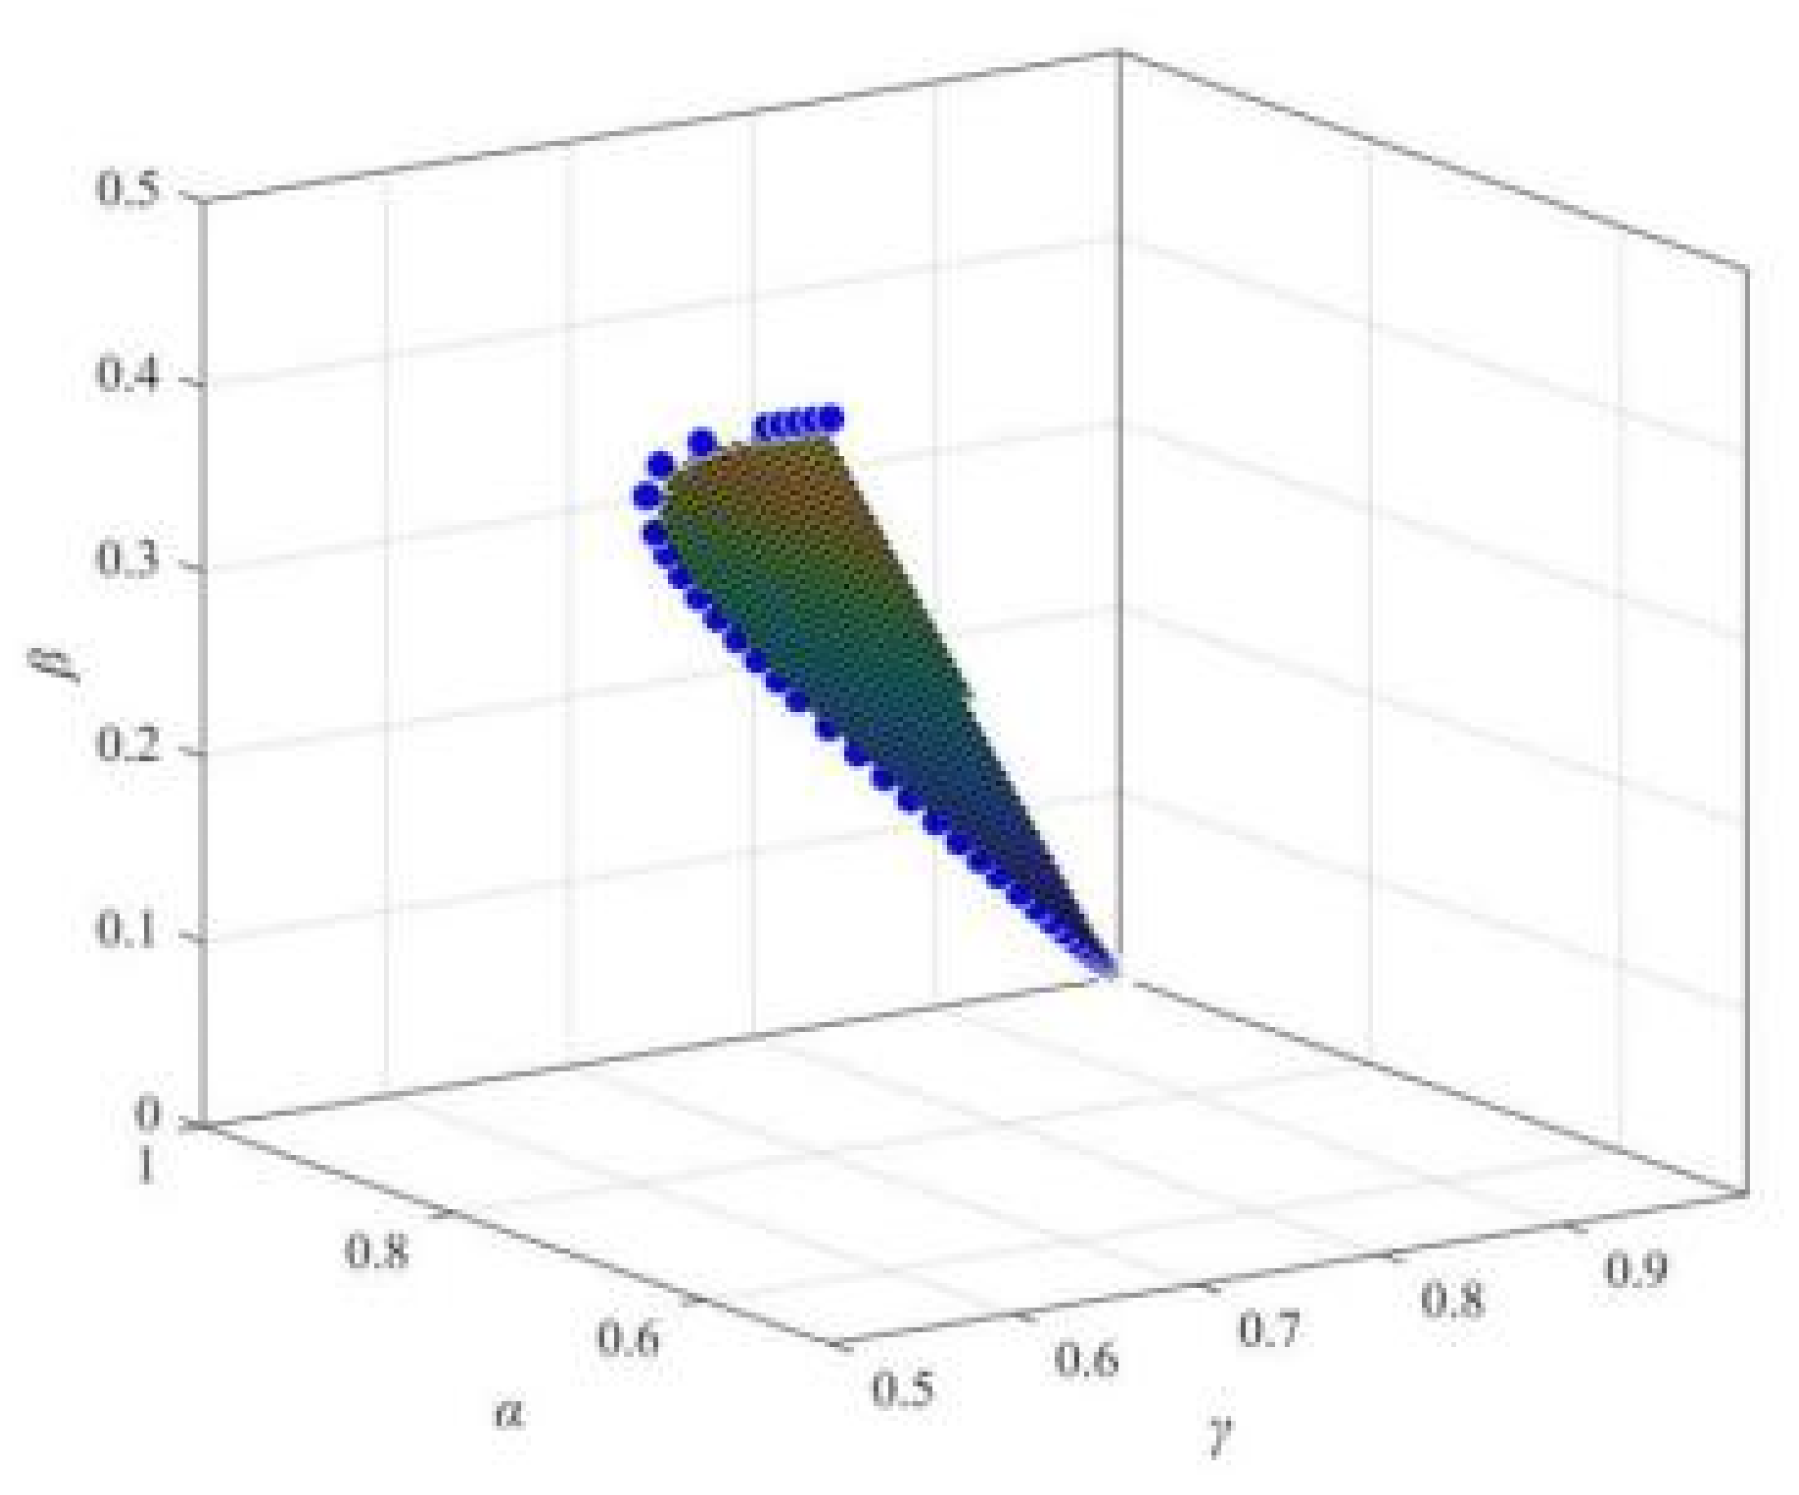
Figure 11.
Stabilized at point T2(0, 1, 1).
Figure 11.
Stabilized at point T2(0, 1, 1).
Figure 12.
α value on game strategy of “online media–enterprise–netizens”.
Figure 12.
α value on game strategy of “online media–enterprise–netizens”.
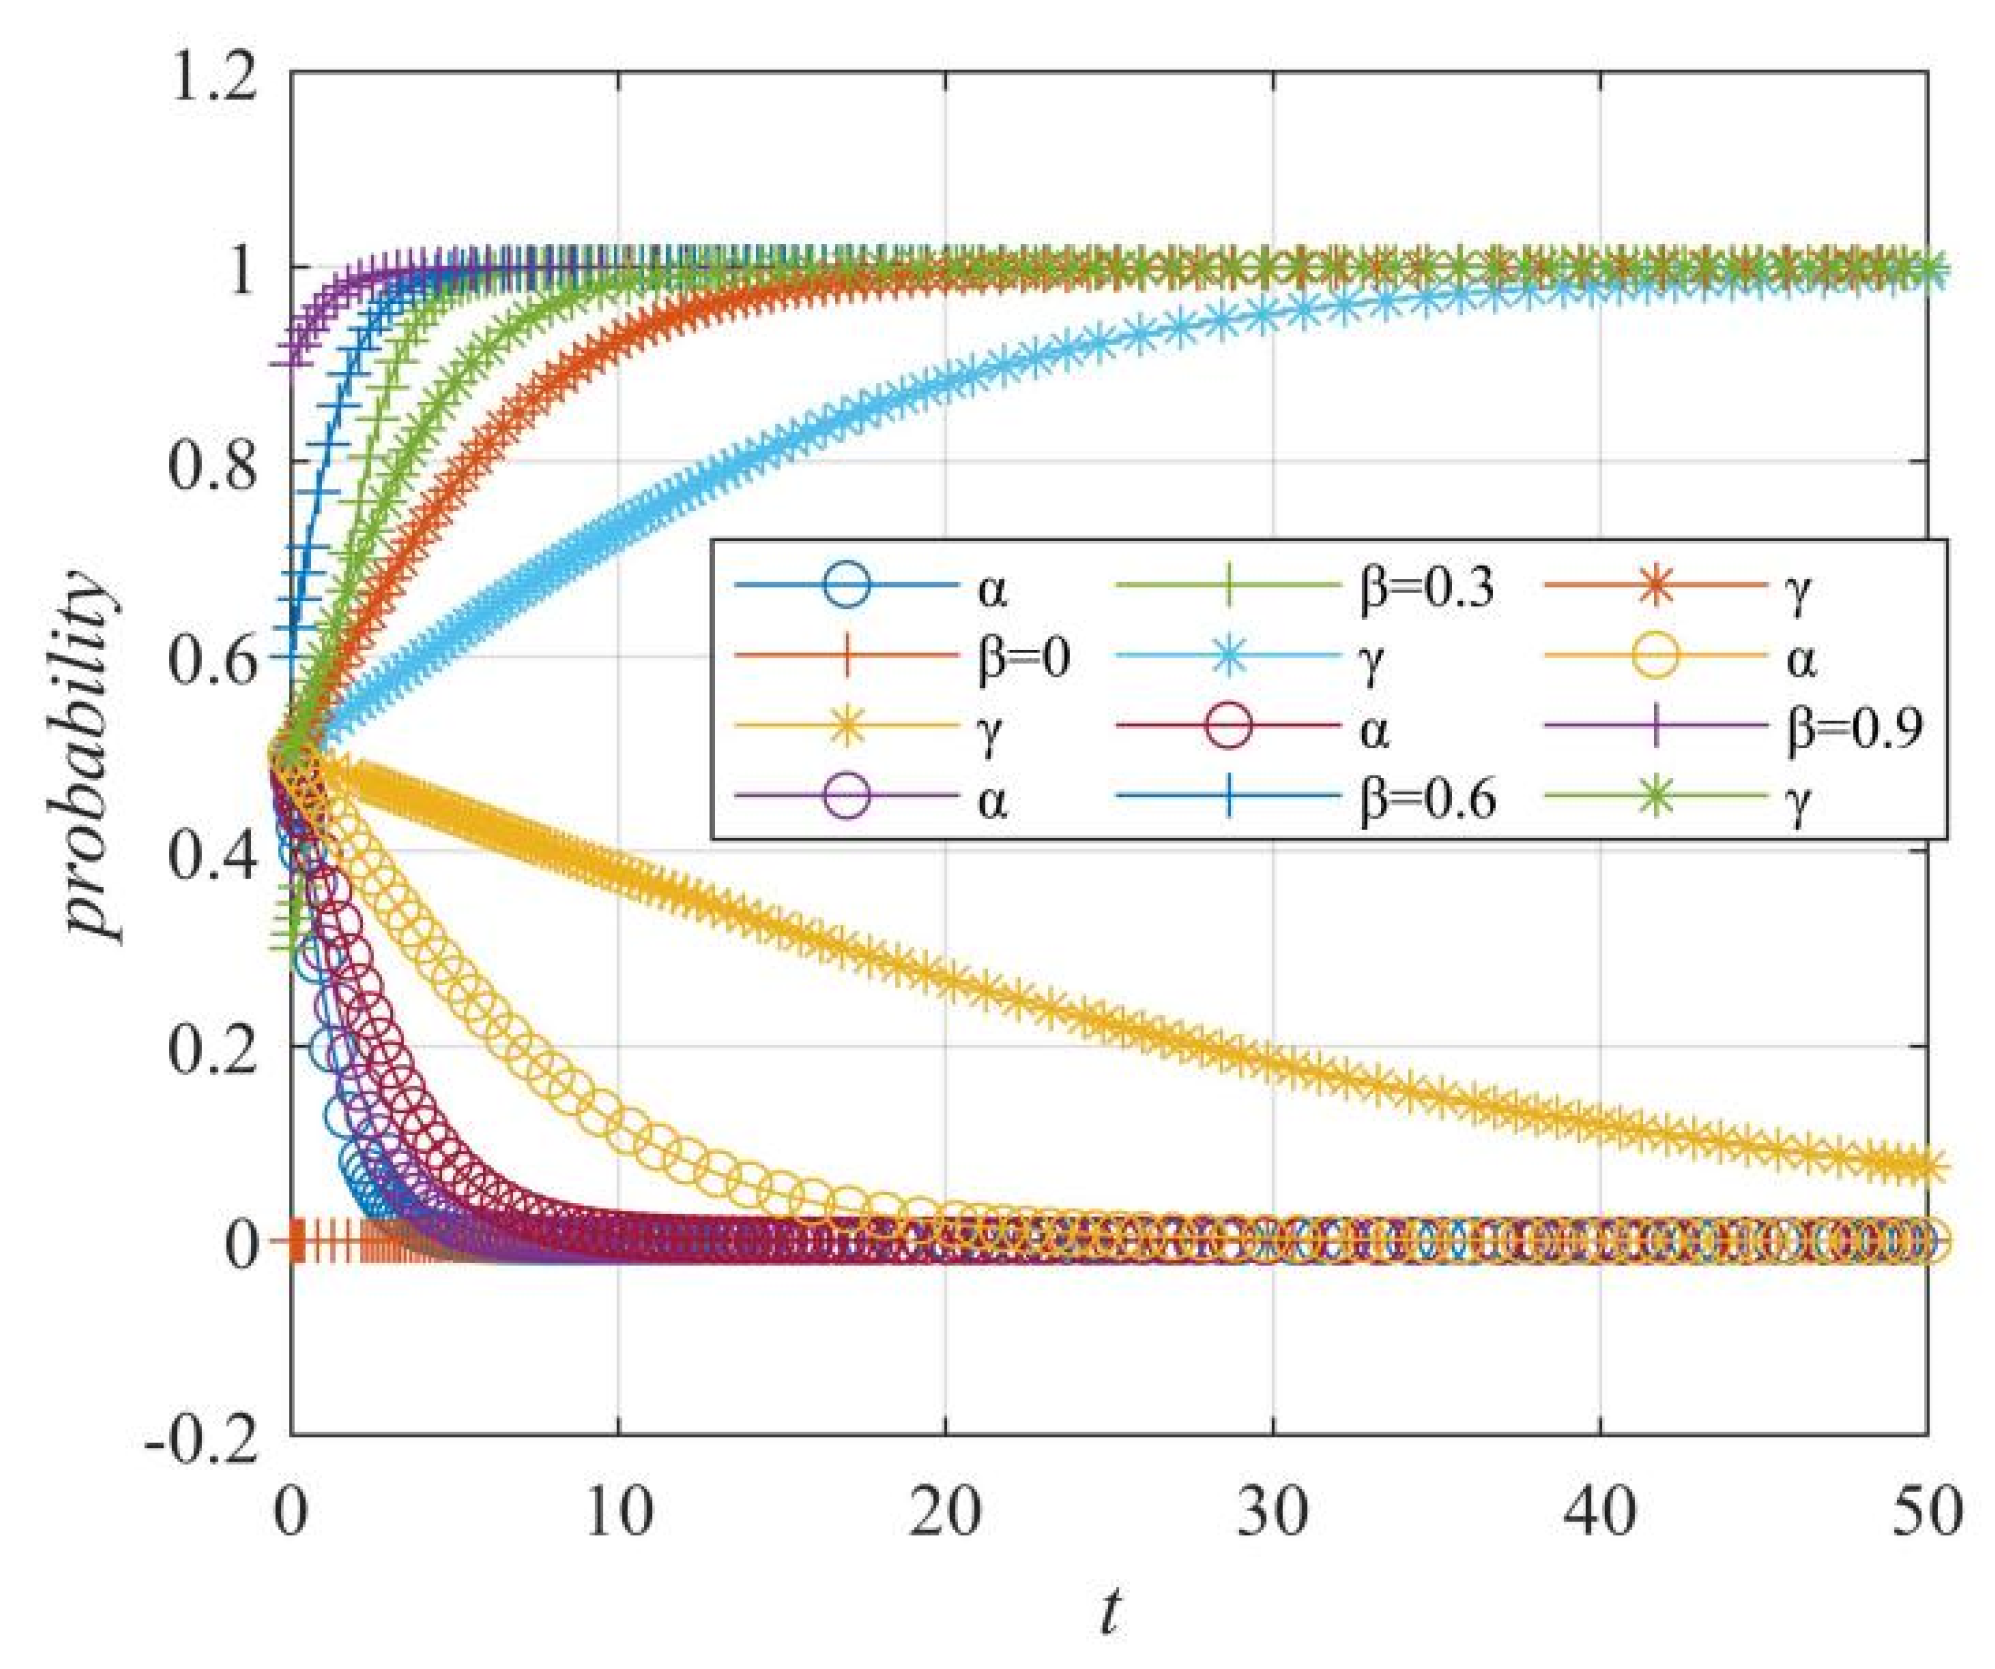
Figure 13.
β value on game strategy of “online media–enterprise–netizens”.
Figure 13.
β value on game strategy of “online media–enterprise–netizens”.
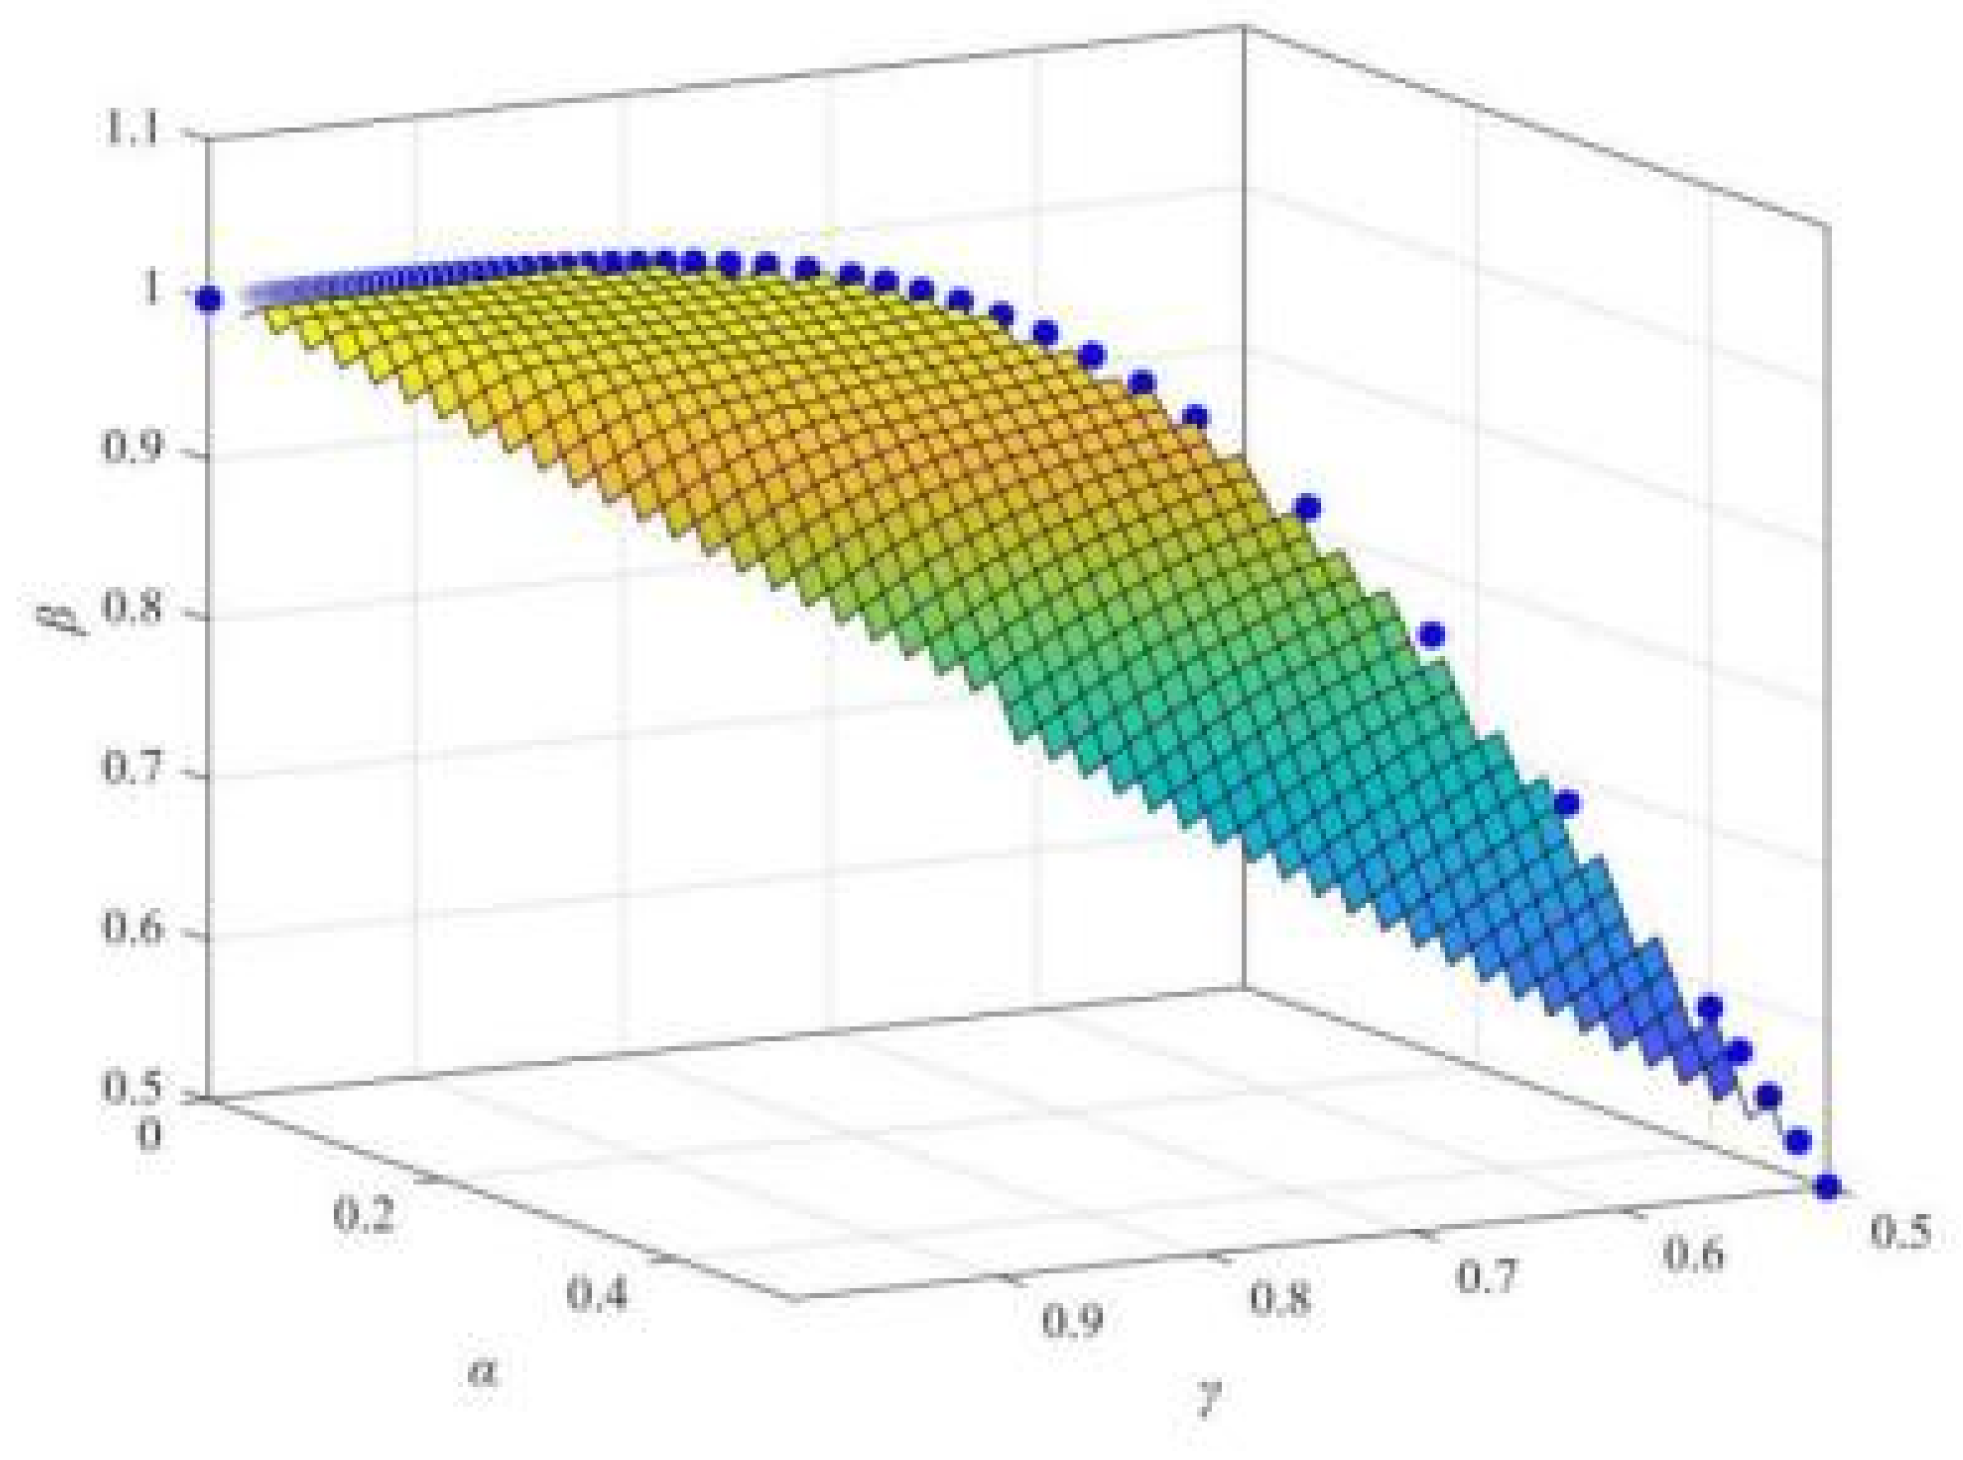
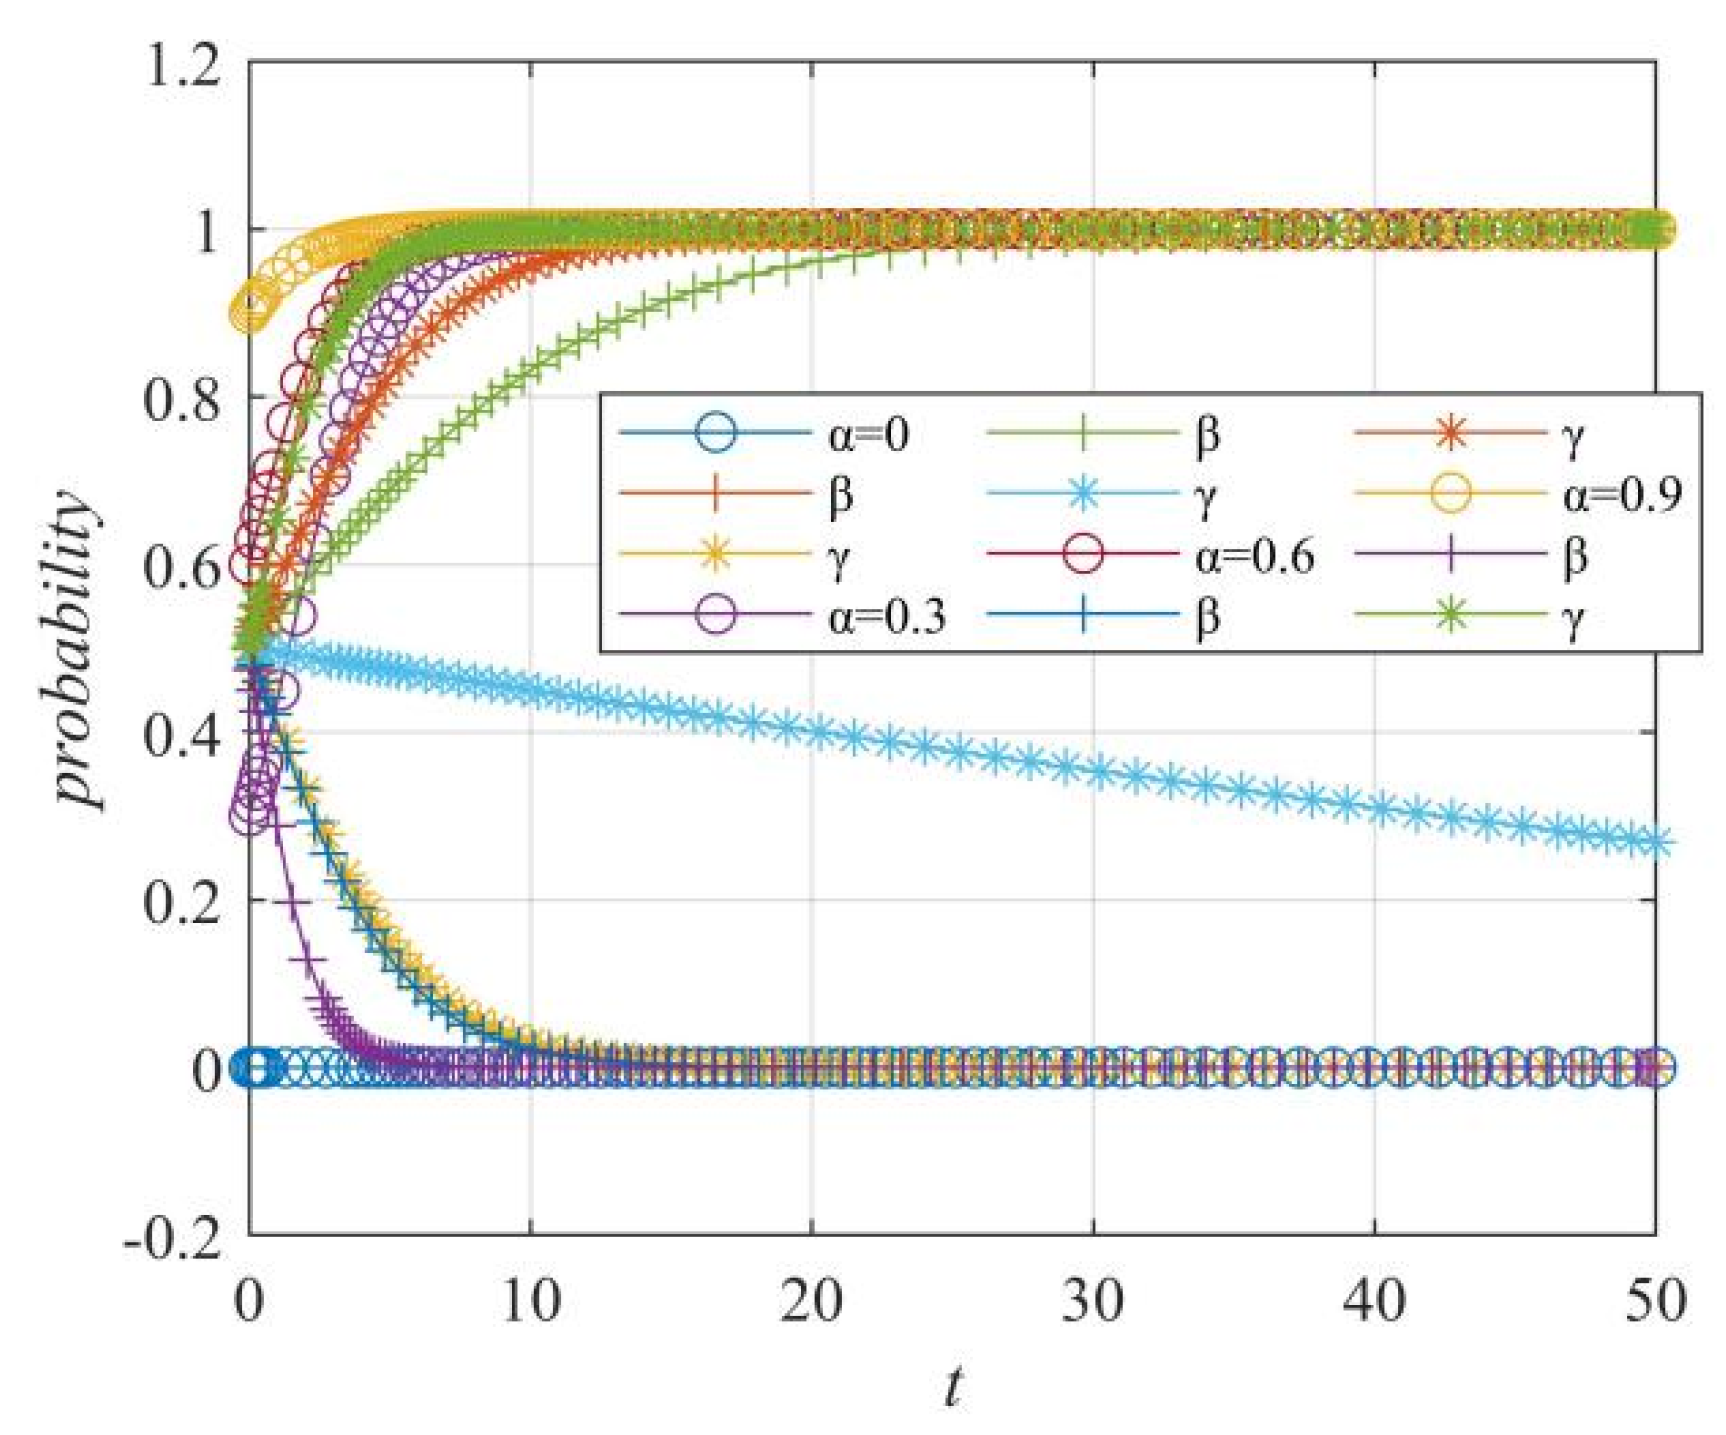
Figure 14.
Stabilized at point T3(1, 0, 1).
Figure 14.
Stabilized at point T3(1, 0, 1).
Figure 15.
α values on the evolution trend of the probability of “online media–enterprise–netizens” strategy selection.
Figure 15.
α values on the evolution trend of the probability of “online media–enterprise–netizens” strategy selection.
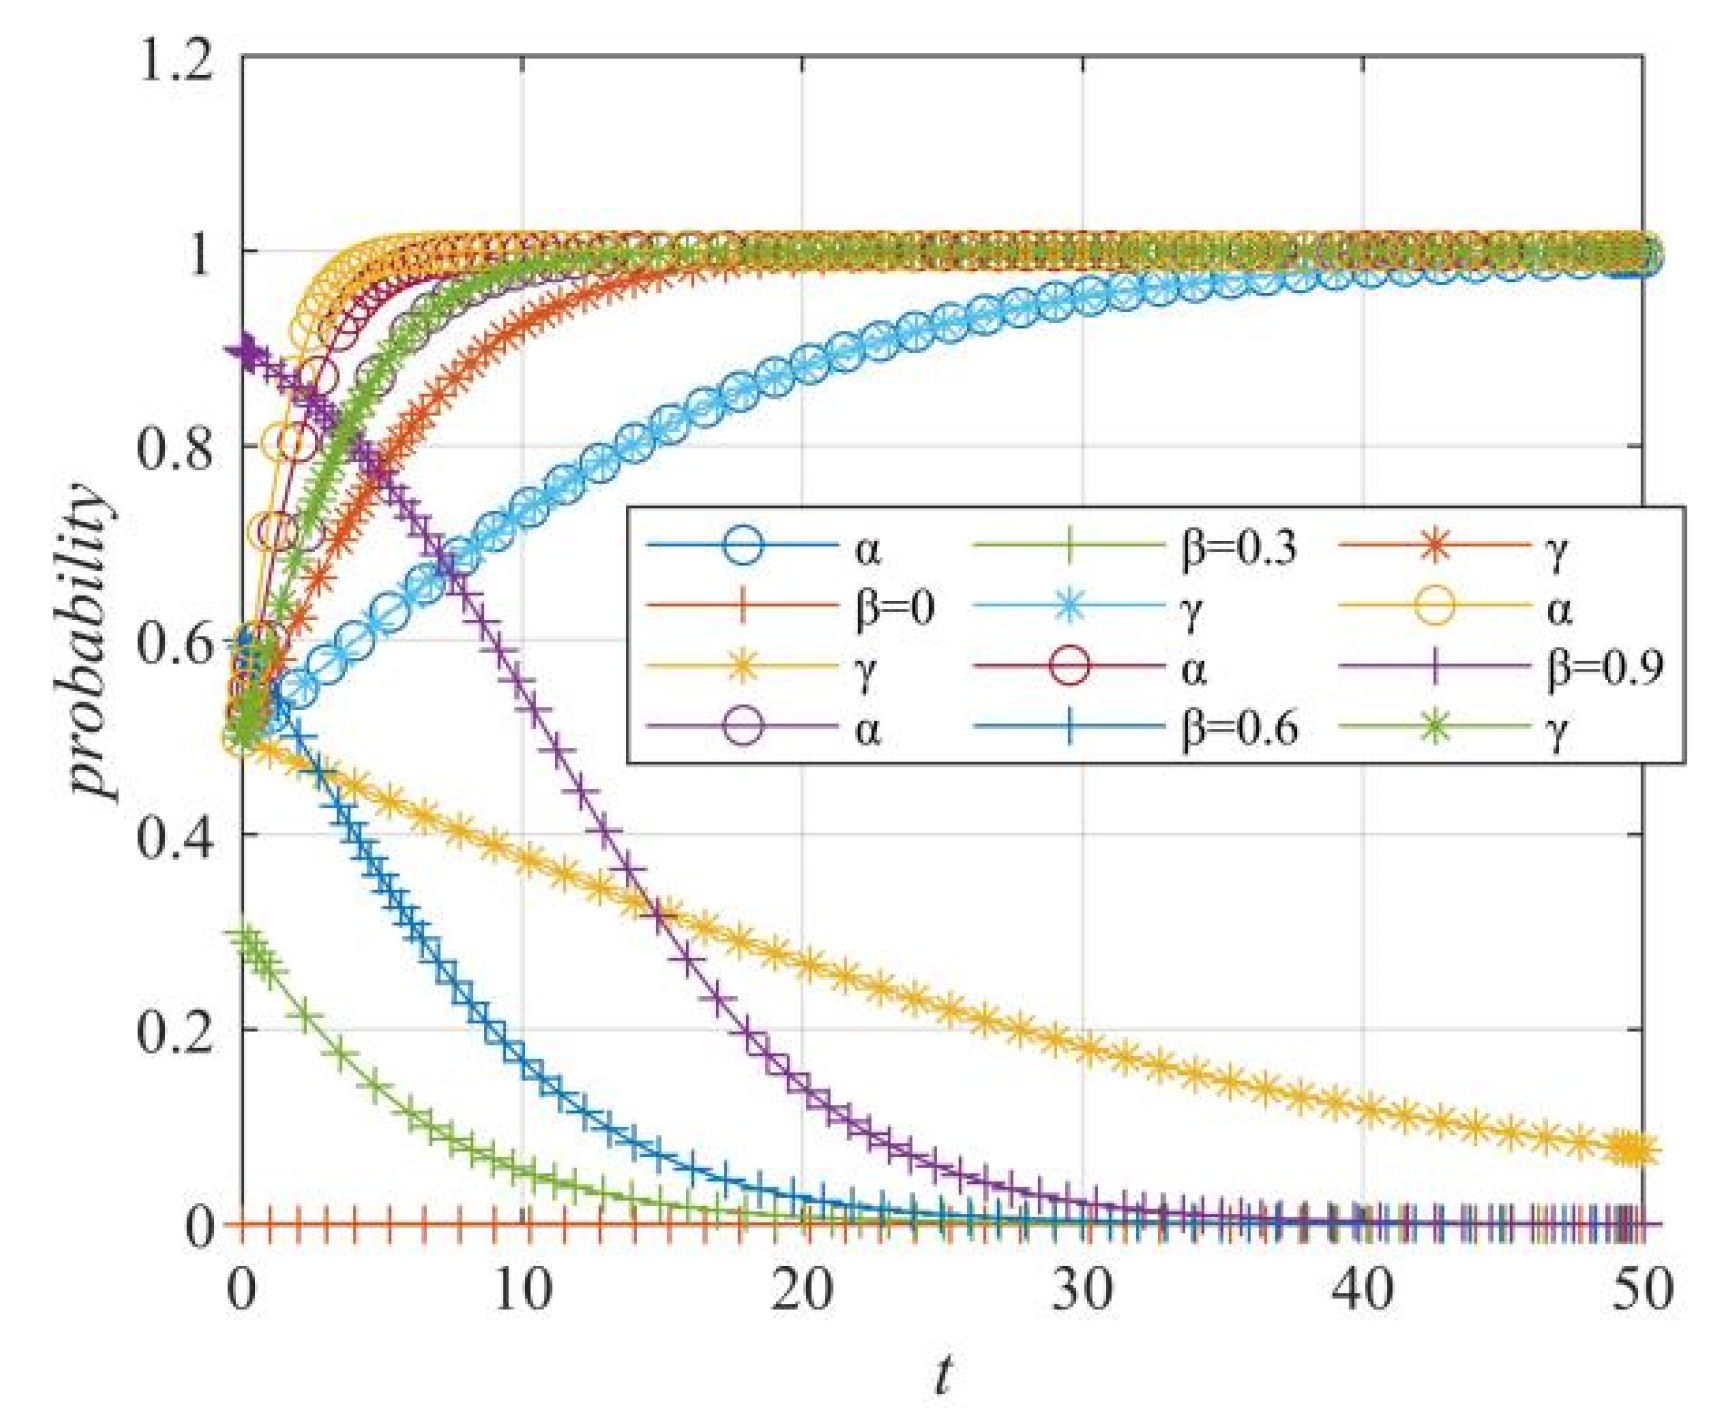
Figure 16.
β values on the evolution trend of the probability of “online media–enterprise–netizens” strategy selection.
Figure 16.
β values on the evolution trend of the probability of “online media–enterprise–netizens” strategy selection.
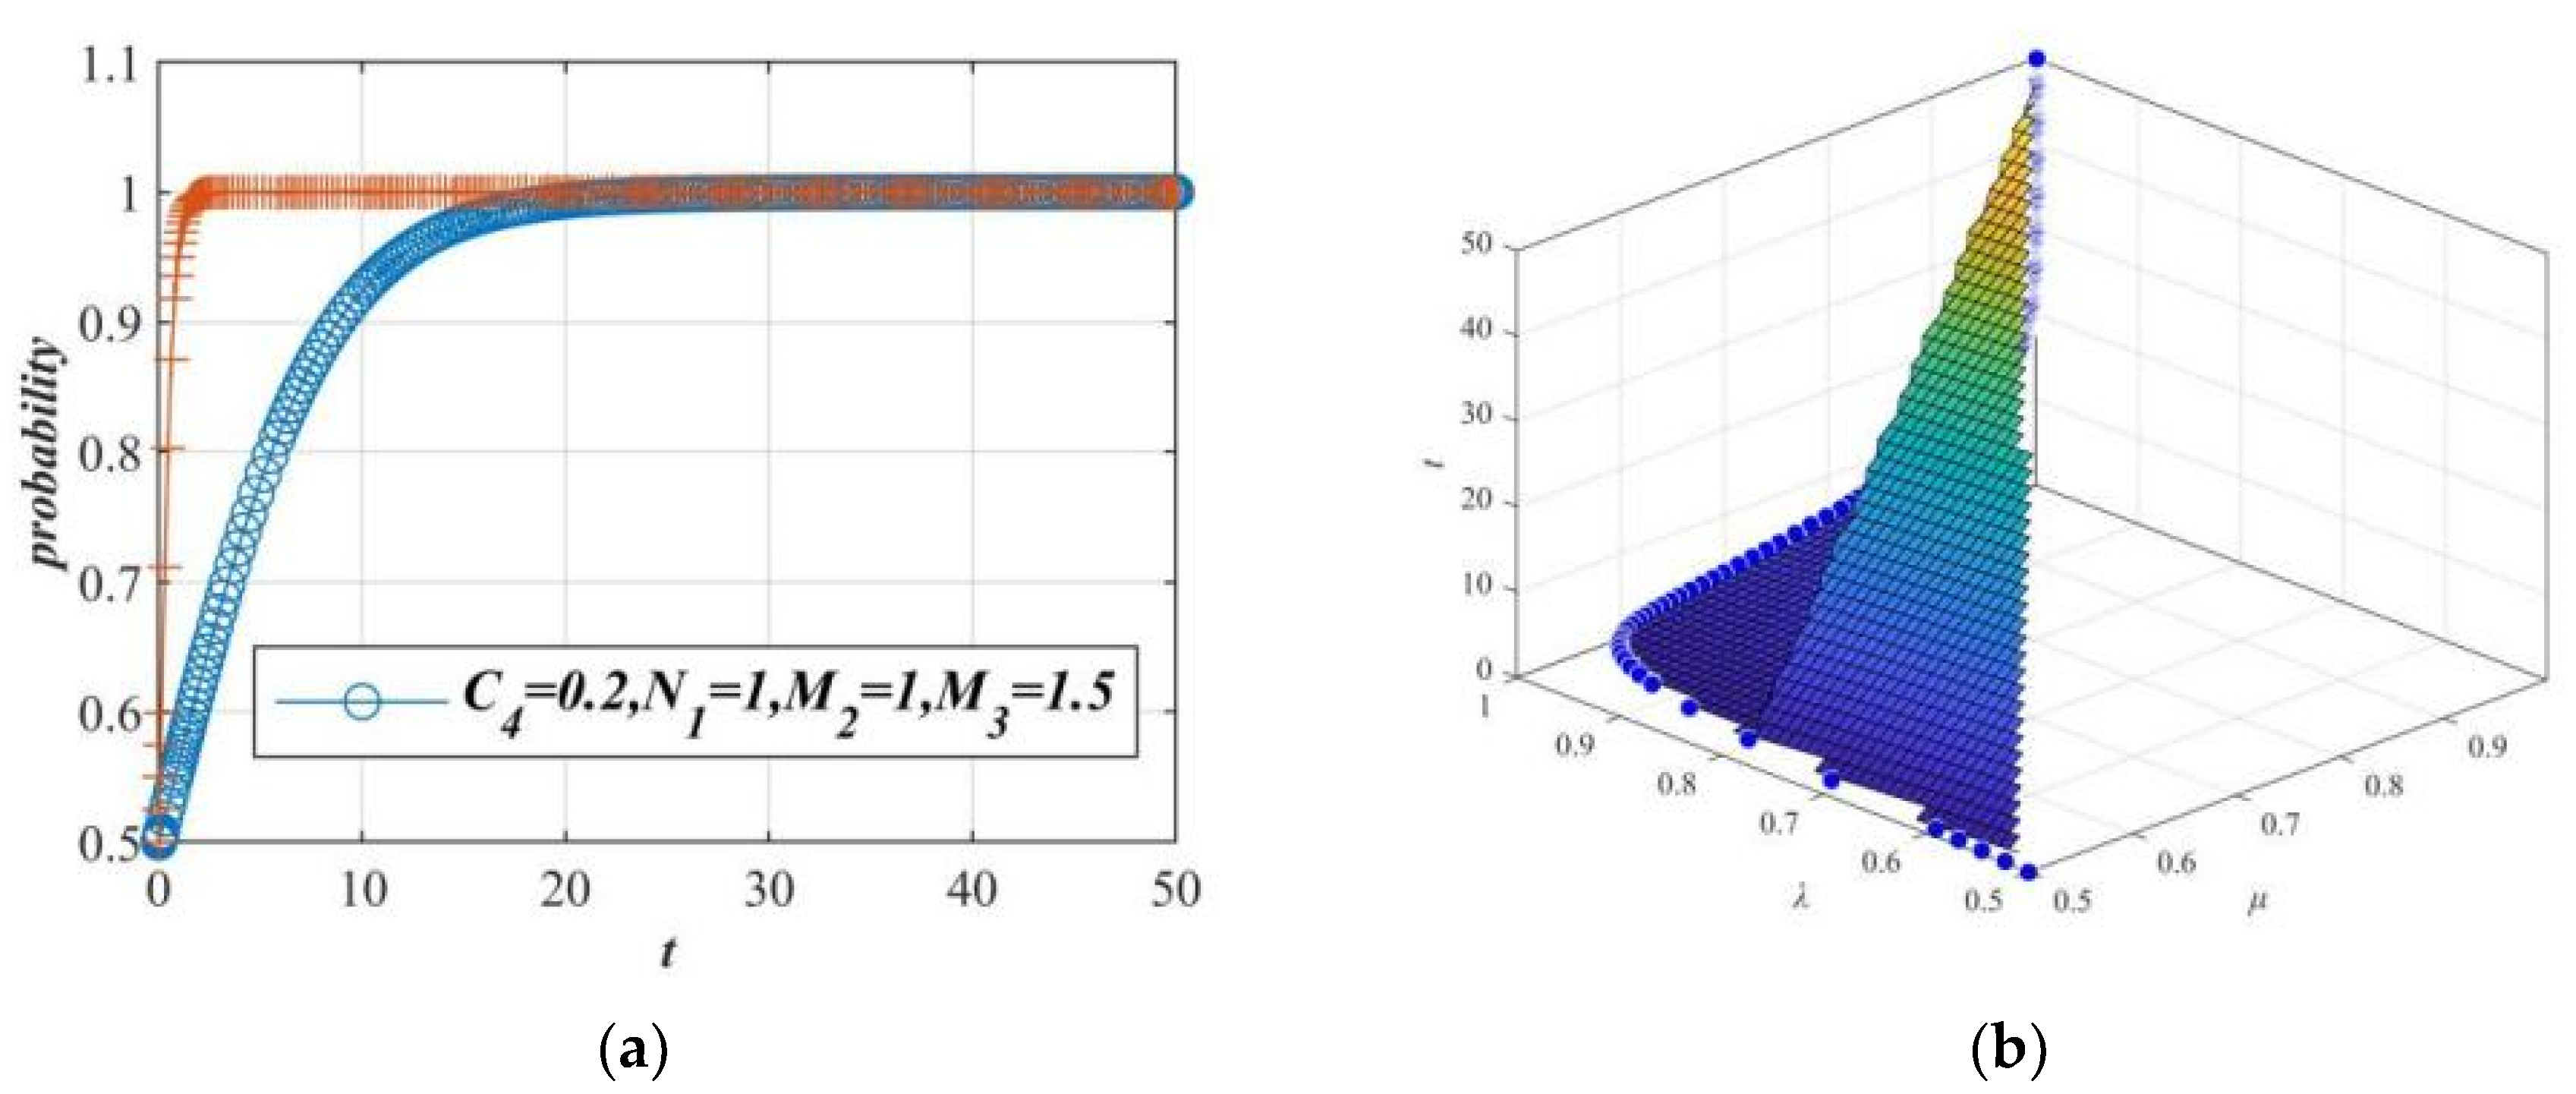
Figure 17.
Case 1: Game system evolution composed of netizens and the government tends to the stable point T4(1, 1). (a) Evolution of netizens and government. (b) Game system evolution composed of netizens and the government.
Figure 17.
Case 1: Game system evolution composed of netizens and the government tends to the stable point T4(1, 1). (a) Evolution of netizens and government. (b) Game system evolution composed of netizens and the government.
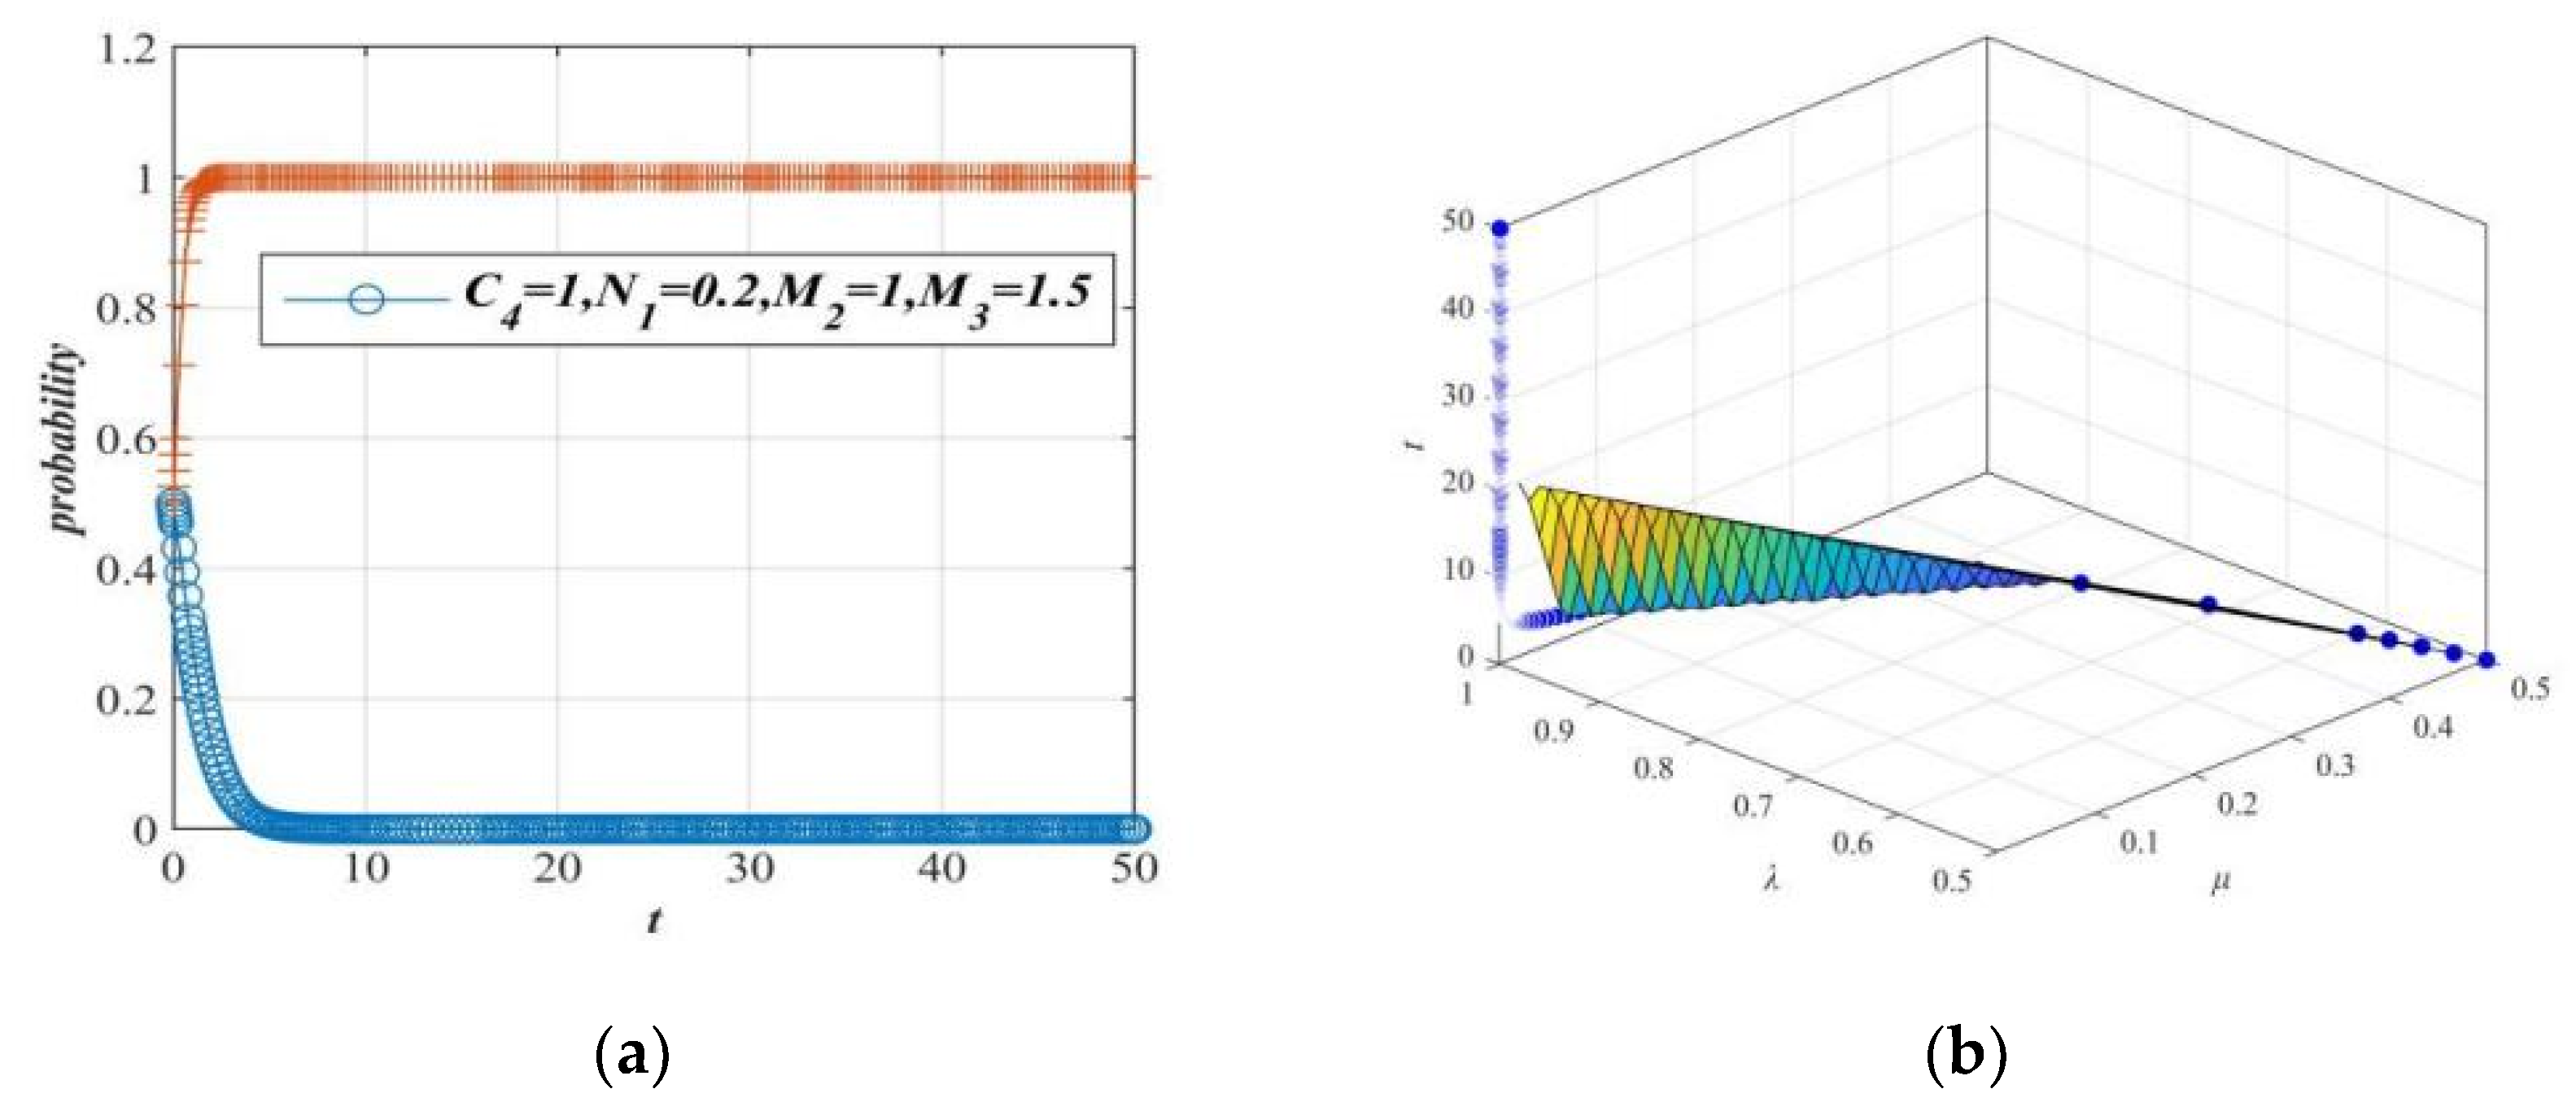
Figure 18.
Case 2: Game system evolution composed of netizens and the government tends to the stable point T5(0, 1). (a) Evolution of netizens and government. (b) Game system evolution composed of netizens and the government.
Figure 18.
Case 2: Game system evolution composed of netizens and the government tends to the stable point T5(0, 1). (a) Evolution of netizens and government. (b) Game system evolution composed of netizens and the government.
Figure 19.
Case 3: Game system evolution composed of netizens and the government tends to the stable point T6(0, 0). (a) Evolution of netizens and government. (b) Game system evolution composed of netizens and the government.
Figure 19.
Case 3: Game system evolution composed of netizens and the government tends to the stable point T6(0, 0). (a) Evolution of netizens and government. (b) Game system evolution composed of netizens and the government.
Figure 20.
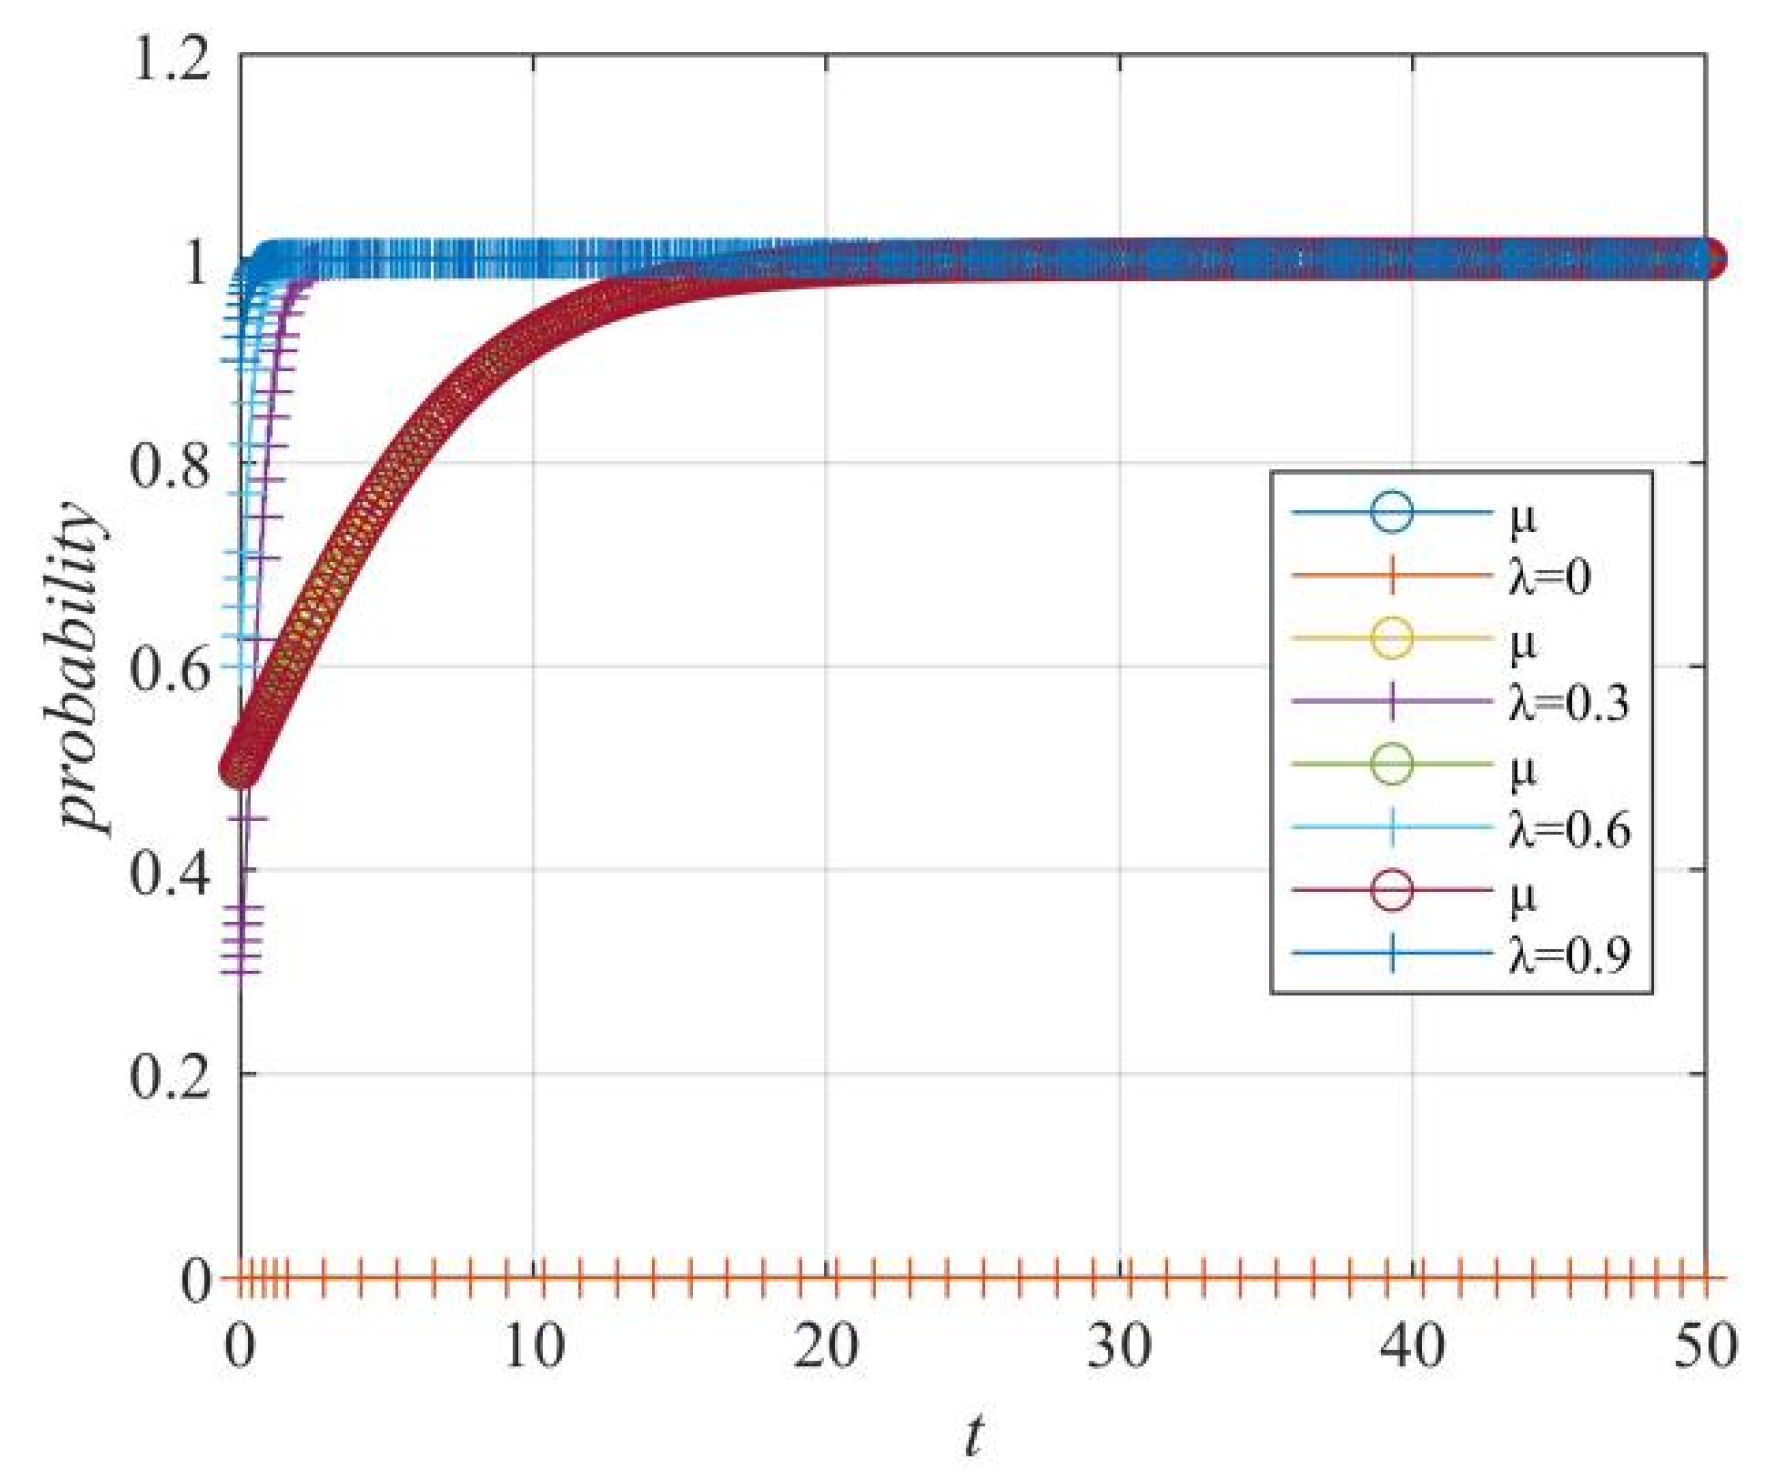
Case 1: The influence of government control probability λ on the “netizens–government” strategy choice.
Figure 20.
Case 1: The influence of government control probability λ on the “netizens–government” strategy choice.
Figure 21.
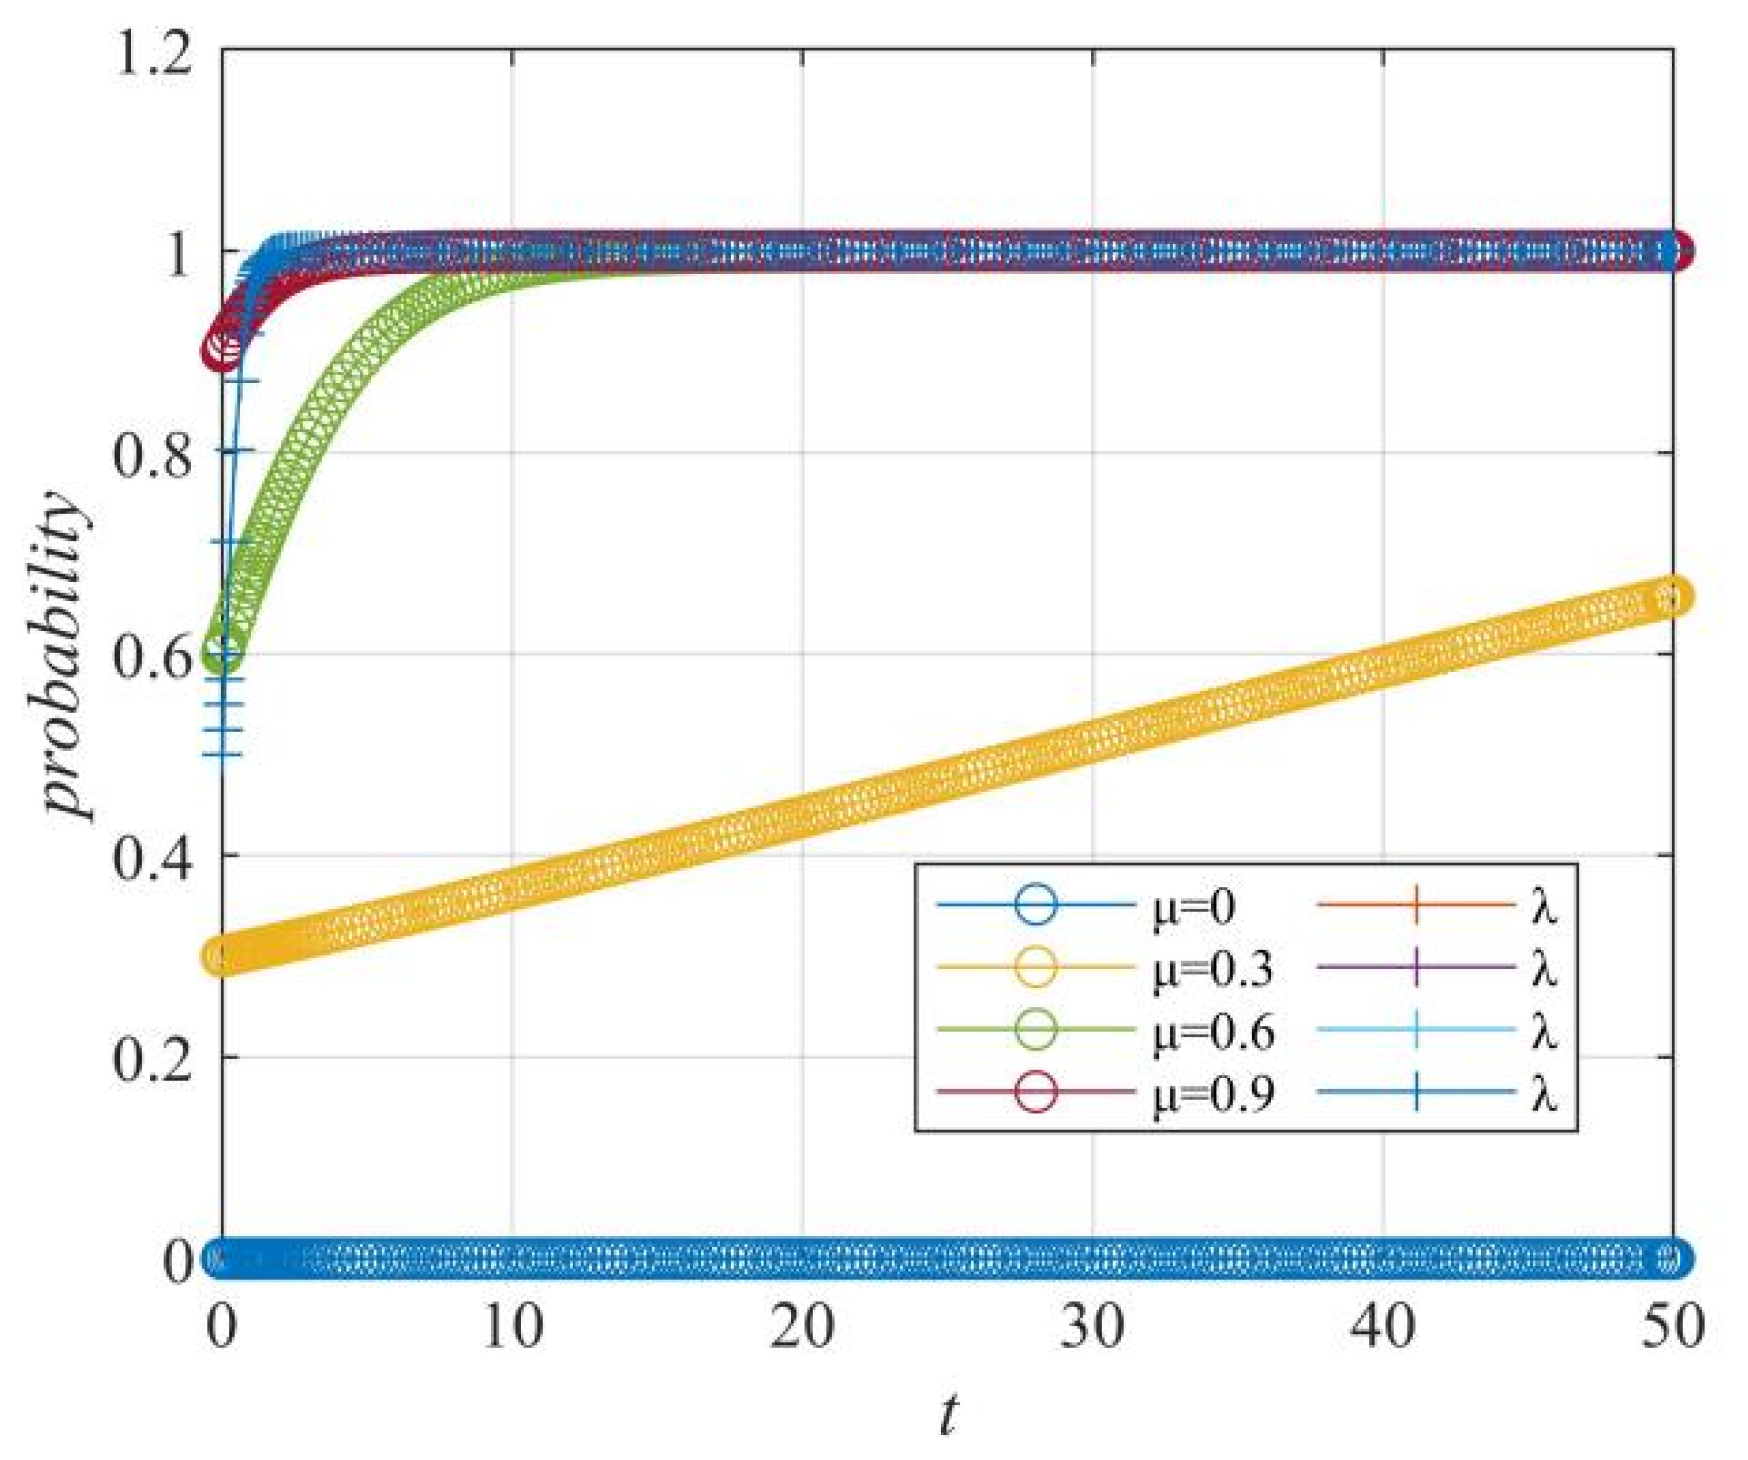
Case 1: The influence of the netizens’ probability of spreading μ on the “netizens–government” strategy choice.
Figure 21.
Case 1: The influence of the netizens’ probability of spreading μ on the “netizens–government” strategy choice.
Figure 22.
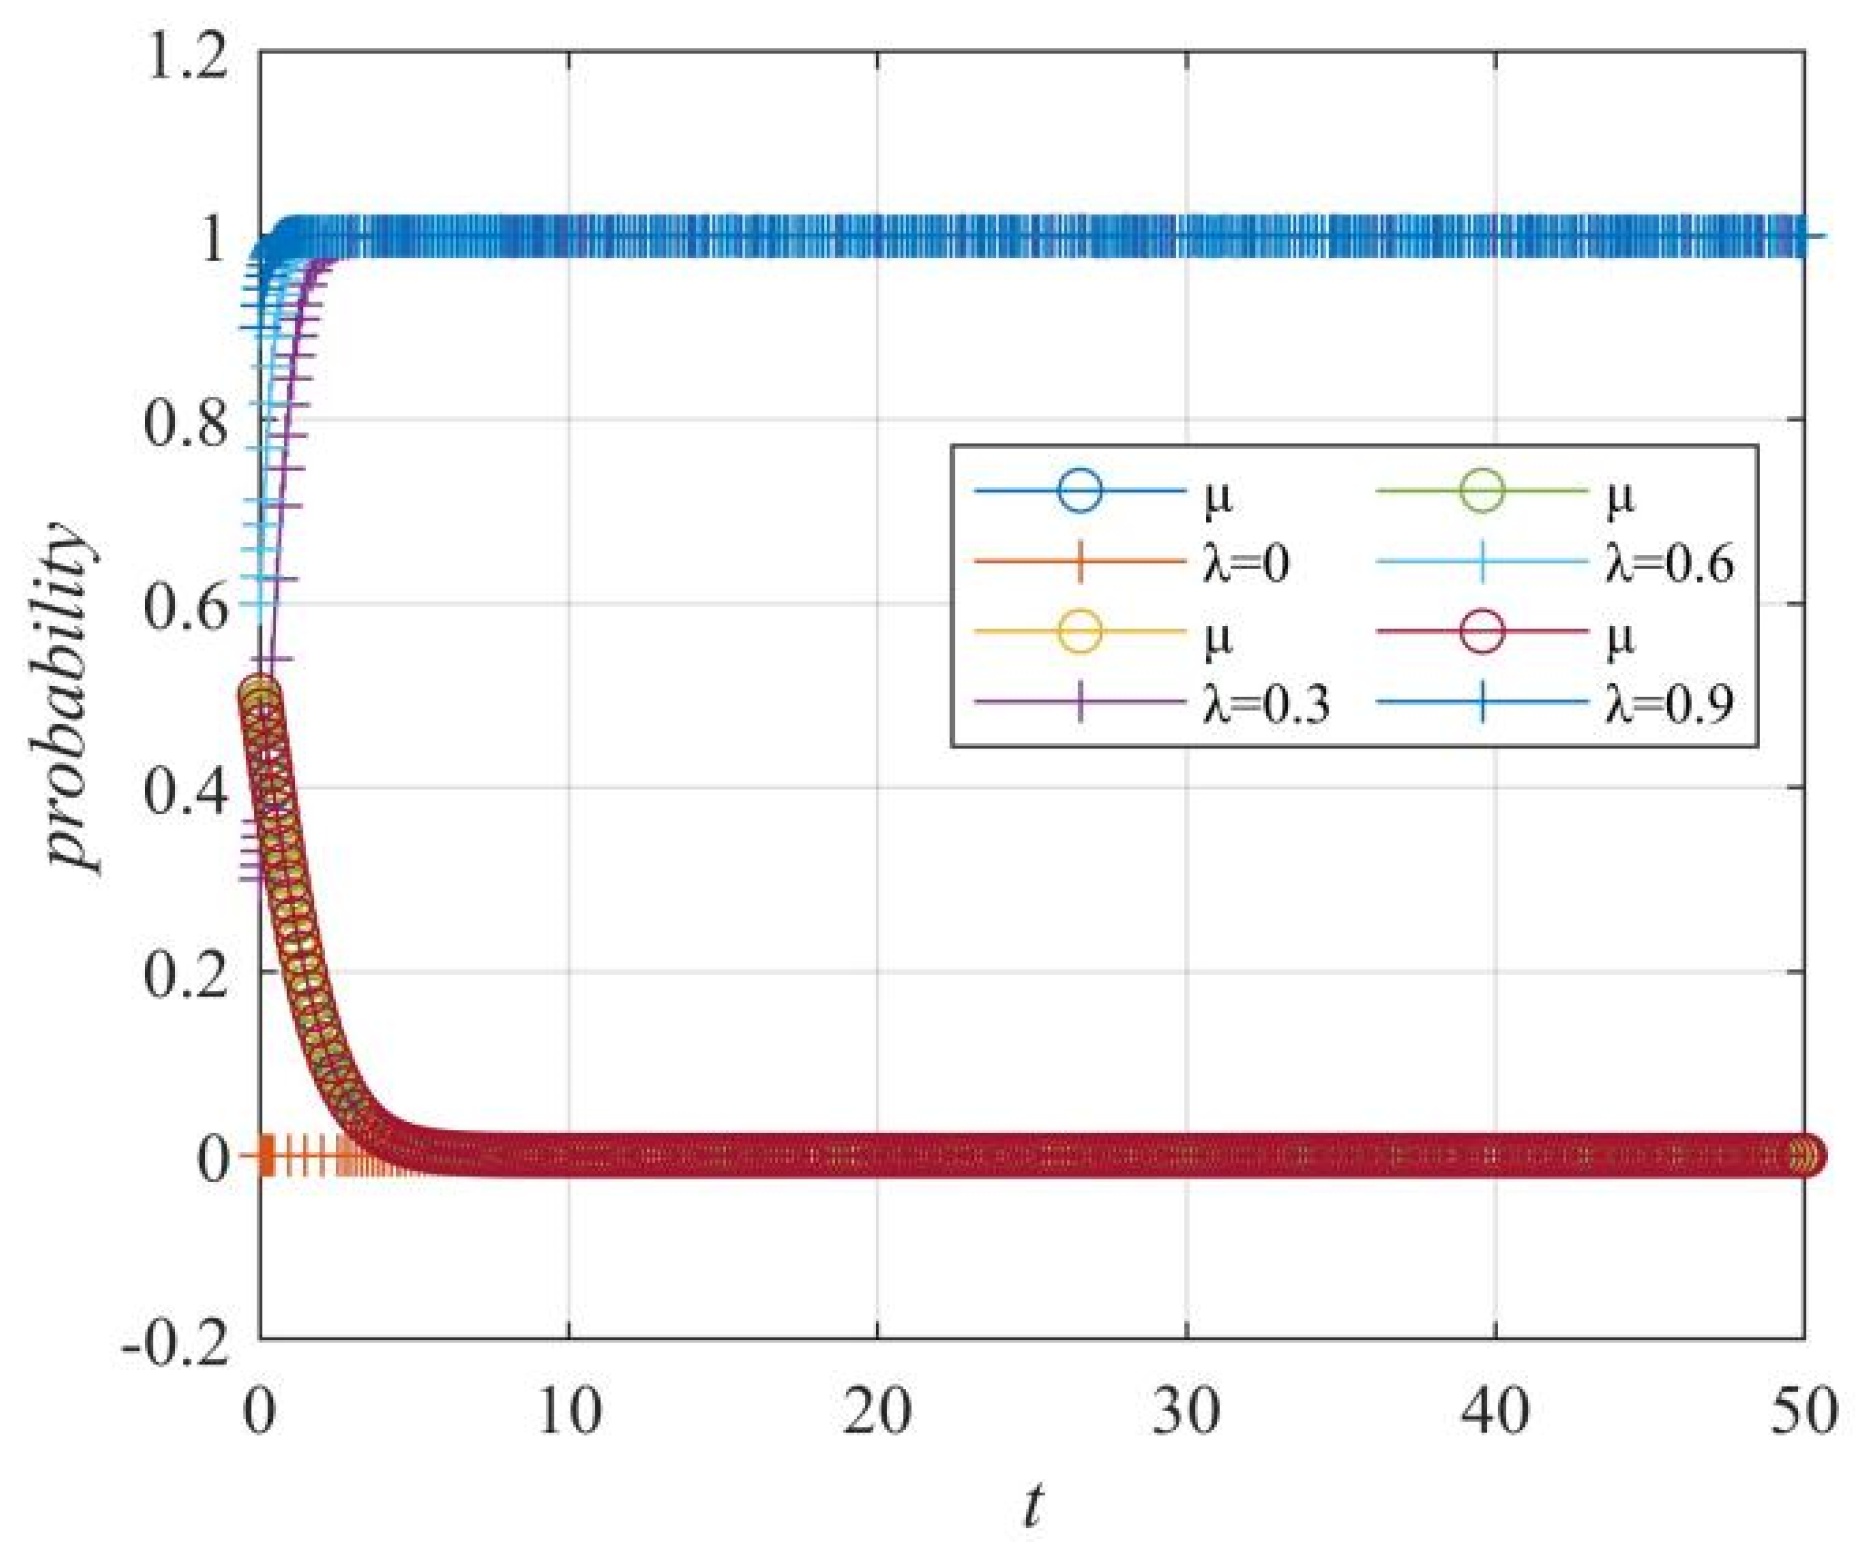
Case 2: The influence of the government control probability λ on the “netizens–government” strategy choice.
Figure 22.
Case 2: The influence of the government control probability λ on the “netizens–government” strategy choice.
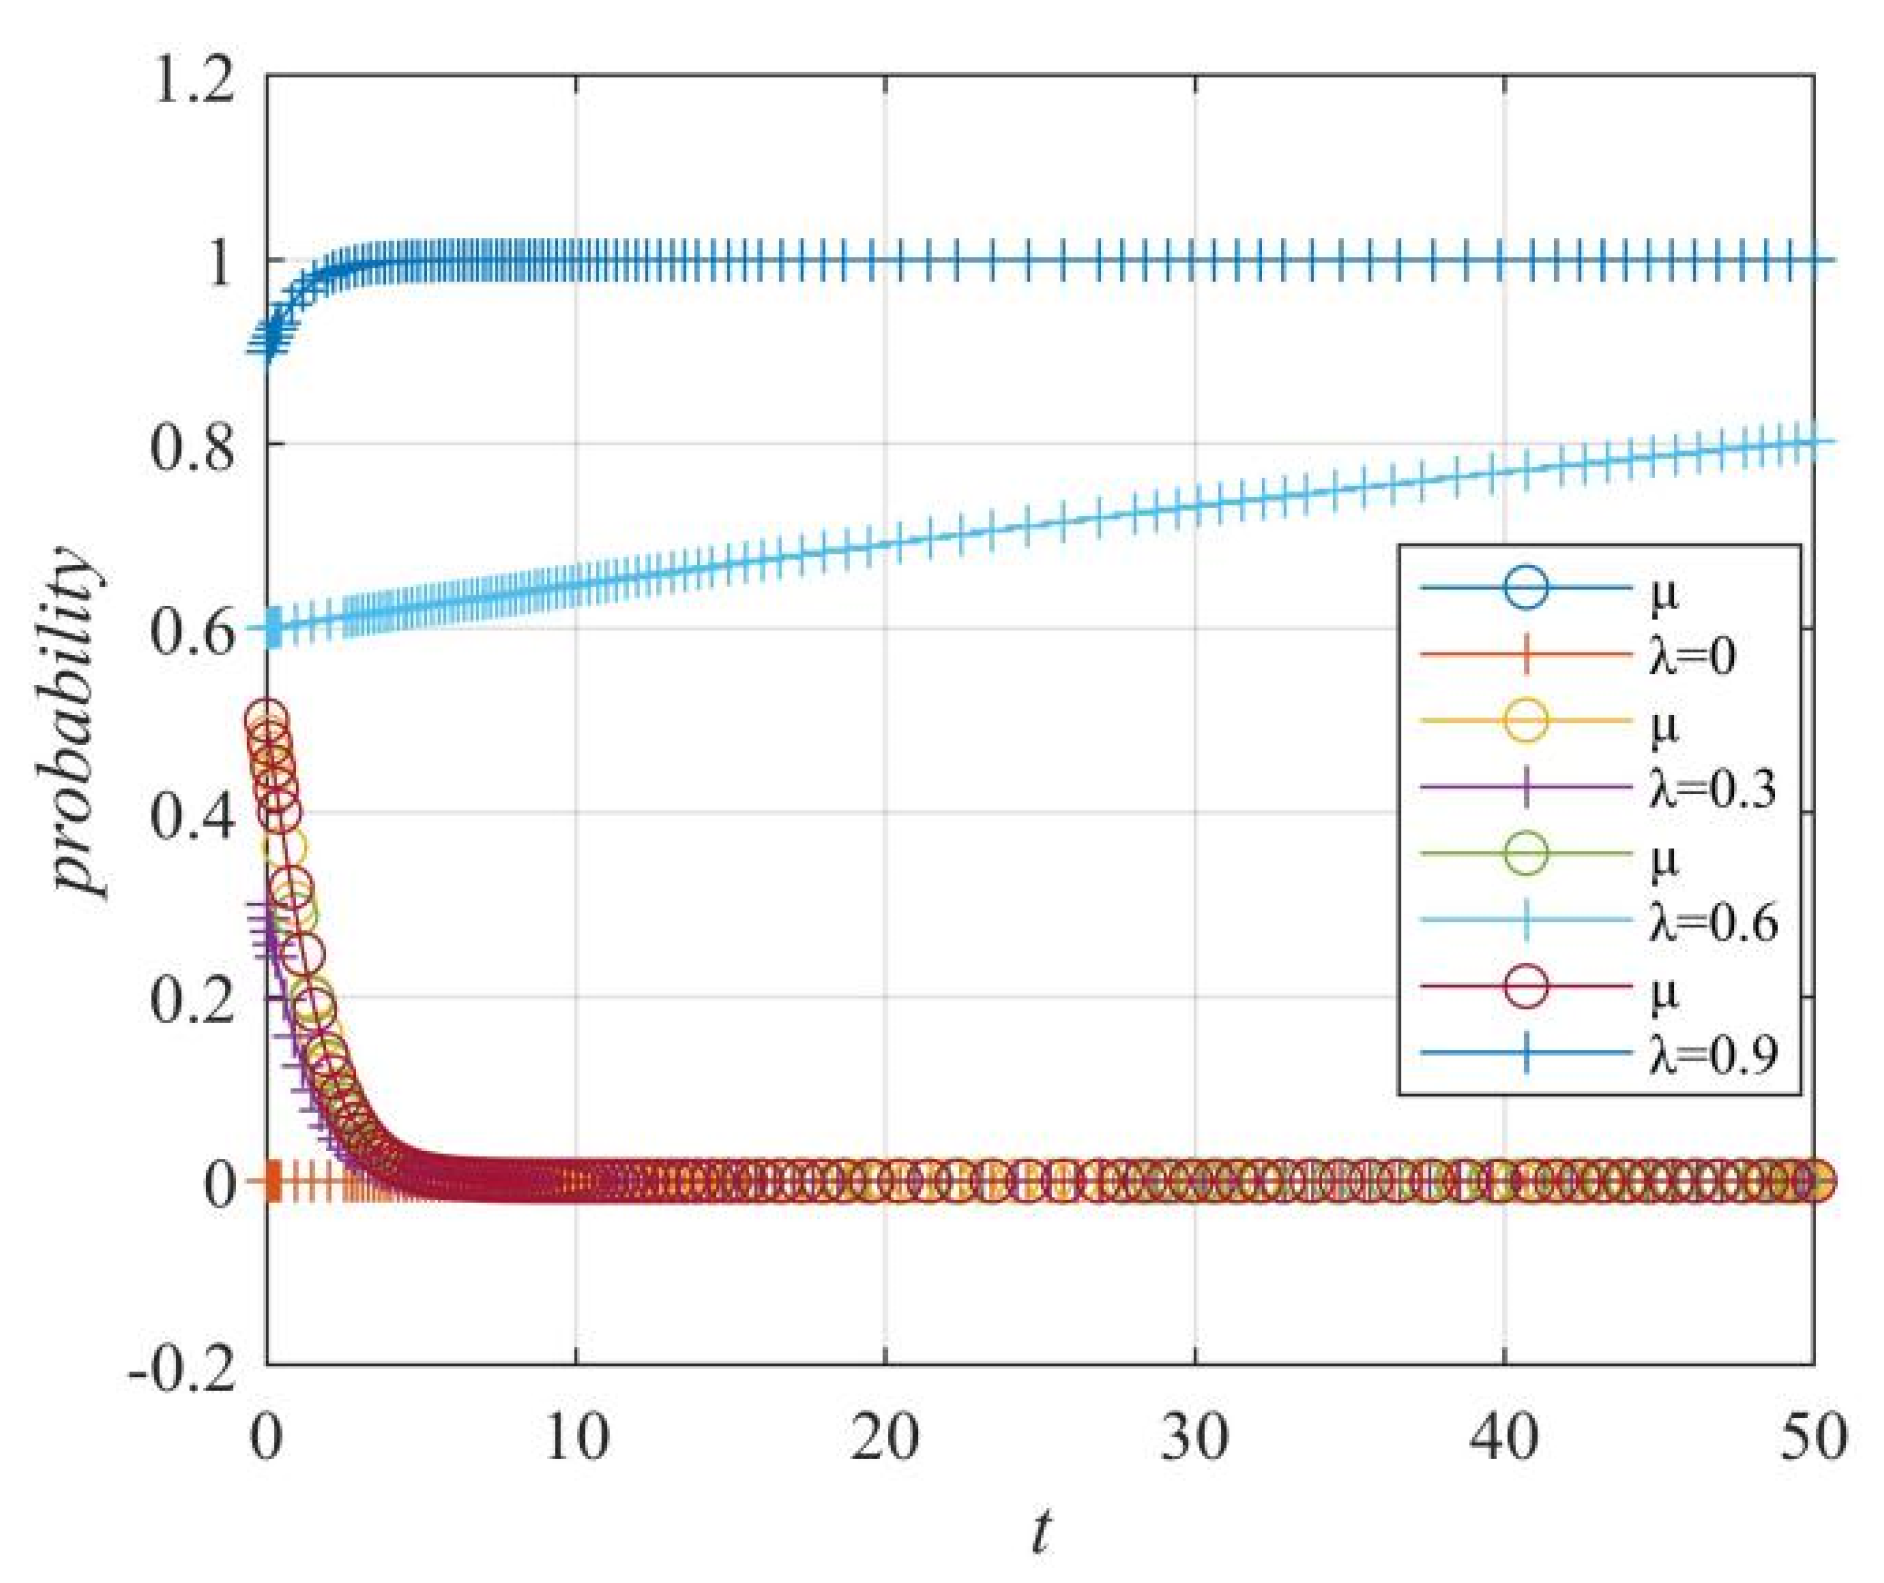
Figure 23.
Case 2: The influence of netizens’ probability of spreading μ on the “netizens–government” strategy choice.
Figure 23.
Case 2: The influence of netizens’ probability of spreading μ on the “netizens–government” strategy choice.
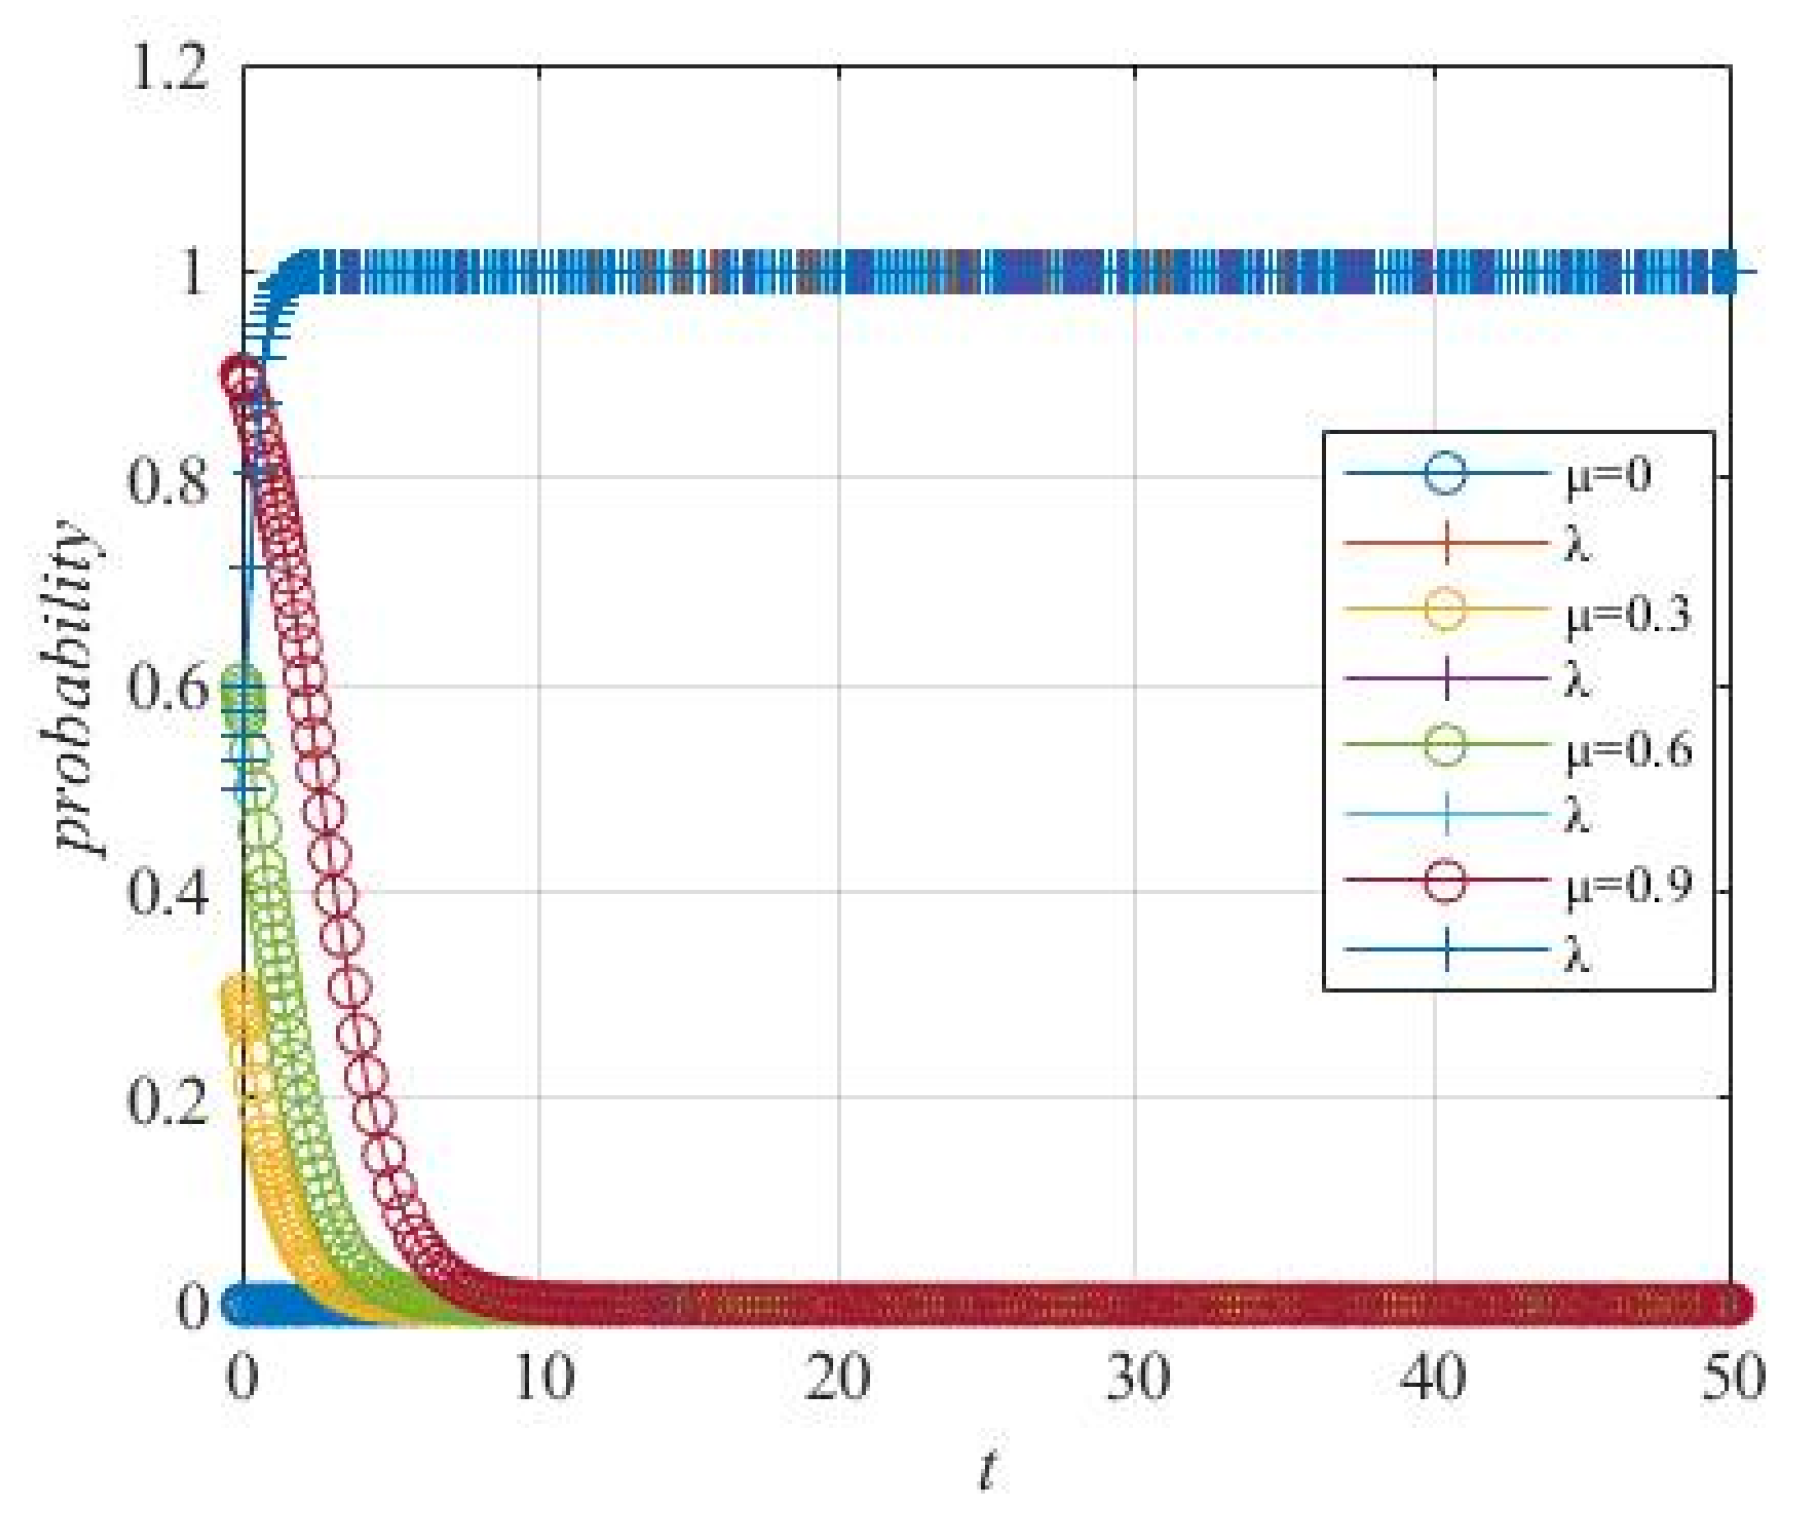
Figure 24.
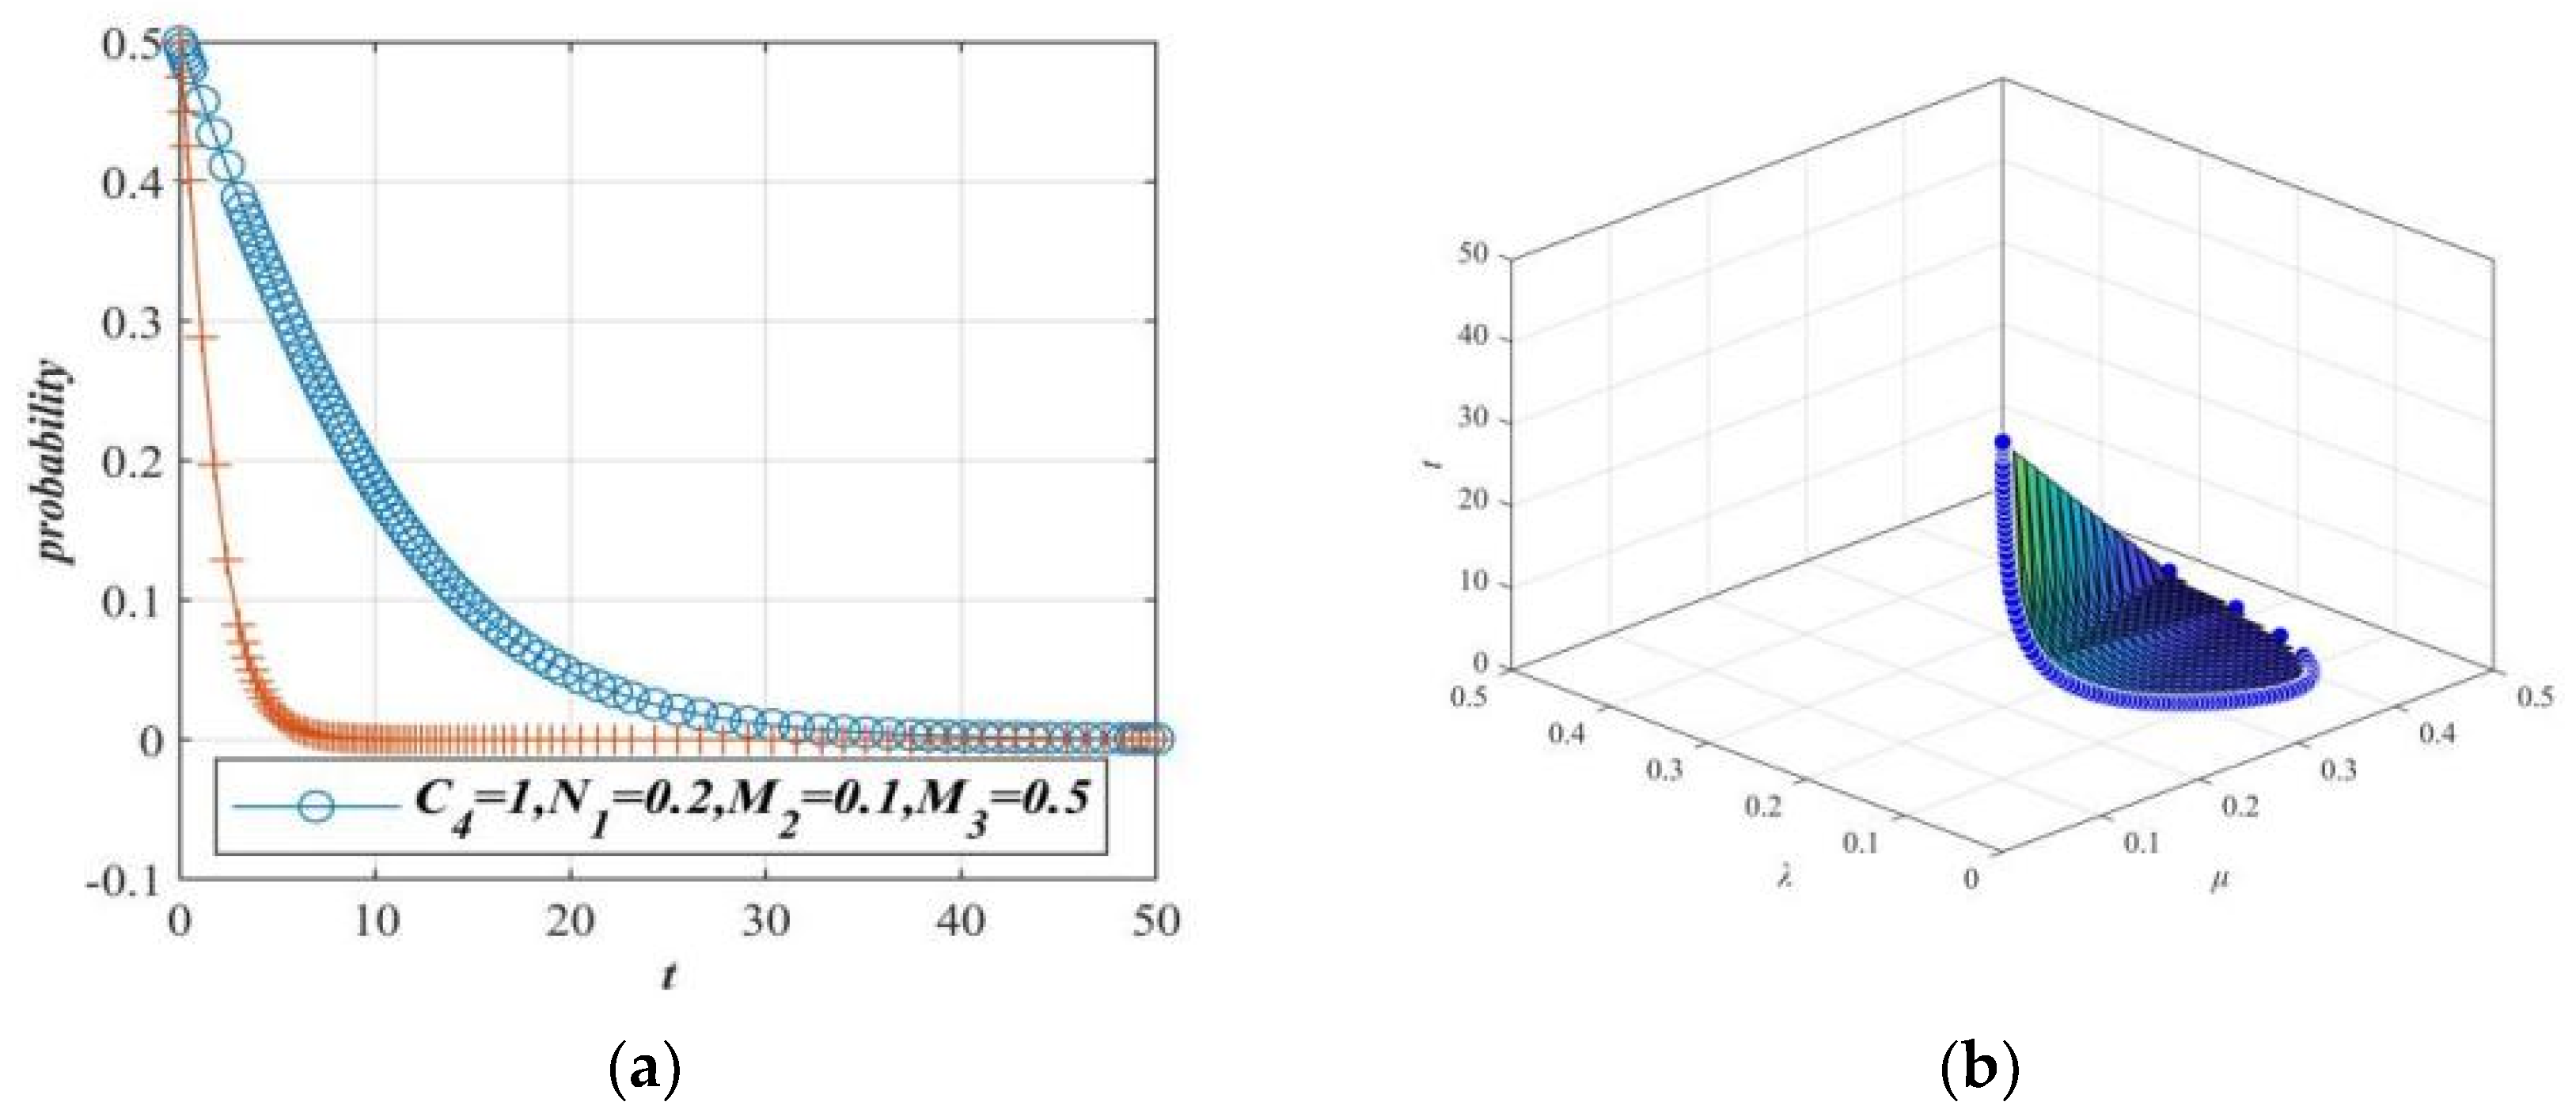
Case 3: The influence of government control probability λ on the “netizens–government” strategy choice.
Figure 24.
Case 3: The influence of government control probability λ on the “netizens–government” strategy choice.
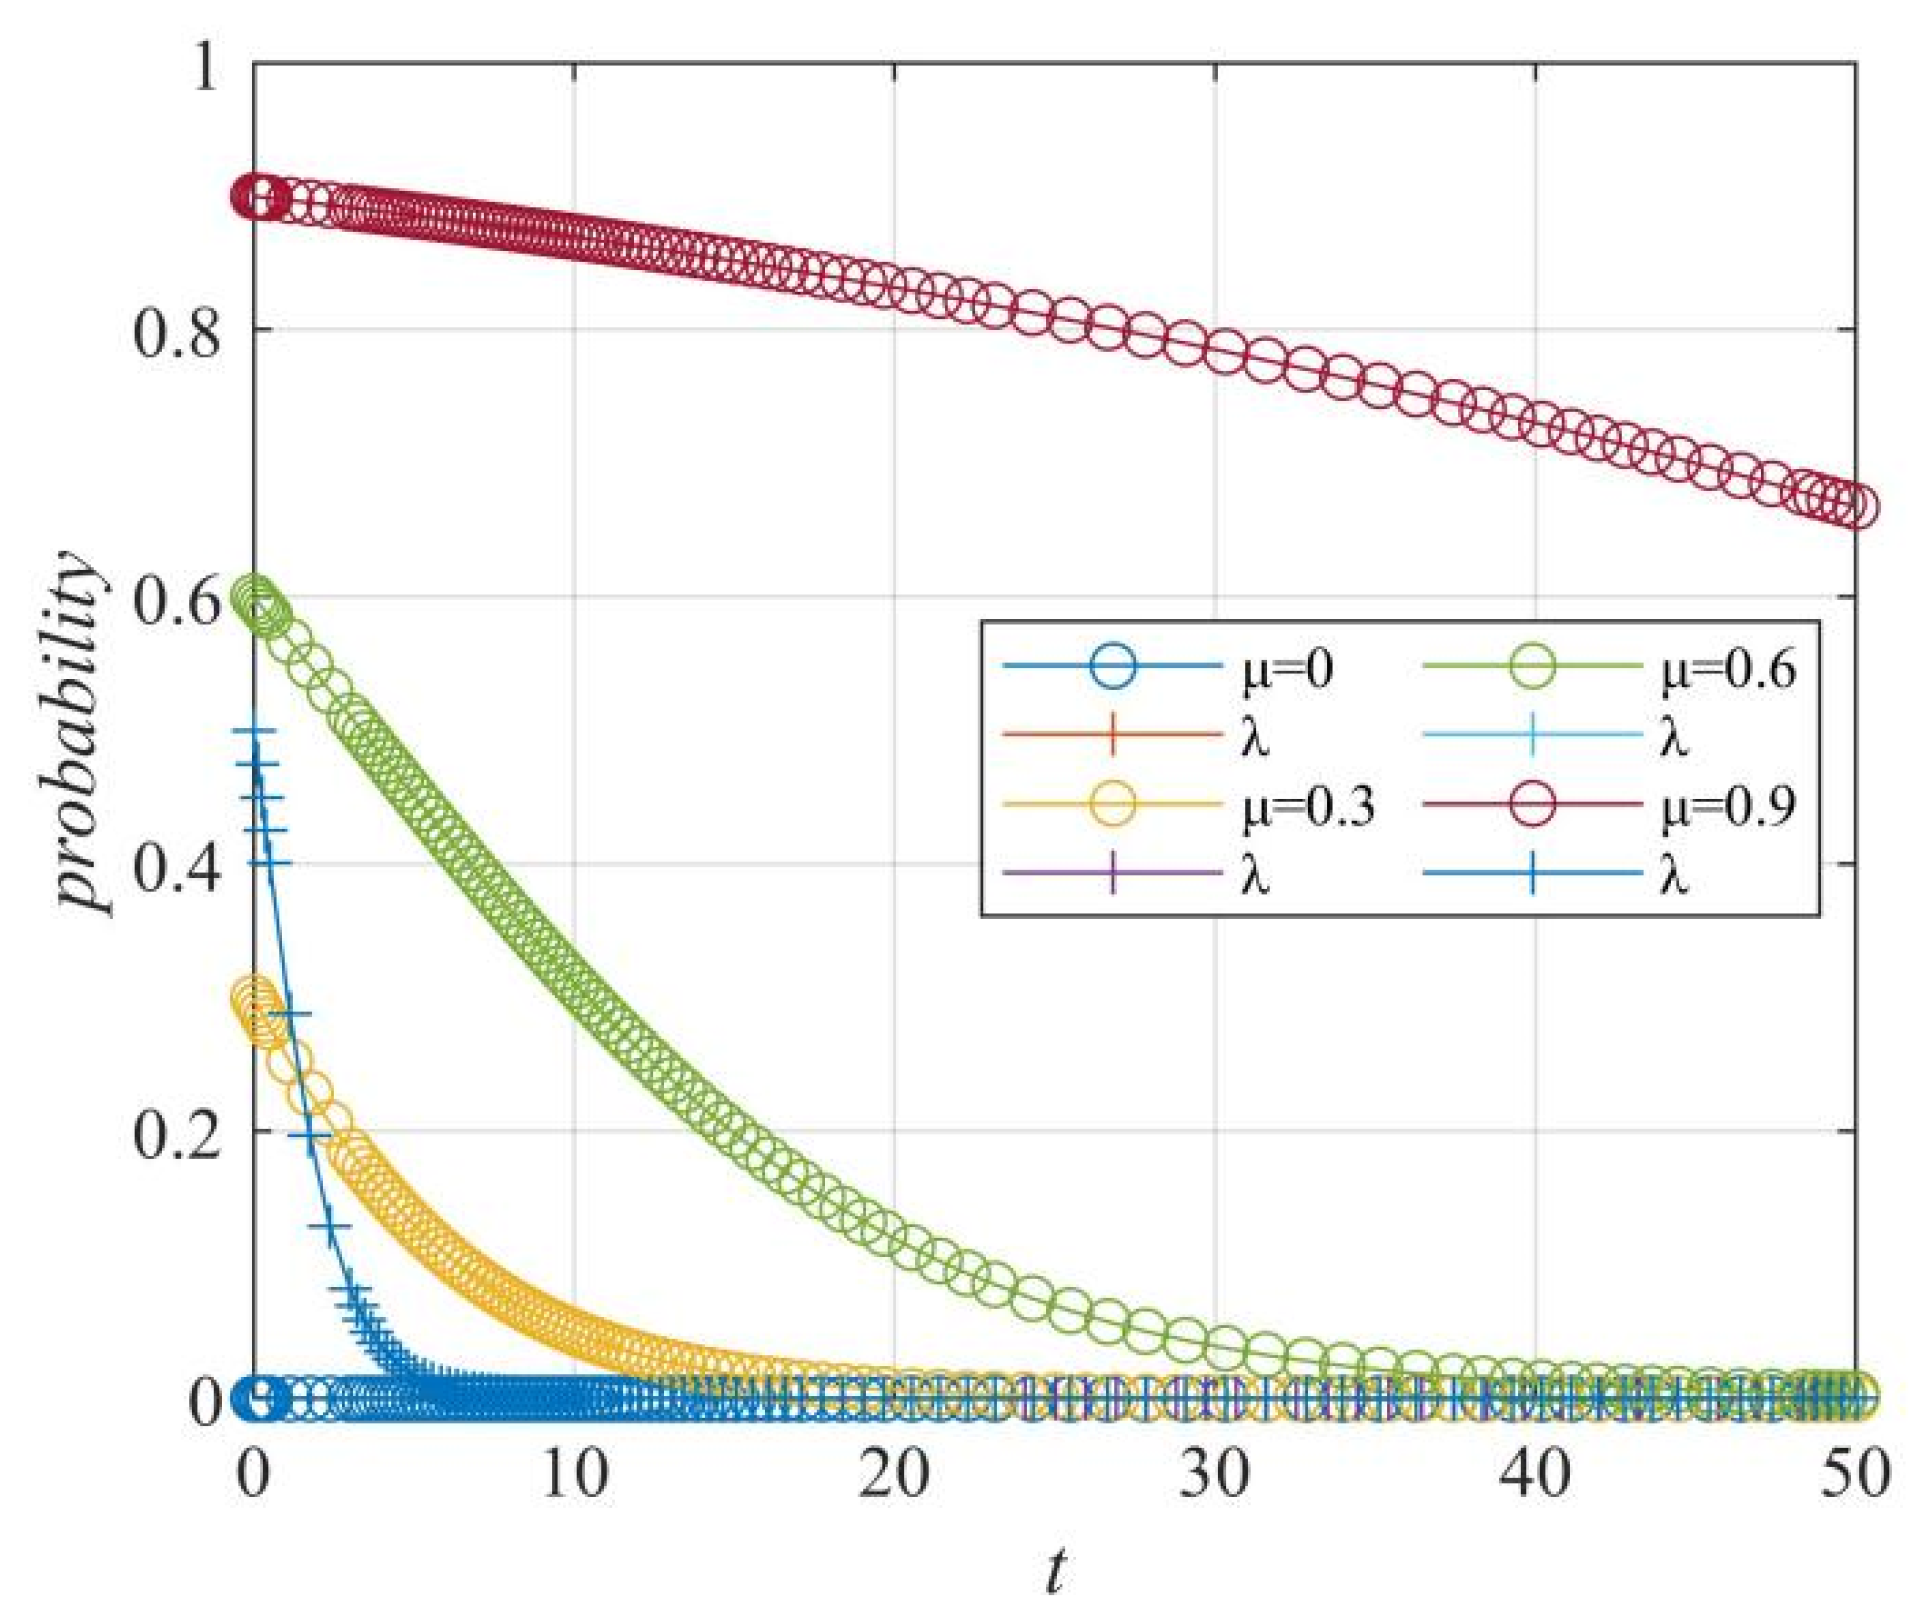
Figure 25.
Case 3: The influence of the netizens’ probability of spreading μ on the “netizens−government” strategy choice.
Figure 25.
Case 3: The influence of the netizens’ probability of spreading μ on the “netizens−government” strategy choice.
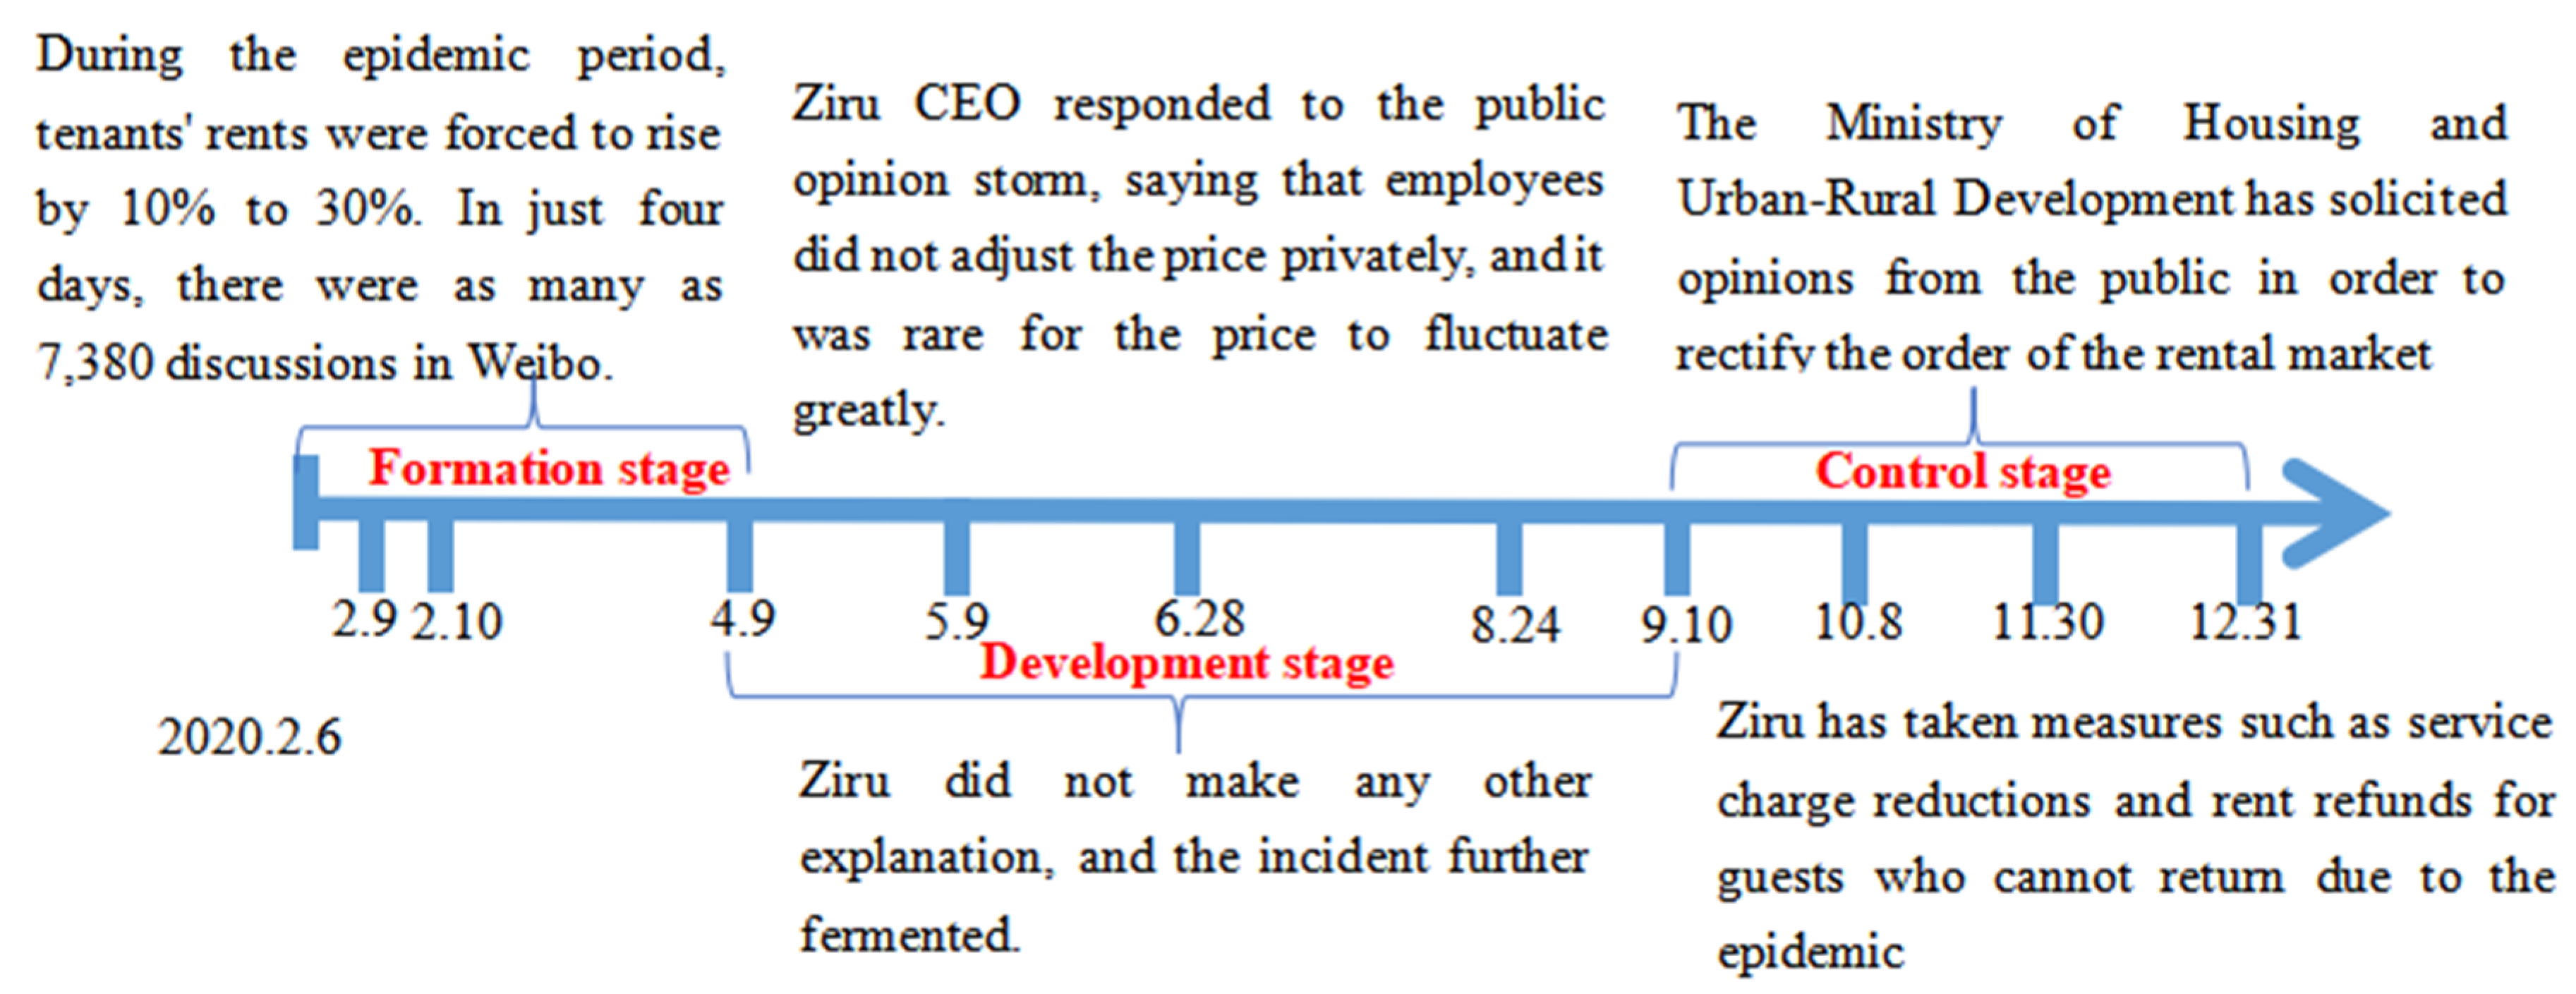
Figure 26.
Review of “Ziru increased rental price during the epidemic” event.
Figure 26.
Review of “Ziru increased rental price during the epidemic” event.
Figure 27.
Comments on “Ziru increased rental price during the epidemic” event.
Figure 27.
Comments on “Ziru increased rental price during the epidemic” event.
Table 1.
Parameter definitions in the game process of “opinion leaders-ordinary netizens”.
Table 1.
Parameter definitions in the game process of “opinion leaders-ordinary netizens”.
| Parameter | Definitions |
|---|
| φ | The probability that ordinary netizens choose to spread negative network public opinion events |
| ζ | The probability that opinion leaders choose to spread negative network public opinion events |
| S1(S1 > S2) | The cost of opinion leaders choosing to spread public opinion events |
| S2 | The cost of ordinary netizens choosing to spread public opinion events |
| S3 | The risk cost when opinion leaders or ordinary netizens participate in the dissemination of public opinion events |
| U1(U1 > U2) | The benefit when opinion leaders and ordinary netizens participate in the dissemination of public opinion events |
| U2 | The benefit of participator when opinion leaders or ordinary netizens participate in the dissemination of public opinion events |
Table 2.
Income risk matrix of “opinion leaders-ordinary netizens”.
Table 2.
Income risk matrix of “opinion leaders-ordinary netizens”.
| No. | Combination | Opinion Leaders | Ordinary Netizens |
|---|
| 1 | (dissemination, dissemination) | U1 − S1 | U1 − S2 |
| 2 | (dissemination, non-dissemination) | U2 − S1 − S3 | 0 |
| 3 | (non-dissemination, dissemination) | 0 | U2 − S2 − S3 |
| 4 | (non-dissemination, non-dissemination) | 0 | 0 |
Table 3.
Parameter definitions in the game process of “online media-opinion leaders-ordinary netizens”.
Table 3.
Parameter definitions in the game process of “online media-opinion leaders-ordinary netizens”.
| Parameter | Definition |
|---|
| α | The probability that online media choose to promote negative public opinion events |
| β | The probability that enterprises choose to respond positively to public opinion events |
| γ | The probability that netizens choose to trust the enterprise’s response |
| RA | The fixed gain of enterprises when the enterprise attracts netizen’s attention when negative public opinion take place |
| Re | The additional gain of enterprises when netizens choose to believe in the enterprise’s responses |
| C1 | The cost of enterprises responding positively to negative events |
| C2 | The cost of enterprises responding negatively to negative events |
| C3 | The cost of online media to follow up and respond to the negative public opinion |
| P1 | The enterprise’s profit from responding positively to public opinion and taking positive measures to restore its image to the public |
| P2 | The enterprise’s profit from responding positively to public opinion, which is trusted by netizens |
| P3 | The enterprise’s profit from responding positively to public opinion, which is promoted by online media |
| L1 | The enterprise’s loss from responding negatively to public opinion and hurting public image |
| L2 | The enterprise’s loss from responding negatively when online media promote public opinion development, which further hurts its public image |
| D1 | The netizen’s benefit of a sense of group belonging and identity when netizens believe in the enterprise’s explanation, if they are promoted by online media |
| D2 | The netizen’s loss of psychological gap when netizens believe in the enterprise’s explanation, if they are blocked by online media |
| D3 | The netizens’ cost of trusting an enterprise that respond negatively |
| W1 | The enterprise’s pressure to respond negatively when online media promote public opinion development |
| W2 | The benefit of increased flow, attention, and advertisement profit when online media promote public opinion development |
| W3 | The loss of reduced platform influence and attention when online media blocks public opinion development |
Table 4.
Income risk matrix of “online media-opinion leaders-ordinary netizens”.
Table 4.
Income risk matrix of “online media-opinion leaders-ordinary netizens”.
| No. | Combination | Online Media | Enterprise | Netizen |
|---|
| 1 | (promote, positive response, trust) | −C3 + W2 | RA − C1 + Re + P1 + P2 + P3 | D1 |
| 2 | (promote, positive response, not trust) | −C3 + W2 | RA − C1 + P1 + P3 | D1 |
| 3 | (promote, negative response, trust) | −C3 − W1 + W2 | RA − C2 − L1 − L2 + Re | D1 − D3 |
| 4 | (promote, negative response, not trust) | −C3 − W1 + W2 | RA − C2 − L1 − L2 | D1 − D3 |
| 5 | (block, positive response, trust) | −W3 | RA − C1 + Re + P1 + P2 | −D2 |
| 6 | (block, positive response, not trust) | −W3 | RA − C1 + P1 | −D2 |
| 7 | (block, negative response, trust) | −W3 | RA − C2 + Re − L1 | −D2−D3 |
| 8 | (block, negative response, not trust) | −W3 | RA − C2 − L1 | −D2 |
Table 5.
Parameter definitions in the game process of “government-netizens”.
Table 5.
Parameter definitions in the game process of “government-netizens”.
| Parameter | Definition |
|---|
| λ | The probability that the government chooses to control the development of public opinion |
| μ | The probability that netizens choose to spread negative public opinion events |
| C4 | The cost of time, effort, searching, and other costs for netizens to spread negative public opinion events |
| C5 | The cost of government control, if it is not controlled, the cost is 0 |
| N1 | The netizens’ benefits of obtaining a sense of belonging while spreading negative public opinion incidents to force government departments to pay attention to this public opinion incident and promptly take control of it |
| N2 | The netizens’ loss of not spreading negative public opinion incidents to force government departments to pay attention to this public opinion incident and take control of it |
| M1 | The netizens’ benefits of obtaining trust while spreading negative public opinion incidents to force government departments to pay attention to this public opinion incident and promptly take control of it |
| M2 | The netizens’ benefits of obtaining social stability while government departments take control of public opinion no matter if they spread or not |
| M3 | The government’s loss of reduced social credibility when they do not control public opinion |
| M4 | The government’s loss of reduced social credibility if they do not control public opinion while netizens spread it |
Table 6.
Income risk matrix of “government-netizens”.
Table 6.
Income risk matrix of “government-netizens”.
| No | Combination | Netizen | Government |
|---|
| 1 | (forward, control) | −C4 + N1 | −C5 + M2 + M1 |
| 2 | (forward, not control) | −C4 − N2 | −M3 − M4 |
| 3 | (not forward, control) | 0 | −C5 + M2 |
| 4 | (not forward, not control) | 0 | −M3 |
Table 7.
Evolutionary equilibrium strategy of “opinion leaders-ordinary netizens”.
Table 7.
Evolutionary equilibrium strategy of “opinion leaders-ordinary netizens”.
| No. | φ | ζ | Equilibrium Point |
|---|
| 1 | | | (φ, ζ) |
| 2 | | | (1, 1) |
| 3 | | | (0, 1) |
| 4 | | | (1, 0) |
| 5 | | | (0, 0) |
Table 8.
Analysis of the partial stability of the evolutionary game system of “opinion leaders-ordinary netizens”.
Table 8.
Analysis of the partial stability of the evolutionary game system of “opinion leaders-ordinary netizens”.
| Equilibrium Point | detJ Symbol | trJ Symbol | Equilibrium Condition | Result | Equilibrium Strategy |
|---|
| (φ, ζ) | uncertain | − | − | Saddle point | − |
| (1, 1) | uncertain | − | − | Saddle point | − |
| (0, 1) | uncertain | − | − | Saddle point | − |
| (1, 0) | + | − | S2 − S1 + S3 + U1 − U2 < 0; | ESS1 | (disseminate, not disseminate) |
| (0, 0) | uncertain | − | − | Saddle point | − |
Table 9.
Equilibrium point of the game process among “online media-enterprises-netizens”.
Table 9.
Equilibrium point of the game process among “online media-enterprises-netizens”.
| Online Media | The Probability β of the Enterprise Choosing to Respond Positively to Public Opinion Events | Judge the value of the Equilibrium Point by Positive and Negative Value | Equilibrium Point |
| _ | Take any value |
| | α = 1 |
| | α = 0 |
| Enterprise | The probability γ of the netizens choosing to believe the company’s response | Judge the value of the Equilibrium Point by positive and negative value | equilibrium point |
| _ | Take any value |
| | β = 1 |
| | β = 0 |
| Ordinary Netizen | The probability α of the online media choosing to promote the development of negative public opinion | Judge the value of the Equilibrium Point by positive and negative value | equilibrium point |
| _ | Take any value |
| | γ = 0 |
| | γ = 1 |
Table 10.
Evolutionary equilibrium strategy among “online media–enterprise–netizens”.
Table 10.
Evolutionary equilibrium strategy among “online media–enterprise–netizens”.
| No. | Β Value | α Value | Γ Value | Equilibrium Point E |
|---|
| 1 | | | | (α, β, γ) |
| 2 | | | | (0, 1, 1) |
| 3 | | | | (0, 1,0) |
| 4 | | | | (1, 1, 1) |
| 5 | | | | (1, 1, 0) |
| 6 | | | | (0, 0, 1) |
| 7 | | | | (0, 0, 0) |
| 8 | | | | (1, 0, 1) |
| 9 | | | | (1, 0, 0) |
Table 11.
Analysis of the partial stability of the evolutionary game system of “online media–enterprise–netizens”.
Table 11.
Analysis of the partial stability of the evolutionary game system of “online media–enterprise–netizens”.
| Equilibrium Point | detJ Symbol | trJ Symbol | Stable Condition | Result | Stable Strategy |
|---|
| (α, β, γ) | + | 0 | − | Saddle Point | − |
| (0, 1, 1) | + | − | C3 − W2 − W3 > 0;
C1 − C2 − P1 − P2−L1 < 0;
C1 − C2 − P1 − P2 − L1 − (C3 − W2 − W3) + D2 < 0 | ESS2 | Situation 1: (Block, respond positively, believe) |
| (0, 1, 0) | − | − | − | Saddle Point | − |
| (1, 1, 1) | − | − | − | Saddle Point | − |
| (1, 1, 0) | − | − | − | Saddle Point | − |
| (0, 0, 1) | + | + | − | Saddle Point | − |
| (0, 0, 0) | − | − | − | Saddle Point | − |
| (1, 0, 1) | + | − | C1 − C2 − L1 + L2 − P2 − P3P1 > 0;
C3 + W1 − W2 − W3 < 0;
(C3 + W1 − W2 − W3) + C2 − C1 + L1 − L2 + P1 + P2 + P3−D1 + D3 < 0; | ESS3 | Situation 2: (Promote, respond negatively, believe) |
| (1, 0, 0) | − | − | − | Saddle Point | − |
Table 12.
The analysis of the equilibrium point of the “netizen–government” dynamic game in the control stage.
Table 12.
The analysis of the equilibrium point of the “netizen–government” dynamic game in the control stage.
| Netizen | The λ Value of Government Controlling Public Opinion | Judge the value of the Equilibrium Point by Positive and Negative Value | Equilibrium Point |
| _ | μ take any value |
| | μ = 1 |
| | μ = 0 |
| Government | The μ value of netizens spreading public opinion | Judge the value of the equilibrium point by positive and negative value | equilibrium point |
| _ | λ take any value |
| | λ = 1 |
| | λ = 0 |
Table 13.
Stable analysis.
Table 13.
Stable analysis.
| No. | μ Value | λ Value | Equilibrium Point E |
|---|
| 1 | | | (μ, λ) |
| 2 | | | (1, 1) |
| 3 | | | (0, 1) |
| 4 | | | (1, 0) |
| 5 | | | (0, 0) |
Table 14.
Analysis of the partial stability of the evolutionary game system of “netizen–government”.
Table 14.
Analysis of the partial stability of the evolutionary game system of “netizen–government”.
| Equilibrium Point | detJ Symbol | trJ Symbol | Stability Condition | Result | Stability Strategy |
|---|
| (μ, λ) | − | − | − | Saddle point | − |
| (1, 1) | + | − | C4 − N1 < 0
C5 − M1 − M2 − M3 − M4 < 0 | ESS4 | (forward, control) |
| (0, 1) | + | − | C4 − N1 > 0
C5 − M2 − M3 < 0 | ESS5 | (not forward, control) |
| (1, 0) | − | − | − | Saddle point | − |
| (0, 0) | + | − | C5 − M2 − M3 > 0 | ESS6 | (not forward, not control) |
Table 15.
Parameters under three conditions.
Table 15.
Parameters under three conditions.
| Parameter | Definition | The First Condition (Netizens, Government) = (μ, λ) = (Forward, Control) = (1, 1) | The Second Condition (Netizens, Government) = (μ, λ) = (Not Forward, Control) = (0, 1) | The Third Condition (Netizens, Government) = (μ, λ) = (Not Forward, Not Control) = (0, 0) |
|---|
| λ | The probability that the government chooses to control the development of public opinion | 0.5 | 0.5 | 0.5 |
| μ | The probability that netizens choose to spread negative public opinion events | 0.5 | 0.5 | 0.5 |
| C4 | The cost of time, effort, searching and other costs for netizens to spread negative public opinion events | 0.2 | 1 | 1 |
| C5 | The cost of government control; if it is not controlled, the cost is 0 | 1 | 1 | 1 |
| N1 | The netizens’ benefits of obtaining a sense of belonging while spreading negative public opinion incidents to force government departments to pay attention to this public opinion incident and promptly take control of it | 1 | 0.2 | 0.2 |
| N2 | The netizens’ loss of not spreading negative public opinion incidents to force government departments to pay attention to this public opinion incident and take control of it | 0.1 | 0.1 | 0.1 |
| M1 | The netizens’ benefits of obtaining trust while spreading negative public opinion incidents to force government departments to pay attention to this public opinion incident and promptly take control of it | 1.2 | 1.2 | 1.2 |
| M2 | The netizens’ benefits of obtaining social stability while government departments take control of public opinion no matter if they spread or not | 1 | 1 | 0.1 |
| M3 | The government’s loss of reduced social credibility when they do not control public opinion | 1.5 | 1.5 | 0.5 |
| M4 | The government’s loss of reduced social credibility if they do not control public opinion while netizens spreading | 2 | 2 | 2 |
