
Evaluating Public Health Efforts to Prevent and Control Chronic Disease: A Systems Modeling Approach


1
Kaiser Permanente Colorado, Institute for Health Research, Aurora, CO 80014, USA
2
Homer Consulting and MIT Research Affiliate, Barrytown, NY 12507, USA
*
Author to whom correspondence should be addressed.
Systems 2022, 10(4), 89; https://doi.org/10.3390/systems10040089
Submission received: 6 June 2022
/
Revised: 24 June 2022
/
Accepted: 27 June 2022
/
Published: 28 June 2022
(This article belongs to the Special Issue System Dynamics Models for Public Health and Health Care Policy)
Abstract
:The growing burden of chronic disease represents a complex challenge to public health. Innovative approaches, such as system dynamics simulation modeling, can aid public health professionals in understanding such complex issues and identifying effective solutions. This paper describes a system dynamics model and its application in projecting the impacts of evidence-based interventions on chronic disease for the state of Colorado. The development of the model was guided by data and input from subject matter expertise, peer-reviewed literature, and surveillance data. The model includes 28 intervention levers for chronic disease prevention, screening, and management. Interventions were simulated from 2020 to 2050 to project their impact on ten preventable causes of death. The simulations indicated the 6 most impactful interventions by 2050 to be adult smoking prevention, diabetes prevention, smoking cessation, blood pressure management, adult physical activity promotion, and colorectal cancer screening. Together, these 6 interventions could reduce preventable deaths by 7.1%, or 74% of the 9.6% reduction from all 28 interventions combined. This system dynamics model is a flexible tool that could be adapted or extended to include other populations or preventable chronic diseases. Prioritization and wide-scale implementation of the most impactful interventions could significantly reduce preventable deaths resulting from chronic disease.
1. Introduction
Despite significant efforts to understand complex health problems, such as chronic disease, public health professionals still face a difficult challenge in the prioritization of interventions. Well-designed experiments have provided important information about the effect sizes of single interventions over short follow-up periods. However, the existing literature cannot tell us what is likely to happen over longer periods of time, or how multiple interventions (clinical and population-wide) might interact to influence population health. The most pressing public health problems of the 21st century are the result of complex interactions between multiple interrelated factors. Hence, public health must supplement traditional analytic tools with systems approaches that can explicitly consider such complexities [1,2,3,4,5,6,7].
One such systems approach is system dynamics (SD) simulation modeling. Unlike some other approaches, SD models realistically represent complex causal pathways with intermediate variables, delays, nonlinearities, and feedback loops [6,7,8,9]. SD models of populations are typically compartmental, meaning they specify population subgroup categories rather than modeling each individual in the population separately. Since the 1970s, SD has been increasingly used to model many public health and health care issues such as chronic diseases [10,11,12]. One of the best-known SD applications is the Center for Disease Control and Prevention’s Prevention Impacts Simulation Model (PRISM) of cardiovascular disease (CVD) risks and outcomes [13,14,15,16,17,18,19].
Building on previous work, our purpose is two-fold: (i) to describe a state-level SD model of CVD, cancer, and chronic pulmonary disease inspired by and in the general style of PRISM; and (ii) to demonstrate how this simulation model can be used to estimate the impacts of state-level public health efforts to prevent and control multiple chronic diseases over a period of 30 years. With these impact estimates, we can identify the evidence-based public health interventions (or combinations of interventions) that have the greatest potential to influence population health outcomes.
2. Materials and Methods
2.1. Model Development
The SD model was developed through a collaborative effort with key partners and subject matter experts across Colorado. Several meetings and conversations were held to (a) discuss the mechanisms by which specified interventions impact health outcomes, (b) identify peer-reviewed literature documenting the association between interventions and health outcomes, and (c) review the existing data sources to identify the best available state and national-level data for model inputs. The feedback received guided the development of a preliminary draft of the simulation model. The model was updated on an ongoing basis to reflect emerging evidence-based literature and/or new surveillance data through the end of the contract. Kaiser Permanente Colorado’s Institutional Review Board deemed the study to be non-human subjects research.
2.2. Model Overview
This SD model is broader in disease scope than the PRISM model, detailing the primary risk factors and development pathways not only for CVD, but also for five types of preventable cancer (namely, colorectal, breast, cervical, oral, and respiratory), as well as asthma and chronic obstructive pulmonary disease (COPD). The model contains 28 intervention levers that were designed to reflect risk reduction strategies identified in Colorado’s Chronic Disease State Plan 2018–2020 (https://cdphe.colorado.gov/chronicdisease (accessed on 1 June 2022)). These intervention levers are evidence-based strategies for the prevention, early detection, and treatment of cardiovascular disease, cancer, and chronic pulmonary disease. The long-term goal of such strategies is to reduce the burden of morbidity and mortality associated with the reference chronic disease outcomes.
Figure 1 presents an overview of the model’s structural logic. The arrows depict causal chains of risk factors, interventions, disease conditions, and causes of death. The model covers the entire Colorado population, changing over time with births, net in-migration, deaths, and aging. Youth are represented in two age groups of 0–11 and 12–17, and adults in three age groups of 18–39, 40–64, and 65-plus. The model’s chronic (controllable but not reversible) prevalent conditions include diabetes, hypertension, high cholesterol, CVD, asthma, and COPD. All five cancers are modeled from risk factors through latency periods to rates of incidence and then mortality, based on five-year mortality rates. Interventions affecting diet and physical activity may affect youth and/or adults, and these behavioral factors cascade to impact obesity, diabetes, hypertension, high cholesterol, CVD, asthma control, and two types of cancer (i.e., colorectal and breast). Smoking prevalence has similarly wide-ranging effects, impacting diabetes, CVD, asthma, COPD, and four types of cancer (i.e., respiratory, oral, colorectal, and breast).
The shaded boxes in Figure 1 show the 10 causes of death (aside from all-causes deaths) calculated in the model and Colorado’s 2015 death count for each. Cause of death is defined as the first cause listed on the death certificate [20]. The total number of deaths across all 10 preventable causes of death (hereafter ‘Combo10’) represented 36.5% of all 2015 deaths in Colorado (or 13,270 of 36,352 deaths). Among the Combo10 deaths, CVD was the largest cause of death across the 10 preventable causes (6527 of 13,270 deaths, 49.2%), followed by COPD (2576 deaths, 19.4%), and respiratory cancers (1543 deaths, 11.6%).
The model was implemented using VensimTM software (Ventana Systems Inc., Harvard, MA, USA) and contains more than 1600 interacting equations and parameters (detailed documentation of the model, in the form of an extensive reference guide, is available upon request from the authors). The model is initialized in 2000 and simulates forward by increments of one-quarter of a year through 2050; all output variables are recalculated at every increment. The model’s base run, which closely matches historical data through 2019, assumes no change in exogenous inputs after 2020. Interventions can be ramped up at any time starting in 2020 and can be tested individually or in any combination.
2.3. Model Inputs
Data sources that included historical metrics of the specified disease types and associated risk factors were identified to calibrate the model. Table 1 presents the publicly available longitudinal data sources that were used for calibrating and validating the model. The identified data sources provide data inputs over the period of 1999–2019. The last column of the table presents calculated ratios (e.g., Colorado vs. national BRFSS, and national BRFSS vs. national NHANES) that were helpful for synthetic data extrapolations to fill in gaps in Colorado’s historical records.
Table 2 shows the 28 types of interventions represented in the model, divided into four categories. The 11 population health interventions primarily target population approaches to improve healthy behaviors and involve no clinical visits. The 4 clinical prevention interventions are similarly preventive but do involve clinical resources. The 7 clinical screening interventions improve the detection of prevalent disease conditions so that they can be better managed or treated. The 6 clinical management interventions help bring diagnosed disease conditions under control. As shown in the table, each intervention has a corresponding target subpopulation (‘target description’), performance metric for which improvement in a health behavior or outcome is sought (‘performance definition’), and estimated performance levels for the baseline year of 2018—prior to any intervention implemented in the model (‘2018 value’). For example, success for the ‘healthy food—adults’ intervention was defined by the percentage of all Colorado adults reporting the consumption of five or more fruits and vegetables per day, which was reported to be 25% of the population in 2018.
2.4. Model Testing and Analysis
To test the model, each intervention was initiated in January 2020 and ramped up to a specified final dose or yield by January 2021. The dose refers to the fraction of the targeted population (see Table 2) that is (a) not meeting the performance metric at baseline; and (b) would successfully and permanently meet the performance metric after exposure to the intervention [21]. For model testing, the dose remained in effect until the end of the simulation in 2050.
To demonstrate how this SD model could be applied in public health, each intervention was first tested individually at a representative dose based on (a) the implementation literature; or (b) a corresponding national Healthy People 2030 (HP2030) goal (n = 18 interventions) [22]. For example, one HP2030 goal (HDS-05) calls for increasing the proportion of hypertensive adults whose blood pressure is under control from 47.8% to 60.8% nationally, which corresponds to a dose of 25% (=(0.608 − 0.478)/(1 − 0.478)). Next, we used the model to test 27 different combinations of interventions, performed by layering in interventions (at their representative doses) one by one in order of their individual impact on Combo10 deaths in 2050. That is, we first tested a combination of the most impactful (#1 ranking) intervention with the second most impactful (#2); for the next test we added #3, and so forth, until all 28 interventions were combined in the final test.
3. Results
Table 3 reports the independent and cumulative impacts of the 28 interventions included in the model on the simulated death rates per 100,000 adults as of 2050. For each intervention, its independent impact on the Combo10 deaths is reported as the rate (i.e., death rate per 100,000) and percent (%) change relative to the base run. Next, the cumulative impact on Combo10 deaths is reported as the summative rate and percent change relative to the base run (e.g., top ranked intervention only, top intervention and second ranked intervention, and so on). Finally, the last column reports the proportion of the total cumulative impact across all 28 interventions that is accounted for by the corresponding ranked interventions. For example, when the top 3 ranked interventions are combined, the result is a 4.86% reduction in the Combo10 death rate, which represents 50.7% of the cumulative 9.58% reduction in Combo10 death rate from combining all 28 interventions.
3.1. Base Run
In the base run (which assumes no interventions implemented), the annualized Combo10 death rate per 100,000 adults rises from 341.3 (2025) to 411.1 (2050). This is due to increases over time in per-capita deaths from diabetes, hypertension, CVD, colorectal and breast cancer, and COPD. These death rates increase due to aging of the population and reflect the legacy of the substantial rise in obesity over the past decades [23,24].
3.2. Individual Intervention Testing Results
Interventions (assuming the representative doses) were ranked from most to least impactful in terms of their ability to reduce the Combo10 death rate by the end of the simulation in 2050. The single-intervention results are shown in the ‘independent impact; columns in Table 3, with the base run result shown at the top for comparison purposes. Three distinct clusters of interventions were distinguished based on magnitude of impact. The first cluster included top-ranking interventions 1 to 5 with impacts in the range of 2.12% down to 0.84%. The second cluster encompassed interventions 6 to 13 with impacts ranging from 0.46% down to 0.23%. The last cluster included interventions 14 to 28 with impacts of 0.13% or less. We find that reasonable uncertainties about assumptions (e.g., intervention dose) could lead to changes in the order of ranking within each cluster, but they are unlikely to move an intervention out of one cluster and into another.
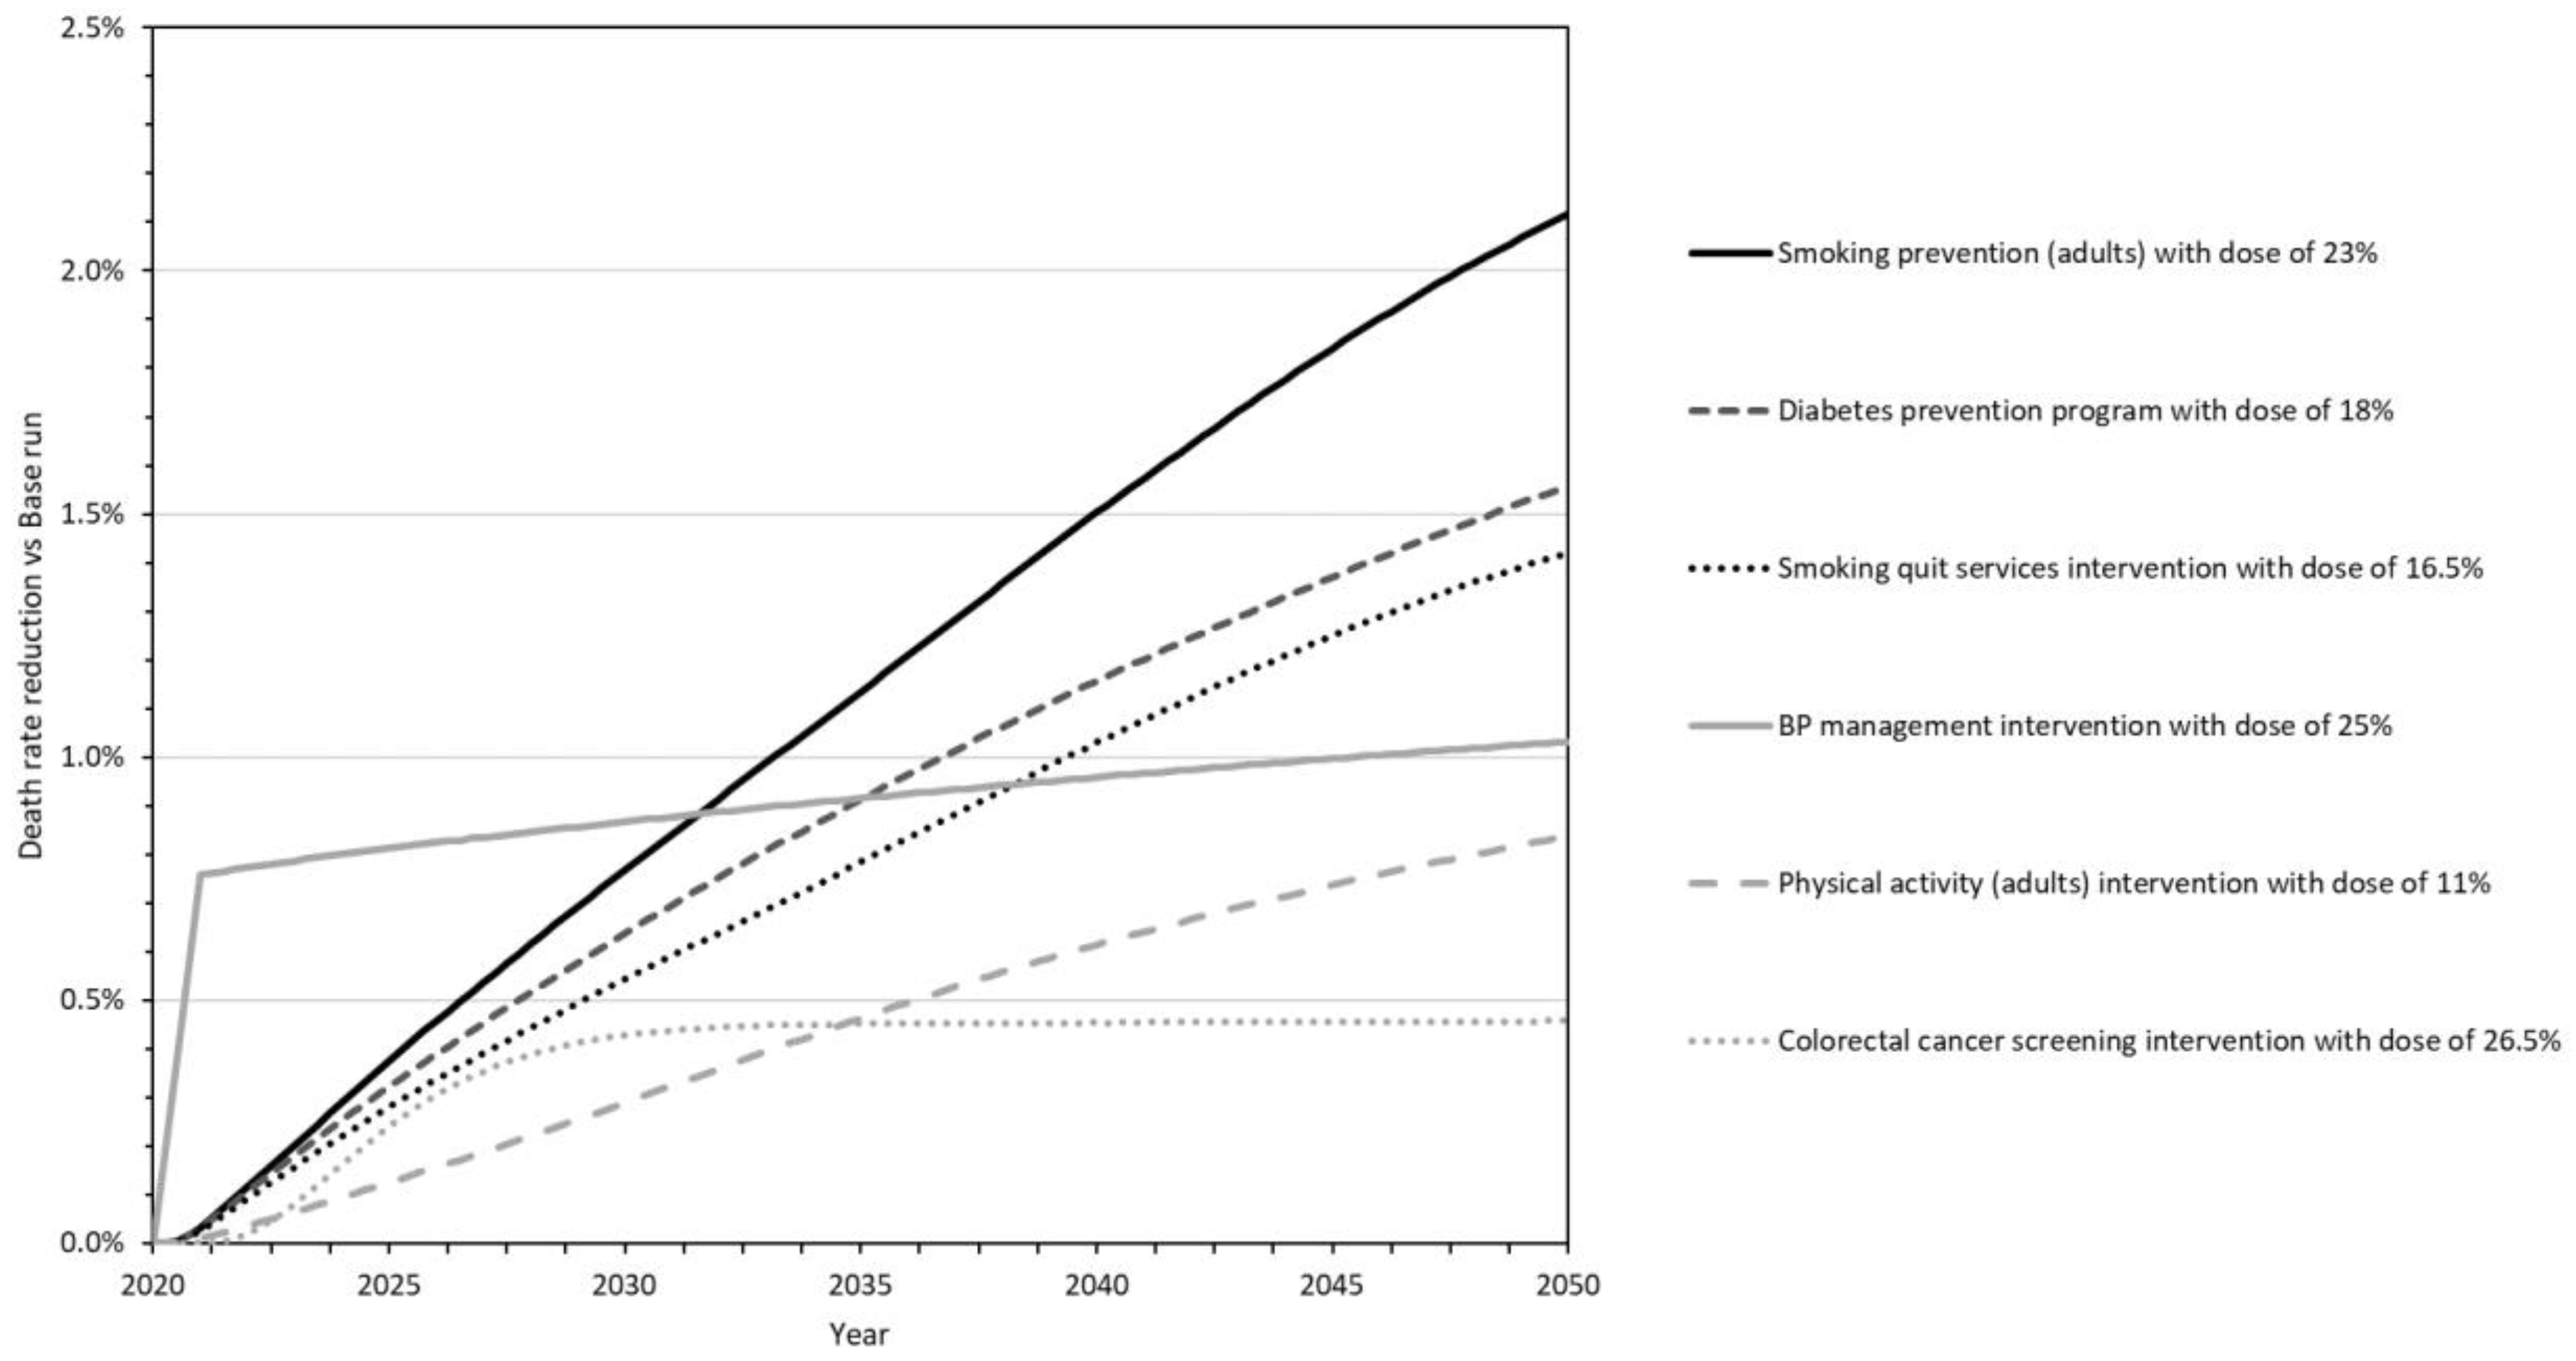
Figure 2 presents the single-intervention testing results for the six most impactful interventions as a graph over time from 2020 to 2050. The outcomes are expressed as a percent reduction from the base run in the Combo10 death rate. Taken together, these six most impactful interventions include at least one intervention from each of the four general categories (i.e., population health, clinical prevention, clinical screening, or clinical management); differ in terms of which causes of death they avert (collectively averting all of the Combo10 types except cervical cancer); and vary in the speed and strength of their impacts.
In particular:
- Smoking prevention for adults (Smoking Prevention_23) is a population health intervention that averts eight of the Combo10 causes of death (see Figure 1 to trace this and other interventions to impacted deaths). The dose was estimated to be 23% based on HP2030 goal TU-02. The death reduction is rapid for CVD but delayed for other causes of death as the intervention effects traverse changes in the incidence and prevalence of diabetes, cancer, asthma, and COPD before gaining strength throughout the simulation. It is the second-most impactful intervention through 2030, and the single most impactful by 2040 and 2050.
- The National Diabetes Prevention Program (Diabetes Prevention_18) is a clinical prevention intervention that ultimately averts 4 of the 10 specified causes of death. The dose was estimated at 18% based on HP2030 goal D-01. The death reduction is delayed (traversing the incidence and gradual progression of diabetes) but gains strength throughout the simulation to make this the second-most impactful intervention by 2040 and 2050.
- Smoking cessation services and products (Smoke Cessation_16.5) represent a clinical prevention intervention that averts eight causes of death. The dose is estimated at 16.5% based on HP2030 goal TU-14. Its effects are similar to those of the smoking prevention intervention above, only not as strong. It is the third-most impactful intervention by 2040 and 2050.
- Blood pressure management (Blood Pressure Management_25) is a clinical management intervention that averts deaths from hypertension and CVD. The dose is estimated at 25% based on HP2030 goal HDS-05. The death reduction starts quickly and strongly, making this the most impactful of the six interventions through 2030 and the fourth-most impactful in 2040 and 2050.
- Adult physical activity (Physical Activity_11) is a population health intervention that averts seven causes of death. The dose is estimated at 11% based on HP2030 goal PA-02. The death reduction is delayed (traversing changes in the prevalence of obesity, diabetes, hypertension, high cholesterol, and COPD) but grows rapidly after 2030 to make this the fifth-most impactful intervention by 2040 and 2050.
- Colorectal cancer screening (Colorectal Cancer Screening_26.5) is a clinical screening intervention that averts deaths from CRC. The dose is estimated at 26.5% based on HP2030 goal C-07. The death reduction is delayed by several years (traversing the progression of colorectal cancer) but is substantial by 2030, making this the sixth-most impactful intervention by 2040 and 2050.
3.3. Combination Intervention Testing Results
The ‘cumulative impact’ columns of Table 3 present the results of combination testing and show how the addition of each subsequent intervention contributes to a reduction in the Combo10 death rate in 2050. All 28 interventions combined produce a Combo10 death rate reduction of 9.6% by 2050. A small number of top interventions are responsible for a majority of the combined potential. For example, the first 3 interventions together produce a reduction of 4.9%, which is 51% of the full combination; and the top 6 interventions together produce a reduction of 7.1%, which is 74% of the full combination of 28.
4. Discussion
4.1. Findings
Here, we have described and demonstrated a SD simulation model of CVD, cancer, and pulmonary disease using publicly available data for the state of Colorado. The model was initialized in 2000 and closely matches historical data through 2019. The model simulates 28 evidence-based interventions individually or in combination from 2020 to 2050 across four public health domains (i.e., population health, clinical prevention, clinical screening, and clinical disease management). The interventions were tested individually at representative doses, and the six interventions with the largest projected impact by 2050 on the combined 10 causes of death (5 types of cancer plus CVD, hypertension, diabetes, asthma, and COPD) were identified. These top six interventions were adult smoking prevention, diabetes prevention, smoking cessation, blood pressure management, adult physical activity promotion, and colorectal cancer screening.
We have compared these six interventions to the others with a lower impact to look for differentiating characteristics. The top interventions were found to share the following characteristics: (a) significant room for improvement in performance; (b) significant intervention dose; (c) significantly affecting at least one of the six leading causes of death—CVD, COPD, respiratory cancer, diabetes, colorectal cancer, or breast cancer; and (d) a shorter lead time from behavioral change to impact on deaths. Less impactful interventions lacked at least one of these characteristics. These characteristics should be considered by public health decision-makers weighing alternative interventions to improve population health.
In combination testing, we found that a small number of the top interventions could together deliver a majority of the potential impact on deaths from all 28 evidence-based interventions combined. In particular, the top 6 interventions (6/28 = 21% of all interventions) produced a combined simulated impact equal to 74% of that of all interventions combined. This result is reminiscent of the well-known 80/20 rule, or more generally the Pareto principle or Zipf’s law, observed in many fields of study, in which a relatively small subset of contributing elements are responsible for the great majority of the total combined contribution [25].
4.2. Next Steps and Future Applications
The next steps and future applications of the model include incorporating data from state-level implementation of the sorts of interventions we have identified here. Incorporating real-world data would enable users of this SD model to test actual doses that were achieved during intervention implementation in a specific state. The model could be used to prospectively evaluate the long-term impacts of such efforts and provide realistic expectations for impacts on population health over the course of three decades. This would likely include exploring various strategic combinations of interventions, such as those sharing a particular public health approach (e.g., population health) or focusing on a particular set of diseases (e.g., cancers). Additionally, the model can be used to identify the evidence-based public health interventions (or combinations of interventions) that have the greatest potential to influence population health outcomes. Such prospective evaluations can help to guide the prioritization and implementation of diverse public health approaches that will be required to alleviate the burden of chronic disease.
Future extensions of the model could further improve its usefulness. First, the model could be adapted to other U.S. states and/or extended to include other chronic diseases for which a strong enough evidence base exists. Second, the model could be supplemented with additional outcome metrics of interest to researchers and decision-makers. The PRISM model, for example, calculates disease impacts on life years, disability-adjusted life years, quality-adjusted life years, and work productivity. It also includes estimates of intervention implementation cost, but these can be difficult to estimate and may vary widely depending on the assumed specifics of implementation [13,14]. Finally, the model could be extended to address questions of health inequity by characteristics such as race, education, income, and urbanicity. Toward this end, we have done some preliminary disaggregation of the model, making it possible to explore the implications (for disparity as well as total impact) of interventions targeted toward subgroups that have higher risks but also higher barriers to intervention adoption.
4.3. Strengths and Limitations
SD is an attractive approach for chronic disease modeling and has proven its value over the years, as the PRISM model attests. However, such models are only as strong as the quality of data inputted into the model. To continually improve the model efficacy, the best available data should be continually monitored and updated. For example, future iterations of this model might adjust doses for each intervention based on their impact during the COVID-19 pandemic. Because of their compartmental nature (in contrast with individual-level microsimulations), SD models can be quite broad in scope, and alternative scenarios can be set up and run in a matter of seconds. However, compartmental models such as PRISM and the newer one described here do have a limitation: they cannot easily identify and quantify emergent clinical phenomena and distributions at the individual level, such as co-morbidity patterns. For such focused analysis, excellent microsimulations have been built, including single-disease models of particular cancers, CVD, and COPD [26,27,28,29,30]. For the purposes of public health decision-making, however, SD models can provide a practical yet rigorous approach to projecting population-level intervention impacts into the near and longer terms.
5. Conclusions
The SD simulation model discussed here can help public health decision-makers to systematically evaluate the short- and long-term impacts of diverse approaches to improving population health. In our Colorado application, the six top interventions for reducing projected deaths were adult smoking prevention, diabetes prevention, smoking cessation, blood pressure management, adult physical activity promotion, and colorectal cancer screening. These six interventions address 9 of the 10 specified types of preventable death (all but cervical cancer, which causes the fewest deaths of the 10 types) and encompass four public health domains. Together, they would make a powerful and relatively compact package of interventions for reducing deaths from chronic disease, potentially delivering 74% of the impact of 28 evidence-based interventions combined.
Supplementary Materials
The following supporting information can be downloaded at: https://www.mdpi.com/article/10.3390/systems10040089/s1, Table S1: Simulated Combo10 death rate reduction over time relative to the base run for the six top interventions tested individually, 2020–2050 (supporting Figure 2).
Author Contributions
All authors have met authorship requirements. Specifically, all authors substantially contributed across the following inputs for manuscript development: conception and design (M.C. and C.K.), acquisition of data (J.H. and A.E.), analysis (J.H.) and interpretation of data (J.H., M.C., A.E. and C.K.), drafting the article (M.C. and J.H.), data visualization (A.E. and J.H.), and reviewing the article and revising it critically (A.E., C.K. and J.H.). All authors have read and agreed to the published version of the manuscript.
Funding
This work was supported by funding from the Colorado Department of Public Health and Environment’s Cancer, Cardiovascular, and Chronic Pulmonary Disease Grants Program. All data presented in this article were extracted from publicly available data sources.
Institutional Review Board Statement
This study was deemed non-human subjects research by Kaiser Permanente Colorado’s Institutional Review Board.
Informed Consent Statement
Not applicable.
Data Availability Statement
All data presented in this article were extracted from publicly available data sources. See Table 1 for data sources.
Conflicts of Interest
The authors declare no conflict of interest.
References
- Academy of Medical Sciences. Improving the Health of the Public by 2040: Optimizing the Research Environment for a Healthier, Fairer Future; Academy of Medical Sciences: London, UK, 2016. [Google Scholar]
- Gerhardus, A.; Becher, H.; Groenewegen, P.; Mansmann, U.; Meyer, T.; Pfaff, H.; Puhan, M.; Razum, O.; Rehfuess, E.; Sauerborn, R.; et al. Applying for, reviewing and funding public health research in Germany and beyond. Health Res. Policy Syst. 2016, 14, 43. [Google Scholar] [CrossRef] [PubMed] [Green Version]
- Rutter, H.; Savona, N.; Glonti, K.; Bibby, J.; Cummins, S.; Finegood, D.; Greaves, F.; Harpe, L.; Hawe, P.; Moore, L.; et al. The need for a complex systems model of evidence for public health. Lancet 2017, 390, 2602–2604. [Google Scholar] [CrossRef] [Green Version]
- Diez Roux, A.V. Complex systems thinking and current impasses in health disparities research. Am. J. Public Health. 2011, 101, 1627–1634. [Google Scholar] [CrossRef] [PubMed]
- Fink, D.S.; Keyes, K.M. Wrong answers: When simple interpretations create complex problems. In Systems Science and Population Health; El-Sayed, A.M., Galea, S., Eds.; Oxford U Press: New York, NY, USA, 2017; Chapter 3. [Google Scholar]
- Sterman, J.D. Learning from evidence in a complex world. Am. J. Public Health 2006, 96, 505–514. [Google Scholar] [CrossRef] [PubMed]
- Sterman, J.D. Business Dynamics: Systems Thinking and Modeling for a Complex World; Irwin McGraw-Hill: Boston, MA, USA, 2000. [Google Scholar]
- Homer, J. Levels of evidence in system dynamics modeling. Sys. Dyn. Rev. 2014, 30, 75–80. [Google Scholar] [CrossRef]
- Homer, J. Best practices in system dynamics modeling, revisited: A practitioner’s view. Sys. Dyn. Rev. 2019, 35, 177–181. [Google Scholar] [CrossRef]
- Homer, J.; Hirsch, G. System dynamics modeling for public health: Background and opportunities. Am. J. Public Health 2006, 96, 452–458. [Google Scholar] [CrossRef] [PubMed]
- Hirsch, G.; Homer, J.; Tomoaia-Cotisel, A. (Eds.) System dynamics applications to health and health care. 15 previously published articles with new introduction and extended bibliography. Sys. Dyn. Rev. 2015. Available online: http://onlinelibrary.wiley.com/journal/10.1002/(ISSN)1099-1727/homepage/VirtualIssuesPage.html (accessed on 1 June 2022).
- Darabi, N.; Hosseinichimeh, N. System dynamics modeling in health and medicine: A systematic literature review. Sys. Dyn. Rev. 2020, 36, 29–73. [Google Scholar] [CrossRef] [Green Version]
- Yarnoff, B.; Honeycutt, A.; Khavjou, O.; Bradley, C.; Bates, L.; Homer, J. PRISM: The Prevention Impacts Simulation Model; Reference Guide for Model Version 3s; RTI International: Research Triangle Park, NC, USA, 2020; Available online: https://prism-simulation.cdc.gov/app/cdc/prism/#/ (accessed on 1 June 2022).
- Yarnoff, B.; Honeycutt, A.; Bradley, C.; Khavjou, O.; Bates, L.; Bass, S.; Kaufmann, R.; Barker, L.; Briss, P. Validation of the Prevention Impacts Simulation Model (PRISM). Prev. Chron. Dis. 2021, 18, E09. Available online: www.cdc.gov/pcd/issues/2021/20_0225.htm (accessed on 1 June 2022).
- Homer, J.; Milstein, B.; Wile, K.; Trogdon, J.; Huang, P.; Labarthe, D.; Orenstein, D. Simulating and evaluating local interventions to improve cardiovascular health. Prev. Chron. Dis. 2010, 7, A18. Available online: http://www.cdc.gov/pcd/issues/2010/jan/08_0231.htm (accessed on 1 June 2022).
- Hirsch, G.; Homer, J.; Wile, K.; Trogdon, J.G.; Orenstein, D. Using simulation to compare 4 categories of intervention for reducing cardiovascular risks. Am. J. Public Health 2014, 104, 1187–1195. [Google Scholar] [CrossRef] [PubMed]
- Homer, J.; Wile, K.; Yarnoff, B.; Trogdon, J.G.; Hirsch, G.; Cooper, L.; Soler, R.; Orenstein, D. Using simulation to compare established and emerging interventions to reduce cardiovascular disease risks in the United States. Prev. Chron. Dis. 2014, 11, E195. Available online: http://www.cdc.gov/pcd/issues/2014/14_0130.htm (accessed on 1 June 2022).
- Honeycutt, A.A.; Wile, K.; Dove, C.; Hawkins, J.; Orenstein, D. Strategic planning for chronic disease prevention in rural America: Looking through a PRISM lens. J. Public Health Mgmt. Pract. 2015, 21, 392–399. [Google Scholar] [CrossRef] [PubMed]
- Soler, R.; Orenstein, D.; Honeycutt, A.; Bradley, C.; Trogdon, J.; Kent, C.K.; Wile, K.; Haddix, A.; O’Neil, D.; Bunnell, R. Community-based interventions to decrease obesity and tobacco exposure and reduce health care costs: Outcome estimates from Communities Putting Prevention to Work for 2010–2020. Prev. Chron. Dis. 2016, 13, e47. Available online: http:///www.cdc.gov/pcd/issues/2016/15_0272.htm (accessed on 1 June 2022).
- Colorado Department of Public Health and Environment. CoHID: Colorado Health Information Dataset. 2021. Available online: https://cdphe.colorado.gov/cohid (accessed on 1 June 2022).
- Harner, L.T.; Kuo, E.S.; Cheadle, A.; Rauzon, S.; Schwartz, P.M.; Parnell, B.; Kelly, C.; Solomon, L. Using population dose to evaluate community-level health initiatives. Am. J. Prev. Med. 2018, 54, S117–S123. [Google Scholar] [CrossRef] [PubMed]
- Office of Disease Prevention and Health Promotion. Healthy People 2030. U.S. Department of Health and Human Services. 2020. Available online: https://health.gov/healthypeople/objectives-and-data/browse-objectives (accessed on 1 June 2022).
- Hales, C.M.; Carroll, M.D.; Fryar, C.D.; Ogden, C.L. Prevalence of obesity and severe obesity among adults: United States, 2017–2018. In National Center for Health Statistics Data Brief; No. 360; Centers for Disease Control and Prevention: Atlanta, GA, USA, 2020; p. 7. [Google Scholar]
- Wang, Y.C.; McPherson, K.; Marsh, T.; Gortmaker, S.L.; Brown, M. Health and economic burden of the projected obesity trends in the USA and the UK. Lancet 2011, 378, 815–825. [Google Scholar] [CrossRef]
- Newman, M.E.J. Power laws, Pareto distributions and Zipf’s law. Contemp. Phys. 2005, 46, 323–351. [Google Scholar] [CrossRef] [Green Version]
- Knudsen, A.B.; Zauber, A.G.; Rutter, C.M.; Naber, S.K.; Doria-Rose, V.P.; Pabiniak, C.; Johanson, C.; Fischer, S.E.; Lansdorp-Vogelaar, I.; Kuntz, K.M.; et al. Estimation of benefits, burden, and harms of colorectal cancer screening strategies: Modeling study for the US Preventive Services Task Force. JAMA 2016, 315, 2595–2609. [Google Scholar] [CrossRef] [PubMed]
- Moolgavkar, S.H.; Holford, T.R.; Levy, D.T.; Long, C.Y.; Foy, M.; Clarke, L.; Jeon, J.; Hazelton, W.D.; Meza, R.; Schultz, F.; et al. Impact of reduced tobacco smoking on lung cancer mortality in the United States during 1975–2000. J. Natl. Cancer Inst. 2012, 104, 541–548. [Google Scholar] [CrossRef] [PubMed]
- Plevritis, S.K.; Munoz, D.; Kurian, A.W.; Stout, N.K.; Alagoz, O.; Near, A.M.; Lee, S.J.; van den Broek, J.J.; Huang, X.; Schechter, C.B.; et al. Association of screening and treatment with breast cancer mortality by molecular subtype in US women, 2000–2012. JAMA 2018, 319, 154–164. [Google Scholar] [CrossRef] [PubMed]
- Bibbins-Domingo, K.; Coxson, P.; Pletcher, M.J.; Lightwood, J.; Goldman, L. Adolescent overweight and future adult coronary heart disease. New Eng. J. Med. 2007, 357, 2371–2379. [Google Scholar] [CrossRef] [Green Version]
- Najafzadeh, M.; Marra, C.A.; Lynd, L.D.; Sadatsafavi, M.; FitzGerald, J.M.; McManus, B.; Sin, D. Future impact of various interventions on the burden of COPD in Canada: A dynamic population model. PLoS ONE 2012, 7, e46746. [Google Scholar] [CrossRef] [Green Version]
Figure 1.
Model’s structural logic. All conditions were calibrated based on state-level surveys, with detailed age group breakouts based on national data from NHANES and NHIS. Numbers in bold are Colorado deaths in 2015 for 10 specified causes of death, which together account for 13,270 out of Colorado’s 36,352 total deaths in 2015. Key: bold italic = intervention; box = prevalent condition; shaded = cause of death.

Figure 2.
Simulated Combo10 death rate reduction over time relative to the base run for the six top interventions tested individually, 2020–2050; ‘Combo10’ first-listed causes of death: diabetes, hypertension, CVD, asthma, COPD, and 5 types of cancer. All interventions started in January 2020, ramped up to the indicated dose by January 2021. Top six interventions: (i) SmokePrev_adult23: smoking prevention (adults) intervention with a dose of 23%; (ii) DPP18: diabetes prevention program with a dose of 18%; (iii) SmokeQuit16.5: smoking quitting services intervention with a dose of 16.5%; (iv) BPmgmt25: BP management intervention with a dose of 25%; (v) PA_adult11: physical activity (adults) intervention with a dose of 11%; (vi) CRCscreen26.5: colorectal cancer screening intervention with a dose of 26.5%. For additional information, see Supplemental File Table S1.

Table 1.
Publicly available Colorado and US overall data sources used for calibrating the state-level system dynamics model.
Table 1.
Publicly available Colorado and US overall data sources used for calibrating the state-level system dynamics model.
| Variable | Colorado | US Overall | Ratios 1 |
|---|---|---|---|
| Adult obesity | BR 1999–2018 | BR 1999–2016, NH 1999–2008 | CO vs. US: 0.73; BR vs. NH: 0.76 |
| Youth obesity | NSCH 2003–2011 (age 10–17) | NH 1999–2008 (age 12–17) | CO vs. US: 0.72 |
| Adult healthy diet | BR 1999–2009 (fruit-veg 5×day) | BR 1999–2009 (fruit-veg 5×/day) | CO vs. US: 1.05 |
| Youth healthy diet (high school) | HKCS 2015 (veg 2×/day) | (n/a) | (n/a) |
| Adult healthy drinks | BR 2009–2017 (sugary < 1/day) | (n/a) | (n/a) |
| Youth healthy drinks (age 1–14) | CCHS 2004–2014 (sugary < 1/day) | (n/a) | (n/a) |
| Adult physical activity | BR 2001–2009 (per guideline) | BR 2001–2009 (per guideline) | CO vs. US: 1.13 |
| Youth physical activity (high school) | HKCS 2013–2015 (per guideline) | (n/a) | (n/a) |
| Breastfeeding (6 months+) | NIS 2001–2016 | NIS 2001–2015 | CO vs. US: 1.17 |
| Adult current smoking | BR 1999–2019 | BR 1999–2019, NH 1999–2008 | CO vs. US: 0.91; BR vs. NH: 0.935 |
| Adult former smoking | BR 2011–2019 | BR 2011–2019, NH 1999–2008 | CO vs. US: 1.04; BR vs. NH: 1.09 |
| Youth smoking (high school) | YR 2005–2019 | YR 1999–2019 | CO vs. US: 0.85 |
| Adult prediabetes | (n/a) | NH 1999–2008 | (n/a) |
| Adult diabetes | BR 1999–2018 | BR 1999–2016, NH 1999–2008 | CO vs. US: 0.70; BR vs. NH: 0.74 |
| Diabetes self-management education (DSME) or control | BR 2000–2017 (DSME) | BR 2011–2015 (DSME), NH 2005–2008 (control) | CO vs. US: 1.08; BR vs. NH: 0.98 |
| Adult high blood pressure | BR 1999–2015 | BR 1999–2015, NH 1999–2008 | CO vs. US: 0.81; BR vs. NH: 0.825 |
| Adult high cholesterol | BR 1999–2015 | BR 1999–2015, NH 1999–2008 | CO vs. US: 0.92; BR vs. NH: 0.715 |
| Cardiovasc. disease (ever event) | BR 2005–2018 | BR 2005–2016, NH 1999–2008 | CO vs. US: 0.69; BR vs. NH: 0.99 |
| Adult asthma | BR 2000–2016 | BR 2000–2016, NHIS 2001–2016 | CO vs. US: 0.99; BR vs. NHIS: 1.11 |
| Youth asthma (0–17) | (n/a) | NHIS 2001–2016 | (n/a) |
| Adult COPD | BR 2011–2016, NHIS 1999–2011 | BR 2011–2016, NHIS 1999–2011 | CO vs. US: 0.71 (BR), 0.78 (NHIS) |
| HPV vaccination female (age 13–17) | NIS 2008–2017 (2+ doses) | NIS 2012–2016 (2+ doses) | CO vs. US: 1.05 |
| HPV vaccination male (age 13–17) | NIS 2013–2017 (2+ doses) | NIS 2012–2016 (2+ doses) | CO vs. US: 1.13 |
| Colorectal cancer screen (age 50–85) | BR 2014–2016 | BR 2014–2016 | CO vs. US: 1.00 |
| Mammography past 2 years (age 50–74) | BR 2014–2016 | BR 2014–2016 | CO vs. US: 0.95 |
| Pap test past 3 years (age 21–65) | BR 2014–2016 | BR 2014–2016 | CO vs. US: 1.02 |
| Cancer incidence over 5 years | USCS 2011–2015 | (n/a) | (n/a) |
| Deaths by 5-or-10 year age group | CDPHE VSP 1999–2017 annual | (n/a) | (n/a) |
1 Ratios were used to fill in gaps in Colorado’s historical records. Key: BR (BRFSS): Behavioral Risk Factor Surveillance System (CO and US); NIS: National Immunization Survey (CO and US); NH (NHANES): National Health and Nutrition Examination Survey (US); YR (YRBSS): Youth Risk Behavior Surveillance System (CO and US); NSCH: National Survey of Children’s Health (CO and US); USCS: United States Cancer Statistics (CO and US); HKCS: Healthy Kids Colorado Survey (CO); CDPHE VSP: CO Dept of Public Health and Environment, Vital Statistics Program (CO); CCHS: Colorado Child Health Survey (CO); NHIS: National Health Interview Survey (CO and US); 5 cancer types: respiratory, colorectal, breast, oral, cervical; 11 death causes: diabetes, hypertension, CVD, asthma, COPD, 5 cancers, all-cause; (n/a): not available or not needed for CO model calibration. Adult refers to those 18+ years old.
Table 2.
Evidence-based interventions (n = 28) included in the system dynamics simulation model 1.
| Intervention Types | Target Description | Performance Definition (Data Source) | 2018 Value |
|---|---|---|---|
| Population health | |||
| Healthy food—adults | Adults age 18+ | Fruits/vegetables 5× per day (BRFSS) | 25% |
| Healthy food—youth | Youth age 0–17 | Vegetables 2× per day, high school (HKCS) | 30.5% |
| Healthy beverage—adults | Adults age 18+ | Less than 1 sugary drink per day (BRFSS) | 74% |
| Healthy beverage—youth | Youth age 0–17 | Less than 1 sugary drink per day, ages 1–14 (CCHS) | 85% |
| Physical activity—adults | Adults age 18+ | Exercise per national guidelines (BRFSS) | 57% |
| Physical activity—youth | Youth age 0–17 | Exercise per national guidelines, high school (HKCS) | 52% |
| Breastfeeding | New mothers | Breastfeed non-exclusive for 6 months (NIS for CO) | 67% |
| Antismoking—adults | Adults age 18+ | Smoking initiation below 2018 level, ages 18+ (NHIS) | 0% |
| Antismoking—youth | Youth age 0–17 | Smoking rate below 2018 level, high school (YRBSS) | 0% |
| Radon in new homes | New housing units | Radon mitigation beyond 2018 level (CDPHE) | 0% |
| Radon in resales | Housing unit resales | Radon mitigation beyond 2018 level (CDPHE) | 0% |
| Clinical prevention | |||
| Diabetes prevention program | Diagnosed (or high risk for) prediabetes | Completion of NDPP program (CDC for CO) | 0.1% |
| Female HPV vaccination | Females age 13–26 | At least 2 doses (NIS for CO) | 55% |
| Male HPV vaccination | Males age 13–26 | At least 2 doses (NIS for CO) | 55% |
| Smoking quit services | Adults age 18+ | Successful quit rate above 2018 level (NHIS) | 0% |
| Clinical screening | |||
| Blood glucose | Adults age 18+ | Checked past 2 years (BRFSS) | 74% |
| Blood pressure | Adults age 18+ | Checked past 2 years (BRFSS) | 83% |
| Cholesterol | Adults age 18+ | Checked past 2 years (BRFSS) | 81% |
| Lung CT scan | Smokers age 50–80 | Per national guidelines (NHIS for US) | 4.4% |
| Colorectal cancer | Adults age 50–84 | Per national guidelines (BRFSS) | 68% |
| Mammography | Females age 50–74 | Per national guidelines (BRFSS) | 74% |
| Pap test | Females age 21+ | Per national guidelines (BRFSS) | 81% |
| Clinical management | |||
| Diabetes | Diagnosed diabetes | Completion of diabetes self-mgmt class (BRFSS) | 60% |
| Hypertension | Diagnosed hypertension | Control per guidelines (NHANES for US) | 65% |
| High cholesterol | Diagnosed high cholesterol | Control per guidelines (NHANES for US) | 60% |
| Asthma—youth | Diagnosed asthma age 0–17 | No past year attack (NHIS for US) | 47% |
| Asthma—adults | Diagnosed asthma age 18+ | No past year attack (NHIS for US) | 55% |
| COPD | Diagnosed COPD | Daily treatment (BRFSS for selected states) | 50% |
1 Shown for each intervention is the corresponding target population, baseline performance metric, data source, and value of the metric in 2018.
Table 3.
Independent and cumulative intervention impact on simulated death rates per 100,000 adults as of 2050 (across 10 preventable causes of death, ‘Combo10’) and percentage reduction relative to the base run.
Table 3.
Independent and cumulative intervention impact on simulated death rates per 100,000 adults as of 2050 (across 10 preventable causes of death, ‘Combo10’) and percentage reduction relative to the base run.
| Intervention_Dose % 1 | Rank 2 | Independent Impact | Cumulative Impact | Proportion of Total Cumulative Impact | ||
|---|---|---|---|---|---|---|
| Death Rate per 100,000 | % Change | Death Rate per 100,000 | % Change | |||
| Base run | 0 | 411.098 | 0.00% | 411.098 | 0.00% | 0.0% |
| Smoking Prevention _23 | 1 | 402.391 | 2.12% | 402.391 | 2.12% | 22.1% |
| Diabetes Prevention_18 | 2 | 404.690 | 1.56% | 396.066 | 3.66% | 38.2% |
| Smoking Cessation_16.5 | 3 | 405.258 | 1.42% | 391.119 | 4.86% | 50.7% |
| Blood Pressure Management_25 | 4 | 406.856 | 1.03% | 387.019 | 5.86% | 61.1% |
| Physical Activity_11 | 5 | 407.652 | 0.84% | 383.876 | 6.62% | 69.1% |
| Colorectal Cancer Screening_26.5 | 6 | 409.220 | 0.46% | 382.029 | 7.07% | 73.8% |
| Diabetes Screening_20 | 7 | 409.494 | 0.39% | 380.604 | 7.42% | 77.4% |
| Asthma Control_16 | 8 | 409.605 | 0.36% | 379.371 | 7.72% | 80.6% |
| Cholesterol Management_18 | 9 | 409.766 | 0.32% | 378.140 | 8.02% | 83.7% |
| Blood Pressure Screening_20 | 10 | 409.806 | 0.31% | 376.764 | 8.35% | 87.2% |
| Fruit and Vegetable Consumption_5 | 11 | 409.934 | 0.28% | 375.771 | 8.59% | 89.7% |
| Diabetes Management_7 | 12 | 410.033 | 0.26% | 374.768 | 8.84% | 92.2% |
| Radon Reduction, Housing Resale_100 | 13 | 410.138 | 0.23% | 374.009 | 9.02% | 94.2% |
| Cholesterol Screening_20 | 14 | 410.577 | 0.13% | 373.480 | 9.15% | 95.5% |
| Radon Reduction, New Construction_100 | 15 | 410.704 | 0.10% | 373.249 | 9.21% | 96.1% |
| Respiratory Cancer Screening_10.5 | 16 | 410.789 | 0.08% | 372.986 | 9.27% | 96.8% |
| Smoking Prevention, Youth_23 | 17 | 410.805 | 0.07% | 372.765 | 9.32% | 97.3% |
| Asthma Control, Youth_16 | 18 | 410.876 | 0.05% | 372.605 | 9.36% | 97.7% |
| COPD Treatment_3.9 | 19 | 410.884 | 0.05% | 372.409 | 9.41% | 98.2% |
| Mammograms_16 | 20 | 410.924 | 0.04% | 372.239 | 9.45% | 98.7% |
| HPV Vaccination, Females_61.5 | 21 | 410.977 | 0.03% | 372.119 | 9.48% | 99.0% |
| Sugar Sweetened Beverage Policy_5 | 22 | 410.997 | 0.02% | 372.036 | 9.50% | 99.2% |
| Physical Activity Youth_6 | 23 | 410.999 | 0.02% | 371.960 | 9.52% | 99.4% |
| Breastfeeding Iniatives_23 | 24 | 411.007 | 0.02% | 371.873 | 9.54% | 99.6% |
| Pap Smears_19.5 | 25 | 411.028 | 0.02% | 371.810 | 9.56% | 99.8% |
| HPV Vaccination, Male_61.5 | 26 | 411.035 | 0.02% | 371.750 | 9.57% | 99.9% |
| Fruit/Vegetable Consumption Youth_5 | 27 | 411.052 | 0.01% | 371.714 | 9.58% | 100.0% |
| Sugar Sweetened Beverage Policy Youth_5 | 28 | 411.096 | 0.00% | 371.712 | 9.58% | 100.0% |
1 Interventions target adults population unless youth denoted. 2 Interventions are ranked from highest to lowest based on their individual impact.
Publisher’s Note: MDPI stays neutral with regard to jurisdictional claims in published maps and institutional affiliations. |
© 2022 by the authors. Licensee MDPI, Basel, Switzerland. This article is an open access article distributed under the terms and conditions of the Creative Commons Attribution (CC BY) license (https://creativecommons.org/licenses/by/4.0/).
Share and Cite
MDPI and ACS Style
Clennin, M.; Homer, J.; Erkenbeck, A.; Kelly, C. Evaluating Public Health Efforts to Prevent and Control Chronic Disease: A Systems Modeling Approach. Systems 2022, 10, 89. https://doi.org/10.3390/systems10040089
AMA Style
Clennin M, Homer J, Erkenbeck A, Kelly C. Evaluating Public Health Efforts to Prevent and Control Chronic Disease: A Systems Modeling Approach. Systems. 2022; 10(4):89. https://doi.org/10.3390/systems10040089
Chicago/Turabian StyleClennin, Morgan, Jack Homer, Alex Erkenbeck, and Cheryl Kelly. 2022. "Evaluating Public Health Efforts to Prevent and Control Chronic Disease: A Systems Modeling Approach" Systems 10, no. 4: 89. https://doi.org/10.3390/systems10040089
Note that from the first issue of 2016, this journal uses article numbers instead of page numbers. See further details here.