
Creating a System of IOE-PDPTA to Bridge Tourists and Poster Designers: An Application of IOE in Personalized Poster Design


1
Department of Design, National Yunlin University of Science and Technology, No. 123, Section 3, Daxue Rd., Douliu 64002, Taiwan
2
Department of Industrial Engineering and Management, National Yunlin University of Science and Technology, No. 123, Section 3, Daxue Rd., Douliu 64002, Taiwan
*
Author to whom correspondence should be addressed.
Systems 2022, 10(4), 125; https://doi.org/10.3390/systems10040125
Submission received: 20 July 2022
/
Revised: 14 August 2022
/
Accepted: 15 August 2022
/
Published: 19 August 2022
(This article belongs to the Special Issue Innovations in Educational Systems and Digital Transformations in Education)
Abstract
:Current applications of the Internet of Everything (IOE) tend to ignore the components of people, processes, and data. In the current study, we propose applying the IOE to design, the core of which comprises people, processes, and data. Evidence of the positive effects of the IOE on design indirectly confirms the value of these three components. The selected case study was poster designs advertising personalized travel. We reported the process of how the system was created, followed by an actual simulation with the personalized poster design for the tourism promotion for the city of Tainan, Taiwan. This study created an IOE framework and applied relevant algorithms to collect data to target design issues. Data were collected, converted, and cleaned through multiple physical objects, internet resources, and output keywords, which were then provided to three designers with various backgrounds and styles. Posters were designed based on the keywords identified. As the targeted audience, 124 respondents were recruited to participate in a survey on the finished posters. Analysis of this feedback demonstrated the validity of the proposed framework.
1. Introduction
Over the past 15 years, the increasing popularity of the concept of the Internet of Things (IOT) has led various industries to introduce it into their businesses, with varying degrees of success [1,2,3]. Scholars then extended this concept to the Internet of Everything (IOE) [4,5,6]. In contrast to the IOT, which only considers the connecting of physical objects to the internet and then basing decision making on the collected data, the IOE also connects people and processes with data [7]. Different people can use various networks or physical devices to engage in virtual or physical contact, and processes refer to the means of effectively managing people, data, and devices in continuously growing networks. Finally, data refer to the means by which the central processing unit of the IOE analyzes data collected from various places and makes better decisions accordingly. With these extensions, researchers [8] claim that the IOE can change industrial development by enabling businesses to complete work more efficiently and to face changes in competitive markets with greater speed and agility.
The potential applicability of the IOE has prompted many researchers to devote themselves to this topic. The most common focus is on consumers as the service target. This encompasses home automation [9], smart wearables [10], and smart meters [11]. With businesses as the service target, the research scope includes fleet tracking, smart warehouses, air pollution monitoring, and wind pressure monitoring. However, a comprehensive review of these studies reveals that most of them are founded in physical objects, with the three other components, i.e., “people”, “process”, and “data”, merely serving as aids. For example, “people” in these studies are usually only front-end queriers or end-end monitors and are less directly involved in the process of IOE algorithms. In addition, most of the “process” and “data” from the above research only discuss how to capture the data of physical devices and use these data for analysis without a large amount of information fusion or human decision making. Such a situation is not far from the traditional IOT approach, which is about processing physical devices and their data. Therefore, though these studies meet the definition of the IOE, they are in fact only mere extensions of the IOT. In other words, the value of the three remaining central components of the IOE, “people”, “process”, and “data”, have yet to be explored and verified.
To effectively present the value of people, processes, and data in the IOE, this study proposes applying the concept of the IOE to design. We selected the design industry because its work centers on people, processes, and data. All human creations and inventions are meant to solve the needs of people, so the design of mainstream products /services, according to a better understanding of user/customer diversity, should include as many people’s needs as possible. With the advancement of society, people’s lifestyles and workflow are becoming more and more complex. There are many kinds of “people” with diverse behaviors, preferences, and interests, so the design mainstream requires more data to create understanding and make decisions for future design. In addition, the rapid advancement of technology allows different data related to “people” to be stored in a digital way, resulting in the current era of big data [12]. Therefore, we can say that the design is due to people, and for people, so the design cannot be separated from the human factor after all. The purpose of service process design is also to reduce the complexity of people’s daily life. Moreover, new technologies of digital data communications and big data analysis support the new applications of human-centered design [13]. When facing various design categories, such as digital product design and interactive web design, the focus should be on an inclusive design concept for web user experiences because of the various needs of those users with different backgrounds [14]. Since inclusive design aims to allow for the engagement of various subjects, once there are big data for mining various users’ needs, it would assist in creating more design outcomes that easily meet users’ various expectations. Therefore, the design industry is centered on people, processes, and data, in order to meet people’s needs.
Generally speaking, the execution of a project in the design industry comprises five stages. In the first stage, the client explains important issues and conditions to the designer. In the second stage, the designer identifies candidate keywords based on the information provided by the client. The designer can obtain these keywords using two methods. One is searching data that the designer has collected in the past or by searching the designer’s past works; the other is searching the internet to find popular keywords associated with the target issues. In the third stage, the client or an objective third party verifies whether the candidate keywords fit the relevant issues. This step is important because the keywords are subjectively selected by the designer and may be biased. The fourth stage involves creating a design based on the verified keywords. In the final stage, the client displays the designer’s achievements to the public at an appropriate time and place, thereby achieving the objective. Say, for example, that the local government of Kyoto, Japan, hires a designer to design a series of tourism posters promoting summer attractions in Kyoto. The posters will be shown via online advertising in May and June to foreigners searching for a summer travel destination.
At first, the designer finds the words “matsuri” and “fireworks” from data he collected in the past or from previous works. The designer then searches online using the keywords “Kyoto” and “summer” and obtains other keywords, such as “Tanabata”, “Arashiyama Bamboo Grove”, “Kamo River noryo-yuka”, and “wind chime”. Next, the designer takes into account the fact that the posters will be aimed at foreigners and thus chooses Japanese words, such as “matsuri” and “Tanabata”, and attractions more widely known overseas, such as the “Arashiyama Bamboo Grove”. When government personnel verify the words, they feel that although “Tanabata” is a festival representative of Japan, it is not well-known overseas. The designer therefore only keeps the words “matsuri” and “Arashiyama Bamboo Grove”. In this example, we can clearly see that the three core components of the IOE, that is, people, processes, and data, play crucial roles. In terms of “people”, the promoted issues are conveyed by the client to the designer and the public. “Processes” refer to the means by which the designer manages existing keyword datasets and the new keywords found on the internet. “Data” refer to the means by which the designer selects the keywords that will be ultimately applied. Clearly, the core of a designer’s work coincides with the components of the IOE. However, no research yet exists on this topic; the current paper represents the first attempt to align the IOE with the design industry.
The general IOE framework proposed in this paper for the design industry includes a central processing unit and database located on the cloud, and this cloud processing unit is responsible for the human aspect of contacting designers and sending the public advertisements. Furthermore, regarding external data, the framework is responsible for collecting information about network resources or various physical objects. At the same time, this cloud processing unit controls the entire design and advertising push process. With this framework, we expect to connect people (client, designer, and the public) through the central processing unit and physical objects. The central processing unit itself can manage the people and physical objects in terms of processes, and at the same time, the algorithm achieves the crucial step of converting data into decisions. With this framework, we expect to be able to assist the design industry with the two improvements in industrial development. These include having the IOE complete the process of selecting keywords for the design, which will allow designers to enhance their work efficiency, and enabling designers to collect information associated with the target issues in real time and more swiftly understand relevant changes.
Despite the fact that design as a project tends to be context-specific, we utilized a real design case to verify the approach we proposed. The case in this study is a project involving advertising posters that are designed and integrated with personalized tourism recommendation systems as a response to the user’s expectation for this visit [15,16,17]. Personalized information that is customized and specifically designed for a particular person for the purpose of their visit will be more effective than general information, because the information is provided in response to the interests of the traveler, which will simplify their decision-making process and accordingly result in a better user experience. To be effective and efficient in serving prospective visitors, personalized or customized travel advertisements should be made a part of the online destination marketing program of a city.
The purpose of the current study was to construct an effective and efficient model of personalized advertisement generating systems using the IOE. Using as a case study the city of Tainan, Taiwan, for its well-known attractions of historic cultures and cuisines, we will present how an IOE-based design system can be created, as shown in Figure 1, to satisfy the needs of destination marketing. A two-stage simulation will be followed to show how the system works.
In the first stage, we employed the IOE framework to identify multiple tourism topics relevant to Tainan and associated keywords. In the second stage, we had three designers create multiple personalized advertisements based on the extracted keywords and surveyed the opinions of 124 participants regarding their preferences towards tourism attractions in Tainan and towards the designed advertisements. The results indicate that advertisements based on keywords extracted using the proposed approach accurately targeted user preferences.
2. Literature Review
Two types of studies are relevant to the aims of this paper: those focused on the use of data analysis to make personalized trip recommendations and those considering the influence of keywords on visual designers of travel advertisements.
2.1. Data Analysis for Personalized Trip Recommendations
A personalized travel recommendation is the first factor in complying with the visitor’s personal expectations. Recommendations shall be customized through a two-step approach, understanding user preferences, and then matching such preferences with appropriate tourism attractions and routes. Data for the former can be sourced from check-ins and posts or viewing history, and then single or multiple matches and recommendations can be provided by the latter.
Early personalized trip recommendation systems [15,17,18,19] emerged with the rise of social networking websites that generally encourage the continuous sharing of life experiences on the platforms. Users’ footprints (i.e., check-in data) provide abundant data with which researchers can analyze the users’ travel preferences; for example, a frequent visitor to the websites of national parks is highly likely to be a fan of natural scenery [18,20].
The algorithm proposed by Ying et al. [19] employed various types of data from check-in files for varied purposes in promotion, such as using individual records to understand personal travel preferences, records of users’ friends to make trip recommendations, and records of all users to identify the popularity of each attraction. However, an approach of this kind becomes obsolete because of growing privacy protection with statuary regulations.
Online textual data can be used to generate personalized trip recommendations through different computation methods, which have a profound impact on a user’s decisions with regard to travel. Samples of this kind include the following: applying Latent Dirichlet Allocation (LDA) to hotel reviews of a website platform to recommend ideal hotels [21]; employing GPS data as well as comments on social networking sites to make trip recommendations [22]; mining data from Wikipedia to suggest ideal seasons to visit tourist attractions [23]; applying Spatial-Temporal LDA to social networking data from Foursquare to identify the preferred time and space of visitors [24]; using LDA and Term2Vec in reviews in TripAdvisor to understand the difficulties that foreign tourists encounter during trips to Korea [25]; using LDA in Google and TripAdvisor to reveal tourist attractions [26]; using an enhanced Collaborative Filtering (CF) method to recommend a suitable attraction [15]; and suggesting new attractions that have a high similarity by comparing visiting records [27]. Based on user preferences, a well-designed system is able to provide users with a list of recommend attractions with varying levels of suitability. While these studies offer interesting results, their objectives vary from those of the current paper. Therefore, they cannot be directly applied to our study problem.
Moreover, some other studies provide a complicated system in response to travelers with multiple interests. For instance, Lee et al. [28] proposed a recommendation system that first identifies the top five restaurants and top five attractions in a city and then combines the eight locations into an itinerary. Zheng et al. [29] developed an attraction recommendation method based on GPS trajectory data and obtained the score and rank of each trajectory using a rank-by-frequency algorithm and a rank-by-count algorithm to recommend itineraries. Yoon et al. [30] ranked possible itineraries with the Euclidean distance and classical travel sequence ratio to include four indicators of stay time ratio, elapse time ratio, interest density ratio, and classical travel sequence ratio. Chiang et al. [16] considered the number of travel days, time, budget, and the desired types of recommended attractions to make trip recommendations. However, this approach recommends the best attractions in each category; it cannot further analyze user preferences and check-in records to adjust the recommendation results. Lu et al. [17] presented the Trip-Mine algorithm, which considers trip scores and the travel time limit given by users to find travel routes with the highest scores. These approaches were all conducted with the tourist’s travel needs in mind only, ignoring the importance of professional design in competing to be the tourist’s favorite.
2.2. Influence of Keywords on Visual Designers of Travel Advertisements
Although promotional media has moved online in the digital era [31], the design philosophies of visual advertisements remain [32]. A visual advertisement includes graphics, text, and color to advertise, notify, persuade, and remind a pre-determined audience [33,34,35]. Effective design readily attracts the attention of a viewer, effectively conveys information, and then persuades the viewer within an extremely short period of time, e.g., three seconds [36]. To initiate this subsequent behavior, designers rely on the subject, layout, graphics (including images, figures, and tables), text (terms and typeface), color, white space, and style. These elements must follow an appropriate flow line.
Topic ideation is generally the first step of this process. Divergence and convergence structure the topic and gradually produce the title and content. In topic ideation, designers can simply input keywords to an online search engine to retrieve data. Based on personal experience and cultural learning, designers can then retrieve the needed information, interpret it through their own imagination, define the desired visual elements, and then apply their composition ability.
Early on, the keywords obtained via big data analysis would enable a swift summarization of the experiences of the online community as well as rapid identification of their preferences, thereby shortening the data compilation process and minimizing the influence of the personal preferences of designers. The response of the designers to the keywords acquired using big data analysis is still subject to the influence of their own backgrounds, including educational history, life experiences, and culture. Despite the subjective process of interpretation, trending keywords offer an efficient route to designing commercial promotions.
3. IOE-Based Design System
This section first introduces the IOE framework that we designed. Then, based on this IOE framework, we created a system specifically for the case city, called IOE-Poster Design for Personalized Tourism Advertising (IOE-PDPTA). A general introduction to the system and the type of data that it collects will be illustrated. How the system converts the collected data into textual data will also be discussed in the following sections. This section will then end with how it cleans the converted textual data and determines candidate keywords accordingly. Lastly, we illustrate how IOE-PDPTA verifies these keywords.
3.1. IOE Framework for Design Industry
Before we introduce the proposed system, we first introduce the framework that merges the concept of the IOE and the design industry. The proposed framework is shown in Figure 1, including a central processing unit in the cloud. This unit consists of five parts. The first part collects data with a database that records the keywords that a design team or designer has used previously. After receiving a task, this module also collects data from various internet resources such as social networks and office websites or from various physical objects such as smartphones and connected cars. The second part converts the collected data into textual data, as this is more suitable for subsequent analyses. The third part processes the textual data by selecting candidate keywords. The fourth part verifies the candidate keywords using various internet resources such as Google searches and hashtags on social networks or through various physical objects such as connected cars and wearable devices. The verified keywords are then output for the designer to choose from. All of the output words should fully reflect the target issue. Finally, in the fifth part, the designer submits the completed design to the central processing unit, which determines to whom the design work is presented, thereby maximizing its effectiveness. From the above description, we can understand that this framework fits the definition of the IOE, which says “IOE is more about not the ‘things’ but the ‘connections among people, process, data, and things’” [8,37,38,39]. The “people” in the definition correspond to the owners, designers, and people in the framework in general. “Process” corresponds to the central processing unit in the framework and uses five parts to manage “people”, “data”, and “things” in the algorithm. “Data” can correspond to text data, keywords, and network resources, among other things, in the framework. Finally, “things” correspond to the internet resources and physical objects related to the framework. This also confirms the rationality of the framework that we have developed.
3.2. IOE-PDPTA
Based on the main principles of the IOE that are adopted in Figure 1, the details that meet the needs of the target issue are included in IOE-PDPTA, as shown in Figure 2.
Module 1 collects travel information on City X (the city whose government commissioned the tourism advertisements), including the movements and opinions of visitors. Movement tracking helps to find the tourist attractions in X and the amount of time the tourists spent there. Opinions of visitors help to determine the category of the attractions and their rating. IOE-PDPTA collects the former type of data using the GPS locations of physical objects such as smartphones and connected cars and collects them through internet resources such as posts on social networks.
Module 2 converts the collected data into textual data, which are more accessible for designers. As the tourist opinions are already in a textual format, the only thing they need to do is convert GPS information into textual data.
Module 3 identifies tourism topics in City X and relevant keywords from the collected textual data, which achieves the conversion of data into decisions. This conversion comprises two rounds of Latent Dirichlet Allocation (LDA) to convert the complex textual data into reasonable topics and keywords. As the purpose of texts posted on travel sites varies, not all will feature keywords relevant to tourist attractions in the target city. The texts included may cover official event promotions and questions posted by tourists such as those regarding local transportation, accommodation, and weather reports. Inputting all of these texts to LDA for analysis is likely to result in confusion due to errors, including irrelevant keywords, such as “room rates” and “bus time schedules” and excluding important keywords such as “shrine”, “museum”, and “unique snacks” for the project. Hence, the first round of LDA groups the texts based on the purposes of the trip, and the second round groups the topics such as shopping, natural scenery, history, and food. With this approach, we can ensure that the keywords extracted by the framework are all associated with tourism topics. Finally, the topics and candidate keywords of the topics identified in the second round of LDA are then used for verification in the next module.
Module 4 of IOE-PDPTA verifies the reasonableness of the keywords, including spatial rationality. This is important because the geographical relationships between attractions are important. The features of attractions may also vary with the geographical area. For instance, conventional markets and modern shopping malls are both categorized as shopping, though the target audiences are completely different. To overcome the potential pitfalls of grouping basic keywords with LDA, which may misplace keywords with heterogeneous features in the same group, the spatial relationships between the topics may need correcting. The current study proposes using internet resources such as the Google Maps API and travel blogs or physical objects such as smartphones and connected cars to derive the relationships between pairs of keywords in the same topic. Next, the well-known spatial grouping algorithm, Density-Based Spatial Clustering of Applications with Noise (DBSCAN), is used to adjust the keywords from a spatial perspective.
The central processing unit outputs topics and keywords by completing spatial verification. The designer then selects several keywords for each topic to design correspondent post advertisements. The advertisements are published after IOE-PDPTA, which collaborates with a personalized tourism recommendation system to identify suitable topics for each user based on their preferences.
This framework only uses the original LDA and DBSCAN for analysis because the focus of this paper is a discussion of the contributions of the concept of the IOE rather than the development of novel algorithms. Thus, we selected simple algorithms with widely applicable toolkits to minimize the impact of the algorithms themselves on the experiment results. Extensions of this framework could be achieved by employing more in-depth algorithms suited to the topic or target. As recommendation systems represent a complex well-researched field, we omit any detailed discussion which would shift the focus from the current research objective.
3.3. Data Collection in IOE-PDPTA
Movement data obtained from physical objects can be divided into two categories. The first comprises GPS records from mobile physical objects such as smartphones and connected cars within the range of City X. These records include three fields: time, latitude, and longitude. The second category contains population-related data from stationary physical objects such as public bicycle usage records, parking lot car counters, or the number of customers entering a chain store in City X. In this work, we used a relatively simple and intuitive way of collecting data: collecting all posts containing “X” on travel social networking platforms.
3.4. Converting Original to Textual Data
The processes of converting raw data from dynamic and static objects differ and deserve separate discussions.
As far as dynamic objects are concerned, the main challenge was to determine the destinations visited by the targeted tourists. Figure 3 displays a simple destination classification tree. The first layer divides the data of tracks into the locals and the non-locals of X. Local residents can be determined by the duration of time each user spends in X. The second layer divides the tracks of the non-locals into tourists and routine visitors, on the basis of whether the tracks overlap with those of most other non-locals. By observing the degree of overlapping of movement focused on tourist attractions in X, the high overlapping indicates tourists, and the low overlapping indicates business travelers or routine visitors. Following classification, we extracted the movement records of tourists and identified the top-k locations visited by these tourists. These were considered the primary tourist attractions, which served as keywords to obtain posts on social networking platforms.
As for the static physical objects, we sought to identify changes in crowd flow between holidays and non-holidays, as the number of people visiting tourist attractions on holidays is greater than that on non-holidays. Thus, we could examine this data to determine which physical objects were close to popular tourist attractions. Again, the names of these tourist attractions became keywords to facilitate searching on social networking platforms.
3.5. Cleaning Textual Data
Data cleaning is performed with the following process after collecting travel posts from social networking platforms: (1) using a Chinese Knowledge and Information Processing (CKIP) kit [40] to segment the terms in the texts collected from the travel social networking sites and select those that may be associated with travel, (2) using a parser to remove all non-Chinese terms, and (3) optimizing the terms manually. These steps generate a set of multiple terms for each text; these sets are input to subsequent LDA analysis. Further details are provided below.
The first step of preprocessing is to segment the terms in all of the texts using the CKIP kit. Note that we used the CKIP term segmentation system because the texts we analyzed were written in traditional Chinese. The CKIP system was specifically developed for traditional Chinese, and it has been applied to a number of studies [41,42]. For each text input, the system performs term segmentation and tags each Chinese term with which part of speech it is, such as noun, verb, or adjective. These tags enable the preliminary selection of relevant terms. For instance, nouns, verbs, and adjectives are good starting points. Nouns may refer to things of interest such as “temples”, “shopping centers”, or “snack stalls”. Verbs may refer to tourist activities such as “buy”, “hike”, “eat”, and “row”. Adjectives are often used to describe things that tourists encounter during their trips, such as “beautiful”, “magnificent”, “big”, “many”, or “blue”. We excluded prepositions and interjections because the former exists to improve textual flow and generally have nothing to do with travel and the latter are generally expressions of emotion and do not have much meaning. We used these segments to obtain term sets.
The second step of preprocessing is to use a parser to remove any non-Chinese terms from the term sets. Note that although the CKIP system had already eliminated some Chinese terms that were not associated with travel, online texts are often written in a casual tone containing a mix of Chinese and English, emoticons, punctuation marks, and numbers, all of which the CKIP system cannot process. We, therefore, used a parser to remove unnecessary elements.
An intervention will be applied when the terms apparently irrelevant to the topics emerged, such as the names of unique attractions or stores, snacks, or products unique to the city, or terms that coincidentally form other meaningful terms with the terms before or after them. Actions of elimination or combination will help increase the accuracy of the operation.
3.6. Determining Candidate Topics and Keywords
After obtaining n term sets, we grouped the terms using two rounds of LDA. Generally, before applying LDA, a researcher must (1) define m, the desired number of topics, (2) take the union of all term sets, integrate them into one set, and calculate the number of times each term appears, and (3) define n, the desired number of groups. The researcher then inputs k texts to LDA, which derives two optimized relationship matrices. The size of the first is k × n, representing the relationship between each text and each group of terms; the size of the second is n × m, representing the relationship between each group of terms and each topic. After LDA finds these two optimized relationship matrices, the researcher determines which group of terms is most closely associated with each topic. Each text can also be assigned to the group of terms that it is most closely associated with and linked to suitable tourism topics accordingly.
The aim of the first LDA analysis was to identify the purpose of each text. This means that the topic that we were investigating was the objective of posting. Suppose that we have three texts from which we seek five groups of terms to explore seven posting objectives. After inputting all of the information to LDA, we should obtain an optimized relationship matrix for each text and term group (Table 1) and an optimized relationship matrix for each term and posting objective (Table 2).
The figure corresponding to Text 3 and Term Group 1 in Table 1 is 0.09, which means that the degree of correlation between Text 3 and Term Group 1 was 0.09. In Table 2, the figure corresponding to Term Group 4 and Posting Objective 1 is 0.45, which means that the degree of correlation between Term Group 4 and Posting Objective 1 was 0.45.
The relationship between text i and group j is termed as
, and
for the relationship between group j and objective h. The values of
and
can be calculated using the following equation:
where
and
are two probability distributions, θ and ϕ, and are calculated using α, β, and the Dirichlet distribution. Previously, if we wanted to solve Equation (1), three methods were available: the Markov Chain Monte Carlo sampling method [43,44], the Metropolis–Hastings sampling method [45,46], and the collapsed Gibbs sampling (CGS) method [47]. Among them, the Markov Chain Monte Carlo sampling method is the most basic of the three. It first randomly initializes a set of conditional combinations and then changes one of the variables according to the conditional probability. It then changes the following variables according to the newly obtained conditional probability. Finally, after repeating the above actions, it becomes a Markov chain, the concept of which is then used to solve the equation. However, because the convergence rate of the Markov Chain Monte Carlo sampling method is too slow, scholars subsequently proposed the Metropolis–Hastings sampling method and the CGS method based on this method to speed up operations. Regarding these two methods, the CGS method is faster than the Metropolis–Hastings sampling method in dealing with high-dimensional problems and has thus been widely used by scholars to address the issue of text analysis [48,49,50]. Therefore, the paper also refers to the practice of these scholars and used the CGS method to solve Equation (1). First, we used the following equation to simplify Equation (1):
where zi represents the term group k corresponding to posting objective i and z−i is the term group vector corresponding to the posting objectives excluding i. At first, CGS will randomly assign all of the terms and posting objectives to a group z ∈ k. Next, CGS tallies the number of times a posting objective is assigned to a group and the number of times a document is assigned to a group. Based on these results, the probability of p(zi = k|z−i, h) is calculated. Finally, CGS uses Equation (2) to update the posting objective groups and repeats this step until θ and ϕ no longer change. Here, we can obtain the approximate optimal solution of Equation (2), obtaining
and
as follows:
We then obtain an optimized relationship matrix for each text and term group and an optimized relationship matrix for each term and posting objective. Based on the term group most closely associated with each posting objective, we can then derive the number of posting objectives the texts can be divided into and identify the purpose of each text based on the two relationship matrices. Finally, we select those texts which can best promote the designers’ understanding of the topics and keywords relevant to tourism in the target city, such as attraction content introduction and travel review.
After the first LDA analysis, the input of the second LDA analysis should be associated with attraction introductions and travel reviews. While the first LDA analyzes posting objectives, the second analyzes tourism topics. Otherwise, they are the same. Thus, we will not discuss the LDA algorithm again.
3.7. Verifying Keywords with Spatial Rationality
After the tourism topics of X and corresponding keywords were obtained, we verified their spatial rationality using the following six steps. (1) Select results whose spatial rationality needs to be verified. (2) Regarding the m topics that need to be verified, choose k posts that are most relevant to each topic. (3) Access external internet resources through the IOE framework and identify the names of places or stores mentioned in the m × k posts. For the sake of convenience, we refer to places and stores as points of interest (POIs). (4) Obtain tracking data from mobile physical objects via the IOE framework and analyze the spatial relationships among these POIs. (5) Input all of the POIs obtained and their relationship tables into DBSCAN for grouping. (6) Manually integrate the grouping results into m new groups. These replace the original m topics. Below, we explain these six steps in further detail:
Step 1: Following LDA analysis, some topics were clearly defined, whereas some will showed a high degree of overlap. In this case, we must verify the reasonability of the latter. Any category with two or more overlapping topics required a separate DBSCAN grouping process. For instance, if two topics both had to do with food and three topics all have to do with shopping, then the verification was performed separately for the food and shopping topics.
Step 2: For each topic α selected in the previous step, we selected the k texts most closely associated with α. This was achieved using the two optimized relationship matrices from LDA. Suppose the topic we are considering is α, and the text whose association with α we are calculating is β. We first find the relationship vectors of β and all of the term groups from the optimized relationship matrix for each text and each term group. Next, we find the relationship vectors of α and all of the term groups from the optimized relationship matrix for term group and each topic. The relationship between α and β can then be obtained from the sum of the products of these two vectors. Finally, after calculating the association between α and all of the documents, we can select the top-k texts for the subsequent analysis.
Step 3: External internet resources were accessed through the IOE framework to identify the POIs in the obtained posts. In principle, a number of different internet resources can assist with this step. However, we recommend using the Google Maps API because its grafting with various frameworks is simple and enables fast computation. Suppose the text we are extracting point locations from is β, and we already have the term segmentation results of β. These terms are separately input as search terms to the Google Maps API. If the API returns latitude and longitude coordinates for the first term and the coordinates fall within X, then the term is recorded as a POI and is marked for further analysis. If the term is not used to describe a spatial point location or the point location is not situated in X, then no further processing is conducted. Note that this approach is fast, but there is still a chance of generating noise. For example, some store names may be identical to relevant terms, or the API may return multiple point locations for a term. If there is a little noise, we suggest ignoring it, as DBSCAN has good resistance to noise. However, if there is a lot of noise, we suggest manual cleaning.
Step 4: The spatial relationship between two POIs can be defined in a number of ways. As the target issue of this study was tourism, we defined it as the probability that these two POIs would be visited by tourists on the same day. If many tourists visited these two POIs on the same day, we could say that these two POIs belong to the same tourism topic and they have a strong spatial relationship. If not, then it is likely that they do not belong to the same tourism topic and have a weak spatial relationship. To derive this spatial relationship, we first obtained tracking data from mobile physical objects, such as connected cars, wearable devices, or smartphones, via the IOE framework. Next, we segmented each set of movements by date and tallied the number of times that pairs of POIs were visited on the same day. The higher numbers indicated a stronger spatial relationship.
Step 5: After obtaining the POIs to be grouped and the spatial relationships between POI pairs, we next employed DBSCAN to group the point locations. As DBSCAN is a well-known algorithm, we only introduced its operating concepts. For further details, readers may refer to the content of [51]. Two parameters must be set before running DBSCAN: the radius of the neighborhood around the target (EPS) and the minimum number of data points existing within said neighborhood (MinPts). Then, we randomly selected point P for analysis and calculated the neighborhood radius of P and the number of POIs whose spatial relationship with P was greater than a certain threshold value. If this number was greater than MinPts, then P was recognized as cluster C. If not, then P was deemed to be noise. The algorithm then extracted another point P’ within the distance EPS of P and repeated the above calculations until all the information had been checked. After most of the points on the map were assigned to various irregularly shaped groups, a small number of points were regarded as noise and not assigned to any group.
Step 6: Once several groups were obtained, each group should have theoretically been regarded as an independent topic. However, because only a single value can be used for EPS in the DBSCAN algorithm, the same distance was used when considering the relationships between different attractions, regardless of location. Clearly, this is not how attractions are distributed in practice. Attractions in downtown areas may be close together, while those in the suburbs may be sparsely distributed. Under such circumstances, setting a short EPS may be effective in separating attraction groups downtown, but attractions in the suburbs may be regarded as noise and ignored. In contrast, setting a long EPS would be effective in grouping attractions in the suburbs, but all of the attractions downtown might be classified as one group, making the grouping meaningless. Thus, we combined the multiple neighboring groups obtained in the previous step into a single large group based on the context. This gave us the final topics.
4. Simulations
We conducted a two-stage experiment to verify the proposed IOE-PDPTA, including (1) using the framework to output tourism topics of the selected city and associated keywords and (2) hiring three designers to create personalized travel promotions based on these keywords for evaluation by 124 survey participants. In this chapter, we discuss the experiment environment, data collection, the results of the first and second rounds of LDA, and those of spatial rationality verification. We also analyze feedback on the designed advertisements.
4.1. Experiment Environment
In this experimental simulation, we chose Tainan, which is Taiwan’s most famous tourist city, as the verification object. This city was chosen for two reasons. First, a city that outsources tourism advertisements to the design industry usually entrusts the task to a design team in the same country. Such a team should be familiar with the core tourism value of the target city and thus design suitable tourism advertisements. For this experiment, to simulate the most realistic situation, and because the designers whom we could find were all Taiwanese, we had to select cities in Taiwan as the research target. Of course, there are more well-known tourist cities worldwide. However, because none of those cities are located in Taiwan, if a Taiwanese designer is invited to design travel ads for said cities, the intended focus of an advertisement may be distorted, and thus the accuracy of the simulation is affected. Among all Taiwanese cities, Tainan is undoubtedly the most popular tourist city. It is not only the oldest city in Taiwan but also contains different tourist attractions, such as numerous historical sites and local cuisines, abundant natural scenery, and rural attractions, among others. The variety of tourist attractions makes Tainan very suitable for verifying the methodology of this paper; therefore, this experiment took Tainan as the experimental verification city. In addition, information and reviews regarding travel to Tainan provided rich data to exploit for the system.
The material used in IOE-PDPTA was the textual data of PIXNET [52], which is the most influential social networking platform for travel with the largest number of users in Taiwan. The Google Maps API was used to verify the spatial rationality of the material. Data on the numbers of visitors recorded and released by the Tainan city government for each attraction [53] were used as the physical objects connected to IOE-PDPTA. We then assumed that the relationships between all pairs of POIs were identical while verifying the spatial relationship, and such relationships will only be influenced by the linear distance between the two POIs. Although such an assumption indeed does not reflect actual tourist behavior, supposing there are no detours while traveling between POIs in a flat plain as in Tainan is logical.
Three visual designers with different design experiences and styles were recruited to create advertisements based on the extracted keywords for this project. One was an online designer with an artistic style, the second was an online designer with a practical style, and the third was an undergraduate majoring in design. Since the youth is the target market for online marketing, we recruited 124 students aged between 18 and 22 years old to participate in the survey of the completed designs.
4.2. Data Collection
By searching PIXNET with the keyword “Tainan”, 3868 valid posts were identified via crawling. All of these posts were included in our algorithm for analysis. According to the datasets, which were made public by the government, the top five tourist attractions with the most visitors in Tainan are Chihkan Tower, Anping Fort, Anping Tree House, Blueprint Cultural and Creative Park, and the Old Waterworks Museum. The search on PIXNET with these tourist attractions as keywords resulted in 270, 212, 134, 119, and 44 posts, respectively. Surprisingly, the sum of such searching remained the same as that from crawling into PIXNET.
4.3. First LDA Grouping
Results of the first LDA are shown in Table A1 in Appendix A. They included seven posting objectives, defined by the top 50 keywords with the highest correlation to the objective. We experimented with five to ten groups, but the silhouette coefficients were all roughly the same, as shown in Figure 4. We therefore adopted the number of groups (seven) that multiple locals felt to be the most accurate. Furthermore, although each posting objective exhibited thousands of correlated keywords, due to length constraints, we defined each topic using the top 50 keywords.
Group 1: This group of keywords was clearly associated with introductions, appearances, and features of attractions in Tainan, including those of “art”, “history”, “museum”, “Japanese-style”, “paint”, “retro”, “park”. This kind of posting objective was then termed as “introducing attractions” in the LDA analysis.
Group 2: The keywords in this group were the names of other cities in Taiwan or in other countries: “Chiayi”, “Nantou”, “Changhua”, “Europe”, “Okinawa”, “Yunlin”, “Netherlands”, “Hong Kong”, and “Taitung”. This kind of posting objective was termed as “introducing attractions throughout Taiwan”, yet this group was not included in the advanced analysis.
Group 3: The keywords were clearly associated with local transportation in Tainan: “recommend”, “traffic”, “route”, “interchange”, “parking”, “drive”, “accommodation”, “facility”, “holiday”, “fare”, “regular ticket”, “platform”, and “convenient”. We did not include this group in the following analysis.
Group 4: The keywords were all associated with everyday life: “see”, “know”, “feeling”, “compare”, “friend”, “pity”, “leave”, “prepare”, “happy”, “children”, and “departure”. We therefore termed these texts as sharing travel experiences with friends or family. We did not include this group in the following analysis.
Group 5: The keywords were all associated with food and drinks, including many restaurant-related terms: “signboard”, “menu”, “boss”, “business”, “handmade”, “day of closed”, “night market” and other food-related terms: “delicious”, “flavor”, “fresh”, “breakfast”, “fruit”, “black tea”, “beef”, “shrimp”, “pudding”, and “cake”. We therefore determined associated texts through food reviews. As cuisine is often related to the features of attractions at a destination, we included these in the following analysis.
Group 6: The results for this group were surprisingly correlated with wedding photography: “marriage”, “love”, “church”, “couple”, “crystal”, “white”, “scene”, “intimate”, “films”, “art”, “wedding dress”, “drama” and “photo”. We therefore defined the posting objective of texts in this group as the sharing of wedding photos or promotions by wedding photography companies. We found out that many wedding photography companies in Taiwan use PIXNET to promote their services. The government of Tainan has also recently been actively promoting the city as a wedding photography destination.
Although there was a large number of keywords related to this topic, this group was not included because wedding photography is not a frequent or primary motivation for travel for most tourists.
Group 7: This group was clearly associated with the historical attractions in Tainan and termed as “introducing historical sites” with the keywords “antiquities”, “history”, “castle”, “Foreign”, “memorial”, “museum”, “Confucius Temple”, “old street”, “ancient”, “Chihkan Tower” “Japanese occupation”, “temple”, and “Qing Dynasty”. This was included in the following analysis.
Therefore, Groups 1, 5, and 7 were selected for the second round of LDA analysis.
4.4. Second Round of LDA Grouping
The second round of LDA analysis was conducted with the texts selected in the first round. Again, multiple LDA analyses with five to ten groups resulted in similar silhouette coefficients (as shown in Figure 5). Thus, we followed the advice of local Tainan residents in selecting seven topics. The top 70 keywords that most correlated with each of the topics, as shown in Table A2 in Appendix A, were provided to the designers for post-design in the subsequent stage.
Group 1: The keywords can be roughly divided into two sub-categories because of their similarity to each other. The first category describes the scenery of the old streets in Tainan: “blue print”, “graffiti”, “quiet”, “slow”, “handrail”, “architect”, “pool”, and “garden”. The second describes the stores in buildings that have been renovated along the old streets: “cafe”, “ancient house”, “cloister”, “wooden house”, “coffee”, “tea house”, “maintain”, and “repair”. This group was named “Old Streets and Alleys”.
Groups 2 to 4: The keywords in these three groups were associated with restaurant names, names of foods, and descriptions of food, such as “Amin”, “Chou’s”, “Nagio”, “Deep Blue”, “Ton-gji”, “Lily”, “fatty meat”, “juice”, “tofu”, “curry”, “rice cake”, “creamy”, “delicious”, “late night supper”, “home-made”, “hot meal”, and “sweet”. We therefore named these three topics “Food”. These three groups showed a lot of repetition. For instance, the store name Lily appeared in both Group 2 and Group 3, and terms such as A-ming, curry, and Chou’s appeared in all three groups. We therefore input the texts belonging to these three topics into DBSCAN for spatial grouping.
Groups 5 and 6: A small portion of the keywords for these two groups were associated with the countryside, such as “countryside”, “riverside”, “farmhouse”, “Sanheyuan” (a type of rural housing in Taiwan), and “Lioujia” (one of the most rural areas in Tainan). There was no need to make further categorizations with DBSCAN due to their unique features. For instance, Group 5 contained many keywords associated with museums in Tainan: “arcade”, “closed”, and “artwork” (these terms are related to Chimei Museum [57]). In contrast, keywords in Group 6 were associated with Tainan attractions along the coast, such as “sperm whale”, “heron”, “salt manufacturing”, and “coastal”. We therefore termed these topics as “Museums and the Countryside” and “The Coastal Countryside”.
Group 7: The keywords in this group were clearly associated with historical attractions, including the names of historical attractions and the name of emperors: “Moat”, “Guandi Temple”, “Xiaodongmen”, “watchtower, academy”, “stone turtle”, “ancient city”, “Yongli (1646–1683)”, and “Kangxi (1735–1796)”. We therefore named this group “Historical Sites”
4.5. Spatial Rationality of Tourism Topics and Keywords
Further verification of spatial rationality was necessary for the three food topics. We extracted the top 10 texts in each group with the highest correlation. Among the 30 texts, we identified 428 point locations in Google Maps, as shown in Figure 6. The results of grouping these point locations using DBSCAN are shown in Figure 7. They included five groups: Anping food, Guohua Street food, Chihkan Tower food, Confucius Temple food, and East Gate Traffic Circle food. The introductions in many magazine articles on cuisine in Tainan generally introduce the food in Anping and that on Guohua Street in separate sections, whereas the other three areas are not usually introduced separately. We therefore restructured this grouping as follows: Anping food, Guohua Street food, and Old City District food.
The proposed framework can be completed within one day, which greatly reduces the loading that designers need to put in to understand the key travel features of a destination city.
4.6. Performance Comparisons between Proposed Method and the Most Common Previous Method
In this section, we invited 3 designers and 124 individuals to help us to compare the differences between the proposed method and the previous method in terms of publicity. The first was the proposed method. We asked each designer to design some posters according to the keywords of the seven topics identified in the previous section. A poster had to be designed for each of the topics. The keywords of each poster were composed of 7 keywords, and the designers freely selected them from the 70 keywords of each topic. As for the previous method, we achieved it by imitating the way general advertisements were made in the past. We first selected the top 10 correlated keywords of the seven topics and combined them into a set of 70 keywords. This set could be regarded as containing the most popular keywords in the target city. Next, we asked the designers to select seven keywords from this collection to draw a poster. Note that to make the experimental description conform to the principle of the paper, we refer to the posters drawn according to the keywords found by the proposed method as a personal advertisement; the posters drawn according to the keywords found by the previous method are called general advertisements. Finally, all designed products were presented to the 124 individuals to collect their opinions.
Online advertisers either analyze or extract the texts being browsed, and this is followed by keyword analysis. The former is used within platforms, while the latter is commonly applied to cross-platform analysis. In this project, the survey participants were given both the texts and extracted keywords of the seven selected topics to rank their preferences. All designed advertisements by each designer were then presented to the participants to rank in the order of preference. We analyzed this ranking to determine whether they were more positively influenced by advertisements focused on their preferred tourism topics than by a general advertisement.
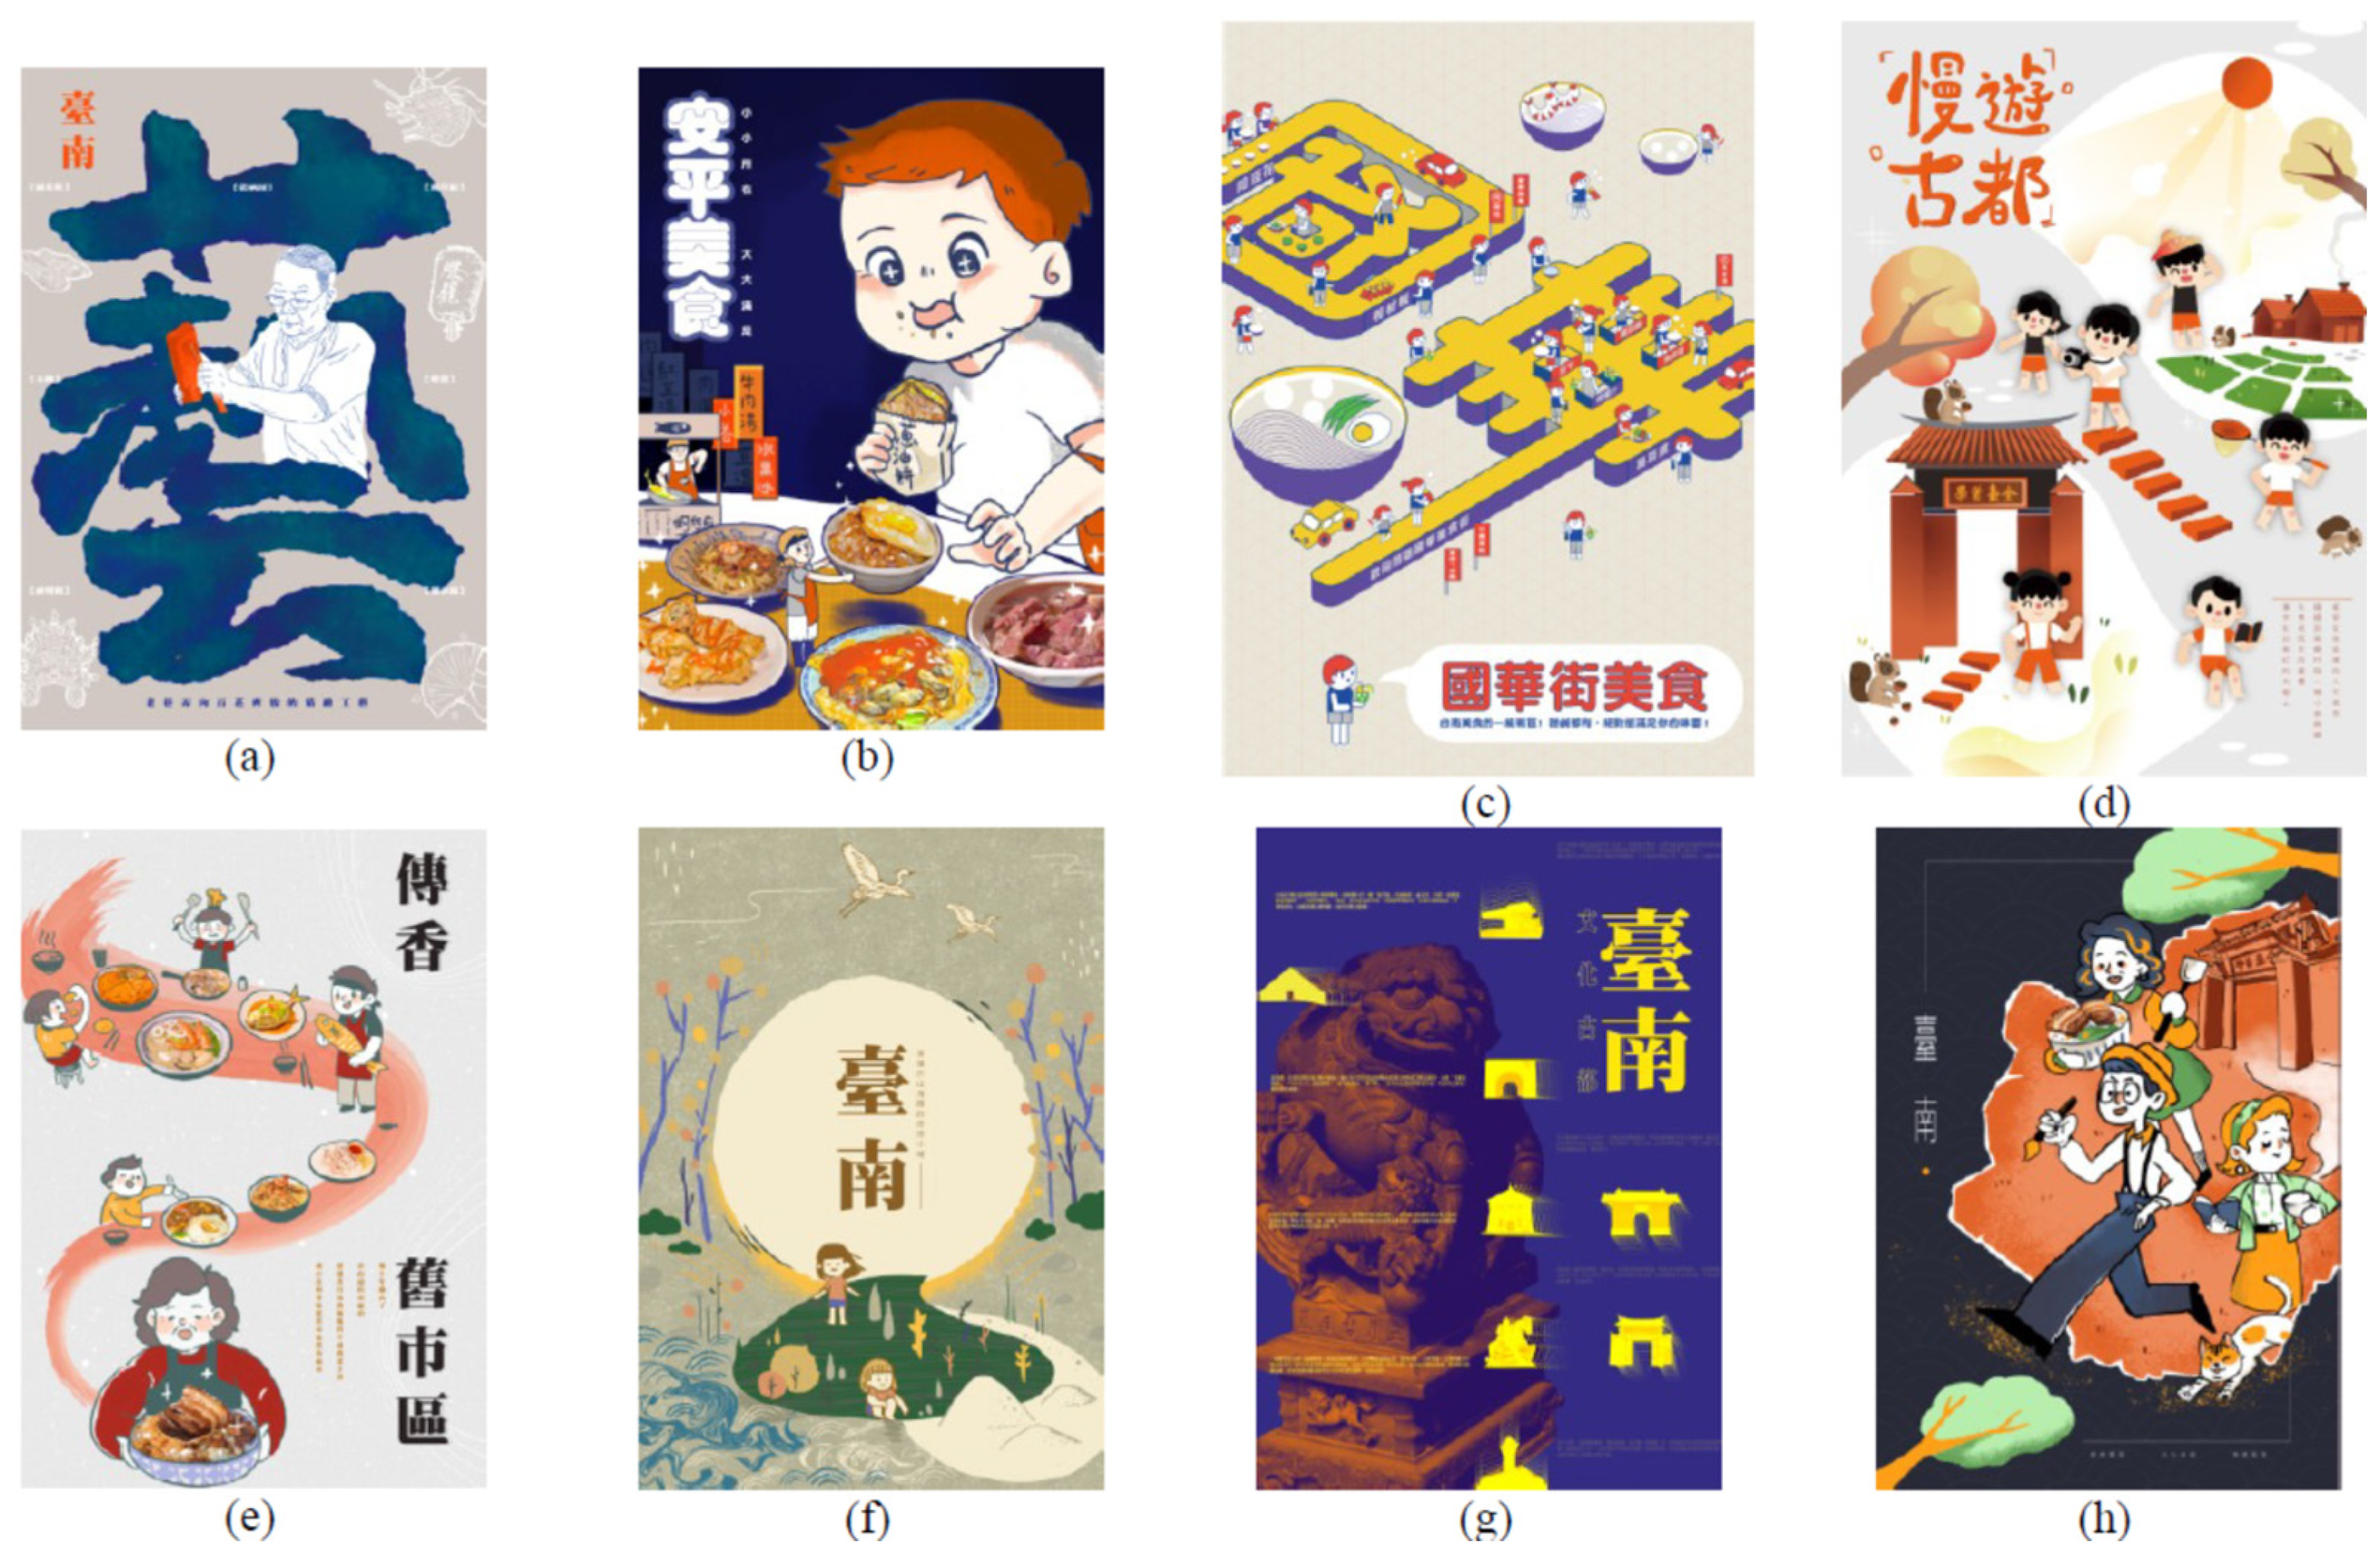
The keywords selected by the designers are shown in Table A3 in Appendix A. The eight advertisements designed by each are shown in Figure 8, Figure 9 and Figure 10. These figures clearly illustrate the design philosophies of the three designers. The student designer used strong thematic composition, clear and concrete visual elements, and intuitively selected topics. The online designer with a practical style mainly used location pictures and representative objects to compose the advertisements, focusing on atmospheric context (mostly serene) with indirect pictorial expressions that required text explanations. The online designer with an artistic style gave priority to the integrity of image composition and emphasized the style of the topic and locally representative objects. The atmospheric context for these designs was based on the selected keywords.
Table 3 and Table 4 show the results of participant responses to the eight advertisements. We determined the preferences of each participant based on their rankings of the texts and keywords. Table 3 shows the results of ranking according to texts, and Table 4 shows the results of ranking according to keywords. The columns represent the designer while the rows represent the personalized advertisements. We measured the percentage of participants that indicated this advertisement would trigger their desire to go to Tainan more than the general one would. Therefore, a higher figure indicates greater success. We selected from among the seven personalized advertisements those which were focused on the top three tourism topics most preferred by each participant. As online users frequently view more than one webpage in a browsing session, and advertisers rarely display the same advertisement on each of the viewed webpages, we tested the effects of displaying one, two, and three advertisements at a time.
The results in Table 4 are better than those in Table 3. This is likely because the designers worked from keywords, not from the contents of the texts, so the preferences of the participants were more directly correlated with the designs. However, it is worth noting that regardless of the designer and how preferences were determined, both tables show that, with a few exceptions, over half the participants were persuaded by the personalized posters designed using the proposed approach.
These results also indicate that the personalized advertisements designed by the student designer were more effective than those designed by the online designers. We believe that this is attributable to the different styles of the designers.
With a set of keywords as a reference in mind, designers were able to exploit their talent in arts and design without roaming through the online or offline networks of information.
We focused on travel in Tainan as the topic in our experiment; in a reflection of popular preferences for travel topics, the designers generally gave priority to intuitive perception, and their topics clearly reflected the scenes and culture in Tainan.
These tables also indicate that regardless of the designer, displaying three advertisements was more effective than displaying just one or two. This may be because our evaluation of participant preferences was not accurate. Thus, displaying three advertisements increases the likelihood that a participant will view one aligned with his/her personal preferences. It also increases the likelihood that a participant will respond to one of the advertisements, as the imagery selected by the designer may not clearly convey the topic to participants, even when it is closely aligned with their preferences. For example, the design in Figure 10a was focused on the keyword “blue print”. The online designer described the design process as follows: “When I saw the keyword ‘blue print’, it reminded me of Japanese architecture and calm. I associated the keyword ‘quiet alley’ with the style of the surrounding buildings, and because of the word ‘quiet’, I wanted the overall color and style to present what the keywords described. I inferred a point (established ideas regarding the topic and tracing my own past experience) from the topic (keyword group)which was my own impression of blueprints. With a blueprint as the foundation and the feeling of quiet, I, therefore, used nighttime scenery.” This selection and its interpretation created an image that was not associated with the joyful perception of travel. It is likely that the gap between the image and the participant’s perception of travel in Tainan negatively impacted the advertisement’s intended function. This shows that the designer’s interpretation has a significant effect, even when the extracted keywords and participant preferences are closely aligned.
Finally, we compared the percentages of success of the same numbers of personalized posters with different rankings of general advertisements. This comparison showed that the percentage of success increased with ranking. This indirectly justifies the core concept of the proposed framework, i.e., the effectiveness of marketing with personalized advertisements.
5. Conclusions
Applications of the IOE have become an area of interest for academics in recent years because this concept effectively combines physical objects, people, processes, and data to aid in optimizing decision making. Unfortunately, most of the studies involving the IOE in recent years have focused on physical objects, with the three other components merely serving as aids. Past studies that applied the IOE only achieved mere extensions of the IOT that ignored the inclusion of people, processes, and data, as the IOE suggests. This research built a system to demonstrate how applying the IOE in design can significantly enhance the efficiency and effectiveness of a design mission.
Looking at the simulation results of this experiment based on the theory of the IOE, we verified that if the four items of “people”, “process”, “things”, and “data” in the IOE framework can be connected in series, it will have a significant impact on the design industry. For example, regarding “people”, because the design team (i.e., people) can directly capture “data” from the “things” specified by the owner through a reasonable “process”, the design team can ensure that the designed product fulfills the needs of the owner. Regarding “process”, because we can achieve a fully automated design process through the IOE framework, the design team (i.e., people) no longer needs to spend extra time learning how to collect “data” from “things”. This will ultimately improve the work speed of the design industry. As for “things” and “data”, these two are traditionally difficult for the design team to grasp and analyze. However, suppose that an information engineer is asked to construct a suitable IOE “process”. In that case, the design team (i.e., people) can avoid the complicated data capture process, verify the rationality of the captured data, quickly integrate data from different sources, and finally, correctly capture information that is helpful for design using the integrated data.
Next, we look from the point of view of practical implications. The example in the current project was posters designed specifically for personalized tourism advertising. The project created the IOE-PDPTA framework, which was customized for this particular purpose. This framework collects data useful to the target design issue through physical objects and external inter-net resources, converts the data into a textual format, analyzes the textual data to identify multiple tourism topics of the target city and associated keywords, and then uses physical objects and external internet resources to verify the spatial rationality of the keywords. We used real-world textual data from an actual city environment and recruited real designers and individuals to aid in verifying the validity of the framework. Designers in the project created designs using the keywords identified by IOE-PDPTA, resulting in more effective communications with the targeted tourists. The results were satisfactory to the designers.
To further advance the application of the IOE, we plan to incorporate more sources of physical objects, people, processes, and data into the target framework based on the concept of the IOE to further enhance the usefulness of the framework for designers. In particular, we plan to add three extensions. In addition to semantics and space, we will consider the time factor. For instance, advertisements published in the spring may mention blooming seasons, while those published in winter might focus on skiing or snow festivals. We also plan to add topic and keyword recommendations as outputs of the framework. In the current analysis, it became obvious that user preferences are diverse. Many tourists are drawn to multiple tourism topics and like each equally. The output of the current framework is limited to single points of interest. Therefore, we aim to extend the proposed framework in this direction. We further plan to add a calibration function for user feedback. That is, each time the framework outputs the results, the models in the framework will be adjusted based on user feedback. The capacity to continually self-adjust will enable the framework to get as close as possible to the design philosophies applied by real-world designers.
Author Contributions
Conceptualization, T.-Y.C.; methodology, T.-Y.C. and Y.-C.C.; software, Y.-C.C.; validation, T.-Y.C. and Y.-C.C.; formal analysis, Y.-C.C.; investigation, T.-Y.C. and Y.-C.C.; resources, T.-Y.C. and Y.-C.C.; data curation, T.-Y.C. and Y.-C.C.; writing—original draft preparation, T.-Y.C. and Y.-C.C.; writing—review and editing, T.-Y.C.; visualization, T.-Y.C. and Y.-C.C.; project administration, T.-Y.C. and Y.-C.C.; funding acquisition, T.-Y.C. All authors have read and agreed to the published version of the manuscript.
Funding
The authors hereby extend sincere thanks to National Science and Technology (NSTC) of the Republic of China (ROC) for their financial support of this research, whose project code is NSTC 109-2622-H-224-005.
Institutional Review Board Statement
Not applicable.
Informed Consent Statement
Not applicable.
Data Availability Statement
The original data of this study are available from the corresponding author upon reasonable request.
Acknowledgments
The authors would like to thank our research team members, who contributed to this study. We are grateful to Chee-Hoe Loh, who assisted with collecting the related statistic data, and Ya-Xhu Xie, Bi-Hua Chen, and Shi-Ping Zeng, who assisted with participating in design creations to this experiments for the study. The authors would like to thank the editor, the assistant editor, and two anonymous referees who reviewed the earlier version of this manuscript and provided valuable suggestions and comments.
Conflicts of Interest
No potential conflict of interest was reported by the authors.
Appendix A

Table A1.
Results of first LDA grouping.
| Group | Keywords |
|---|---|
| 1 | “address”, “photo”, “place”, “art”, “tourism”, “consort”, “like”, “introduction”, “characteristic”, “history”, “feeling”, “style”, “location”, “attract”, “see”, “appreciation”, “style”, “map”, “feel”, “free”, “full”, “beautiful”, “provide”, “appropriate”, “museum”, “operate”, “lovely”, “tourist”, “recommend”, “park”, “enter”, “next”, “subject”, “step in”, “fans group”, “white”, “second stage”, “present”, “friend”, “installation”, “keep”, “current”, “share”, “combine”, “pretty”, “interesting”, “life”, “scene”, “atmosphere”, “travel”, “welcome”, “join”, “walk”, “photo”, “romantic”, “Japanese-style”, “paint”, “house”, “using”, “angle retro”, “first floor”, “display”, “collocation”, “internal”, “inspection”, “a period of”, “walk”, “holiday”, “build” |
| 2 | “accommodation”, “home stay”, “travel”, “recommend”, “snack”, “extension”, “hotel”, “Shen Nong”, “Anping”, “garden”, “museum”, “night market”, “beef soup”, “Chiayi”, “concatenation”, “message”, “Chimei”, “not bad”, “salt pan”, “page”, “Discount”, “tunnel”, “church”, “market”, “Nantou”, “Parent-child”, “changhua”, “immigration”, “Slip slides”, “world”, “share”, “anticipate”, “breakfast”, “Chigu”, “Salt Mountain”, “set”, “pregnant”, “welcome”, “Europe”, “Okinawa” Yunlin”, “Netherlands”, “characteristic”, “experience”, “join”, “missed”, “farm”, “trace”, “cell phone”, “honeymoon” Sugar factory”, “miss”, “place”, “lunch”, “Hong Kong”, “Kerry”, “grow”, “green”, “grocery store”, “white” optimization”, “cabin”, “parenting”, “coffee”, “freedom”, “modify”, “Sicao”, “ lottery”, “at home and abroad”, “Taitung” |
| 3 | “park”, “tourist”, “park”, “ecology”, “green”, “beauty”, “experience”, “travel”, “neighborhood”, “tunnel”, “tourism”, “world”, “suggestion”, “traffic”, “Beautiful”, ““recommend”, “free”, “landscape”, “proceed”, “interchange”, “address”, “route”, “scenery”, “parking”, “leisure”, ““road”, “take”, “Socially verified icons”, “admire”, “Taijiang”, “drive”, “Qigu”, “public”, “guide tour”, “facility”, “scenery”, “Sicao”, “accommodation”, “direction”, “arrival”, “parent-child”, “dock”, “sunset”, “farm”, “Beimen”, “abundant”, “offer”, “forest”, “urban”, “use”, “fast”, “holiday”, “fare”, “regular ticket”, “Salt Mountain”, “choose”, “travel”, “enter”, “spectacular”, “reference”, “sky”, “private”, “platform”, “hot spring”, “map”, “Xinying”, “mode”, “place”, “nature”, “convenient” |
| 4 | “see”, “a bit”, “know”, “feeling”, “compare”, “not bad”, “place”, “stuff”, “look”, “photo”, “side”, “like”, “picture”, “friend”, “pity”, “leave”, “prepare”, “cute”, “happy”, “remember”, “night”, “heard”, “nearby”, “continue”, “return”, “opportunity”, “well”, “delicious”, “going back home”, “find”, “immediate”, “walk”, “before”, “break”, “decide”, “end”, “back”, “small”, “proceed”, “sightseeing” encounter”, “think”, “line up”, “kind of”, “share”, “pretty”, “introduction”, “want”, “door”, “interest”, “consort”, “think”, “recently”, “air-condition”, “morning”, “famous”, “comfortable”, “down”, “a little”, “back”, “suggestion”, “method”, “need”, “children”, “departure”, “thanks”, “hope”, “camera”, “cheap”, “inside |
| 5 | “delicious”, “flavor”, “address”, “operation”, “flavor”, “store”, “recommend”, “fresh”, “good” compare”, “signboard”, “snack”, “like”, “boss”, “choose”, “dining”, “menu”, “beverage”, “breakfast”, “price”, “collocation”, “fruit”, “nearby”, “delicious”, “black tea”, “full”, “feeling”, “business”, “simple”, “beef”, “Guohua”, “old shop”, “soybean pudding”, “see”, “market”, “queue”, “ice cream”, “shrimp”, “pudding”, “seat”, “handmade”, “opposite”, “guest”, “second stage”, “refreshing”, “famous”, “takeaway”, “soup”, “milk”, “cheap”, “rich”, “crispy”, “day of closed”, “a period of”, “rich”, “introduction”, “beef soup”, “food record”, “lunch”, “meet”, “sausage”, “snack”, “red bean”, “night market”, “cake”, “direct”, “next door”, “a second”, “map” |
| 6 | “game”, “children”, “link”, “cute”, “painted”, “happiness”, “work”, “complete”, “extension”, “question”, “punch”, “marriage”, “ North gate”, “challenge”, “perfect”, “animals”, “need”, “love”, “world”, “church”, “process”, “good”, “couple”, “crystal”, “wants”, “factory”, “open”, “white”, “teacher”, “scene”, “free”, “read”, “intimate”, “stories”, “way”, “physical”, “Films”, “art”, “wedding dress”, “processing”, “carry on”, “Changhua”, “welcome”, “caused”, “hope”, “seen”, “Chiayi”, “effect”, “professional”, “increase”, “favorite”, “view”, “Yunlin”, “idol Drama”, “becomes”, “participation”, “get”, “stereoscopic”, “cartoon”, “color”, “body”, “book”, “park”, “select”, “participate”, “shoot”, “ photo”, “learn”, “company”, “knowledge” |
| 7 | “antiquities”, “Anping”, “history”, “castle”, “Tree House”, “North Gate”, “Foreign firm”, “tour”, “castle town”, “tourists”, “out”, “memorial”, “museum”, “Confucius Temple”, “Old Street”, “park”, “former residences”, “Eternal Golden Fort”, “birthday”, “park”, “ancient”, “Chikan Tower”, “milkfish”, “crystal”, “department”, “Koxinga”, “factory”, “Chi Mei”, “Cultural Relic”, “free”, “ Banyan Tree”, “extension”, “traditional”, “church”, “reading”, “Japanese occupation”, “memorial”, “association”, “art”, “present”, “Qigu”, “Yongkang”, “garden”, “western”, “salt pan”, “China”, “Shanhua”, “ice cream”, “temple”, “renovation”, “important”, “themes”, “only exist”, “square”, “painted”, “official residence”, “New Taipei city”, “national”, “exhibit”, “Hai-Shan”, “coffee”, “wedding dress”, “Japanese-style”, “full”, “Diva”, “Tait & Co.”, “early”, “regular ticket”, “Qing Dynasty”, “Tianfu” |
Table A2.
Results of second LDA grouping.
| Group | Keywords |
|---|---|
| 1 | “selling”, “civilization”, “cafe”, “base”, “sun”, “exquisite”, “cottage”, “modern”, “smart”, “luxury”, “sandal”, “artwork”, “blue print”, “graffiti”, “ancient house”, “rainbow”, “style”, “lifelike”, “delicate”, “playful”, “rural”, “cloister”, “simple”, “master”, “eave”, “craft”, “teleplay”, “lively”, “hidden”, “Nikkei”, “aftertaste”, “blue sky”, “white cloud”, “former residence”, “inherit”, “make a wish”, “blistering summer day”, “corridor”, “clever hand”, “blessedness”, “vintage”, “quiet”, “slow”, “shiny green”, “rain”, “color painting”, “foreign”, “wooden house”, “leisure”, “tait”, “hall”, “low key”, “handrail”, “architect”, “coffee”, “tea house”, “maintain”, “repair”, “early”, “sakura”, “cabinet”, “warm”, “lamplight”, “snake”, “big tree”, “monument”, “exploration”, “ceremony”, “nostalgic”, “pool”, “garden” |
| 2 | “scallion cake”, “bean thread”, “Amin”, “hulled rice”, “Red brick wall”, “curry”, “teh tarik”, “retrospective exhibition”, “Si-tsho office”, “wooden”, “flavor”, “Chou’s”, “appetizer”, “bench”, “Nagio”, “Mini version”, “indian”, “lyrics”, “Home-made”, “seafood”, “aerial root”, “kimchi”, “Glacial table”, “ancient house”, “fresh”, “spicy”, “chat”, “pattern”, “eat and drink”, “Lily”, “flavors”, “entertain”, “traditional market”, “river water”, “fresh and tender”, “academy”, “corner”, “canvas”, “pepper”, “counter”, “sweetness level”, “floating”, “kitchen”, “digestion”, “taste good”, “fragrant”, “soybean milk”, “American”, “plump”, “seat”, “Red Bean Soup”, “seawater”, “butter”, “Amazon River”, “Maisonette”, “dishes”, “duck blood”, “sesame oil”, “Dongxing”, “intellectual”, “canteen”, “owner”, “rich”, “black tea”, “drink”, “gold”, “pleasant aftertaste”, “Ba wan”, “Hot pot shop”, “Japanese army”, “clear”, “chicken wing”, “fairyland”, “former residence”, “soy sauce braised foods”, “soy sauce”, “exodermises”, “squid” |
| 3 | “creamy”, “refreshing”, “fatty meat”, “glass noodles”, “Amin”, “curry”, “Call number”, “delicious”, “close up”, “late night supper”, “wash”, “Vanilla”, “Chou’s”, “appetizer”, “Nagio”, “Shoulder pole”, “deep blue”, “Tasting”, “tour”, “kimchi”, “seafood”, “order”, “home-made”, “greedy”, “Rice flour”, “brother”, “juice”, “hot and sour”, “Ton-gji”, “signboard”, “Kangxi”, “Lily”, “platter”, “entertain”, “dig in”, “hot meal”, “green beans”, “delicious”, “grandma”, “pepper”, “mayor”, “pig’s head”, “sweetness level”, “rice cake”, “kitchen”, “moon Shadow”, “baking”, “taste good”, “pork”, “pork”, “kind”, “sweet”, “dessert”, “Osmanthus”, “tofu”, “Guohua”, “Tiangong”, “flat food”, “chicken rise”, “dishes”, “swordfish”, “hard bean curd”, “sesame oil”, “stinky tofu”, “Dongxing”, “fish soup”, “owner”, “fish maw”, “lemon juice”, “black tea” |
| 4 | “creamy”, “refreshing”, “mellow”, “fatty meat”, “glass noodles”, “Amin”, “curry”, “delicious”, “ late night supper”, “vanilla”, “early adopters”, “flavor”, “Zhou’s”, “appetizer”, “originate”, “section third”, “Sauerkraut”, “fragrant”, “peanut butter”, “side dish”, “order dishes”, “Achuan”, “honey”, “Kimchi”, “seafood”, “order”, “Rice flour”, “fishbone”, “ham”, “juice”, “granule”, “slice”, “ask a price”, “spices”, “platter”, “meticulous”, “both full”, “vegetables”, “full”, “market”, “Bar”, “fresh and tender”, “crispy”, “green bean”, “pepper”, “Grandma”, “fish thick soup”, “micro”, “sweetness level”, “rice cake”, “floating”, “sold out”, “digestion”, “braised egg”, “pork”, “salinity”, “fragrant”, “seductive”, “sweet”, “closed”, “Coffin bread”, “radish”, “butter”, “dish”, “gravy”, “sesame oil”, “steamed”, “stinky tofu”, “fish soup”, “canteen” fish maw”, “fairy grass”, “lemon juice”, “Shi Jing”, “fat”, “tabasco”, “materials”, “peanuts”, “pork liver”, “meat ball” |
| 5 | “pigeon”, “youngster”, “fluorescent”, “arcade”, “closed”, “wedding photo”, “Dachan”, “heartwarming”, “chase”, “creatures Gongyuan Rd.”, “North gate”, “abundant”, “artwork”, “vast”, “sperm “whale”, “brick building”, “recreation”, “collection of books”, “lecture hall”, “graffiti”, “beer”, “avenue”, “hinterland”, “blanket”, “hide”, “taxi”, “natural history”, “countryside”, “Japanese”, “citizen”, “cloister”, “public”, “dessert”, “quiet”, “riverside”, “specimen”, “elementary school”, “squirrel”, “Mediterranean”, “farmhouse”, “Showa”, “outdoor”, “Zhongzheng”, “youngster”, “exhibition”, “inherited”, “wish”, “dressing”, “almond tea”, “museum”, “retro”, “quiet”, “countryside”, “painted”, “boutique”, “light”, “metamorphosis”, “skewers”, “Japanese occupation”, “vintage”, “coastal”, “Confucius”, “Lioujia”, “drink tea”, “Governor”, “Koxinga”, “official residence”, “vehicle”, “early” |
| 6 | “witness”, “chessboard”, “condescending”, “nature”, “three-section compound”, “campus”, “forest”, “lingering charm”, “visit”, “temple”, “sperm whale”, “blissful”, “Guantian”, “farmland”, “amusement park”, “heron”, “cabbage”, “recreation”, “salt manufacturing”, “bosky”, “volcano”, “avenue”, “sunshade”, “dense”, “sunset”, “lights”, “plank road”, “alley”, “saltwork”, “Wusantou”, “joss”, “saltwater”, “serenity”, “Japanese”, “pray”, “singer”, “solemn”, “rustic”, “earth”, “crystallization”, “sea water”, “Christmas”, “solar salt”, “reflection”, “Guiren”, “Showa”, “Zuozhen”, “japanese occupation”, “washing”, “sugar manufacturing”, “Japanese army”, “original”, “snacks”, “sakae”, “dowry”, “scenic area”, “abandoned”, “coastal”, “childhood”, “roof tile”, “Taiwanese Hokkien”, “reservoir”, “tile”, “Alishan”, “evening”, “talismanic”, “playground”, “Liujia”, “watchtower”, “salt industry” |
| 7 | “old temple”, “officer”, “Liuhe”, “fundraising”, “high-ranking officers”, “three-section compound”, “magazine”, “Dacheng”, “Yanagiya”, “relief”, “campus”, “demolition”, “moat”, “originate”, “Qianlong in Qing dynasty”, “deposit”, “brick-making”, “palatial”, “Guandi temple”, “Yongli”, “board”, “navy”, “royal”, “worship”, “Kangxi”, “manner”, “tablet”, “city gate tower”, “magistrate”, “guard”, “guardian”, “seat of honour”, “ancient city”, “stone lion”, “academy”, “landing”, “stone turtle”, “joss”, “emperor”, “defense”, “spring and autumn”, “ambulatory”, “porch”, “event”, “spread”, “culture and education”, “solemn”, “pilgrim”, “ancestor”, “rebar”, “craft”, “history”, “Showa”, “official”, “Xiaodongmen”, “Japanese occupation”, “historic”, “quaint”, “dome”, “trace”, “Japanese army”, “Lin Shuangwen”, “original”, “old temple”, “gateway”, “vicissitudes”, “Buddhist monastery”, “gods”, “Qing Dynasty”, “mansion” |
Table A3.
Keywords selected by designers for each travel topic.
| Designer | Topics | Keywords |
|---|---|---|
| Student Designer | Old streets and alleys | “civilization”, “blue print”, “master”, “craft”, “light hand”, “low profile”, “adventure” |
| Anping food | “scallion pie”, “seafood”, ““eat and drink”, “serving”, “fragrant”, “fertile”, “landlady” | |
| Guohua Street food | “mung bean noodles”, “appetizer”, “Tong-Ji”, “hot food”, “delicious”, “Guohua”, “stinky tofu” | |
| Old City Food | “fatty meat”, “smell”, “seafood”, “plate”, “grandma”, “fragrant”, “dishes” | |
| Village and museum | “chase”, “recreation”, “avenues”, “squirrel”, “farmer”, “ light and shadow”, “Confucius” | |
| Coastal and rural | “forest”, “heron”, “sunset”, “serenity”, “silhouette”, “coastal”, “salt industry” | |
| Historic landmark | “magazine”, “moat”, “Kangxi”, “stone lion”, “events”, “ Japanese occupation”, “Japanese army” | |
| Population poster | “modern”, “red brick”, “young”, “fatty meat”, “nature”, “visit”, “old temple” | |
| Online Designer (Practical) | Old streets and alleys | “sell”, “ancient house”, “craft”, “cloud”, “quiet”, “teahouse”, “nostomania” |
| Anping food | “A Ming”, “Zhou’s”, “Yueying”, “Lily”, “floating”, “sesame oil”, “meatball” | |
| Guohua street food | “delicious”, “squid”, “juice”, “delicious”, “rice cake”, “turkey rice”, “stinky tofu” | |
| Old City food | “vanilla”, “peanut butter”, “seafood”, “vegetables”, “mung bean”, “pork”, “deep-fried sandwich” | |
| Village and museum | “wedding photo”, “artwork”, “taxi”, “citizen”, “farmer”, “museum”, “vintage” | |
| Coastal and rural | “temple”, “heron”, “saltwork”, “rustic”, “sugar manufacturing”, “coast”, “salt industry” | |
| Historic landmark | “old temple”, “brick-making”, “worship”, “stone lion”, “pilgrim”, “craft”, “gods” | |
| Population poster | “coffee shop”, “retrospective exhibition”, “close-up”, “pigeon”, “forest”, “Liuhe” | |
| Online Designer (Artistic) | Old streets and alleys | “cabin”, “blue print”, “ancient house”, “ Japanese occupation”, “blue sky and white cloud”, “wooden house”, “railing” |
| Anping food | “scallion pie”, “appetizer”, “spicy”, “flavor”, “sugariness”, “duck blood”, “aftertaste” | |
| Guohua street food | “fatty meat”, “rice noodles”, “signboard”, “rice cake”, “Guohua”, “swordfish”, “lemon juice” | |
| Old City food | “side dishes”, “order dishes”, “seafood”, “fishbone”, “braised egg”, “deep-fried sandwich”, “canteen” | |
| Village and museum | “pigeon”, “artwork”, “brick-making”, “museum”, “natural history”, “squirrel”, “outdoor” | |
| Coastal and rural | “temple”, “farmland”, “heron”, “sunset”, “saltwork”, “seawater”, “watchtower” | |
| Historic landmark | “moat”, “brick-making”, “city gate tower”, “stone lion”, “academy”, “stone turtle”, “pilgrim” | |
| Population poster | “coffee shop”, “scallion pie”, “delicious”, “young”, “tasty”, “checkerboard”, “temple” |
References
- Gupta, N.; Khosravy, M.; Patel, N.; Dey, N.; Gupta, S.; Darbari, H.; Crespo, R.G. Economic data analytic AI technique on IoT edge devices for health monitoring of agriculture machines. Appl. Intell. 2020, 50, 3990–4016. [Google Scholar] [CrossRef]
- Wu, J.M.T.; Li, Z.; Srivastava, G.; Yun, U.; Lin, J.C.W. Analytics of high average-utility patterns in the industrial internet of things. Appl. Intell. 2021, 52, 6450–6463. [Google Scholar] [CrossRef]
- Kamilaris, A.; Ostermann, F.O. Geospatial analysis and the internet of things. ISPRS Int. J. Geo-Inf. 2018, 7, 269. [Google Scholar] [CrossRef]
- Dhiman, G.; Nagar, A.K.; Vimal, S.; Rho, S. Guest Editorial: Cybertwin-Driven 6G for Internet of Everything: Architectures, Challenges, and Industrial Applications. IEEE Trans. Ind. Inform. 2022, 18, 4846–4849. [Google Scholar] [CrossRef]
- Mohanty, S.P.; Yanambaka, V.P.; Kougianos, E.; Puthal, D. PUFchain: A Hardware-Assisted Blockchain for Sustainable Simultaneous Device and Data Security in the Internet of Everything (IoE). IEEE Consum. Electron. Mag. 2020, 9, 8–16. [Google Scholar] [CrossRef]
- Nozari, H.; Szmelter-Jarosz, A.; Ghahremani-Nahr, J. The Ideas of Sustainable and Green Marketing Based on the Internet of Everything—The Case of the Dairy Industry. Futur. Internet 2021, 13, 266. [Google Scholar] [CrossRef]
- Mohapatra, H.; Rath, A.K. IoE based framework for smart agriculture. J. Ambient. Intell. Humaniz. Comput. 2022, 13, 407–424. [Google Scholar] [CrossRef]
- Miraz, M.H.; Ali, M.; Excell, P.S.; Picking, R. A Review on Internet of Things (IoT), Internet of Everything (IoE) and Internet of Nano Things (IoNT). In Proceedings of the 2015 Internet Technologies and Applications (ITA), Wrexham, UK, 8–11 September 2015; pp. 219–224. [Google Scholar]
- Thakur, N.; Han, C.Y. A study of fall detection in assisted living: Identifying and improving the optimal machine learning method. J. Sens. Actuator Netw. 2021, 10, 39. [Google Scholar] [CrossRef]
- Matijevich, E.S.; Volgyesi, P.; Zelik, K.E. A promising wearable solution for the practical and accurate monitoring of low back loading in manual material handling. Sensors 2021, 21, 340. [Google Scholar] [CrossRef]
- Sharma, N.; Chakraborty, A.K. Implementation of dynamic controls for grid-tied-inverters through next-generation smart meters and its application in modernized grid. Energies 2022, 15, 988. [Google Scholar] [CrossRef]
- Abbasi, A.; Sarker, S.; Chiang, R.H.L. Big Data Research in Information Systems: Toward an Inclusive Research Agenda. J. Assoc. Inf. Syst. 2016, 17, 2. [Google Scholar] [CrossRef]
- Shih, Y.C.; Chi, C.F.; Lin, R.F.; Lin, R.T. Past highlights and future of human factors and design thinking in Taiwan. J. Manag. Syst. 2018, 25, 321–365. [Google Scholar]
- Joyce, A. Inclusive design. Nielsen Norman Group. Available online: https://www.nngroup.com/articles/inclusive-design/ (accessed on 30 January 2022).
- Horozov, T.; Narasimhan, N.; Vasudevan, V. Using Location for Personalized POI Recommendations in Mobile Environments. In Proceedings of the International Symposium on Applications on Internet, Phoenix, AZ, USA, 23–27 January 2006; pp. 124–129. [Google Scholar]
- Chiang, H.-S.; Huang, T.-C. User-adapted travel planning system for personalized schedule recommendation. Inf. Fusion 2015, 21, 3–17. [Google Scholar] [CrossRef]
- Lu, E.H.-C.; Chen, C.-Y.; Tseng, V.S. Personalized Trip Recommendation with Multiple Constraints by Mining User Check-in Behaviors. In Proceedings of the 20th ACM SIGSPATIAL International Conference on Advances in Geographic Information Systems, Redondo Beach, CA, USA, 6–9 November 2012; pp. 209–218. [Google Scholar]
- Ye, M.; Yin, P.; Lee, W.-C. Location Recommendation for Location-Based Social Networks. In Proceedings of the Advances in Geographic Information Systems, San Jose, CA, USA, 2–5 November 2010; pp. 458–461. [Google Scholar]
- Ying, J.J.C.; Lu, E.H.C.; Kuo, W.N.; Tseng, V.S. Urban Point-of-Interset Recommendation by Mining User Check-in Behaviors. In Proceedings of the UrbComp ’12: The ACM SIGKDD International Workshop on Urban Computing, Beijing, China, 12 August 2012; pp. 55–62. [Google Scholar]
- Kim, J.; Kim, H.; Ryu, J.-h. Trip Tip: A Trip Planning Service with Tag-Based Recommendation. In Proceedings of the Conference on Human Factors in Computing Systems, Boston, MA, USA, 4–9 April 2009; pp. 3467–3472. [Google Scholar]
- Zhang, Z.; Morimoto, Y. Collaborative Hotel Recommendation Based on Topic and Sentiment of Review Comments. In Proceedings of the Forum for Information and Engineering, Gifu, Japan, 6–8 March 2017. [Google Scholar]
- Zheng, V.W.; Zheng, Y.; Xie, X.; Yang, Q. Collaborative Location and Activity Recommendations with GPS History Data. In Proceedings of the Internet Conference on World Wide Web, Raleigh, NC, USA, 26–30 April 2010; pp. 1029–1038. [Google Scholar]
- Huang, C.; Wang, Q.; Yang, D.; Xu, F. Topic Mining of Tourist Attractions Based on a Seasonal Context Aware LDA Model. Intell. Data Anal. 2018, 22, 383–405. [Google Scholar] [CrossRef]
- Liu, Y.; Ester, M.; Hu, B.; Cheung, D.W. Spatio-Temporal Topic Models for Check-in Data. In Proceedings of the IEEE International Conference on Data Mining, Atlantic City, NJ, USA, 14–17 November 2015; pp. 889–894. [Google Scholar]
- Park, S.-T.; Liu, C. A study on topic models using LDA and Word2Vec in travel route recommendation: Focus on convergence travel and tours reviews. Pers. Ubiquitous Comput. 2020, 26, 429–445. [Google Scholar] [CrossRef]
- Shafqat, W.; Byun, Y.C. A Recommendation Mechanism for Under-Emphasized Tourist Spots Using Topic Modeling and Sentiment Analysis. Sustainability 2020, 12, 320. [Google Scholar] [CrossRef]
- Amatriain, X.; Lathia, N.; Pujol, J.M.; Kwak, H.; Oliver, N. The Wisdom of the Few A Collaborative Filtering Approach Based on Expert Opinions from the Web. In Proceedings of the SIGSIR, Boston, MA, USA, 19–23 July 2009. [Google Scholar]
- Lee, C.-S.; Chang, Y.-C.; Wang, M.-H. Ontological recommendation multi-agent for Tainan City travel. Expert Syst. Appl. 2009, 36, 6704–6753. [Google Scholar] [CrossRef]
- Zheng, Y.; Xie, X. Learning travel recommendations from user-generated GPS traces. ACM Trans. Intell. Syst. Technol. 2011, 2, 1–29. [Google Scholar] [CrossRef]
- Yoon, H.; Zheng, Y.; Xie, X.; Woo, W. Smart Itinerary Recommendation Based on User-Generated GPS Trajectories. In Proceedings of the University of Illinois at Chicago, Xi’an, China, 26–29 October 2010; pp. 19–34. [Google Scholar]
- Dang, S.; Golden, A.G.; Cheung, H.S.; Roos, B.A. Telemedicine Applications in Geriatrics. In Brocklehurst’s Textbook of Geriatric Medicine and Gerontology; Elsevier: Amsterdam, The Netherlands, 2010. [Google Scholar]
- Nitschke, M.; Krackowizer, A.; Hansen, A.L.; Bi, P.; Tucker, G.R. Heat health messages: A randomized controlled trial of a preventative messages tool in the older population of South Australia. Int. J. Environ. Res. Public Health 2017, 14, 992. [Google Scholar] [CrossRef]
- Holloway, J.C. Marketing for Tourism; Pearson Education Ltd.: Harlow, UK, 2004. [Google Scholar]
- Magyar, C.E. The Discourse of Tourism and National Heritage: A Constrastive Study from a Cultural Perspective. Ph.D. Thesis, Autonomous University of Madrid, Madrid, Spain, 2014. [Google Scholar]
- Morgan, N.; Pritchard, A. Advertising in Tourism and Leisure; Butterworth-Heinemann: Oxford, UK, 2000. [Google Scholar]
- White, K.S. Effective Poster Design. In Undergraduate Honors Capstone Projects; Utah State University: Logan, UT, USA, 2012; Volume 116. [Google Scholar]
- Kalyani, V.L.; Sharma, D. IoT: Machine to machine (M2M), device to device (D2D) internet of everything (IoE) and human to human (H2H): Future of communication. J. Manag. Eng. Inf. Technol 2015, 2, 17–23. [Google Scholar]
- Shilpa, A.; Muneeswaran, V.; Rathinam, D.D.K.; Santhiya, G.A.; Sherin, J. Exploring the Benefits of Sensors in Internet of Everything (IoE). In Proceedings of the 2019 5th International Conference on Advanced Computing & Communication Systems (ICACCS), Coimbatore, India, 15–16 March 2019; pp. 510–514. [Google Scholar]
- Srinivasan, C.; Rajesh, B.; Saikalyan, P.; Premsagar, K.; Yadav, E.S. A review on the different types of Internet of Things (IoT). J. Adv. Res. Dyn. Control Syst. 2019, 11, 154–158. [Google Scholar]
- Ma, W.-Y.; Chen, K.-J. Introduction to CKIP Chinese Word Segmentation System for the First International Chinese Word Segmentation Bakeoff. In Proceedings of the SIGHAN Workshop on Chinese Language Processing, Sapporo, Japan, 11–12 July 2003; pp. 168–171. [Google Scholar]
- Lu, R.-S.; Tsao, H.-Y.; Lin, H.-C.K.; Ma, Y.-C.; Chuang, C.-T. Sentiment analysis of brand personality positioning through text mining. J. Inf. Technol. Res. 2019, 12, 93–103. [Google Scholar] [CrossRef]
- Wu, T.-T.; Wu, Y.-T. Applying project-based learning and SCAMPER teaching strategies in engineering education to explore the influence of creativity on cognition, personal motivation, and personality traits. Think. Ski. Creat. 2020, 35, 100631. [Google Scholar] [CrossRef]
- Lye, A.; Cicirello, A.; Patelli, E. An efficient and robust sampler for Bayesian inference: Transitional Ensemble Markov Chain Monte Carlo. Mech. Syst. Signal Process. 2022, 167, 108471. [Google Scholar] [CrossRef]
- Ma, D.; Gao, J.; Zhang, Z.; Zhao, H. Identifying atmospheric pollutant sources using a machine learning dispersion model and Markov chain Monte Carlo methods. Stoch. Environ. Res. Risk Assess. 2021, 35, 271–286. [Google Scholar] [CrossRef]
- Mongwe, W.T.; Mbuvha, R.; Marwala, T. Locally Scaled and Stochastic Volatility Metropolis–Hastings Algorithms. Algorithms 2021, 14, 351. [Google Scholar] [CrossRef]
- Miao, N.; Zhou, H.; Mou, L.; Yan, R.; Li, L. Cgmh: Constrained Sentence Generation by Metropolis-Hastings Sampling. In Proceedings of the AAAI Conference on Artificial Intelligence, Honolulu, HI, USA, 29–31 January 2019; pp. 6834–6842. [Google Scholar]
- Griffiths, T.L.; Steyvers, M. Finding Scientific Topics. Proc. Natl. Acad. Sci. USA 2004, 101, 5228–5235. [Google Scholar] [CrossRef]
- Godin, F.; Slavkovikj, V.; De Neve, W.; Schrauwen, B.; Van de Walle, R. Using Topic Models for Twitter Hashtag Recommendation. In Proceedings of the Interner Conference World Wide Web, Rio de Janeiro, Brazil, 13–17 May 2013; pp. 593–896. [Google Scholar]
- Porteous, I.; Newman, D.; Ihler, A.; Asuncion, A.; Smyth, P.; Welling, M. Fast Collapsed Gibbs Sampling for Latent Dirichlet Allocation. In Proceedings of the ACM Internet Conference Knowledge Discovery and Data Mining, Las Vegas, NV, USA, 24-27 August 2008; pp. 569–577. [Google Scholar]
- Vosecky, J.; Jiang, D.; Leung, K.W.-T.; Ng, W. Dynamic Multi-Faceted Topic Discovery in Twitter. In Proceedings of the ACM Internet Conference on Information & Knowledge Management, San Francisco, CA, USA, 27 October–1 November 2013; pp. 879–884. [Google Scholar]
- Ester, M.; Kriegel, H.-P.; Sander, J.; Xu, X. A Density-Based Algorithm for Discovering Clusters in Large Spatial Databases with Noise. In Proceedings of the Internet Conference on Knowledge Discovery and Data Mining, Portland, OR, USA, 2–4 August 1996; pp. 226–231. [Google Scholar]
- PIXNET. Available online: https://www.pixnet.net/ (accessed on 9 June 2021).
- The Numbers of Tourists Visiting Each Attraction in Tainan City. Available online: https://admin.twtainan.net/zh-tw/touriststatistics?category=%E9%81%8A%E5%AE%A2%E7%B5%B1%E8%A8%88 (accessed on 9 February 2022). (In Chinese).
- CKIP CoreNLP Toolkits. Available online: https://github.com/ckiplab/ckipnlp (accessed on 9 June 2021).
- Topic Modeling with Latent Dirichlet Allocation. Available online: https://pypi.org/project/lda/#history (accessed on 9 June 2021).
- Github: Scikit-Learn-Contrib/Hdbscan. Available online: https://github.com/scikit-learn-contrib/hdbscan (accessed on 9 June 2021).
- CHIMEI MUSEUM. Available online: https://www.chimeimuseum.org/ml/English/3 (accessed on 9 June 2021).
Figure 1.
The proposed IOE structure of this work.
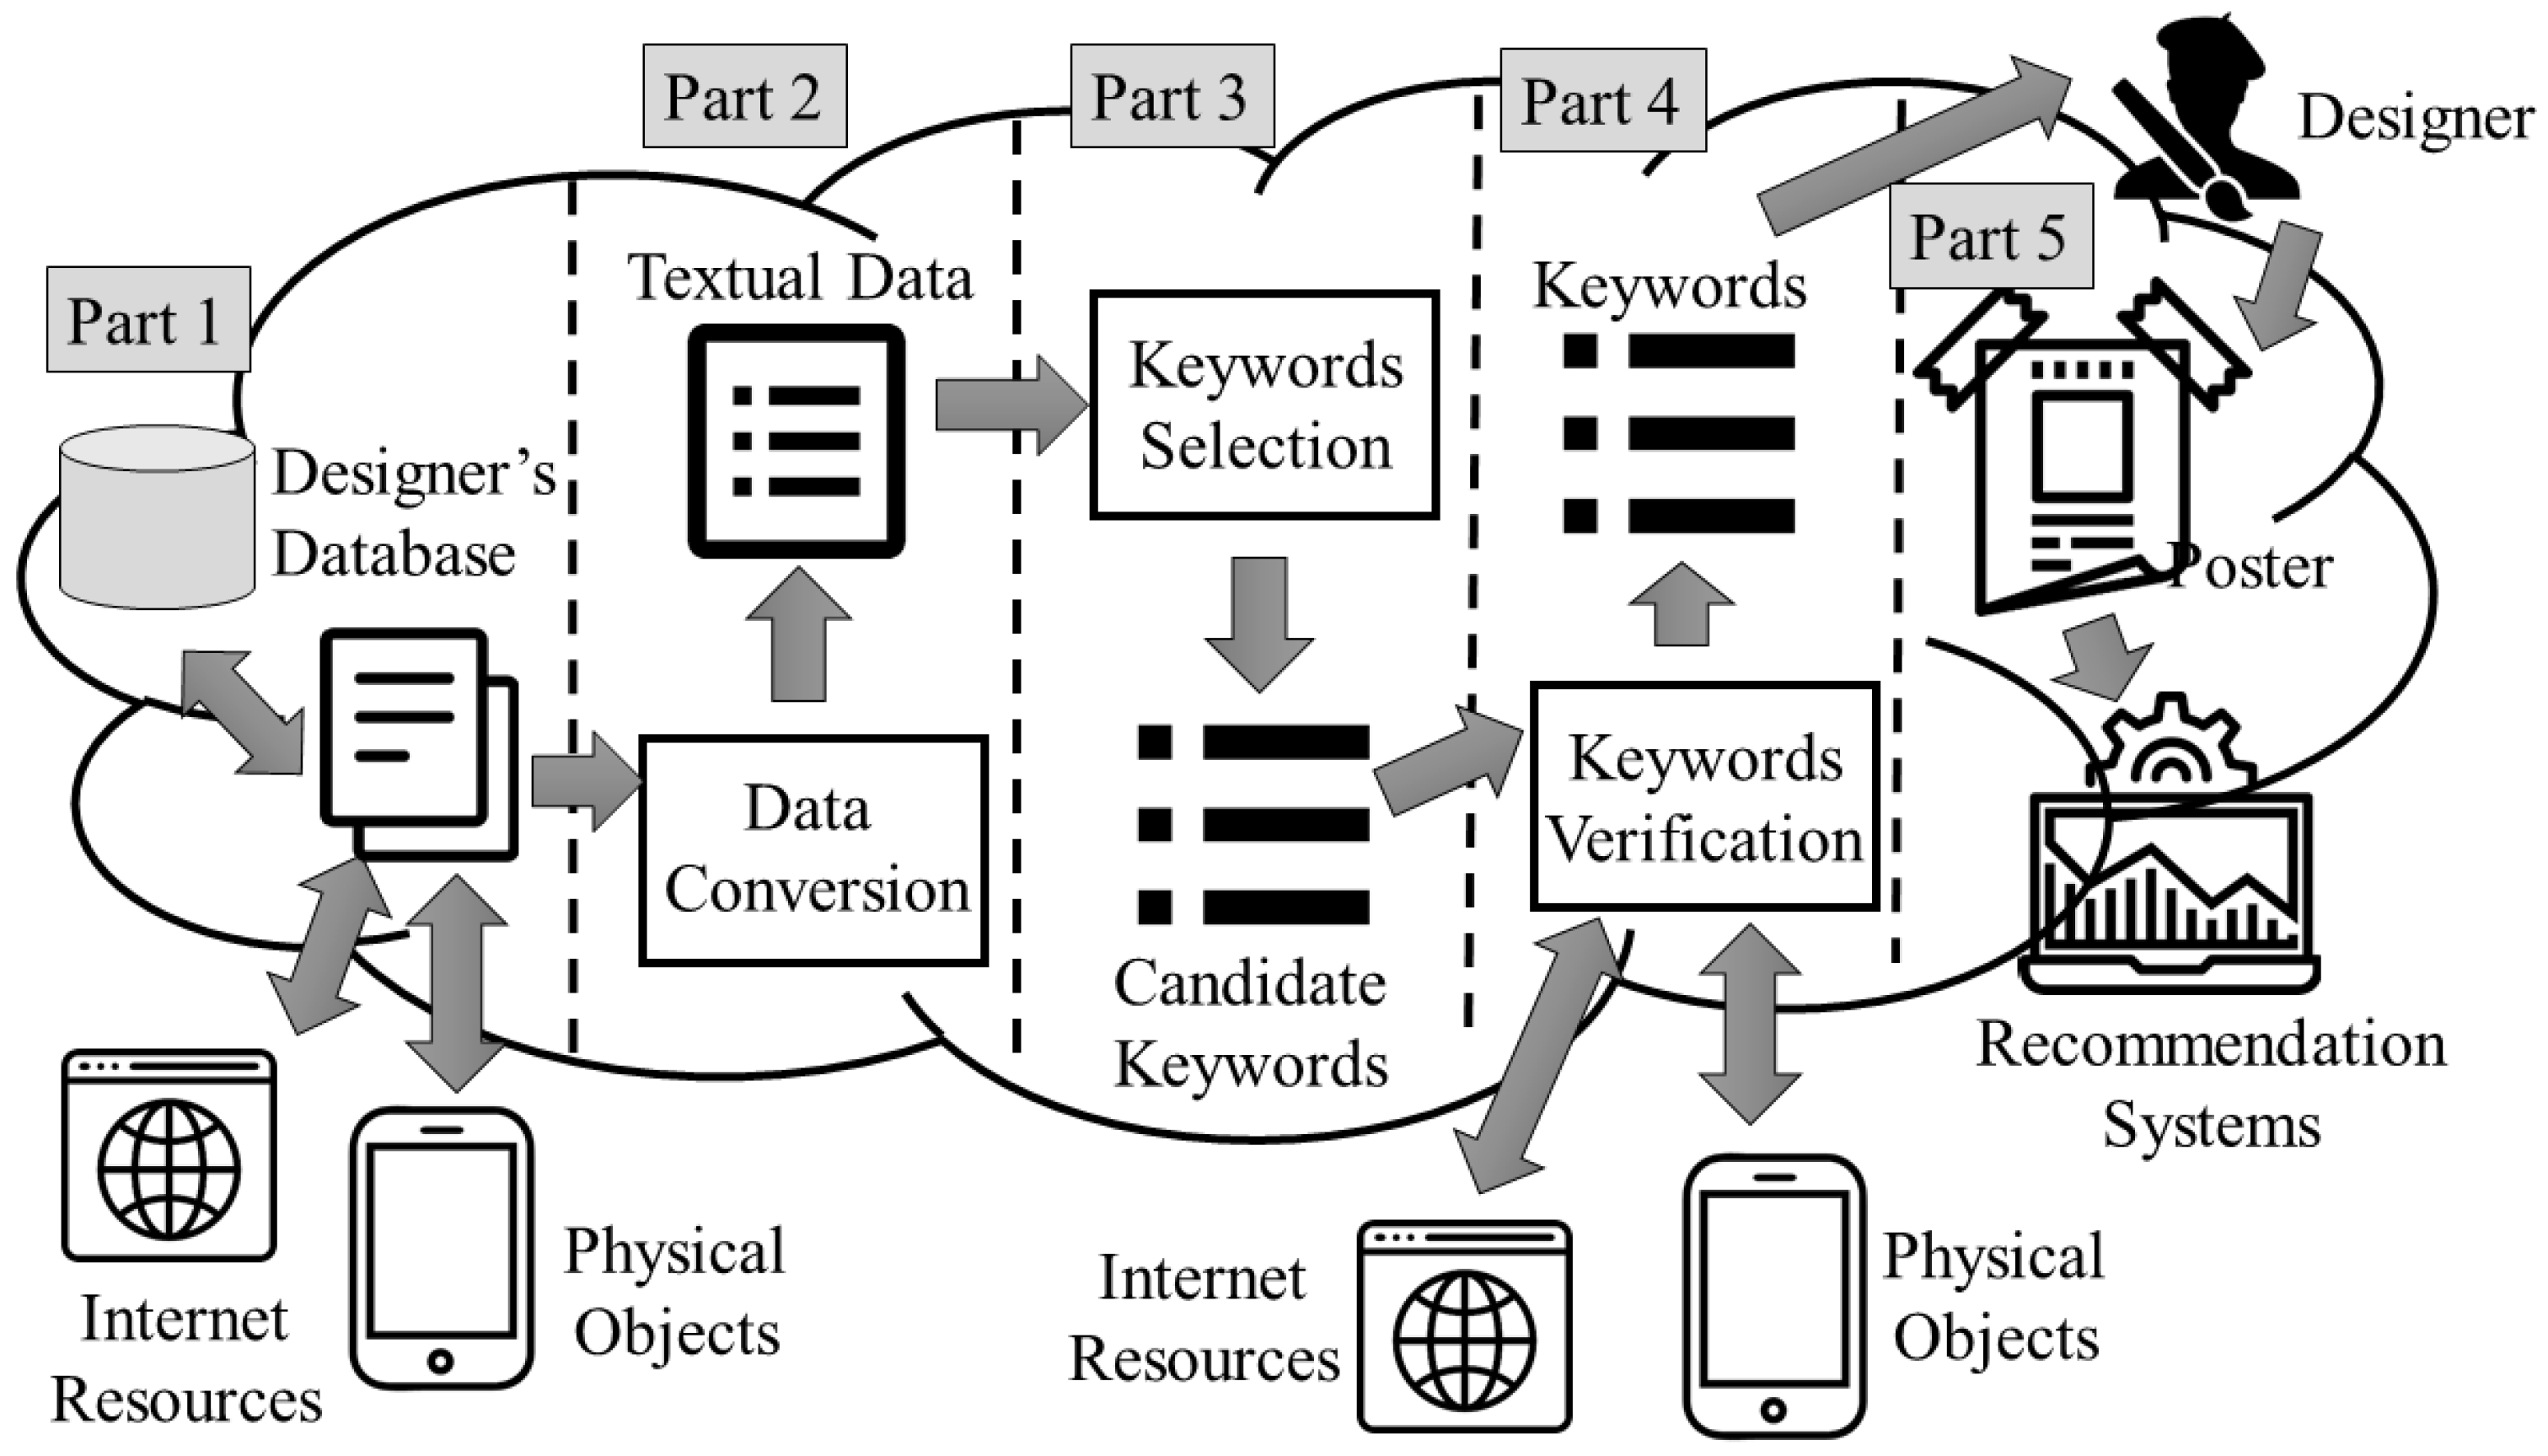
Figure 2.
The operating procedure of IOE-PDPTA.

Figure 3.
The destination classification tree used in this work.
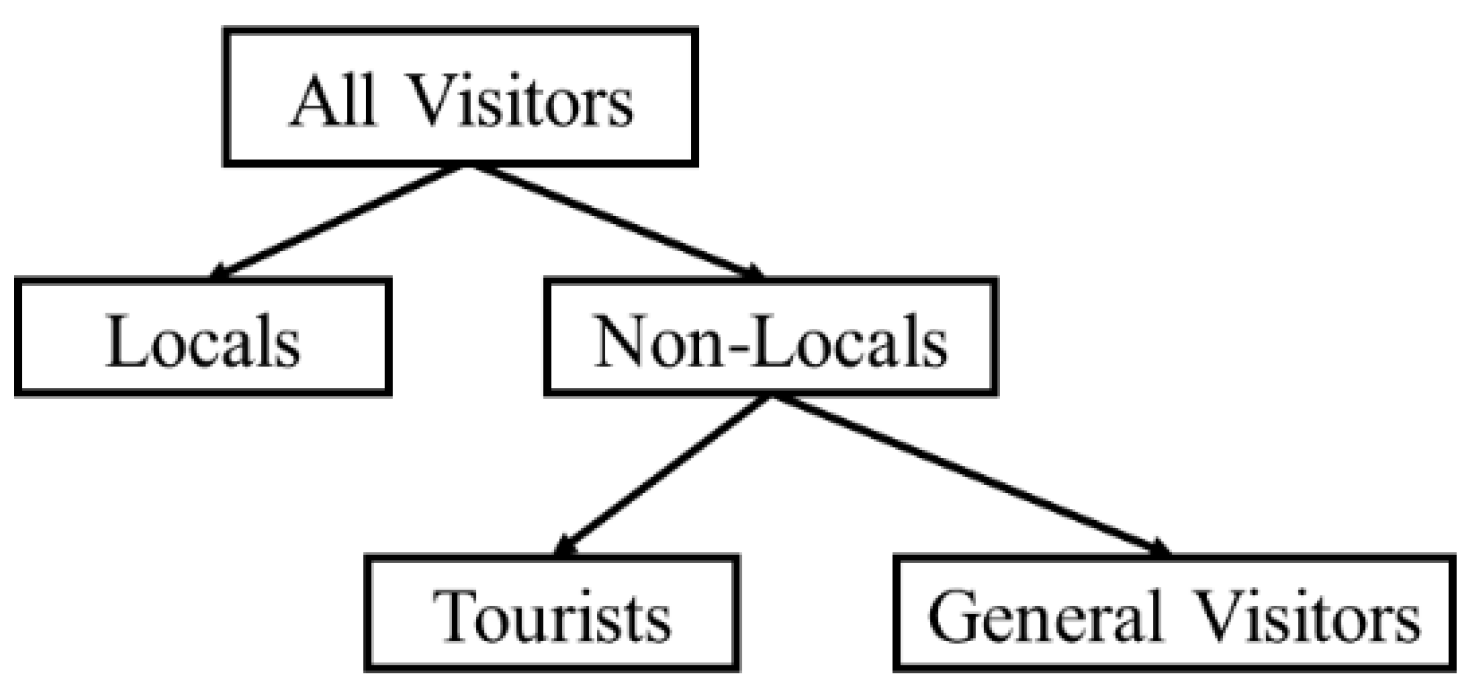
Figure 4.
The silhouette coefficients with a different number of topics in the first LDA analyses.
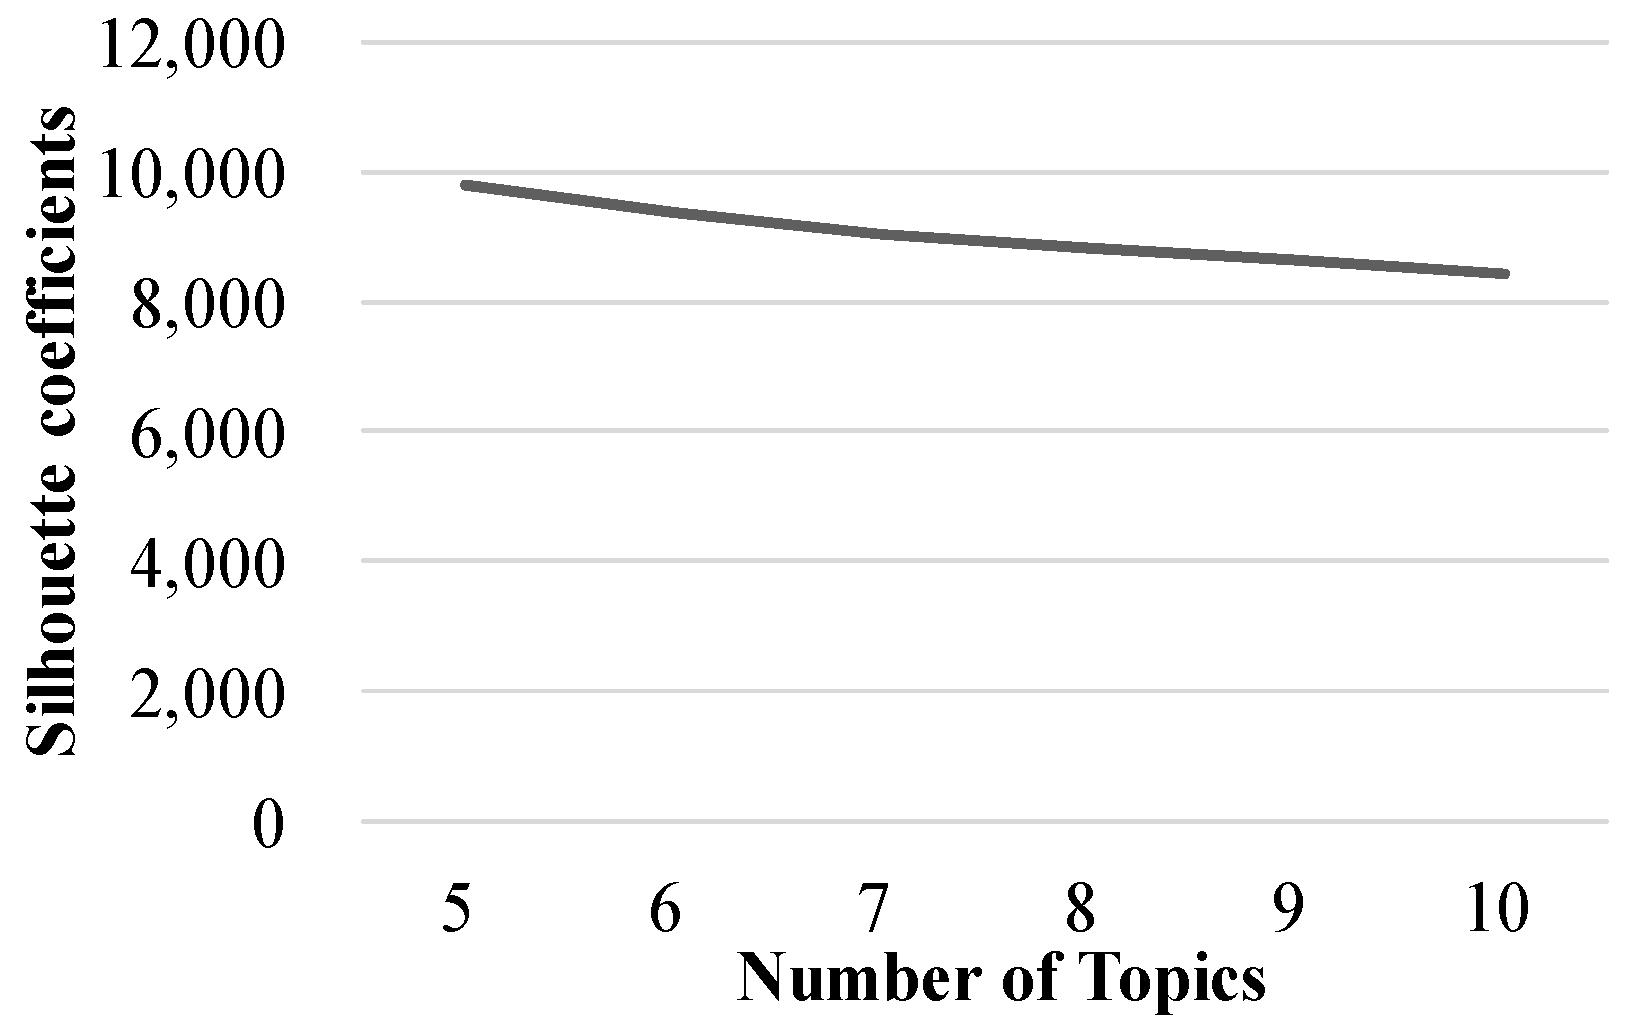
Figure 5.
The silhouette coefficients with a different number of topics in the second LDA analyses.
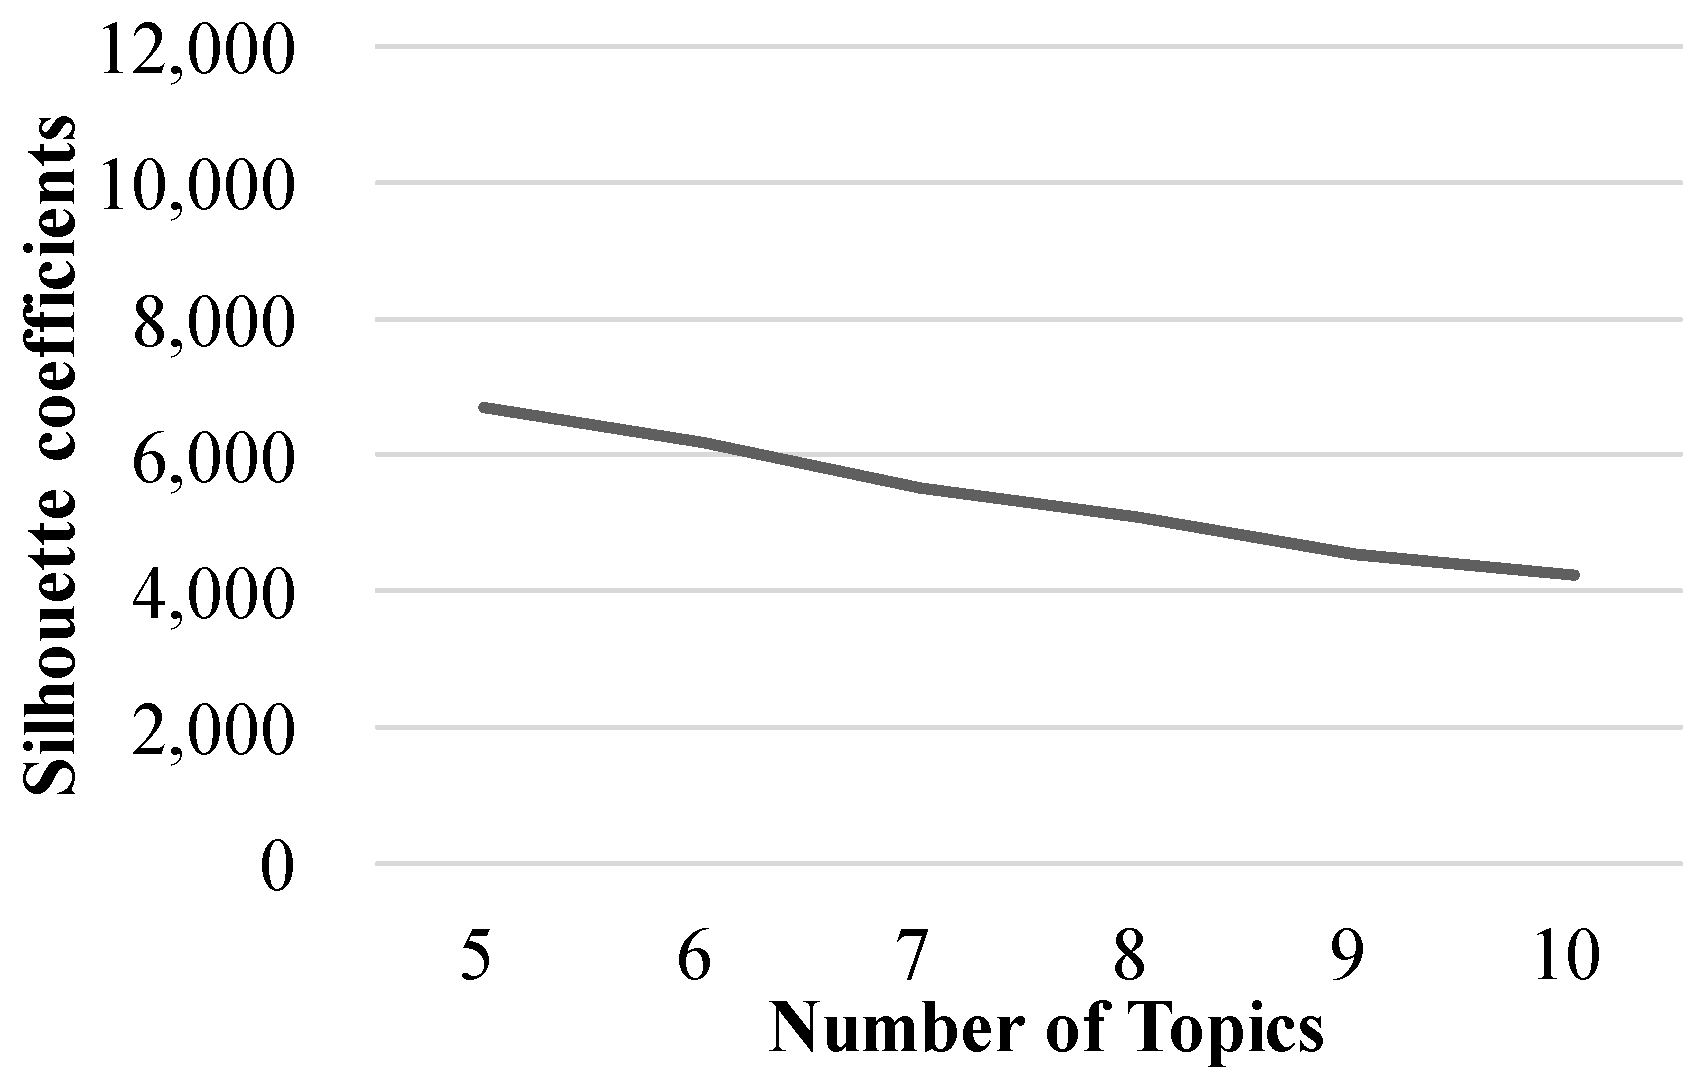
Figure 6.
Conditions before DBSCAN grouping.
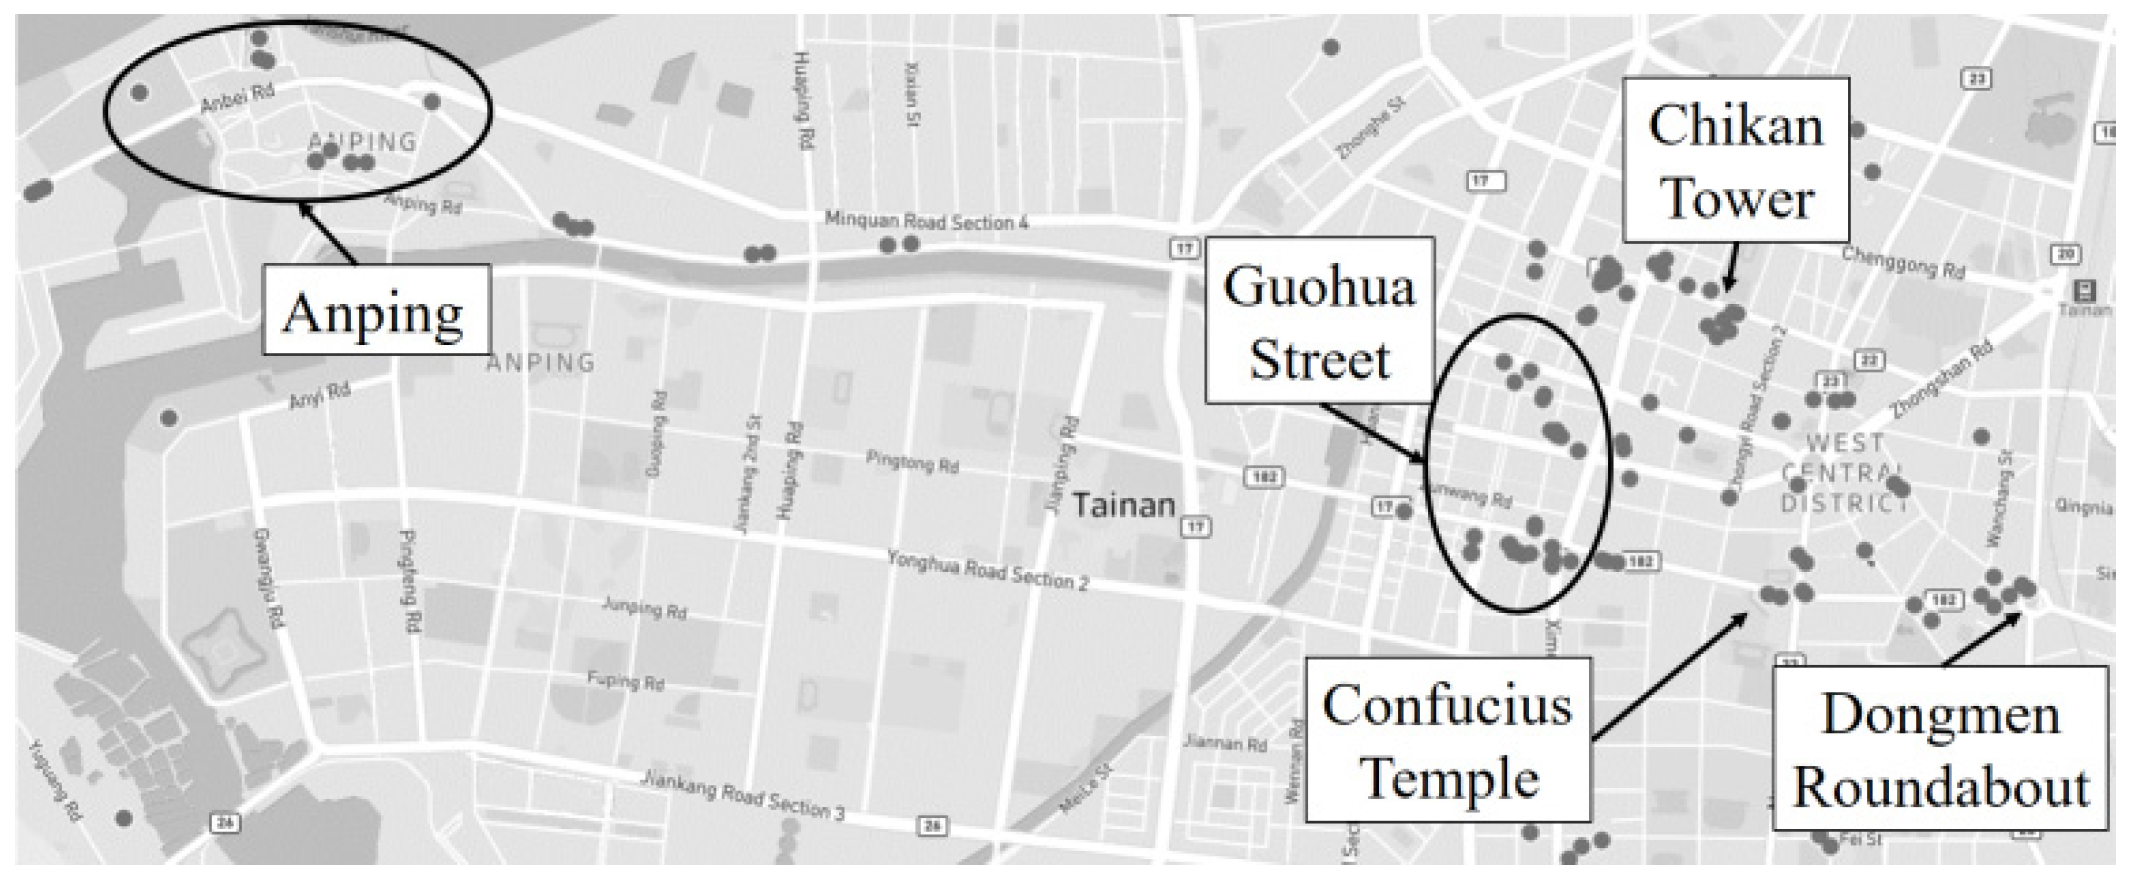
Figure 7.
Results of DBSCAN grouping.

Figure 8.
The posters designed by the student designer. (a) Old streets and alleys, (b) Anping food, (c) Guohua Street food, (d) Old City food, (e) village and museum, (f) coastal and rural, (g) historic landmark, (h) population poster.
Figure 8.
The posters designed by the student designer. (a) Old streets and alleys, (b) Anping food, (c) Guohua Street food, (d) Old City food, (e) village and museum, (f) coastal and rural, (g) historic landmark, (h) population poster.

Figure 9.
The posters designed by the online designer (Practical). (a) Old streets and alleys, (b) Anping food, (c) Guohua Street food, (d) Old City food, (e) village and museum, (f) coastal and rural, (g) historic landmark, (h) population poster.
Figure 9.
The posters designed by the online designer (Practical). (a) Old streets and alleys, (b) Anping food, (c) Guohua Street food, (d) Old City food, (e) village and museum, (f) coastal and rural, (g) historic landmark, (h) population poster.
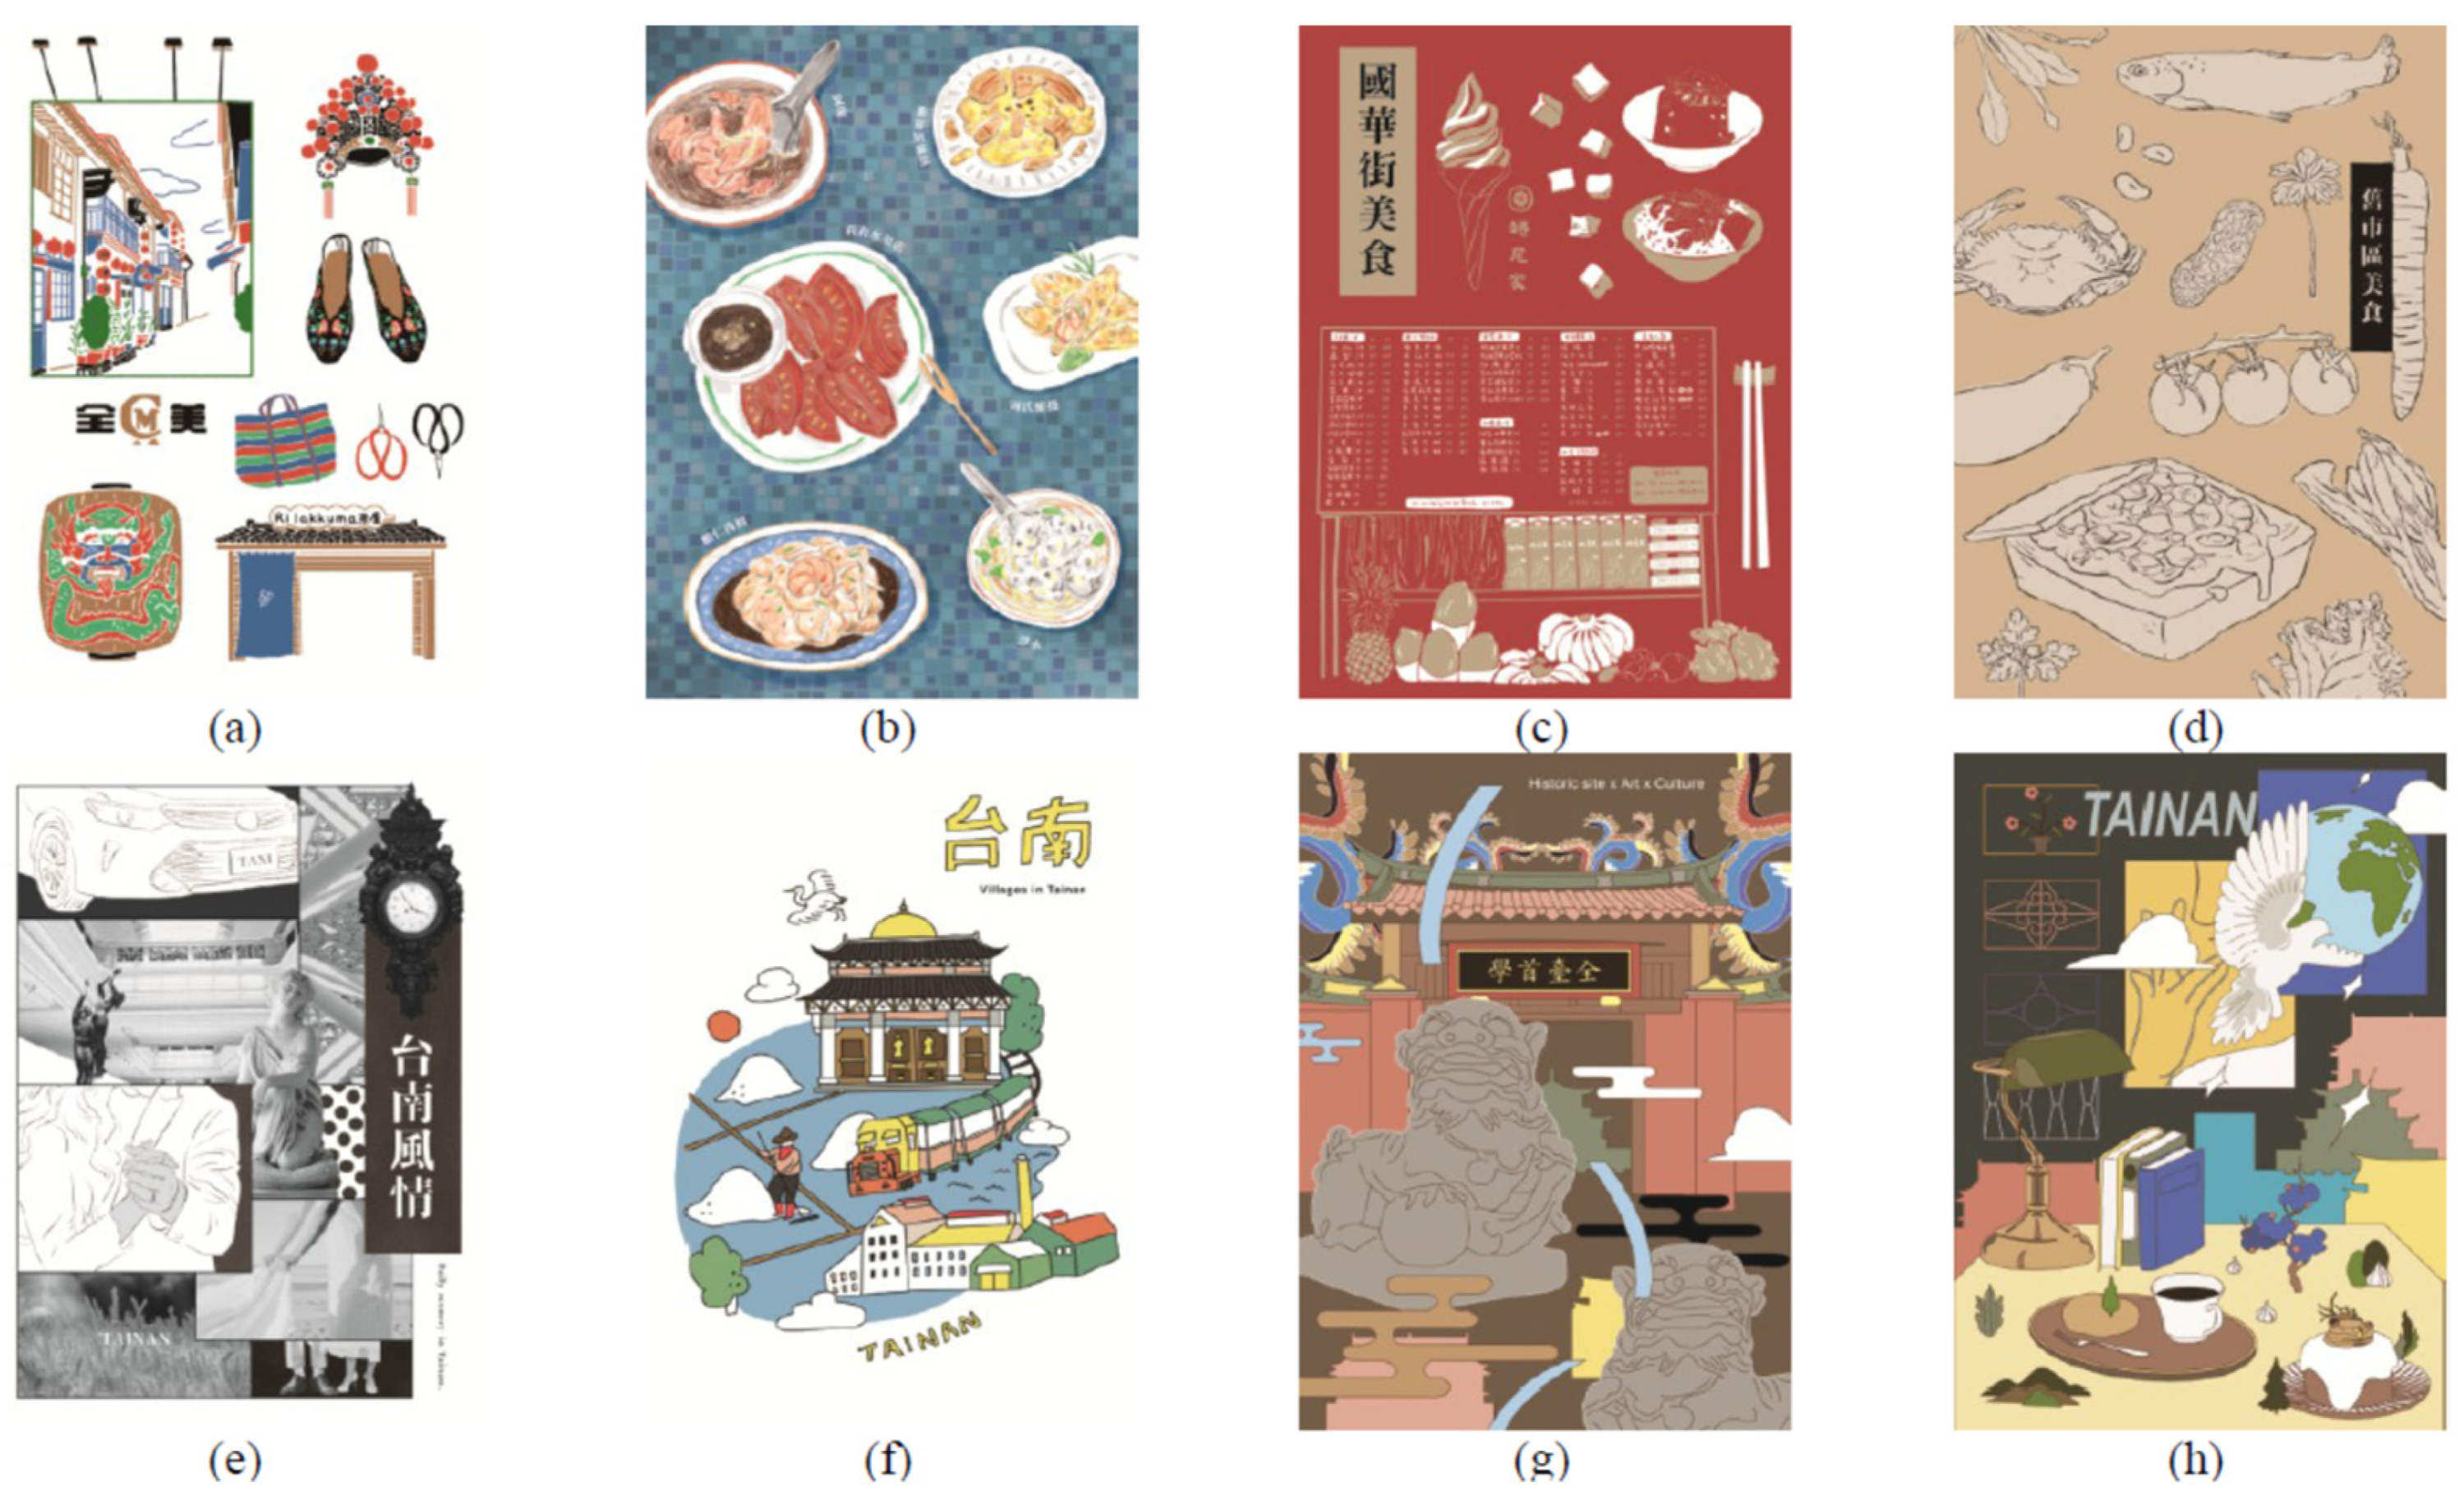
Figure 10.
The posters designed by the online designer (Artistic). (a) Old streets and alleys, (b) Anping food, (c) Guohua Street food, (d) Old City food, (e) village and museum, (f) coastal and rural, (g) historic landmark, (h) population poster.
Figure 10.
The posters designed by the online designer (Artistic). (a) Old streets and alleys, (b) Anping food, (c) Guohua Street food, (d) Old City food, (e) village and museum, (f) coastal and rural, (g) historic landmark, (h) population poster.

Table 1.
Correlation between data and term groups.
| Text\Group | 1 | 2 | 3 | 4 | 5 |
|---|---|---|---|---|---|
| 1 | 0.09 | 0.11 | 0.27 | 0.15 | 0.33 |
| 2 | 0.09 | 0.27 | 0.38 | 0.11 | 0.14 |
| 3 | 0.33 | 0.09 | 0.87 | 0.78 | 0.61 |
Table 2.
Correlation between term groups and posting objectives.
| Group\Objective | 1 | 2 | 3 | 4 | 5 | 6 | 7 |
|---|---|---|---|---|---|---|---|
| 1 | 0.01 | 0.03 | 0.02 | 0.04 | 0.06 | 0.05 | 0.74 |
| 2 | 0.02 | 0.84 | 0.10 | 0.06 | 0.07 | 0.01 | 0.02 |
| 3 | 0.05 | 0.05 | 0.88 | 0.05 | 0.06 | 0.04 | 0.07 |
| 4 | 0.45 | 0.03 | 0.02 | 0.43 | 0.43 | 0.01 | 0.12 |
| 5 | 0.07 | 0.05 | 0.04 | 0.06 | 0.08 | 0.94 | 0.05 |
Table 3.
Percentage of desire increased by replacing general advertisements with document-based ones.
Table 3.
Percentage of desire increased by replacing general advertisements with document-based ones.
| Personalized Advertisements Displayed\Designer | Student Designer | Online Designer (Practical) | Online Designer (Artistic) |
|---|---|---|---|
| Favorite topic (1) | 65.32% | 58.06% | 49.19% |
| Second-favorite topic (2) | 62.10% | 50.81% | 40.32% |
| Third-favorite topic (3) | 55.65% | 49.19% | 36.29% |
| (1) and (2) | 81.45% | 67.74% | 70.16% |
| (1) abd (3) | 76.61% | 70.16% | 63.71% |
| (2) and (3) | 76.61% | 66.13% | 58.06% |
| Top 3 favorites (i.e., (1), (2), and (3)) | 85.48% | 73.39% | 78.23% |
Table 4.
Percentage of desire increased by replacing general advertisements with keyword-based ones.
Table 4.
Percentage of desire increased by replacing general advertisements with keyword-based ones.
| Personalized Advertisements Displayed\Designer | Student Designer | Online Designer (Practical) | Online Designer (Artistic) |
|---|---|---|---|
| Favorite topic (1) | 72.58% | 64.52% | 43.55% |
| Second-favorite topic (2) | 68.55% | 64.52% | 46.77% |
| Third-favorite topic (3) | 66.13% | 55.65% | 50.00% |
| (1) and (2) | 87.90% | 77.42% | 60.48% |
| (1) and (3) | 85.48% | 73.39% | 63.71% |
| (2) and (3) | 76.61% | 72.58% | 66.94% |
| Top 3 favorites (i.e., (1), (2), and (3)) | 88.71% | 79.84% | 73.39% |
Publisher’s Note: MDPI stays neutral with regard to jurisdictional claims in published maps and institutional affiliations. |
© 2022 by the authors. Licensee MDPI, Basel, Switzerland. This article is an open access article distributed under the terms and conditions of the Creative Commons Attribution (CC BY) license (https://creativecommons.org/licenses/by/4.0/).
Share and Cite
MDPI and ACS Style
Chang, T.-Y.; Chen, Y.-C. Creating a System of IOE-PDPTA to Bridge Tourists and Poster Designers: An Application of IOE in Personalized Poster Design. Systems 2022, 10, 125. https://doi.org/10.3390/systems10040125
AMA Style
Chang T-Y, Chen Y-C. Creating a System of IOE-PDPTA to Bridge Tourists and Poster Designers: An Application of IOE in Personalized Poster Design. Systems. 2022; 10(4):125. https://doi.org/10.3390/systems10040125
Chicago/Turabian StyleChang, Tsen-Yao, and Yi-Chung Chen. 2022. "Creating a System of IOE-PDPTA to Bridge Tourists and Poster Designers: An Application of IOE in Personalized Poster Design" Systems 10, no. 4: 125. https://doi.org/10.3390/systems10040125
Note that from the first issue of 2016, this journal uses article numbers instead of page numbers. See further details here.