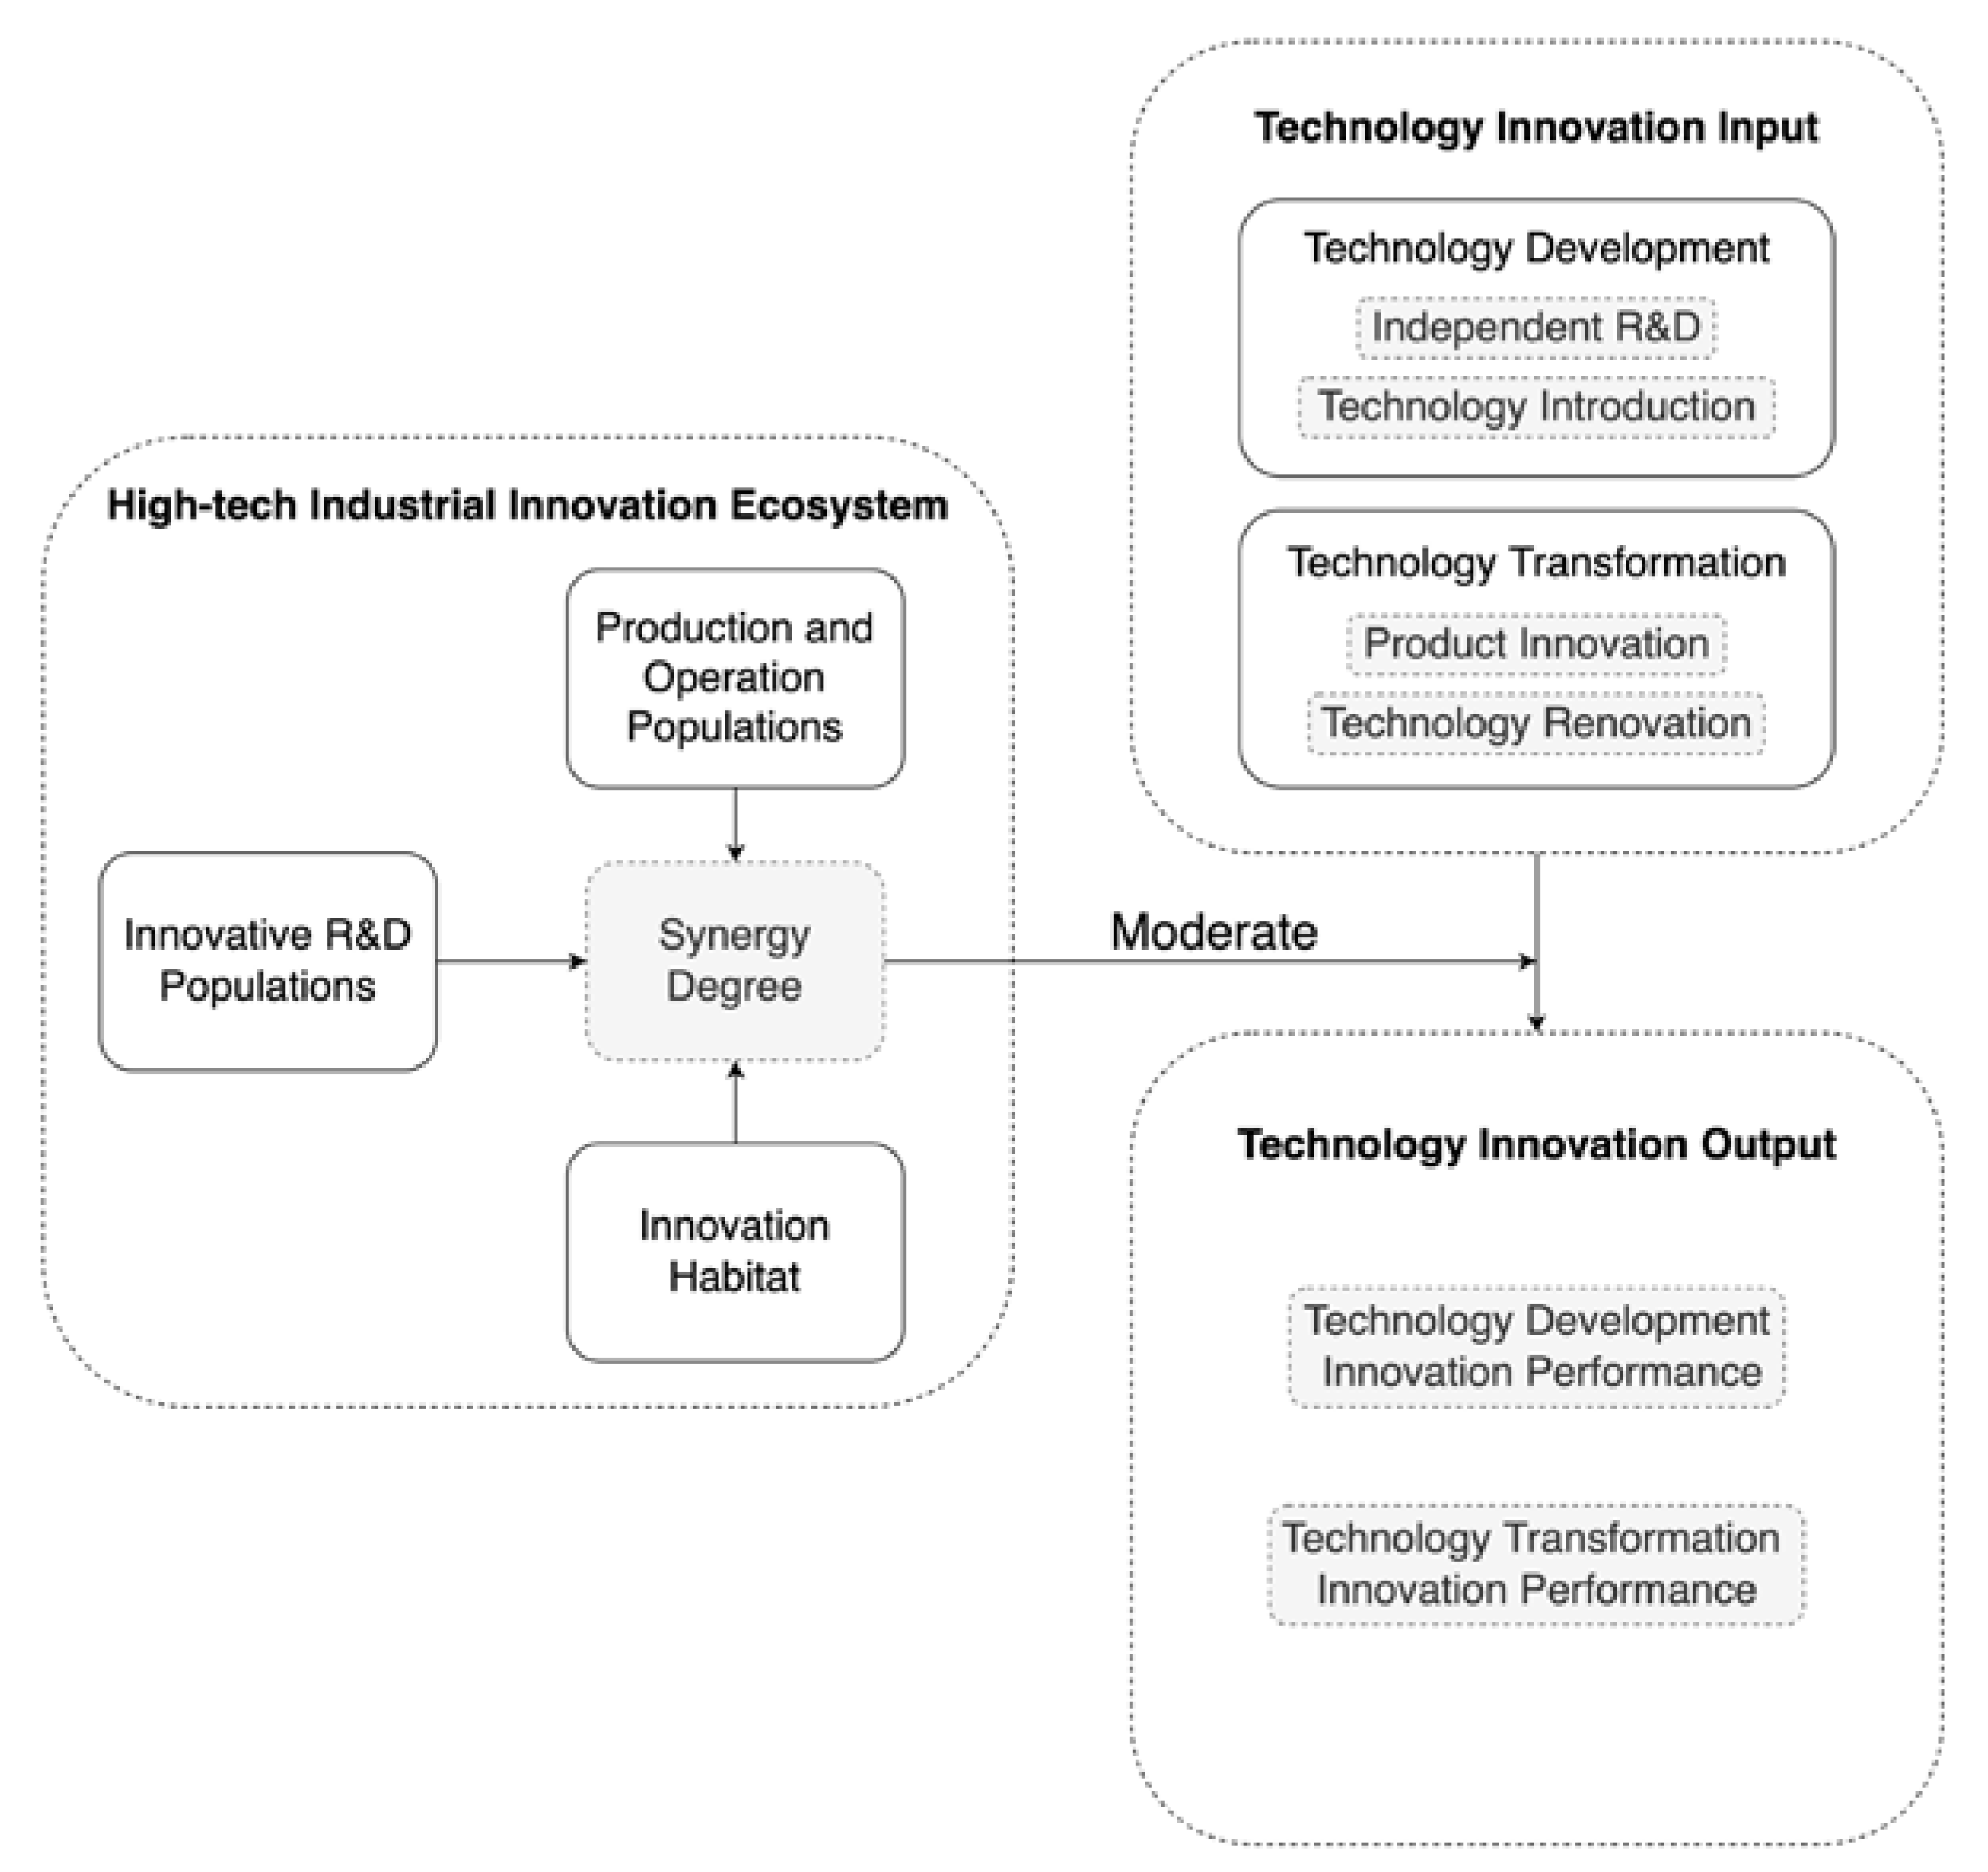
4.1. Analysis of Technology Development Performance
The empirical analysis of technology development performance was analyzed by the hierarchical regression method, and the variables were standardized to further reduce the effect of possible multicollinearity before constructing interaction terms, and the results of the regression analysis are shown in
Table 6.
Model 1 introduces two control variables (production and operation scale, fixed assets and investment) in the regression equation, and the results show that the control variables have significant explanatory power on technology development performance (, ), and the regression coefficients and reach 0.01 significant level, which indicates that the control variables have a significant influence on the explanatory variables, with the coefficients of production and operation scale being 0.605, and the coefficient of fixed assets and investment is 0.242, which indicates that both control variables have a positive effect on technology development and innovation performance, and the effect of the production operation scale is stronger than that of the fixed assets and investment.
Model 2 introduces two explanatory variables (independent R&D innovation and technology introduction innovation) based on model 1 to test the contribution of explanatory variables to the explained variables when controlling for the control variables. After introducing the two variables of independent R&D innovation and technology introduction innovation, model 2 is significant () and has a better explanatory power of 91.1% for technology development performance than model 1 ). The regression results of model 2 showed that the independent R&D innovation had a significant positive effect on technology development performance (, ), whereas technology introduction innovation had a significant negative effect on the technology development performance ).
Model 3 introduces the moderating variable (synergy degree) based on model 2 to test the contribution of the moderating variable to the technology development performance. After adding the moderating variable, model 3 is significant () and has better explanatory power than model 2 () with an explanatory power of 91.3% on technology development performance. The results of model 3 regression analysis showed that the synergy degree of the innovation ecosystem in high-tech industries had a significant positive effect on the technology development performance ().
Model 4 incorporates an interaction term between the moderating variable and the independent variable to test the moderating effect of the synergy degree of the innovation ecosystem of high-tech industries on the relationship between independent R&D innovation, technology introduction innovation, and technology development performance. With the introduction of the interaction term, model 4 was significant () and had 92.4% explanatory power for the technology development performance, which had a better explanatory power than model 3 (). The regression results show that the interaction between the independent R&D innovation and synergy degree is significant, with a positive regression coefficient of the interaction term (); the interaction between the technology introduction innovation and synergy degree is significant, with a positive regression coefficient of the interaction term (). The above results indicate that the synergy degree of the innovation ecosystem in high-tech industries can significantly enhance the positive effect of independent R&D innovation on innovation performance, and it also has a positive effect on the relationship between technology introduction innovation and innovation performance.
To explain more intuitively the moderating effect of synergy degree on the performance of independent R&D innovation, technology introduction innovation, and technology development innovation, according to the research methods of the literature [
38], this study plots the moderating effect of synergy degree on independent R&D innovation and synergy on technology introduction innovation, with one standard deviation above and one standard deviation below the mean, respectively, as shown in
Figure 2 and
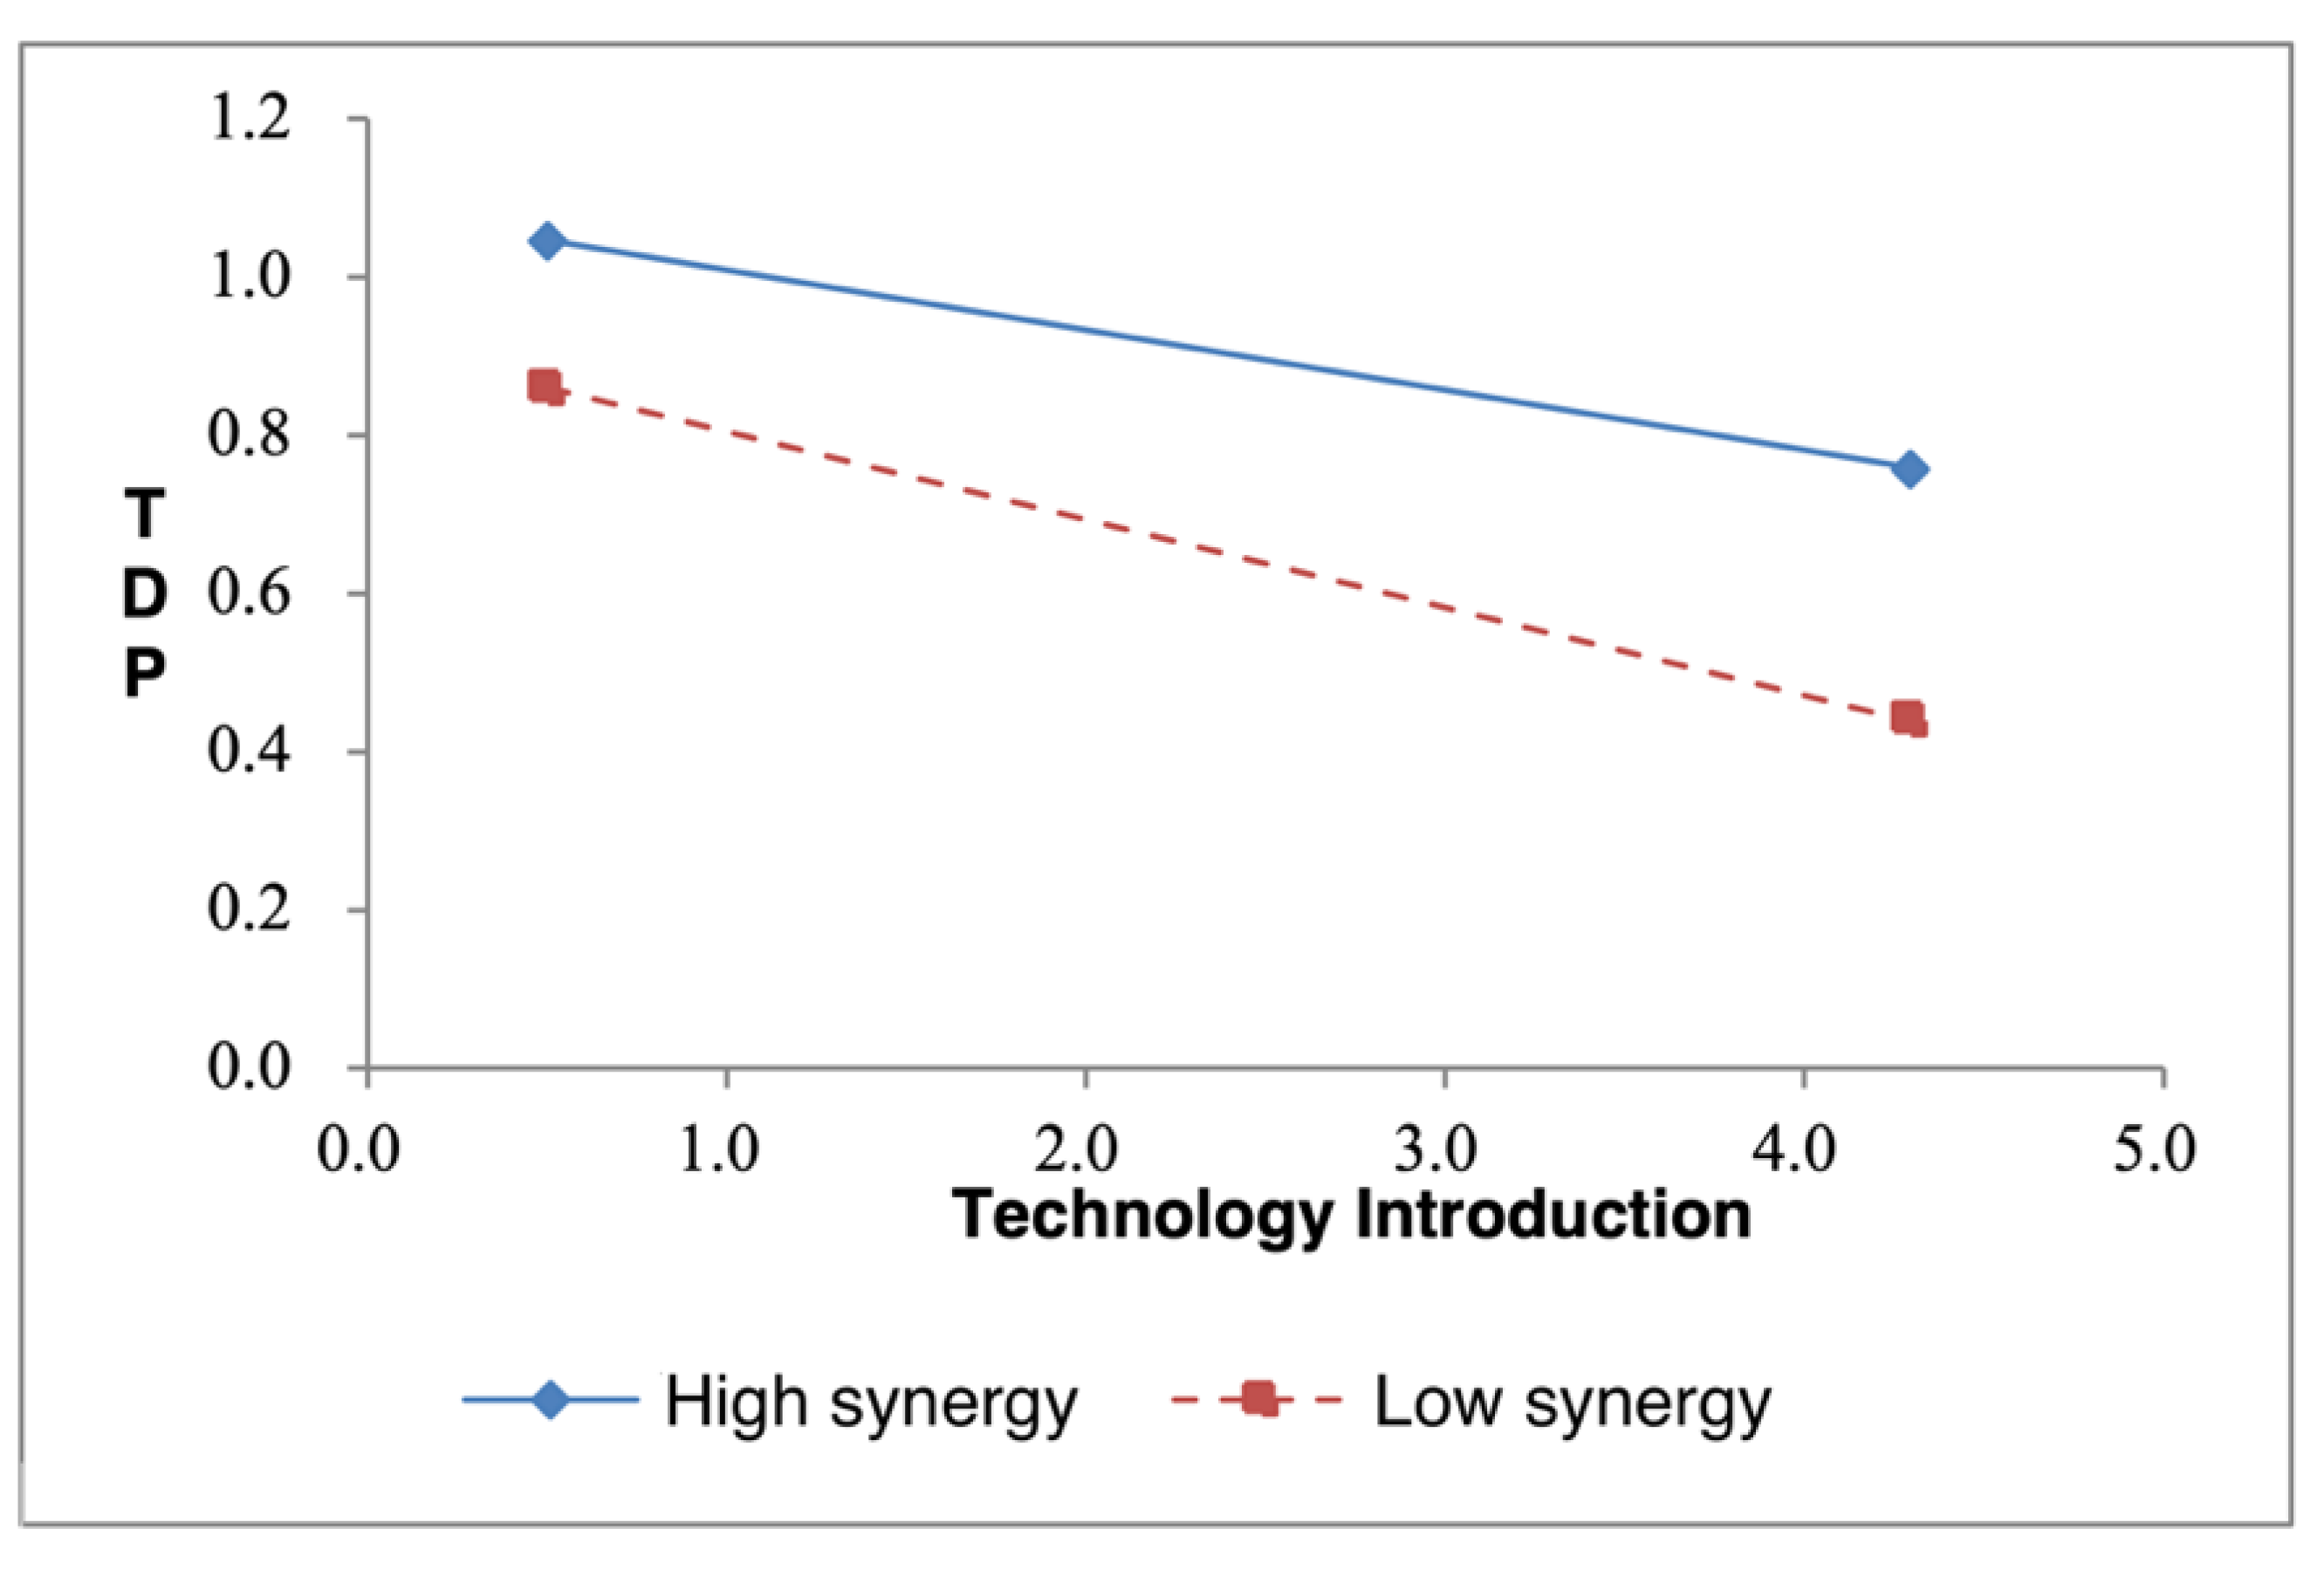
Figure 3.
In
Figure 2, the solid line indicates the impact relationship of independent R&D innovation on the technology development performance in the case of a high level of synergy degree in a high-tech industrial innovation ecosystem, and the dashed line indicates the influence relationship of independent R&D innovation on the technology development performance in the case of a low level of synergy degree accordingly. It can be seen that the slope of both the solid and dashed lines are positive, indicating that independent R&D innovation positively influences technology development performance, and the slope of the solid line is larger than the slope of the dashed line, so with the increase in independent R&D innovation, a high level of synergy degree can produce relatively high technology development performance.
Similarly, in
Figure 3, the solid line indicates the influential relationship between technology introduction innovation and technology development innovation at a high level of synergy degree, and the dashed line indicates the influential relationship between technology introduction innovation and technology development innovation at a low level of synergy degree. It can be seen that the slopes of both the solid and dashed lines are negative, indicating that technology introduction innovation negatively affects technology development performance, and the slope of the dashed line is smaller than the slope of the solid line, indicating that with the increase in technology introduction innovation, the high level of synergy degree can produce a relatively high technology development performance.
4.2. Analysis of Technology Transformation Performance
Hierarchical regression was used to empirically study the technology transformation performance, and the variables were standardized before constructing the interaction terms to further reduce the effect of possible multicollinearity. The results of the regression analysis of technology transformation performance are shown in
Table 7.
Model 5 introduces two control variables (production and operation scale, fixed assets and investment) in the regression equation, and the results show that the explanatory power of the control variables on technology transformation performance is high , ), and the regression coefficients and F-values reach 0.01 significant level, indicating that the control variables have a significant impact on the explanatory variables, with the coefficients of production and operation scale being 0.952, and the coefficient of fixed assets and investment is −0.100, indicating that both production and operation scale have a positive effect on technology transformation performance, whereas both fixed assets and investment have a positive effect on technology transformation performance.
Model 6 adds two explanatory variables (product innovation, technology renovation) to model 5 in order to test the contribution of explanatory variables to the explained variables, controlling for the control variables. With the introduction of two variables, product innovation and technology renovation, model 6 is significant () and has a better explanatory power of 88.9% for technology transformation performance than model 5 (). The regression analysis of model 6 showed that product innovation had a significant positive effect on technology transformation performance (), whereas technology transformation innovation had a significant negative effect on technology transformation performance ().
Model 7 introduces a moderating variable (synergy degree) based on model 6 to test the contribution of the moderating variable to the technology transformation performance. After adding the moderating variable, model 7 is significant () and has an 88.9% explanatory power on the technology transformation performance, which is similar to the explanatory power of model 6 (). The results of model 7 regression analysis showed that the synergy degree of the innovation ecosystem in high-tech industries had a significant positive effect on the technology transformation performance ().
Model 8 incorporates an interaction term between the moderating variable and the independent variable to test the moderating effect of the synergy degree of the innovation ecosystem of high-tech industries on the relationship between product innovation, technology renovation, and technology transformation performance. With the introduction of the interaction term, model 8 was significant () and had a better explanatory power of 89.0% on technology transformation performance than model 7 (). The regression results show that the interaction between product innovation and synergy degree is more significant, and the regression coefficient of the interaction term is positive (); the interaction between technology renovation and synergy is not significant. The above results indicate that the synergy of the innovation ecosystem in high-tech industries enhances the positive effect of product innovation on innovation performance, and it has no significant effect on the relationship between technology renovation and innovation performance.
To more intuitively explain the moderating effect of the synergy degree on product innovation and innovation performance, this study depicts the graph of the moderating effect of the synergy degree on product innovation with one standard deviation above the mean and one standard deviation below the mean, respectively, as shown in
Figure 4, which shows that as the investment in the product innovation increases, the higher synergy degree in the innovation ecosystem of high-tech industries can produce a relatively higher innovation performance of technology transformation.


