
Research on the Coupling Coordination Relationship between Urban Rail Transit System and Sustainable Urban Development


School of Economics and Management, Chongqing Jiaotong University, Chongqing 400074, China
*
Author to whom correspondence should be addressed.
Systems 2022, 10(4), 110; https://doi.org/10.3390/systems10040110
Submission received: 8 July 2022
/
Revised: 25 July 2022
/
Accepted: 26 July 2022
/
Published: 29 July 2022
(This article belongs to the Special Issue Research Trends on the Development of Integrated and Robust Social Development Management Systems)
Abstract
:With the accelerating urbanization and steady economic development in China, the urban built-up area is expanding and the population in the core area is proliferating. The pressure of insufficient urban infrastructure, especially public transportation capacity, is becoming increasingly evident, and urban rail transit (URT) systems are crucial to the sustainable development of cities. This paper collects data related to URT and sustainable urban development (SUD) in 42 cities in China in 2020, constructs a comprehensive evaluation index system, and quantitatively analyzes the coupling coordination degree of the two systems using the TOPSIS (Technique for Order Preference by Similarity to an Ideal Solution) method and coupling coordination degree model. Then, the influencing factors of the coupling coordination degree of URT and SUD are analyzed by combining the grey correlation analysis method. The results of this study show that: (1) There are significant differences between URT system development and SUD in 42 cities in China. (2) The average coupling coordination between URT development and SUD is 0.4406. More than half of the cities are in the slightly unbalanced category. (3) Factors, such as resident population, income level and urban built-up area, significantly influence the coupling and coordination level of URT and SUD. It is hoped that the research in this paper will advance the in-depth research on the level of coordination between URT and SUD coupling, provide a solid basis for future URT planning and construction in China and even other countries in the world, and make the planning and construction of URT in China more scientific and reasonable, to promote the sustainable development of cities.
1. Introduction
Cities are the centers of human social and economic activities [1]. The urban population exceeds half of the total population [2]. With the acceleration of urbanization, the impact of human activities is increasingly concentrated in cities. While urban expansion has increased the material wealth and living standards of urban dwellers, it has caused many environmental and social problems, such as environmental pollution and traffic congestion, due to intensive human activities [3,4,5]. Many scholars have pointed out that sustainable urban development (SUD) is essential for protecting the natural environment and the well-being of people and society [6,7,8]. SUD means achieving highly developed urbanization and modernization at a specific spatial and temporal scale, with long-term sustainable urban growth and structural optimization, thus, meeting both the real needs of contemporary urban development and the needs of future urban development [1]. The United Nations released the 2030 Agenda for Sustainable Development. Sustainable Development Goal no. 11 is related to “inclusive, safe, resilient and sustainable” cities, which is one of the critical elements to improving global sustainability [9]. The International Energy Agency (IEA) also reports that the transportation sector is the second-largest emitter of greenhouse gases globally, accounting for 24.64% of global CO2 emissions [10]. Moreover, the considerable transportation demand will stimulate more infrastructure investment and energy consumption. As essential infrastructure for cities, urban rail transit (URT) systems are an excellent solution to the transportation problems of metropolitan cities. They have many advantages over buses, cabs and private cars, such as energy efficiency, better travel safety and efficiency, and higher on-time travel rates [11,12,13]. URT will play a positive role in guiding the development of urban form while effectively alleviating urban traffic, contributing to the sustainability, equity and livability of global cities, reducing the negative environmental impact of other transportation modes and promoting economic growth [8]. Therefore, URT systems are crucial to the sustainability of cities and many countries and regions are willing to develop URT [14].
Some scholars point out the high cost of URT construction in China and constructing a 1 km rail transit line requires an investment of nearly RMB 700 million [15,16]. With accelerated urbanization, China’s URT operating mileage is increasing. The construction and operation costs are also increasing. However, the expected results are not achieved. Urban traffic congestion is still increasing and problems, such as low travel efficiency, are still prevalent [13,17,18]. For a long time, there have been no universally accepted criteria for determining which cities to build URT in and how large the construction scale is. It is generally believed that URT construction can only achieve good social and economic benefits if it is coordinated and synchronized with the sustainable development of the city [19,20]. Thus, it is crucial to accurately evaluate the coordination between URT and SUD to promote coordination between the two systems and make the city more livable and urban transportation greener and more efficient.
In recent years, many scholars have researched the impact and interrelationship of URT on urbanization development. Scholars have studied the impact of URT on commercial land in China and all came to the same conclusion that URT has a positive impact on commercial land and can increase land values and commercial real estate prices [21,22]. Ko and Cao [23] developed hedonic pricing models to evaluate the added value of the Hiawatha LRT in Minneapolis for commercial and industrial properties and found that the LRT has generated a significant price premium for nearby properties. Pacheco-Raguz [24] used correlation and regression models to study Light Rail Transit Line 1 in Manila, Philippines, and found that Light Rail Transit influenced land value, land use and population density. Wu [25] proposed that URT can effectively shorten residents’ travel time and relieve urban traffic pressure and established a multi-objective optimization model for the comprehensive layout of URT stations. Other scholars have conducted studies on the coordination of URT and urbanization. Wang et al. [20] analyzed the pattern and characteristics of the coupled “rail transit-socio-economic” coordinated development of the Yangtze River Delta city cluster in China. Liu and Wang [26] evaluated the coupled coordination of URT and land use in Shanghai, China, and found that the integrated development level of the URT system and land use system in Shanghai has steadily increased, and the coupled interaction effect of the two systems is obvious. Xia et al. [27] used the entropy method, coupling coordination degree model and spatial autocorrelation analysis to explore the spatial and temporal characteristics of overall coupling coordination and pairwise coupling coordination between URT and population, economy and spatial urbanization in Beijing. Hou et al. [28] analyzed the coordination relationship between URT and land use using data envelopment analysis and clustering methods. They found that the relationship between rail transit capacity and land use at high-population-density URT stations was unbalanced and proposed corresponding countermeasures. Cai et al. [29] studied the coupled coordination relationship between URT stations and urban centers from the perspective of their spatial overlap, pointing out that URT will have a significant or fundamental impact on urban spatial structure, land use and spatial quality. Rodríguez and Kang [30] measured the dimensions of location, position, modal integration and land development of the metro in Seoul, Korea. They suggested the importance of the metro in creating a sustainable and livable city. Ferbrache and Knowles [31] found that light rail development can contribute to urban development, help enhance the image and quality of cities, achieve economic growth and create sustainable and livable cities. It was also noted that, especially in French cities, light rail had become the image and identity of a city and that many European and American cities have demonstrated how light rail can be seen as a tool to transform urban areas and enhance the image and quality of cities by integrating transportation infrastructure with urban planning and land use, from small-scale street improvements to city-wide improvements.
The above discussions demonstrate that few studies have been conducted on URT and SUD’s coupling and coordination degrees. Therefore, in this study, an assessment model was developed to evaluate the coupling coordination degree between URT and SUD by combining the methods of TOPSIS (Technique for Order Preference by Similarity to an Ideal Solution), the coupling coordination degree model and grey correlation analysis. Then, the data from 42 cities in China in 2020 were collected for empirical analysis. The contributions of this paper are as follows. First, previous studies mainly focused on the degree of mutual influence and facilitating effects and the coupled and coordinated relationship between URT and urban population, space or industrial structure. This study analyzes the coupling coordination degree of urban rail transit and sustainable urban development, which can provide a new angle for developing the URT system. Second, the empirical research confirms the research hypotheses and the influencing factors of the coupling coordination degree of URT, and SUD is further analyzed. According to the research results, it can provide decision support for relevant departments on the scale and timing of URT construction and provide theoretical support for optimal urban management and SUD.
The subsequent parts of this paper are organized as follows. Section 2 details the methods, including the entropy weight, TOPSIS, coupled coordination model, and grey correlation analysis. Section 3 presents the indicator selection and data sources. In Section 4, the results of the empirical analysis are presented. The results of the empirical analysis are discussed in Section 5. Finally, conclusions are obtained in Section 6.
2. Methods
As shown in Figure 1, the evaluation of the coupling and coordination of URT and SUD mainly includes three steps. Firstly, build a comprehensive evaluation index system of coupling and coordination between URT and SUD. Secondly, build a model to evaluate the coupling coordination of the two systems. The entropy weight method is used to calculate the weights of each index in the two systems. The TOPSIS method is used to calculate the comprehensive evaluation value of the two systems. Then the coupling coordination degree model of the coupling coordination function is established to evaluate the coupling coordination state of the two systems. Thirdly, the grey relational analysis method studies the factors affecting the coupling and coordination degree of URT and SUD.
2.1. Entropy Weight Method
The entropy weight method is a branch of information theory commonly utilized in evaluating URT operations [32,33]. Entropy is a measure of an evaluation index’s degree of variation. Suppose an index’s information entropy is lower. In that case, it gives more information, which indicates it plays a more significant role in the evaluation and, hence, has a higher weight and vice versa, which is the optimal objective weight approach [34,35,36,37]. The entropy weight method has been extensively and successfully applied in many sustainability studies, such as the sustainability of countries [38], urban sustainability [39], the sustainability of transportation systems [40] and sustainability of nitrogen management [35]. The specific steps are shown as follows:
- (1)
- Establishment of an evaluation matrix
According to the selected indicators in the URT development system (A) and SUD system (B), the basic matrix with n indicators and m cities can be expressed as:
where yij represents the original data for the j-th evaluation indicator in the i-th city, m is 42 in the two systems and n is 8 and 25, respectively, in systems A and B.
- (2)
- Normalization of all indicators
There are two types of evaluation indicators: positive and negative indicators. For those positive indicators, a higher score suggests a better performance. The normalization can be conducted as follows:
For those negative indicators, a higher score suggests a poorer performance. The normalization can be conducted as follows:
where is the minimum original data for the indicator j and is the maximum one. Further, represents the evaluation value of yij after normalization.
- (3)
- Calculation of the entropy
For the new matrix after normalization, firstly, the contribution value (pij) of j-th indicator in i-th city should be calculated as follows:
Then, an entropy value (ej) for each indicator can be calculated as follows:
- (4)
- Calculation of the weight
Finally, the entropy weight value (ωj) of j-th indicator in system A can be calculated as follows:
where 8 is the number of indicators in system A, which can be replaced by 25 in system B.
2.2. TOPSIS Method
TOPSIS is an effective prioritization method for solving multi-criteria decision analysis problems. Its primary premise is that there are two types of ideal solutions: positive and negative. The best scheme is one in which all of the evaluation indexes in the scheme are the best values, and the worst scheme is one in which all of the evaluation indexes in the scheme are the worst values. The closeness degree between the evaluation scheme and the positive ideal solution is calculated using the Euclidean distance from the evaluation scheme to the positive and negative ones. The optimum assessment scheme is the one that is closest to the positive ideal solution and farthest from the negative ideal solution. Further the ranking result can be conducted based on the closeness degree [32,36,41]. Further, as a proven method, TOPSIS method has been widely used in various fields, such as the assessment of sustainable cities and communities [42], safety evaluation of transportation systems [34] and selection of green low-carbon ports [43]. The steps are as follows:
- (1)
- Construction of a weighted decision matrix
The weighted decision matrix is calculated by multiplying the matrix after normalization by the entropy weight, as shown in the following:
where zij represents the weighted evaluation value of the j-th indicator in the i-th city. Further, represents the weight of the j-th evaluation indicator. Further, m is 42 in the two systems and n is 8 and 25, respectively, in systems A and B.
- (2)
- Calculation of the positive ideal distance and the negative ideal distance
First, in order to calculate the positive and negative ideal distance, the positive ideal value and the negative ideal value of the j-th evaluation indicator in the i-th city should be proposed as follows:
Then, based on the positive and negative ideal values, the positive ideal distance and the negative ideal distance of the i-th city should be calculated as follows, respectively:
- (3)
- Calculation of relative closeness
The relative closeness value (Ri) of the i-th city is used to assess the research objects to form a ranking sequence. A smaller gap between the assessment object and the ideal sample, which equals better performance, is represented by a higher relative closeness value. The specific equation is as follows:
Therefore, in this study, for the i-th city, the comprehensive assessment values of system A (uA) and system B (uB) are represented by the relative closeness values (Ri), respectively.
2.3. Coupling Coordination Degree Model
Coupling, which originates from physical science, has recently become popular in studies of urbanization and reflects the phenomenon in which multiple systems influence each other through various interactions [44]. The benign coupling among different system coupling relationships is measured by the term coordination, which shows the quality of the coordination condition. Consisting of a coupling degree and coordination degree, the coupling coordination degree indicates the comprehensive value of multiple systems interacting with each other based on various interactions [34,45,46,47]. The coupling coordination degree model is often used to assess urbanization and environment systems [45,46] and integration between urbanization and industry or other subsystems [37,48]. The specific steps can be conducted as follows:
- (1)
- Calculation of coupling degree
According to the coupling coordination degree definition, coupling degree and coordination degree are the prerequisites for calculating the coupling coordination degree. Hence, first, the basic equation to calculate coupling degree (C) can be presented as follows:
where x denotes the number of systems, which is 2 in this research, and ux represents the comprehensive development value of x-th system. Hence, Equation (14) can be simplified as:
- (2)
- Calculation of coordination degree
Then, the basic equation to calculate coordination degree (T) can be presented as:
where x denotes the number of systems and ux represents the comprehensive development value of x-th system. In addition, α, β and γ represent the degree values for the importance of systems. Taking both α and β to be 0.5, Equation (15) can be simplified as:
- (3)
- Calculation of coupling coordination degree
Finally, the coupling coordination degree can be proposed through the square root of the product of the coupling degree and coordination degree, shown as follows:
where C represents the coupling degree of the metro system and T represents the coordination degree of the metro system.
2.4. Grey Relational Analysis
Grey correlation analysis is based on the sequence curves’ geometry similarity to determine the relationship between the comparison sequence and the reference sequence; the closer the curves are, the more significant the correlation of the corresponding sequence and vice versa. This method can solve the problem of partially transparent and unclear uncertain information [50] and there is no requirement for the size and regularity of the sample. It can determine the major and minor factors that cause the coupling coordination degree of URT and SUD. Grey correlation analysis has been extensively used to obtain the driving degree of factors in different fields, such as urban water environment [51], green remanufacturing [52] and city management [53]. The main calculation steps are described as follows.
- (1)
- Determine the reference sequence and comparative sequences
This paper selects the coupling coordination degree of URT and SUD as the reference sequence. It takes the 33 indicators in Table 1 as the comparative sequences. Denote the reference sequence and comparative sequence as:
where means the indicator data dimension, which is the number of cities; means the number of impact factors.
- (2)
- Normalize the values of the original sequences
In order to improve the comparability between factors, it is necessary first to process and transform the original data of each factor to eliminate the influence of dimensions. In this paper, the initial value method is used to process the original data and the calculation formula is:
- (3)
- Calculate the grey correlation coefficient
Calculate the grey correlation coefficient of the corresponding elements in the comparison sequence and the reference sequence one by one and the calculation formula is:
where is the grey correlation coefficient of the k factor of the i evaluation object; is the resolution coefficient and .
- (4)
- Calculate the grey relational degree (GRD)
3. Selection of the Evaluation Indicators
3.1. Construction of the Evaluation Indicator System
Both the URT system and SUD system are complex nonlinear systems. The key to studying complex system metrics is to build a set of index systems that covers a wide range of areas and can fully reflect the system characteristics. Before establishing the index system, this paper extensively reviewed the relevant literature and the research results of other scholars. On this basis, the evaluation indexes of URT and SUD systems are divided into primary and secondary indexes to make the evaluation system more hierarchical.
For the URT system, indicators, such as length of lines, operation mileage and the number of transfer stations, are highly correlated with the development of URT. Considering the indicators’ representativeness and data availability, eight evaluation indicators are selected from two dimensions of URT development (the scale of URT development and the operation status). For the SUD system, most scholars select evaluation indicators from three aspects: economic, social and environmental [6,54,55]. In the economic dimension of SUD, scholars’ research not only focuses on additional production in the physical sense, such as the increase in monetary value; it is also related to qualitative changes, such as economic opportunities and the livelihoods of the citizens. The social dimension mainly refers to the selection of indicators from the perspective of social progress and the overall development of human beings. As Buzási and Jäger [6] proposed, the social dimension should include factors, such as education level, health and population. The selection of environmental dimension indicators is mainly based on the perspective of green life, including energy use, atmospheric environment, utilization and treatment of water resources, and living environment. Finally, 25 indicators of SUD were selected in three dimensions (society, economy and environment). The specific indicators are shown in Table 2.
3.2. Data Sources
The object of this study is the 42 cities operating rail URT in China in 2020. The research content evaluates the coupling and coordination degree of the two systems of URT and SUD. In total, 33 indicators are included. The data relating to the URT system come from the “2020 Urban Rail Transit Statistics and Analysis Report” released by the China Association of Metros. Other data come from the Urban Construction Statistical Yearbook and the China Urban Statistical Yearbook. The original data are shown in Appendix A.
4. Analysis Results
4.1. Calculation Results of the Indicator Weights
The normalized values of 28 positive and 5 negative indicators for 42 cities were obtained using Equations (2) and (3). Then, the contribution values, entropy values and entropy weights of each indicator in the URT development system and SUD system are calculated by Equations (4)–(6). The entropy weights of the two systems are shown in Table 3. As can be seen from Table 3, there are eight indicators in the URT development system, with an average weight of 0.125. The number of Transfer Stations and Average Daily Passenger Volume are ranked first, and passenger transport intensity is ranked last. Among them, four indicators have a higher weight than the average weight. In addition, the scale of URT has the most significant influence on URT development. The average weight of the 25 indicators in the urban sustainability system is 0.04. The top two indicators are Persons Employed in Urban Non-Private Units at Year-end and Fixed Assets Investment in Urban Service Facilities. The smallest one is Total Natural Gas. The 12 indicators with higher-than-average weights are distributed in each tier. Therefore, all three factors play an irreplaceable role in SUD.
4.2. Calculation Results of the URT and SUD
Then, the positive ideal distance, negative ideal distance and relative closeness values of each city in the two systems were calculated from Equations (9)–(13). The TOPSIS values of the combined development index of the two systems for each city are shown in Table 4 and Table 5.
From Table 4, it can be seen that in the URT development system, the average value of TOPSIS in 42 cities is 0.1876. Shanghai, Beijing and Guangzhou rank in the top three in the comprehensive development index and have obvious advantages. Regarding the research on URT development, Zhu et al. [49] obtained similar findings: the high level and coordinated supply and demand system conditions make the Shanghai metro mature in scale and show significant advantages in development status. In this system, 14 cities have a TOPSIS value higher than the average. From Table 5, the average value of TOPSIS of 42 cities in the SUD system is 0.3204. Beijing ranks first with 0.6106, followed by Shanghai and Shenzhen, while the TOPSIS values for the rest of the cities range from 0.1843 to 0.5000. In this system, 17 cities have a TOPSIS value above the average.
4.3. Calculation Results of Coupling Coordination Degree Values
The TOPSIS values in Table 4 and Table 5 are substituted into Equations (14)–(18) to calculate the coupling coordination degree values of URT and SUD systems for 42 cities. Taking Beijing as an example, the uA value in Table 4 is 0.8952, uB value in Table 6 is 0.6106 and the coupling coordination degree value of the two systems in Beijing can be obtained as 0.8598, according to Equation (6). The calculation results of the coupling coordination degree of 42 cities are shown in Table 6.
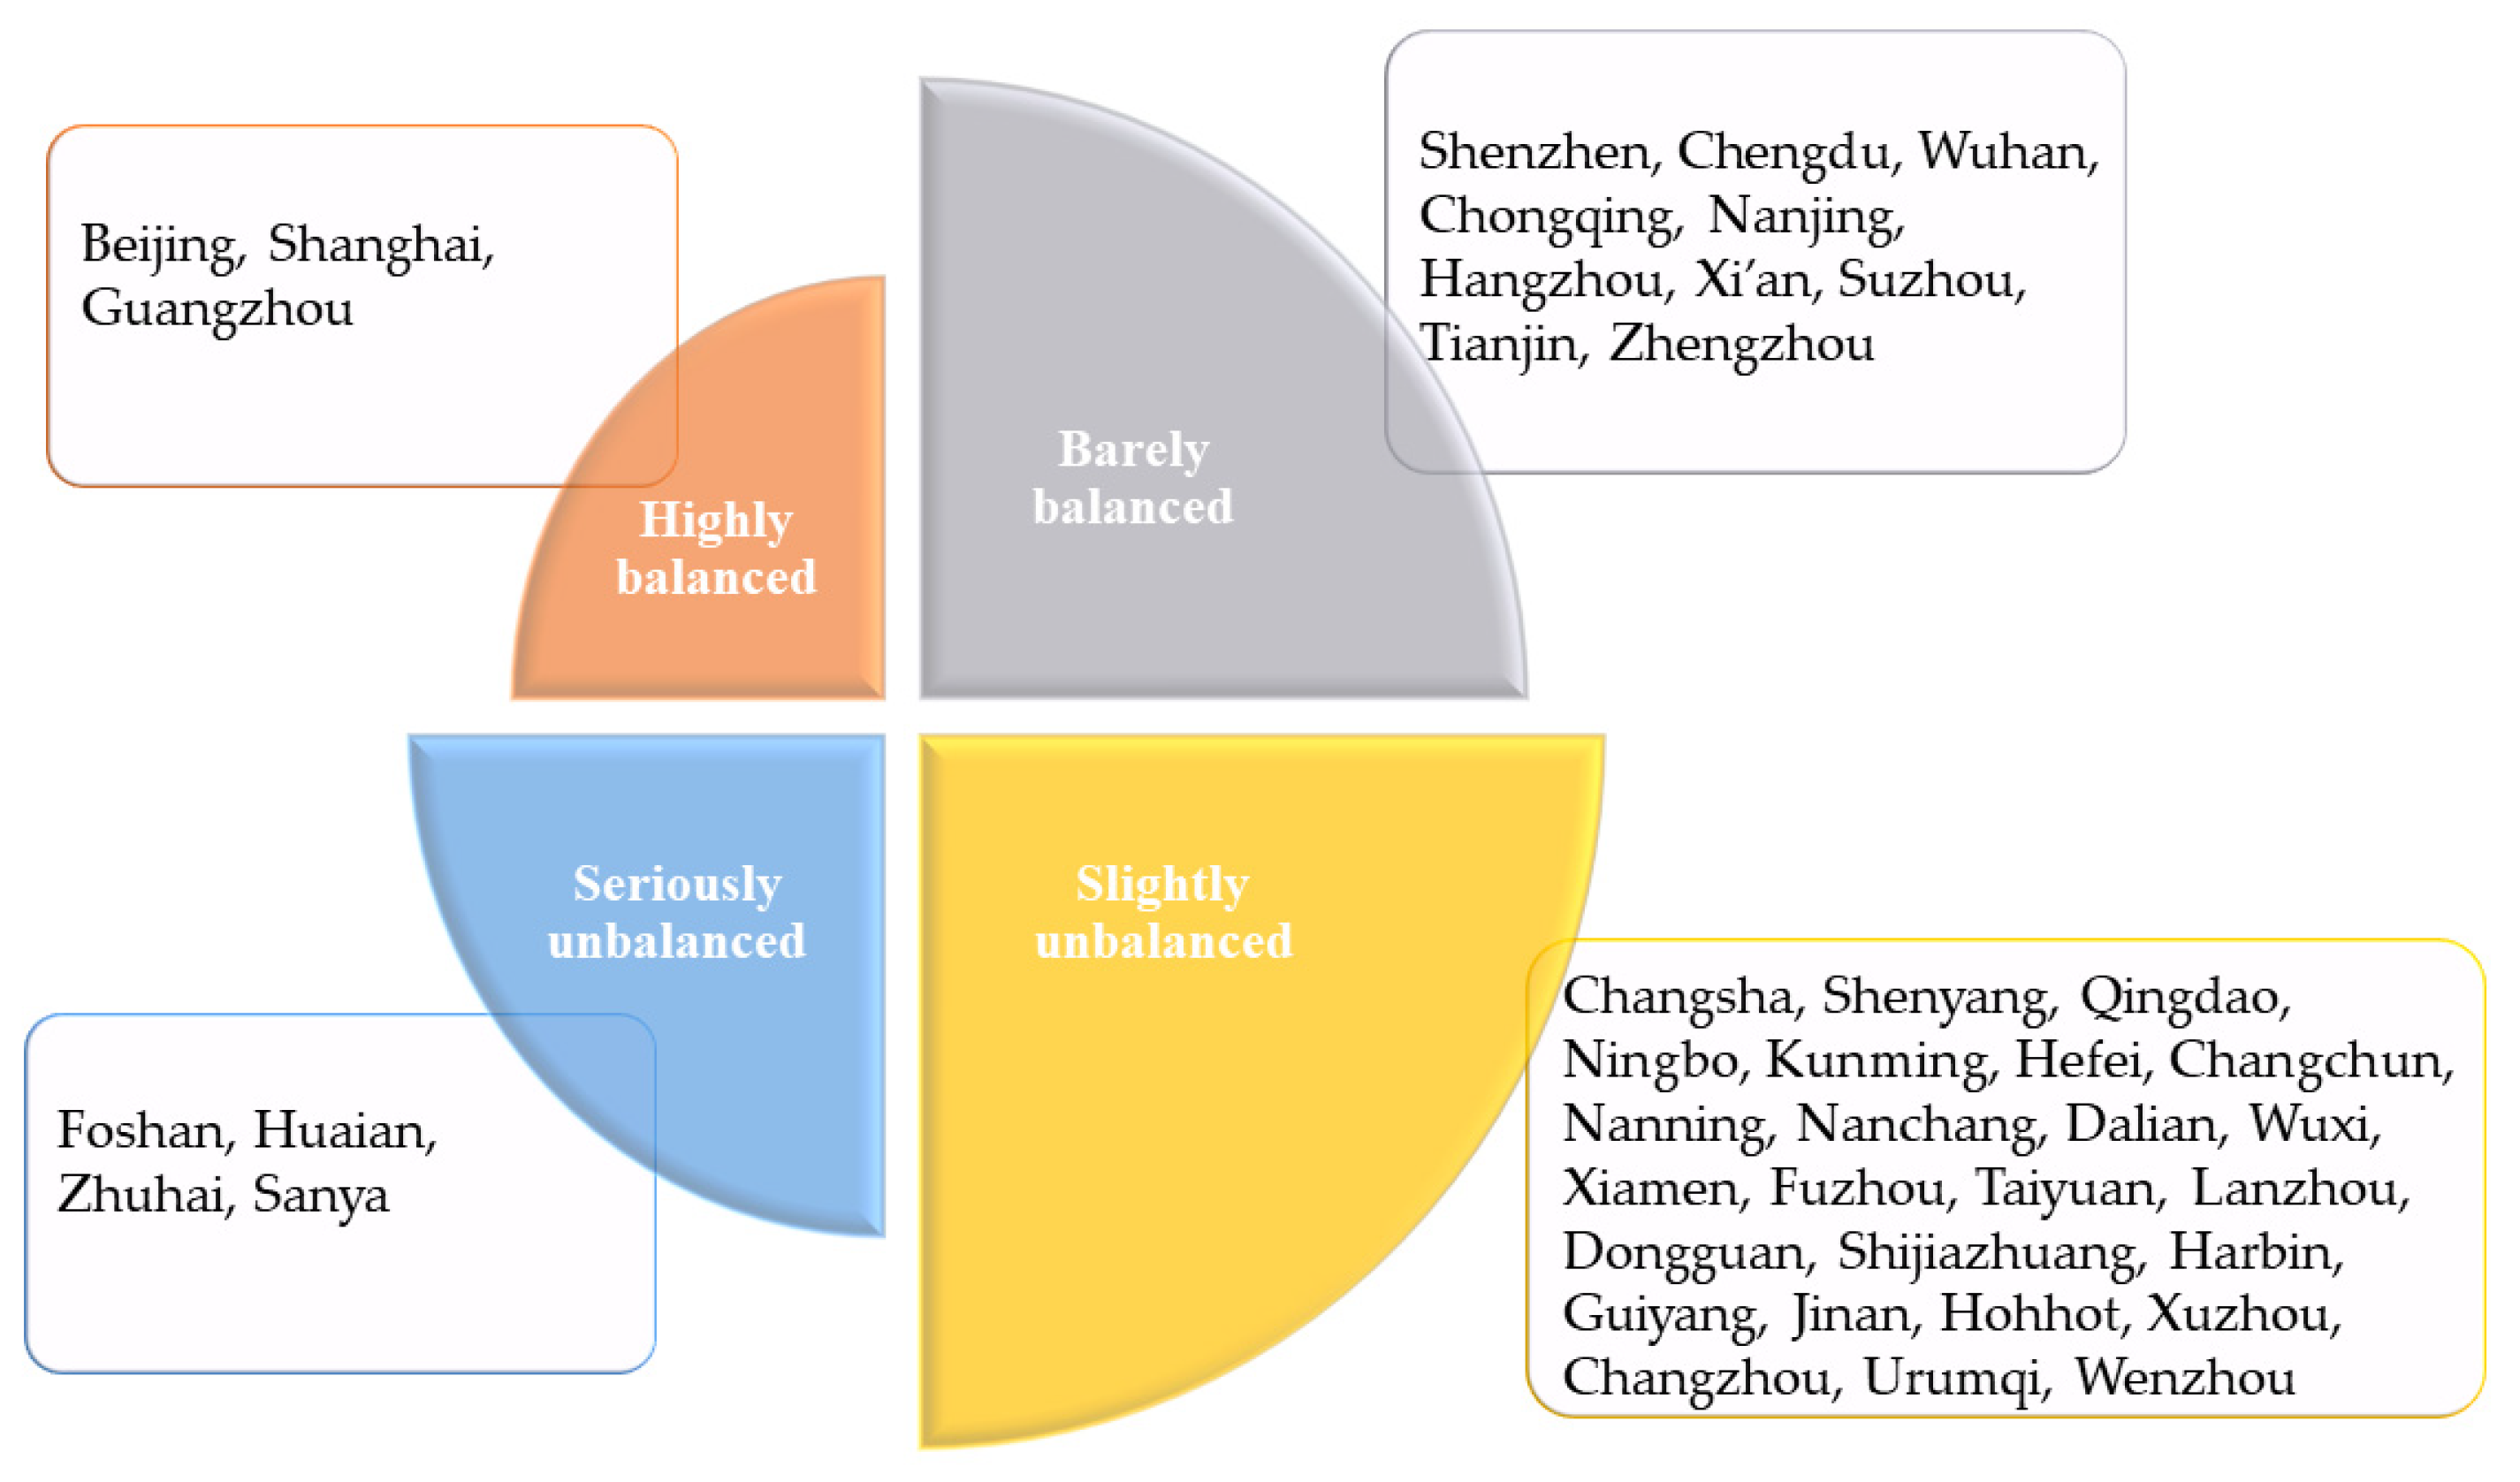
From Table 6, it can be seen that the average coupling coordination of the two systems is 0.4406. Beijing has the highest coupling coordination of the two systems and Sanya ranks last with 0.1664. Combined with Table 1, it can be found that Beijing, Shanghai and Guangzhou are highly balanced, and 10 cities, such as Shenzhen and Chengdu, belong to the next level, named a lower level of barely balanced. Further, 25 cities, including Changsha and Shenyang, enter the slightly unbalanced level. The remaining four cities belong to the severely unbalanced level. It shows significant differences in URT and SUD’s coupling and coordination degree. The level of coupling and coordination needs to be improved. The coupling coordination degree values and TOPSIS values for each city are shown in Figure 2. As seen in Figure 2, the level of coupling coordination in most cities is directly proportional to the TOPSIS values in the two systems. The larger the TOPSIS values in the two systems of a city, the higher its coupling coordination.
4.4. Calculation Results of Influencing Factors of Coupling Coordination Degree
Diverse factors influence the coupling and coordination of URT and SUD. In order to further explore the driving factors in the coupling and coordination of the two systems, this paper uses the grey correlation model to study the driving factors of the coupling and coordination of URT development and SUD. The advantage of grey correlation analysis is that it can compare the differences in the degree of influence between different factors according to the degree of similarity of linear characteristics between different sequences by describing and analyzing the dynamics in the development process of the system, which can better reflect the differences between the influencing factors. The grey correlation analysis results between the two systems’ coupling coordination degree and the influencing factors are shown in Table 7. According to Equations (19)–(23), the grey correlation between the coupling coordination of the two systems and the influencing factors is calculated and the results are shown in Table 7.
As shown in Table 7, the correlation between the coupling coordination degree of URT development and SUD and each driver is above 0.5, indicating that each driver is closely related to the coupling coordination degree in both systems. From all the influencing factors, B21 has the highest value of coupled and coordinated grey correlation with URT development and SUD with a GRD value of 0.9628, followed by B16 and B24. This indicates that factors, such as resident population, income level and urban built-up area, significantly influence the level of coupled and coordinated URT and SUD. The National Population Development Plan (2016–2030) issued by the Chinese State Council also points out that the resident population has a more significant impact on the sustainable development of cities and that attention should be paid to the coordination of population and social development and compatibility with resources and environment. The GRD values of B17, B18 and B22 are ranked at the bottom, indicating that the sales area of houses and Road Surface Area Per Capita have less influence on the level of coupled coordination between URT development and SUD relative to other factors.
5. Discussion
According to the level and type of coupling and coordination in Table 1, 42 cities are divided into four major categories for further analysis, as shown in Figure 3.
- (1)
- Cities with highly balanced development in two systems: Beijing, Shanghai and Guangzhou. They opened their first URT in 1971, 1993 and 1997, respectively, ranking high among the cities in mainland China that have opened URT. Due to the early start for metro development, strong industrial and economic strength and the URT system after years of construction and development, these first-tier cities have been scaled up and networked with a high degree of SUD [63]. The raw data show that the scale of rail transit passenger volume, line length and the number of operating vehicles is more significant in this category compared to other cities. The URT system formed a complete road network structure. At the same time, the overall urban sustainability value is also ranked high, indicating that this category of cities has a higher level of URT development, SUD and coupled and coordinated development between the two, which is worthy of reference for other cities.
- (2)
- Cities with barely balanced development in two systems: This includes eight cities, such as Shenzhen, Chengdu, Wuhan and Chongqing. From Figure 2, it can be seen that although the coupling and coordination between URT development and SUD in Chongqing are high, the gap between the comprehensive evaluation value of the two is significant. It indicates that the URT development in Chongqing still needs to be improved. It should scientifically plan and reasonably design the URT system, further develop the rail transit network structure and improve the rail transit operation mode and service quality, so that the level of coupling and coordination between URT development and SUD can be improved. Some scholars have related findings and recommendations [64]. However, the passenger volume in Suzhou and Tianjin is not supported enough. The original data show that the average daily passenger volume of URT in Suzhou and Tianjin in 2020 is only 84.5 and 92.6 10,000 persons, which is low compared to other cities. Some scholars found that URT is not the most preferred mode of transportation for Tianjin residents due to high fares, general walkable neighborhoods and inconvenient old subway stations [65]. For Suzhou and Tianjin, the attractiveness of rail transit to passengers can be increased by adjusting URT fares and other means. In addition, non-green transportation, such as private cars or cabs, can be appropriately restricted, thus, promoting green transportation development. Other cities in this category, such as Shenzhen, Chengdu and Nanjing, have a relatively good scale of URT development, which is compatible with the city’s sustainable development and positively impacts the city’s sustainable development.
- (3)
- Cities with slightly unbalanced development in two systems: This includes 25 cities, including Changsha, Shenyang and Qingdao; the total number of cities in this category accounts for more than 50% of the total cities studied. These cities are at a low level of coordinated development on a national scale. They need to improve their lagging items to improve the coupling and coordination between URT and SUD at a higher level. Most cities are slightly unbalanced with lagging uA type, indicating that the current process of rail transit construction in most Chinese cities is still slow and unable to provide public solid transportation support for rapid socio-economic development [15]. For example, Dongguan and Jinan, two cities, are similar to Chongqing in category 2 and have a higher overall urban sustainability system rating value than their counterparts. This indicates that the level of URT development has not kept up with the development of the cities and there is still a lot of room and potential for development. Cities, such as Lanzhou and Shijiazhuang, have low SUD levels compared to their counterparts. They should develop a public transportation strategy compatible with urban social and environmental development and transportation construction, focus on improving the technical equipment and technical performance of the existing URT, as well as the operation mode and service quality, to further reduce exhaust emissions and noise pollution and improve the level of SUD.
- (4)
- Cities with seriously unbalanced development in two systems: Foshan, Huaian, Zhuhai and Sanya. Cities in this category are at a low level for urban rail development and sustainable urban development systems. Both have much room for improvement. As can be seen from Table 7, the resident population is the most crucial factor affecting the level of coordination between URT development and SUD coupling. Cities should formulate their development strategies according to the size of their population, that is, the public transport demand, for example, Foshan with a high resident population in this category. The managers should insist on developing urban public transportation with rail transit as the core, increase rail transit investment and policy preferences and cooperate with the introduction of corresponding local policies to improve the efficiency of local URT development to improve the level of coordination between URT and SUD coupling [20,66]. However, as China’s urbanization process has been accelerating in recent years, the original approval standards are increasingly not applicable to the current level of urban socio-economic development. In the future, with the continuous development of the economy and society, the approval system of URT construction planning also needs to be improved continuously to improve and enrich the corresponding approval standard and approval content to ensure the healthy and stable dynamic coordination between URT construction and SUD [11,67]. Huai’an, Zhuhai and Sanya ranked at the bottom among all cities regarding Gross Regional Product. That is, the economy of the cities cannot create a good economic environment for the development of URT. In the future, such cities should pay more attention to the development of the economy.
6. Conclusions
This study analyzed the coupled coordination level of URT development and SUD of 42 cities in China in 2020, through the established evaluation index system and coupled coordination degree model using the entropy power method, TOPSIS method and grey correlation analysis. The study results show that: (1) The development of URT systems and SUD in 42 cities in China differs significantly. (2) The average coupling coordination degree in the two systems is 0.4406 and more than half of the cities are in the slightly unbalanced category. (3) Factors, such as resident population, income level and urban built-up area, influence the level of coupling and coordination between URT and SUD. Through the respective comprehensive development indexes of URT and SUD, we can examine whether the urban development strongly supports rail transit construction and how effective the degree of rail transit construction and development is to urban development. Moreover, finally, we can also examine the degree of mutual coupling and coordination between rail transit and urban development. The study of this issue is of practical significance for evaluating the status of URT construction, guiding URT network planning and formulating URT development strategies. It can provide theoretical support for optimal urban management and SUD.
There are two limitations to this paper. Firstly, the selection of evaluation indicators needs to be further improved. In selecting evaluation indexes for URT and SUD systems, 33 indexes were selected from five dimensions in this paper. Although the selection of indicators is systematic and comprehensive, more evaluation indicators should be selected to improve the objectivity and authenticity of the research results. A more complete and representative evaluation system should be established by proposing a better selection method of indicators. In addition, this paper lacks a comparative analysis with other cities with mature rail transit construction and operation, such as New York, Paris, Tokyo and Moscow. A comparative analysis of the coordination of rail transit cities worldwide would be more helpful in increasing the persuasiveness of the article’s results. In the future, we can combine the spatial autocorrelation model to analyze the spatial correlation and spatial evolution characteristics of the coupled coordination degree of URT and SUD and further understand its unevenness in different regions. With the development of disciplinary integration, more advanced technologies can be introduced into the study of urban infrastructure. The study of urban infrastructure and development will be further explored. In addition, this approach can be adapted to accommodate rural, provincial, and even national and international infrastructure studies. These are the directions that should be improved and corrected in subsequent studies.
Author Contributions
Conceptualization, L.J., Further, F.W.; methodology, F.W., Further, Y.Z. (Yinghan Zhu); software, F.W.; validation, L.J.; formal analysis, F.L.; investigation, F.W., Further, Q.L.; resources, L.J.; data curation, F.L., Further, Y.Z. (Yinghan Zhu); writing—original draft preparation, F.W.; writing—review and editing, L.J., Y.Z. (Yinghan Zhu), Further, Y.Z. (Yu Zhang); visualization, F.L.; supervision, L.J.; project administration, L.J.; funding acquisition, L.J. All authors have read and agreed to the published version of the manuscript.
Funding
This research was funded by the National Natural Science Foundation of China (Grant No. 71901043), the Science and Technology Research Project of Chongqing Education Commission (Grant No. KJQN201900713) and the Postgraduate Research and Innovation Project of Chongqing Jiaotong University (Grant No. 2022S0063).
Institutional Review Board Statement
Not applicable.
Informed Consent Statement
Not applicable.
Data Availability Statement
Not applicable.
Conflicts of Interest
The authors declare no conflict of interest.
Appendix A

Table A1.
Data from URT System.
| City | Scale (A1) | Operation Status (A2) | ||||||
|---|---|---|---|---|---|---|---|---|
| A11 | A12 | A13 | A14 | A21 | A22 | A23 | A24 | |
| Beijing | 799.1 | 382 | 62 | 1108 | 10,367 | 626.9 | 0.78 | 67,257.0 |
| Shanghai | 834.2 | 432 | 65 | 1038 | 8337 | 779.0 | 1.07 | 64,317.1 |
| Tianjin | 238.8 | 157 | 15 | 224 | 1817 | 92.6 | 0.39 | 13,669.0 |
| Chongqing | 343.3 | 178 | 20 | 328 | 3427 | 229.4 | 0.67 | 23,469.9 |
| Guangzhou | 531.6 | 277 | 35 | 558 | 7073 | 660.2 | 1.19 | 41,422.4 |
| Shenzhen | 422.6 | 263 | 48 | 532 | 4677 | 479.4 | 1.13 | 34,584.8 |
| Wuhan | 387.5 | 254 | 29 | 493 | 3751 | 207.8 | 0.56 | 18,687.5 |
| Nanjing | 394.3 | 187 | 13 | 291 | 3140 | 218.0 | 0.58 | 21,207.0 |
| Shenyang | 211.5 | 157 | 13 | 180 | 1700 | 90.9 | 0.43 | 8125.0 |
| Changchun | 117.7 | 119 | 8 | 134 | 1425 | 43.3 | 0.43 | 3621.7 |
| Dalian | 181.3 | 106 | 3 | 114 | 1162 | 34.1 | 0.22 | 5379.1 |
| Chengdu | 652.0 | 327 | 46 | 672 | 5062 | 399.2 | 0.72 | 29,226.5 |
| Xi’an | 239.0 | 154 | 13 | 321 | 3437 | 247.6 | 1.04 | 15,631.6 |
| Harbin | 30.3 | 26 | 1 | 31 | 485 | 14.0 | 0.46 | 1603.0 |
| Suzhou | 210.1 | 151 | 9 | 221 | 2198 | 84.5 | 0.40 | 12,100.5 |
| Zhengzhou | 244.0 | 133 | 17 | 175 | 1547 | 111.9 | 0.56 | 8217.6 |
| Kunming | 139.4 | 83 | 9 | 122 | 1166 | 51.2 | 0.37 | 5523.4 |
| Hangzhou | 300.6 | 169 | 20 | 325 | 2862 | 179.4 | 0.60 | 15,506.3 |
| Foshan | 28.1 | 25 | 0 | 5 | 75 | 0.1 | 0.01 | 37.6 |
| Changsha | 157.9 | 95 | 12 | 152 | 1736 | 122.0 | 0.77 | 8305.7 |
| Ningbo | 154.3 | 97 | 6 | 150 | 1523 | 59.9 | 0.39 | 6183.1 |
| Wuxi | 87.1 | 66 | 3 | 75 | 780 | 29.7 | 0.34 | 3318.5 |
| Nanchang | 88.9 | 70 | 4 | 105 | 920 | 50.8 | 0.57 | 3883.7 |
| Lanzhou | 86.9 | 26 | 0 | 26 | 270 | 14.3 | 0.55 | 1320.2 |
| Qingdao | 255.0 | 119 | 4 | 191 | 1728 | 44.6 | 0.18 | 7340.3 |
| Huaian | 20.1 | 23 | 0 | 26 | 203 | 1.9 | 0.10 | 565.4 |
| Fuzhou | 58.5 | 45 | 1 | 59 | 482 | 25.9 | 0.44 | 2937.8 |
| Dongguan | 37.8 | 15 | 0 | 20 | 259 | 9.6 | 0.25 | 2040.7 |
| Nanning | 108.0 | 80 | 7 | 103 | 1181 | 61.2 | 0.57 | 5595.3 |
| Hefei | 112.5 | 80 | 3 | 122 | 1255 | 56.1 | 0.50 | 6739.1 |
| Shijiazhuang | 59.0 | 48 | 3 | 68 | 696 | 23.0 | 0.39 | 2394.5 |
| Guiyang | 34.8 | 25 | 0 | 34 | 276 | 10.1 | 0.29 | 1888.4 |
| Xiamen | 71.9 | 55 | 1 | 86 | 687 | 21.1 | 0.43 | 4691.1 |
| Zhuhai | 8.8 | 14 | 0 | 12 | 93 | 0.3 | 0.03 | 24.2 |
| Urumqi | 26.8 | 21 | 0 | 27 | 244 | 7.3 | 0.22 | 869.8 |
| Wenzhou | 53.5 | 18 | 0 | 18 | 189 | 2.1 | 0.04 | 1219.3 |
| Jinan | 47.7 | 24 | 0 | 42 | 486 | 2.4 | 0.05 | 2001.2 |
| Changzhou | 34.2 | 29 | 0 | 28 | 228 | 6.2 | 0.18 | 1694.6 |
| Xuzhou | 46.0 | 37 | 1 | 47 | 491 | 12.1 | 0.26 | 1126.4 |
| Hohhot | 49.0 | 43 | 1 | 52 | 435 | 11.3 | 0.23 | 1348.9 |
| Sanya | 8.4 | 15 | 0 | 11 | 157 | 0.3 | 0.03 | 11.0 |
| Taiyuan | 23.6 | 22 | 0 | 16 | 258 | 14.8 | 0.62 | 22.8 |
Table A2.
Data on the economic dimension of the SUD system.
| City | Economic (B1) | |||||||
|---|---|---|---|---|---|---|---|---|
| B11 | B12 | B13 | B14 | B15 | B16 | B17 | B18 | |
| Beijing | 164,889 | 827,343.8 | 3028 | 62,660.6 | 7,399,399 | 185,026 | 0.44 | 0.34 |
| Shanghai | 155,800 | 584,114.4 | 8804 | 64,037.4 | 6,455,623 | 174,678 | 0.72 | 0.58 |
| Tianjin | 101,614 | 238,194.9 | 5120 | 25,832.1 | 2,553,324 | 118,918 | 0.94 | 0.88 |
| Chongqing | 78,173 | 128,607.7 | 6938 | 36,731.7 | 3,708,338 | 98,380 | 1.91 | 1.50 |
| Guangzhou | 135,047 | 350,135.9 | 6208 | 49,192.4 | 4,193,638 | 135,138 | 0.82 | 0.65 |
| Shenzhen | 159,309 | 539,404.1 | 11,255 | 49,148.2 | 5,052,706 | 139,436 | 0.53 | 0.44 |
| Wuhan | 131,441 | 245,978.5 | 2958 | 49,877.1 | 1,763,564 | 107,567 | 2.15 | 1.83 |
| Nanjing | 159,322 | 419,056.5 | 3231 | 77,285.8 | 2,161,081 | 138,005 | 1.42 | 1.30 |
| Shenyang | 75,570 | 212,487.6 | 1592 | 40,106.1 | 1,184,237 | 95,908 | 1.52 | 1.42 |
| Changchun | 77,634 | 156,071.7 | 1214 | 22,085.0 | 1,102,433 | 92,905 | 1.16 | 1.03 |
| Dalian | 94,685 | 208,221.5 | 1898 | 24,536.9 | 1,047,641 | 98,812 | 0.96 | 0.84 |
| Chengdu | 85,679 | 201,745.0 | 3664 | 38,752.0 | 11,433,200 | 104,463 | 1.76 | 1.35 |
| Xi’an | 79,181 | 198,537.9 | 1667 | 38,497.9 | 2,135,688 | 104,363 | 1.98 | 1.61 |
| Harbin | 54,570 | 137,356.2 | 1196 | 22,213.8 | 1,070,519 | 84,796 | 0.77 | 0.68 |
| Suzhou | 158,466 | 275,809.3 | 11,900 | 60,407.7 | 2,974,094 | 113,744 | 1.72 | 1.56 |
| Zhengzhou | 96,134 | 198,053.3 | 2295 | 40,224.3 | 2,139,900 | 89,464 | 2.71 | 2.40 |
| Kunming | 80,584 | 192,962.8 | 997 | 36,293.6 | 1,126,367 | 102,304 | 2.22 | 1.80 |
| Hangzhou | 136,617 | 433,525.8 | 5992 | 50,588.7 | 2,923,541 | 132,188 | 1.42 | 1.23 |
| Foshan | 114,157 | 197,293.4 | 8020 | 34,549.3 | 1,513,137 | 94,536 | 2.27 | 1.78 |
| Changsha | 123,297 | 228,695.5 | 2912 | 44,431.0 | 1,425,867 | 105,603 | 2.37 | 2.04 |
| Ningbo | 132,614 | 245,930.8 | 8571 | 44,992.2 | 1,647,943 | 111,286 | 1.97 | 1.67 |
| Wuxi | 165,851 | 252,918.4 | 7006 | 40,138.8 | 1,254,021 | 115,748 | 2.08 | 1.83 |
| Nanchang | 92,697 | 216,082.5 | 1553 | 39,181.1 | 1,239,463 | 93,774 | 2.83 | 2.18 |
| Lanzhou | 66,680 | 206,974.1 | 371 | 37,557.0 | 785,040 | 93,847 | 1.94 | 1.83 |
| Qingdao | 123,828 | 196,061.3 | 3856 | 51,468.8 | 1,477,012 | 116,115 | 1.64 | 1.41 |
| Huaian | 87,507 | 106,403.6 | 1486 | 36,751.2 | 449,447 | 83,216 | 2.03 | 1.85 |
| Fuzhou | 121,015 | 208,930.1 | 2662 | 50,788.5 | 1,561,135 | 96,478 | 2.27 | 1.83 |
| Dongguan | 92,176 | 166,416.8 | 11,525 | 35,688.4 | 2,863,056 | 79,601 | 0.84 | 0.73 |
| Nanning | 54,669 | 131,408.6 | 1155 | 24,918.4 | 1,097,670 | 97,079 | 2.10 | 1.70 |
| Hefei | 108,427 | 195,269.3 | 2150 | 48,172.5 | 1,729,908 | 104,818 | 1.59 | 1.38 |
| Shijiazhuang | 52,961 | 146,692.9 | 2183 | 21,198.0 | 1,050,390 | 84,870 | 0.58 | 0.55 |
| Guiyang | 72,246 | 208,433.6 | 764 | 36,531.9 | 1,132,677 | 101,829 | 2.07 | 1.85 |
| Xiamen | 123,962 | 242,343.2 | 2420 | 44,283.2 | 1,267,026 | 108,554 | 1.20 | 0.73 |
| Zhuhai | 145,645 | 382,989.0 | 1492 | 37,602.5 | 843,819 | 107,284 | 1.97 | 1.71 |
| Urumqi | 82,314 | 237,147.1 | 445 | 25,765.7 | 819,995 | 98,907 | 1.80 | 1.60 |
| Wenzhou | 71,766 | 156,746.2 | 6724 | 36,473.3 | 330,442 | 96,775 | 1.26 | 1.09 |
| Jinan | 110,199 | 224,188.0 | 2215 | 48,367.2 | 1,549,779 | 108,391 | 1.45 | 1.24 |
| Changzhou | 147,939 | 231,317.3 | 5065 | 45,859.1 | 671,577 | 113,273 | 1.97 | 1.66 |
| Xuzhou | 80,673 | 100,682.7 | 2024 | 36,190.4 | 747,702 | 86,138 | 1.83 | 1.74 |
| Hohhot | 81,656 | 177,279.5 | 252 | 29,940.1 | 437,896 | 89,549 | 1.20 | 1.11 |
| Sanya | 68,656 | 156,830.0 | 33 | 36,639.2 | 151,084 | 93,152 | 0.74 | 0.63 |
| Taiyuan | 78,734 | 267,151.7 | 622 | 31,111.1 | 1,013,630 | 88,650 | 1.48 | 1.32 |
Table A3.
Data on the social dimension of the SUD system.
| City | Social (B2) | |||||||
|---|---|---|---|---|---|---|---|---|
| B21 | B22 | B23 | B24 | B25 | B26 | B27 | B28 | |
| Beijing | 2189 | 7.67 | 10.94 | 1469.00 | 15,018,987 | 54.50 | 590,335 | 17,778,150 |
| Shanghai | 2488 | 4.76 | 7.10 | 1237.85 | 4,737,785 | 57.73 | 540,693 | 16,166,700 |
| Tianjin | 1387 | 14.91 | 8.94 | 1170.24 | 4,472,897 | 44.36 | 572,152 | 7,308,300 |
| Chongqing | 3209 | 14.65 | 2.97 | 1565.61 | 9,735,406 | 54.52 | 915,556 | 12,033,548 |
| Guangzhou | 1874 | 13.82 | 8.32 | 1350.40 | 3,571,356 | 49.66 | 1,307,144 | 8,204,077 |
| Shenzhen | 1763 | 9.11 | 21.76 | 955.68 | 5,053,281 | 32.70 | 109,986 | 12,685,530 |
| Wuhan | 1233 | 15.62 | 7.78 | 885.11 | 7,052,843 | 65.88 | 1,067,206 | 5,310,300 |
| Nanjing | 932 | 25.00 | 9.39 | 868.28 | 5,940,046 | 61.65 | 918,141 | 3,376,045 |
| Shenyang | 907 | 15.02 | 6.63 | 567.00 | 1,554,961 | 74.98 | 440,146 | 4,417,422 |
| Changchun | 907 | 16.80 | 5.55 | 550.96 | 1,662,945 | 64.98 | 483,034 | 2,761,830 |
| Dalian | 745 | 15.93 | 7.67 | 444.04 | 1,035,177 | 60.96 | 325,738 | 2,198,977 |
| Chengdu | 2095 | 18.70 | 7.01 | 977.12 | 9,857,289 | 61.05 | 927,111 | 9,607,500 |
| Xi’an | 1296 | 18.23 | 7.22 | 700.69 | 8,417,443 | 51.32 | 783,893 | 5,383,600 |
| Harbin | 1001 | 16.01 | 7.21 | 473.00 | 2,030,700 | 76.82 | 591,940 | 2,754,830 |
| Suzhou | 1275 | 26.92 | 4.98 | 481.33 | 3,094,452 | 49.89 | 263,246 | 5,978,357 |
| Zhengzhou | 1262 | 9.61 | 5.00 | 640.80 | 4,958,199 | 72.69 | 1,160,303 | 5,682,800 |
| Kunming | 846 | 12.58 | 7.79 | 482.80 | 1,635,613 | 68.90 | 697,961 | 2,058,113 |
| Hangzhou | 1197 | 12.42 | 8.48 | 666.18 | 8,801,127 | 70.39 | 465,963 | 7,515,404 |
| Foshan | 952 | 17.43 | 7.30 | 162.35 | 1,368,576 | 37.66 | 146,297 | 3,413,009 |
| Changsha | 1006 | 22.29 | 11.79 | 409.51 | 4,016,368 | 66.81 | 697,407 | 4,160,672 |
| Ningbo | 942 | 18.58 | 6.49 | 377.87 | 3,229,396 | 40.79 | 168,310 | 4,873,849 |
| Wuxi | 746 | 27.15 | 4.07 | 349.55 | 1,483,873 | 57.48 | 133,163 | 4,141,800 |
| Nanchang | 626 | 11.34 | 7.00 | 366.02 | 1,844,746 | 61.98 | 687,852 | 2,224,822 |
| Lanzhou | 437 | 21.95 | 7.30 | 329.10 | 740,340.7 | 65.11 | 390,906 | 1,075,717 |
| Qingdao | 1011 | 19.10 | 8.46 | 758.16 | 2,805,832 | 61.77 | 430,671 | 4,772,874 |
| Huaian | 456 | 23.38 | 4.16 | 208.00 | 172,150.5 | 43.30 | 49,222 | 944,369 |
| Fuzhou | 832 | 13.44 | 5.91 | 305.30 | 2,804,912 | 41.46 | 363,738 | 2,215,488 |
| Dongguan | 1048 | 11.13 | 5.61 | 1194.31 | 1,131,446 | 31.39 | 134,546 | 5,809,506 |
| Nanning | 875 | 20.44 | 4.19 | 326.70 | 2,035,307 | 48.77 | 568,756 | 1,880,246 |
| Hefei | 937 | 18.76 | 6.68 | 502.50 | 2,967,805 | 63.26 | 586,170 | 2,877,855 |
| Shijiazhuang | 1124 | 18.83 | 3.71 | 311.83 | 1,041,077 | 49.53 | 583,472 | 2,804,498 |
| Guiyang | 599 | 16.73 | 4.90 | 369.00 | 1,614,016 | 61.23 | 440,212 | 2,542,439 |
| Xiamen | 518 | 17.67 | 8.33 | 401.94 | 2,077,884 | 35.21 | 169,288 | 3,180,800 |
| Zhuhai | 245 | 12.93 | 10.07 | 152.85 | 1,023,091 | 41.09 | 143,778 | 1,468,847 |
| Urumqi | 405 | 19.68 | 11.01 | 521.60 | 618,179 | 74.98 | 237,556 | 1,596,259 |
| Wenzhou | 959 | 16.72 | 2.84 | 275.87 | 1,455,280 | 40.33 | 120,734 | 3,403,512 |
| Jinan | 924 | 19.67 | 8.63 | 793.65 | 3,349,288 | 63.63 | 687,878 | 4,373,163 |
| Changzhou | 528 | 25.74 | 4.59 | 277.29 | 1,012,432 | 45.19 | 145,032 | 1,716,587 |
| Xuzhou | 908 | 23.43 | 3.07 | 289.64 | 1,402,594 | 45.85 | 145,857 | 2,138,916 |
| Hohhot | 345 | 14.30 | 8.29 | 272.16 | 1,062,088 | 54.26 | 248,552 | 924,255 |
| Sanya | 104 | 17.48 | 10.74 | 51.63 | 194,063.6 | 45.20 | 60,798 | 364,160 |
| Taiyuan | 532 | 17.70 | 7.00 | 340.00 | 1,283,156 | 78.61 | 482,167 | 1,741,964 |
Table A4.
Data on the environmental dimension of the SUD system.
| City | Environmental (B3) | ||||||||
|---|---|---|---|---|---|---|---|---|---|
| B31 | B32 | B33 | B34 | B35 | B36 | B37 | B38 | B39 | |
| Beijing | 38 | 4 | 29 | 276 | 154.19 | 42.34 | 847.02 | 96.56% | 16,775.08 |
| Shanghai | 32 | 6 | 37 | 319 | 203.92 | 66.16 | 361.34 | 96.68% | 18,699.42 |
| Tianjin | 48 | 8 | 39 | 245 | 115.69 | 31.51 | 433.72 | 96.42% | 13,287.01 |
| Chongqing | 53 | 8 | 39 | 135 | 179.80 | 22.03 | 163.97 | 98.17% | 22,754.62 |
| Guangzhou | 23 | 7 | 36 | 331 | 316.25 | 78.87 | 144.14 | 97.90% | 24,458.15 |
| Shenzhen | 19 | 6 | 23 | 355 | 230.02 | 55.12 | 193.52 | 98.11% | 26,706.00 |
| Wuhan | 37 | 8 | 36 | 309 | 234.23 | 26.60 | 202.31 | 97.00% | 21,171.79 |
| Nanjing | 31 | 7 | 36 | 304 | 296.54 | 100.33 | 150.95 | 97.90% | 8628.71 |
| Shenyang | 42 | 18 | 35 | 287 | 196.68 | 26.50 | 73.20 | 98.94% | 15,741.33 |
| Changchun | 42 | 10 | 32 | 305 | 150.13 | 48.82 | 95.50 | 95.69% | 6975.00 |
| Dalian | 30 | 10 | 25 | 332 | 153.63 | 51.41 | 68.88 | 98.78% | 7309.40 |
| Chengdu | 41 | 6 | 37 | 280 | 280.44 | 17.34 | 165.75 | 97.62% | 16,623.68 |
| Xi’an | 51 | 8 | 41 | 250 | 177.70 | 27.34 | 249.02 | 96.66% | 12,268.13 |
| Harbin | 47 | 17 | 32 | 303 | 141.07 | 15.34 | 71.27 | 95.23% | 9742.00 |
| Suzhou | 31 | 8 | 34 | 307 | 261.04 | 18.51 | 101.62 | 96.84% | 11,332.25 |
| Zhengzhou | 51 | 9 | 39 | 230 | 128.95 | 20.34 | 122.05 | 98.51% | 7578.32 |
| Kunming | 24 | 9 | 25 | 366 | 157.99 | 22.33 | 38.71 | 98.89% | 8059.64 |
| Hangzhou | 30 | 6 | 38 | 334 | 244.82 | 41.41 | 161.16 | 97.11% | 11,171.93 |
| Foshan | 22 | 7 | 31 | 333 | 335.81 | 7.68 | 115.16 | 100.34% | 4381.10 |
| Changsha | 41 | 6 | 28 | 309 | 277.33 | 14.39 | 79.11 | 98.40% | 5187.20 |
| Ningbo | 23 | 8 | 32 | 340 | 250.14 | 17.52 | 120.06 | 99.73% | 5153.57 |
| Wuxi | 33 | 7 | 35 | 299 | 196.22 | 26.66 | 150.28 | 98.92% | 4645.00 |
| Nanchang | 33 | 9 | 29 | 335 | 219.78 | 23.66 | 78.49 | 98.84% | 5242.04 |
| Lanzhou | 34 | 15 | 47 | 312 | 174.12 | 22.24 | 396.43 | 96.35% | 5065.99 |
| Qingdao | 31 | 7 | 31 | 315 | 142.91 | 41.37 | 129.32 | 98.20% | 7489.70 |
| Huaian | 42 | 7 | 25 | 294 | 155.62 | 20.50 | 62.98 | 95.76% | 3396.38 |
| Fuzhou | 21 | 5 | 21 | 364 | 224.16 | 15.63 | 34.39 | 96.88% | 4535.36 |
| Dongguan | 24 | 8 | 27 | 334 | 168.75 | 70.65 | 115.56 | 96.21% | 20,855.68 |
| Nanning | 31 | 8 | 24 | 357 | 314.12 | 16.25 | 35.52 | 100.00% | 8175.72 |
| Hefei | 36 | 7 | 39 | 310 | 243.82 | 21.63 | 122.49 | 97.75% | 8149.00 |
| Shijiazhuang | 58 | 12 | 41 | 205 | 122.22 | 13.10 | 128.35 | 99.30% | 7551.20 |
| Guiyang | 41 | 10 | 18 | 362 | 216.50 | 33.21 | 72.13 | 98.09% | 5709.00 |
| Xiamen | 18 | 6 | 19 | 365 | 197.95 | 45.69 | 63.11 | 100.00% | 4965.46 |
| Zhuhai | 19 | 5 | 24 | 342 | 292.69 | 127.58 | 69.24 | 96.81% | 6256.92 |
| Urumqi | 47 | 9 | 42 | 279 | 134.92 | 81.90 | 700.23 | 99.20% | 5034.00 |
| Wenzhou | 23 | 6 | 30 | 355 | 235.00 | 10.05 | 32.56 | 98.12% | 3716.18 |
| Jinan | 47 | 12 | 35 | 227 | 126.00 | 31.61 | 164.84 | 99.23% | 8934.00 |
| Changzhou | 39 | 9 | 35 | 295 | 234.95 | 23.81 | 287.03 | 98.06% | 3528.00 |
| Xuzhou | 50 | 10 | 35 | 261 | 167.87 | 19.12 | 73.53 | 94.95% | 3586.98 |
| Hohhot | 40 | 18 | 39 | 294 | 89.24 | 45.46 | 174.01 | 98.94% | 5189.82 |
| Sanya | 11 | 4 | 9 | 365 | 399.16 | 20.90 | 82.91 | 96.44% | 1825.00 |
| Taiyuan | 54 | 23 | 48 | 224 | 150.50 | 26.32 | 174.89 | 103.24% | 6568.80 |
References
- Zhang, X.; Han, L.; Wei, H.; Tan, X.; Zhou, W.; Li, W.; Qian, Y. Linking urbanization and air quality together: A review and a perspective on the future sustainable urban development. J. Clean. Prod. 2022, 346, 130988. [Google Scholar] [CrossRef]
- Gu, D.; Andreev, K.; Dupre, M.E. Major Trends in Population Growth Around the World. China CDC Wkly. 2021, 3, 604–613. [Google Scholar] [CrossRef] [PubMed]
- Cengiz, S.; Görmüş, S.; Oğuz, D. Analysis of the urban growth pattern through spatial metrics; Ankara City. Land Use Policy 2022, 112, 105812. [Google Scholar] [CrossRef]
- Fan, Y.; Fang, C. Evolution process analysis of urban metabolic patterns and sustainability assessment in western China, a case study of Xining city. Ecol. Indic. 2019, 109, 105784. [Google Scholar] [CrossRef]
- Chen, Y.; Zhao, L. Exploring the relation between the industrial structure and the eco-environment based on an integrated approach: A case study of Beijing, China. Ecol. Indic. 2019, 103, 83–93. [Google Scholar] [CrossRef]
- Buzási, A.; Jäger, B.S. District-scale assessment of urban sustainability. Sustain. Cities Soc. 2020, 62, 102388. [Google Scholar] [CrossRef]
- Kaur, H.; Garg, P. Urban sustainability assessment tools: A review. J. Clean. Prod. 2019, 210, 146–158. [Google Scholar] [CrossRef]
- Taecharungroj, V. An analysis of tripadvisor reviews of 127 urban rail transit networks worldwide. Travel Behav. Soc. 2021, 26, 193–205. [Google Scholar] [CrossRef]
- United Nations. Transforming Our World: The 2030 Agenda for Sustainable Development. 2015, pp. 1–41. Available online: https://sdgs.un.org/2030agenda (accessed on 25 July 2022).
- International Energy Agency. Data, Data Browser, Explore Energy Data by Category, Indicator, Country or Region; Countries & Regions—IEA; International Energy Agency: Paris, France, 2019. [Google Scholar]
- Lin, D.; Nelson, J.D.; Beecroft, M.; Cui, J. An overview of recent developments in China’s metro systems. Tunn. Undergr. Space Technol. 2021, 111, 103783. [Google Scholar] [CrossRef]
- Yin, D.; Huang, W.; Shuai, B.; Liu, H.; Zhang, Y. Structural characteristics analysis and cascading failure impact analysis of urban rail transit network: From the perspective of multi-layer network. Reliab. Eng. Syst. Saf. 2021, 218, 108161. [Google Scholar] [CrossRef]
- Wang, Y.; Li, M.; Zhou, J.; Zheng, H. Sudden passenger flow characteristics and congestion control based on intelligent urban rail transit network. Neural Comput. Appl. 2021, 34, 6615–6624. [Google Scholar] [CrossRef]
- Li, X.; Love, P.E. Procuring urban rail transit infrastructure by integrating land value capture and public-private partnerships: Learning from the cities of Delhi and Hong Kong. Cities 2021, 122, 103545. [Google Scholar] [CrossRef]
- Wen, S.; Shi, J.; Zhang, W. Impact of Urban Rail Transit Network on Residential and Commercial Land Values in China: A Complex Network Perspective. Complexity 2021, 2021, 8849066. [Google Scholar] [CrossRef]
- Meng, R.; Mao, B.; Xu, Q.; Yang, Y. Evaluation of Public Welfare Level of Urban Rail Transit considering Operation Management. J. Adv. Transp. 2022, 2022, 1245639. [Google Scholar] [CrossRef]
- Zhang, J.; Wang, Z.; Wang, S.; Shao, W.; Zhao, X.; Liu, W. Vulnerability assessments of weighted urban rail transit networks with integrated coupled map lattices. Reliab. Eng. Syst. Saf. 2021, 214, 107707. [Google Scholar] [CrossRef]
- Yang, L.; Chen, Y.; Xu, N.; Zhao, R.; Chau, K.; Hong, S. Place-varying impacts of urban rail transit on property prices in Shenzhen, China: Insights for value capture. Sustain. Cities Soc. 2020, 58, 102140. [Google Scholar] [CrossRef]
- Sun, Y.; Cui, Y. Analyzing the Coupling Coordination among Economic, Social, and Environmental Benefits of Urban Infrastructure: Case Study of Four Chinese Autonomous Municipalities. Math. Probl. Eng. 2018, 2018, 8280328. [Google Scholar] [CrossRef]
- Wang, Z.; Li, X.; Bobylev, N.; Li, S.; Liu, J. Coupling Coordination of “Urban Rail Transit—Social Economy” Composite System. Infrastructures 2022, 7, 56. [Google Scholar] [CrossRef]
- Xu, T.; Zhang, M.; Aditjandra, P.T. The impact of urban rail transit on commercial property value: New evidence from Wuhan, China. Transp. Res. Part A Policy Pract. 2016, 91, 223–235. [Google Scholar] [CrossRef] [Green Version]
- Gao, Y.; Zhang, Y.; Alsulaiman, H. Spatial structure system of land use along urban rail transit based on GIS spatial clustering. Eur. J. Remote Sens. 2020, 54, 438–445. [Google Scholar] [CrossRef]
- Ko, K.; Cao, X. The Impact of Hiawatha Light Rail on Commercial and Industrial Property Values in Minneapolis. J. Public Transp. 2013, 16, 47–66. [Google Scholar] [CrossRef] [Green Version]
- Pacheco-Raguz, I.F. Assessing the impacts of Light Rail Transit an urban land in Manila. J. Transp. Land Use 2010, 3, 113–138. [Google Scholar] [CrossRef] [Green Version]
- Wu, J. Study on the Model of Integrated Urban Rail Transit Hub Transfer Site Layout. Appl. Mech. Mater. 2013, 401–403, 2133–2138. [Google Scholar] [CrossRef]
- Liu, W.; Wang, J. Evaluation of coupling coordination degree between urban rail transit and land use. Int. J. Commun. Syst. 2019, 34, e4015. [Google Scholar] [CrossRef]
- Xia, X.; Li, H.; Kuang, X.; Strauss, J. Spatial–Temporal Features of Coordination Relationship between Regional Urbanization and Rail Transit—A Case Study of Beijing. Int. J. Environ. Res. Public Health 2021, 19, 212. [Google Scholar] [CrossRef] [PubMed]
- Hou, Q.; Xing, Y.; Wang, D.; Liu, J.; Fan, X.; Duan, Y. Study on coupling degree of rail transit capacity and land use based on multivariate data from cloud platform. J. Cloud Comput. Adv. Syst. Appl. 2020, 9, 4. [Google Scholar] [CrossRef]
- Jingjing, C.; Changjiang, Z.; Ming, Y. Research on Rail Transit Network System and its Connection Model in the Metropolitan Area. Procedia Soc. Behav. Sci. 2013, 96, 1286–1292. [Google Scholar] [CrossRef] [Green Version]
- Rodríguez, D.A.; Kang, C.-D. A typology of the built environment around rail stops in the global transit-oriented city of Seoul, Korea. Cities 2020, 100, 102663. [Google Scholar] [CrossRef]
- Ferbrache, F.; Knowles, R.D. City boosterism and place-making with light rail transit: A critical review of light rail impacts on city image and quality. Geoforum 2017, 80, 103–113. [Google Scholar] [CrossRef]
- Li, Z.; Luo, Z.; Wang, Y.; Fan, G.; Zhang, J. Suitability evaluation system for the shallow geothermal energy implementation in region by Entropy Weight Method and TOPSIS method. Renew. Energy 2021, 184, 564–576. [Google Scholar] [CrossRef]
- Li, Y.; Zhang, Q.; Wang, L.; Liang, L. Regional environmental efficiency in China: An empirical analysis based on entropy weight method and non-parametric models. J. Clean. Prod. 2020, 276, 124147. [Google Scholar] [CrossRef]
- Wu, H.-W.; Li, E.-Q.; Sun, Y.-Y.; Dong, B.-T. Research on the operation safety evaluation of urban rail stations based on the improved TOPSIS method and entropy weight method. J. Rail Transp. Plan. Manag. 2021, 20, 100262. [Google Scholar] [CrossRef]
- Cunha-Zeri, G.; Guidolini, J.F.; Branco, E.A.; Ometto, J.P. How sustainable is the nitrogen management in Brazil? A sustainability assessment using the Entropy Weight Method. J. Environ. Manag. 2022, 316, 115330. [Google Scholar] [CrossRef] [PubMed]
- Li, J.; Yuan, W.; Qin, X.; Qi, X.; Meng, L. Coupling coordination degree for urban green growth between public demand and government supply in urban agglomeration: A case study from China. J. Environ. Manag. 2021, 304, 114209. [Google Scholar] [CrossRef] [PubMed]
- Gan, L.; Shi, H.; Hu, Y.; Lev, B.; Lan, H. Coupling coordination degree for urbanization city-industry integration level: Sichuan case. Sustain. Cities Soc. 2020, 58, 102136. [Google Scholar] [CrossRef]
- Toumi, O.; Le Gallo, J.; Ben Rejeb, J. Assessment of Latin American sustainability. Renew. Sustain. Energy Rev. 2017, 78, 878–885. [Google Scholar] [CrossRef]
- Xu, X.; Zhang, Z.; Long, T.; Sun, S.; Gao, J. Mega-city region sustainability assessment and obstacles identification with GIS–entropy–TOPSIS model: A case in Yangtze River Delta urban agglomeration, China. J. Clean. Prod. 2021, 294, 126147. [Google Scholar] [CrossRef]
- Li, Y.; Zhao, L.; Suo, J. Comprehensive Assessment on Sustainable Development of Highway Transportation Capacity Based on Entropy Weight and TOPSIS. Sustainability 2014, 6, 4685–4693. [Google Scholar] [CrossRef] [Green Version]
- Dolatabadi, A.M.; Masoumi, S.; Lakzian, E. Optimization variables of the injection of hot-steam into the non-equilibrium condensing flow using TOPSIS method. Int. Commun. Heat Mass Transf. 2021, 129, 105674. [Google Scholar] [CrossRef]
- Wątróbski, J.; Bączkiewicz, A.; Ziemba, E.; Sałabun, W. Sustainable cities and communities assessment using the DARIA-TOPSIS method. Sustain. Cities Soc. 2022, 83, 103926. [Google Scholar] [CrossRef]
- Yang, S.; Pan, Y.; Zeng, S. Decision making framework based Fermatean fuzzy integrated weighted distance and TOPSIS for green low-carbon port evaluation. Eng. Appl. Artif. Intell. 2022, 114, 105048. [Google Scholar] [CrossRef]
- Xing, L.; Xue, M.; Hu, M. Dynamic simulation and assessment of the coupling coordination degree of the economy–resource–environment system: Case of Wuhan City in China. J. Environ. Manag. 2018, 230, 474–487. [Google Scholar] [CrossRef] [PubMed]
- Li, L.; Fan, Z.; Feng, W.; Yuxin, C.; Keyu, Q. Coupling coordination degree spatial analysis and driving factor between socio-economic and eco-environment in northern China. Ecol. Indic. 2022, 135, 108555. [Google Scholar] [CrossRef]
- Li, X.; Lu, Z.; Hou, Y.; Zhao, G.; Zhang, L. The coupling coordination degree between urbanization and air environment in the Beijing(Jing)-Tianjin(Jin)-Hebei(Ji) urban agglomeration. Ecol. Indic. 2022, 137, 108787. [Google Scholar] [CrossRef]
- Liu, T.-L.; Song, Q.-J.; Lu, J.; Qi, Y. An integrated approach to evaluating the coupling coordination degree between low-carbon development and air quality in Chinese cities. Adv. Clim. Chang. Res. 2021, 12, 710–722. [Google Scholar] [CrossRef]
- Fei, J.; Lin, Y.; Jiang, Q.; Jiang, K.; Li, P.; Ye, G. Spatiotemporal coupling coordination measurement on islands’ economy-environment-tourism system. Ocean Coast. Manag. 2021, 212, 105793. [Google Scholar] [CrossRef]
- Zhu, Y.; Jiao, L.; Zhang, Y.; Wu, Y.; Huo, X. Sustainable Development of Urban Metro System: Perspective of Coordination between Supply and Demand. Int. J. Environ. Res. Public Health 2021, 18, 10349. [Google Scholar] [CrossRef]
- Li, W.; Ren, X.; Ding, S.; Dong, L. A multi-criterion decision making for sustainability assessment of hydrogen production technologies based on objective grey relational analysis. Int. J. Hydrogen Energy 2020, 45, 34385–34395. [Google Scholar] [CrossRef]
- Long, X.; Wu, S.; Wang, J.; Wu, P.; Wang, Z. Urban water environment carrying capacity based on VPOSR-coefficient of variation-grey correlation model: A case of Beijing, China. Ecol. Indic. 2022, 138, 108863. [Google Scholar] [CrossRef]
- Yuan, G.; Yang, Y.; Tian, G.; Zhuang, Q. Comprehensive evaluation of disassembly performance based on the ultimate cross-efficiency and extension-gray correlation degree. J. Clean. Prod. 2020, 245, 118800. [Google Scholar] [CrossRef]
- Liu, G.; Yu, J. Gray correlation analysis and prediction models of living refuse generation in Shanghai city. Waste Manag. 2007, 27, 345–351. [Google Scholar] [CrossRef] [PubMed]
- Verma, P.; Raghubanshi, A. Urban sustainability indicators: Challenges and opportunities. Ecol. Indic. 2018, 93, 282–291. [Google Scholar] [CrossRef]
- Shen, L.; Jiao, L.; He, B.; Li, L. Evaluation on the utility efficiency of metro infrastructure projects in China from sustainable development perspective. Int. J. Proj. Manag. 2015, 33, 528–536. [Google Scholar] [CrossRef]
- Huang, W.; Shuai, B.; Sun, Y.; Wang, Y.; Antwi, E. Using entropy-TOPSIS method to evaluate urban rail transit system operation performance: The China case. Transp. Res. Part A Policy Prcat. 2018, 111, 292–303. [Google Scholar] [CrossRef]
- Merino-Saum, A.; Halla, P.; Superti, V.; Boesch, A.; Binder, C. Indicators for urban sustainability: Key lessons from a systematic analysis of 67 measurement initiatives. Ecol. Indic. 2020, 119, 106879. [Google Scholar] [CrossRef]
- Piña, W.H.A.; Martínez, C.I.P. Development and Urban Sustainability: An Analysis of Efficiency Using Data Envelopment Analysis. Sustainability 2016, 8, 148. [Google Scholar] [CrossRef] [Green Version]
- Phillis, Y.A.; Kouikoglou, V.S.; Verdugo, C. Urban sustainability assessment and ranking of cities. Comput. Environ. Urban Syst. 2017, 64, 254–265. [Google Scholar] [CrossRef]
- Patias, N.; Rowe, F.; Cavazzi, S.; Arribas-Bel, D. Sustainable urban development indicators in Great Britain from 2001 to 2016. Landsc. Urban Plan. 2021, 214, 104148. [Google Scholar] [CrossRef]
- Gao, F.; Zhang, Z.; Shang, M. Risk Evaluation Study of Urban Rail Transit Network Based on Entropy-TOPSIS-Coupling Coordination Model. Discret. Dyn. Nat. Soc. 2021, 2021, 5124951. [Google Scholar] [CrossRef]
- Wang, M.; Zhao, X.; Gong, Q.; Ji, Z. Measurement of Regional Green Economy Sustainable Development Ability Based on Entropy Weight-Topsis-Coupling Coordination Degree—A Case Study in Shandong Province, China. Sustainability 2019, 11, 280. [Google Scholar] [CrossRef] [Green Version]
- Zhang, D.; Jiao, J. How Does Urban Rail Transit Influence Residential Property Values? Evidence from An Emerging Chinese Megacity. Sustainability 2019, 11, 534. [Google Scholar] [CrossRef] [Green Version]
- Jiao, L.; Luo, F.; Wu, F.; Zhang, Y.; Huo, X.; Wu, Y. Exploring the Interactive Coercing Relationship between Urban Rail Transit and the Ecological Environment. Land 2022, 11, 836. [Google Scholar] [CrossRef]
- Lan, A. Transport Orientated Development and Commercialization of Underground Space in China: Trends in Shanghai, Tianjin and Shenzhen. Procedia Eng. 2016, 165, 555–563. [Google Scholar] [CrossRef]
- Li, S.; Liu, X.; Li, Z.; Wu, Z.; Yan, Z.; Chen, Y.; Gao, F. Spatial and Temporal Dynamics of Urban Expansion along the Guangzhou–Foshan Inter-City Rail Transit Corridor, China. Sustainability 2018, 10, 593. [Google Scholar] [CrossRef] [Green Version]
- Bao, X. Urban Rail Transit Present Situation and Future Development Trends in China: Overall Analysis Based on National Policies and Strategic Plans in 2016–2020. Urban Rail Transit 2018, 4, 1–12. [Google Scholar] [CrossRef] [Green Version]
Figure 1.
The research framework of the coupling coordination between URT and SUD.
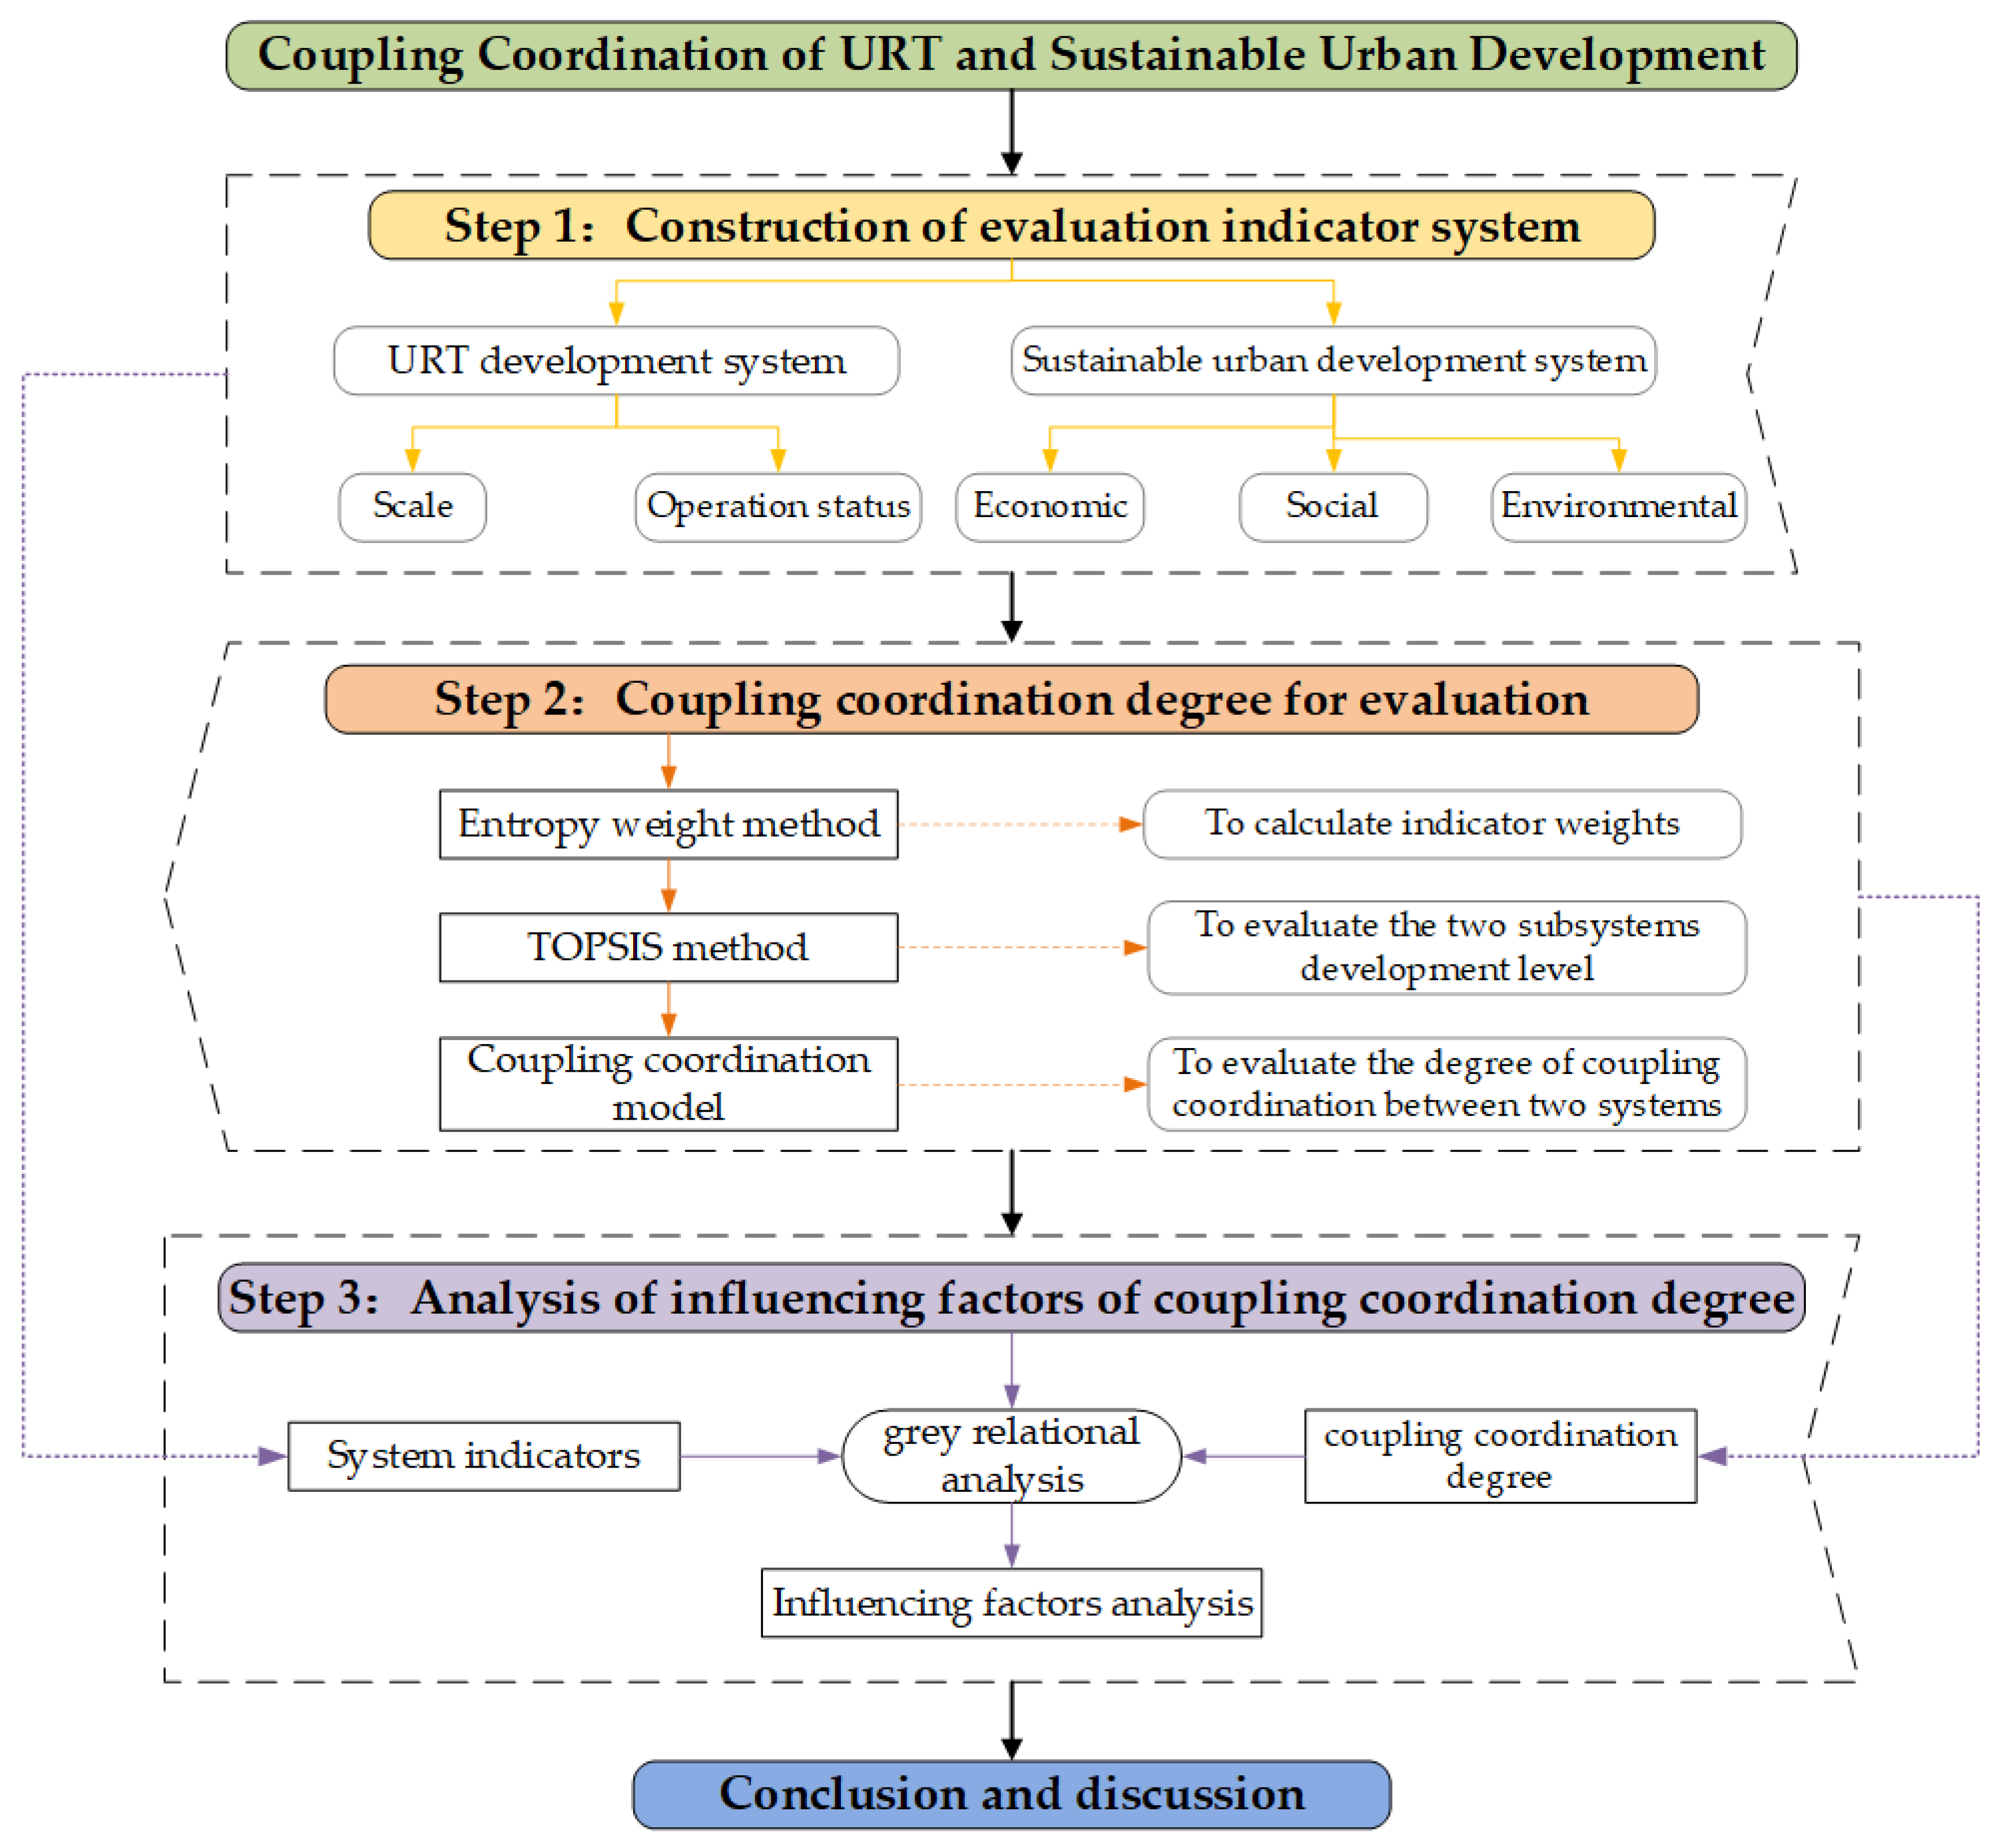
Figure 2.
Coupling coordination degree value and TOPSIS value of two systems.
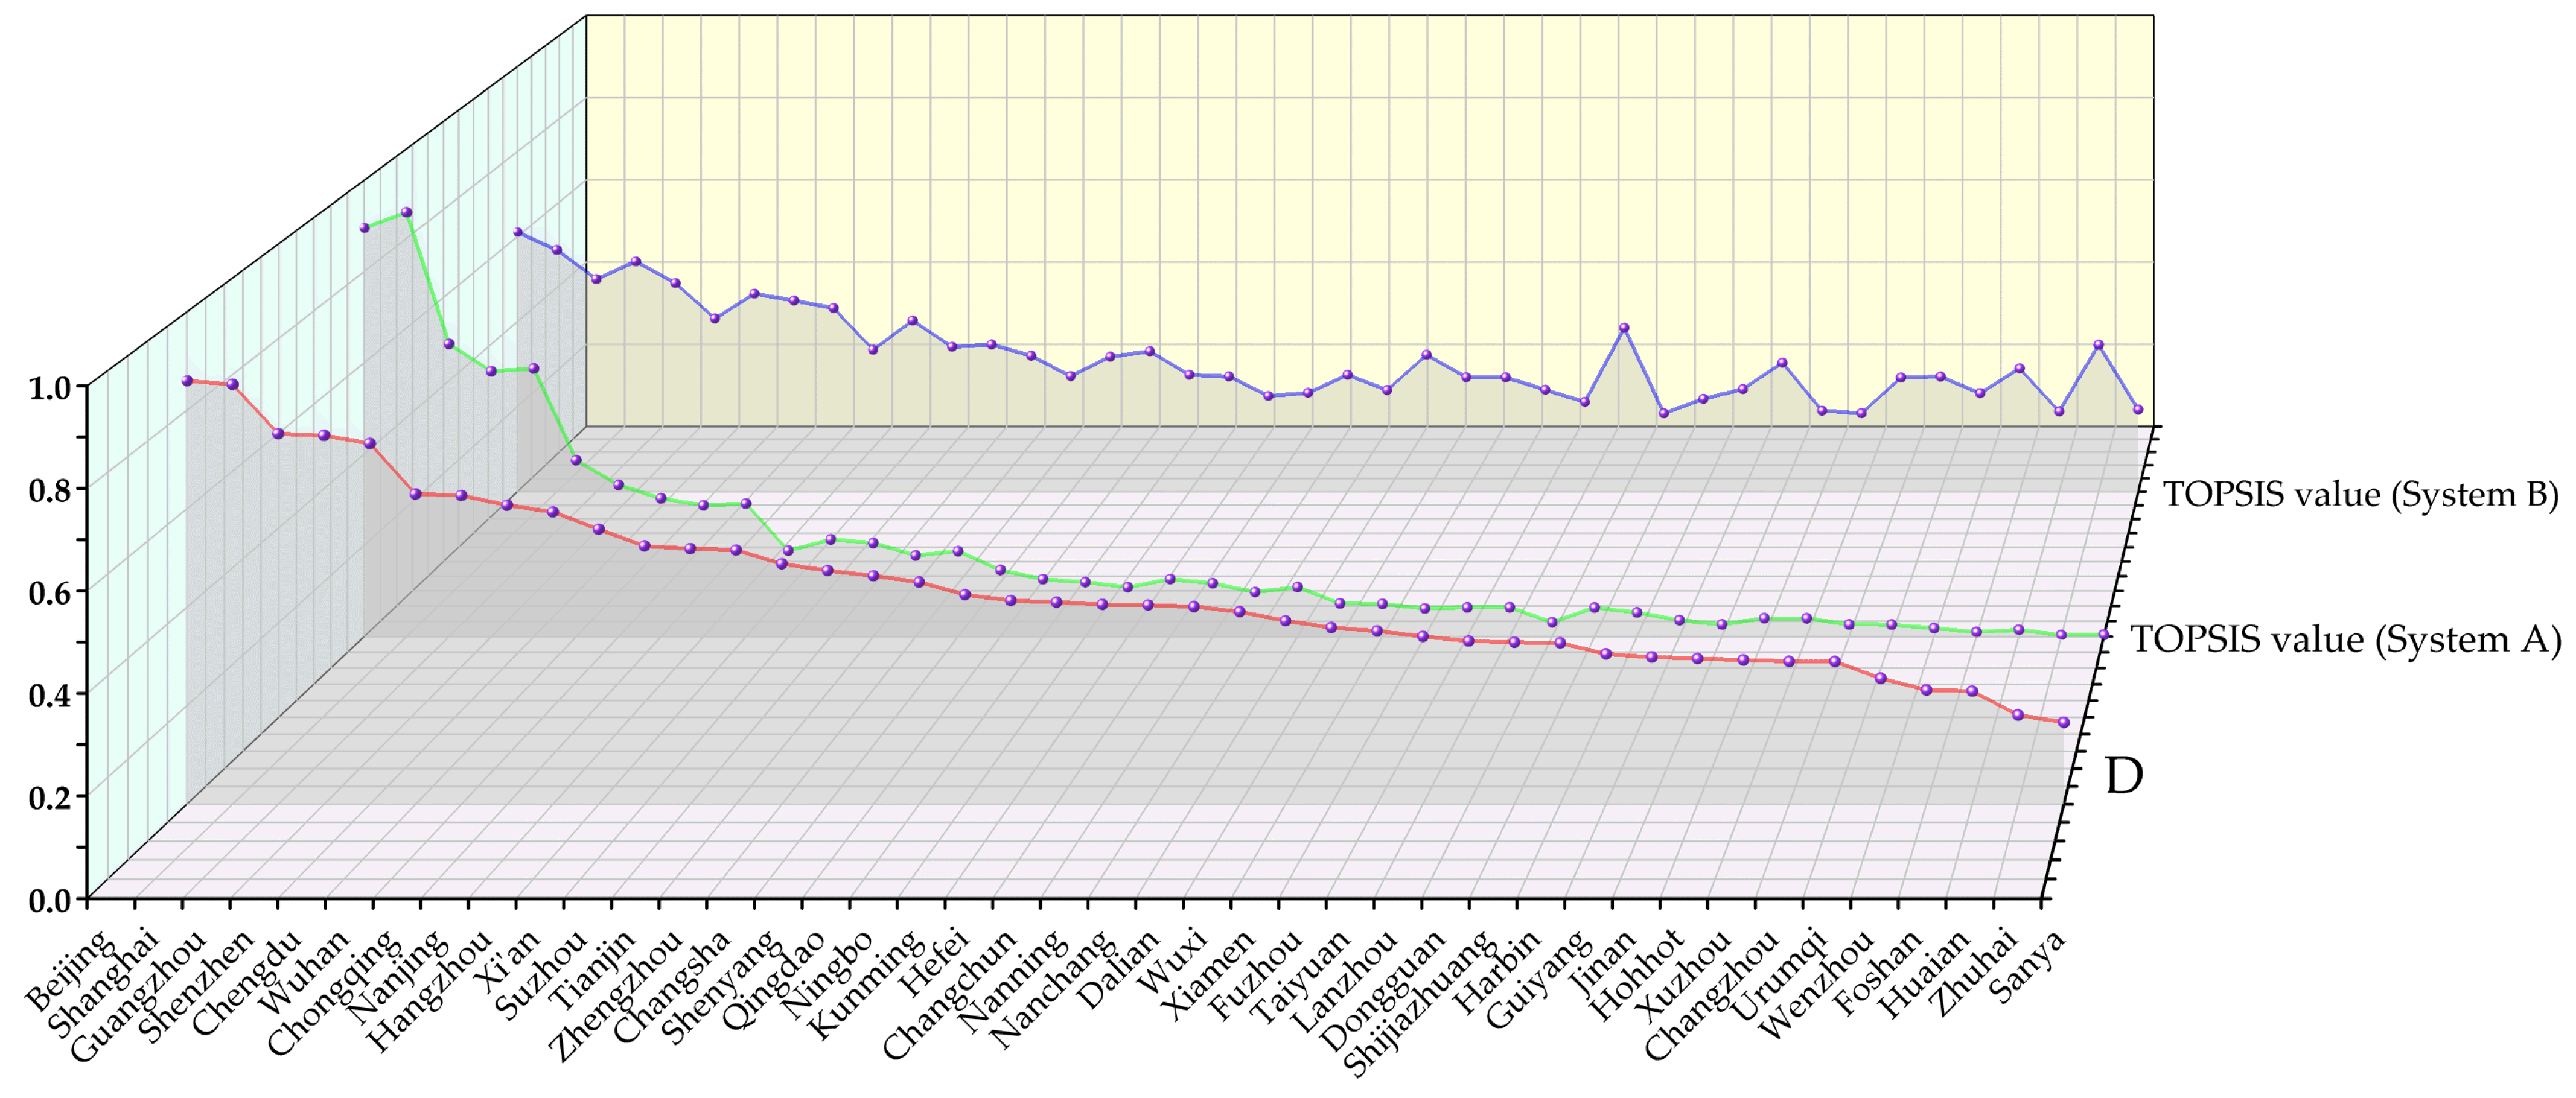
Figure 3.
Categorized cities according to coupling coordination value.

Table 1.
Coupling coordination degree levels and types.
| Value of D | Comprehensive Type | Comparison of u | Subtype |
|---|---|---|---|
| 0.75 ≤ D ≤ 1 | Highly balanced | uA < uB | Highly balanced with lagging uA |
| uA ≈ uB | Highly balanced | ||
| uA > uB | Highly balanced with lagging uB | ||
| 0.5 ≤ D < 0.75 | Barely balanced | uA < uB | Barely balanced with lagging uA |
| uA ≈ uB | Barely balanced | ||
| uA > uB | Barely balanced with lagging uB | ||
| 0.25 ≤ D < 0.5 | Slightly unbalanced | uA < uB | Slightly unbalanced with lagging uA |
| uA ≈ uB | Slightly unbalanced | ||
| uA > uB | Slightly unbalanced with lagging uB | ||
| 0 ≤ D < 0.25 | Seriously unbalanced | uA < uB | Seriously unbalanced with lagging uA |
| uA ≈ uB | Seriously unbalanced | ||
| uA > uB | Seriously unbalanced with lagging uB |
Note: D represents the coupling coordination degree value, while u represents the comprehensive values of system A and system B.
Table 2.
Evaluation index system of coupling coordination between URT and SUD.
| System Layer | Factor Layer | Indicator Layer | Indicator Direction (+/−) | Unit | Supporting Literature References |
|---|---|---|---|---|---|
| URT development system (A) | Scale (A1) | Length of Lines (A11) | + | km | [20] |
| Number of Stations (A12) | + | unit | [20,26] | ||
| Number of Transfer Stations (A13) | + | unit | [55] | ||
| Number of Vehicles in Service (A14) | + | unit | [20] | ||
| Operation status (A2) | Daily Average Times of the Train Operations (A21) | + | unit | [55] | |
| Average Daily Passenger Volume (A22) | + | 10,000 persons | [26,49,56] | ||
| Passenger Transport Intensity (A23) | + | 10,000 person/km day | [20,49,56] | ||
| Operation Mileage (A24) | + | 10,000 vehicle km | [26] | ||
| Sustainable urban development system (B) | Economic (B1) | Per Capita Gross Regional Product (B11) | + | yuan | [57] |
| Per Capita Deposits of Financial Institutions at Year-end (B12) | + | yuan | [45] | ||
| Number of Industrial Enterprises (B13) | + | unit | [6] | ||
| Per Capita Retail Sales of Consumer Goods (B14) | + | yuan | [26,27] | ||
| Persons Employed in Urban Non-Private Units at Year-end (B15) | + | 10,000 person | [27] | ||
| Average Wage of Employed Staff and Workers in Urban Non-Private Units (B16) | + | yuan | [57] | ||
| Per Sales Area of Commercial Residential Building (B17) | + | 10,000 sq.m | [27,58] | ||
| Per Sales Area of Residential Buildings (B18) | + | 10,000 sq.m | [27,58] | ||
| Social (B2) | Resident Population (B21) | + | 10,000 person | [41] | |
| Per Capita Road Area (B22) | + | sq.m | [41] | ||
| Buses under Operation (B23) | + | unit | [6,59] | ||
| Area of Built District (B24) | + | sq.km | [60] | ||
| Fixed Assets Investment in Urban Service Facilities (B25) | + | 10,000 yuan | [27,58] | ||
| Per Capita Number of Beds of Hospitals (B26) | + | unit | [59,61] | ||
| Undergraduate in Regular HEIs (B27) | + | 10,000 person | [39] | ||
| Number of Employees Joining Urban Basic Pension Insurance (B28) | + | 10,000 person | [54] | ||
| Environmental (B3) | Annual Mean Concentration of PM2.5 (B31) | − | ug/m3 | [6,7] | |
| Annual Mean Concentration of SO2 (B32) | − | ug/m3 | [6,7,59] | ||
| Annual Mean Concentration of NO2 (B33) | − | ug/m3 | [6,7,59] | ||
| Days with good air quality (B34) | + | unit | [7] | ||
| Daily Water Consumption Per Capita (B35) | − | litre | [7,57,62] | ||
| Per Capita Area of Parks and Green Space (B36) | + | 10,000 sq.m | [6,57,60,59] | ||
| Per Capita Natural Gas Supplied (B37) | − | 10,000 cu.m | [6,7,59,62] | ||
| Wastewater Treatment Rate (B38) | + | % | [59] | ||
| Surface Area of Roads Cleaned and Maintained (B39) | + | 10,000 sq.m | [7] |
Note: + represents the positive indicators, while − represents the negative indicators.
Table 3.
Entropy weights in the URT development system and SUD system.
| System Layer | Factor Layer | Indicator Layer | ||
|---|---|---|---|---|
| Code | Weight | Code | Weight | |
| URT development system (A) | A1 | 0.5102 | A11 | 0.1064 |
| A12 | 0.1037 | |||
| A13 | 0.1725 | |||
| A14 | 0.1276 | |||
| A2 | 0.4898 | A21 | 0.1239 | |
| A22 | 0.1718 | |||
| A23 | 0.0471 | |||
| A24 | 0.1470 | |||
| Sustainable urban development system (B) | B1 | 0.3946 | B11 | 0.0416 |
| B12 | 0.0610 | |||
| B13 | 0.0665 | |||
| B14 | 0.0379 | |||
| B15 | 0.0779 | |||
| B16 | 0.0503 | |||
| B17 | 0.0310 | |||
| B18 | 0.0283 | |||
| B2 | 0.3624 | B21 | 0.0361 | |
| B22 | 0.0180 | |||
| B23 | 0.0434 | |||
| B24 | 0.0423 | |||
| B25 | 0.0758 | |||
| B26 | 0.0298 | |||
| B27 | 0.0532 | |||
| B28 | 0.0638 | |||
| B3 | 0.2430 | B31 | 0.0268 | |
| B32 | 0.0103 | |||
| B33 | 0.0253 | |||
| B34 | 0.0105 | |||
| B35 | 0.0143 | |||
| B36 | 0.0641 | |||
| B37 | 0.0083 | |||
| B38 | 0.0278 | |||
| B39 | 0.0556 | |||
Table 4.
TOPSIS values of URT development system.
| City | Relative Closeness Value (uA) | Rank | City | Relative Closeness Value (uA) | Rank |
|---|---|---|---|---|---|
| Shanghai | 0.9297 | 1 | Hefei | 0.1082 | 22 |
| Beijing | 0.8952 | 2 | Nanchang | 0.0975 | 23 |
| Guangzhou | 0.6413 | 3 | Wuxi | 0.0727 | 24 |
| Chengdu | 0.5874 | 4 | Xiamen | 0.0716 | 25 |
| Shenzhen | 0.5812 | 5 | Lanzhou | 0.0640 | 26 |
| Wuhan | 0.3864 | 6 | Taiyuan | 0.0640 | 27 |
| Chongqing | 0.3321 | 7 | Shijiazhuang | 0.0637 | 28 |
| Nanjing | 0.3029 | 8 | Fuzhou | 0.0616 | 29 |
| Xi’an | 0.2915 | 9 | Harbin | 0.0528 | 30 |
| Hangzhou | 0.2875 | 10 | Hohhot | 0.0403 | 31 |
| Tianjin | 0.2128 | 11 | Xuzhou | 0.0401 | 32 |
| Zhengzhou | 0.2050 | 12 | Guiyang | 0.0360 | 33 |
| Suzhou | 0.1880 | 13 | Dongguan | 0.0313 | 34 |
| Shenyang | 0.1869 | 14 | Jinan | 0.0264 | 35 |
| Changsha | 0.1777 | 15 | Changzhou | 0.0264 | 36 |
| Qingdao | 0.1459 | 16 | Urumqi | 0.0261 | 37 |
| Changchun | 0.1259 | 17 | Wenzhou | 0.0185 | 38 |
| Ningbo | 0.1256 | 18 | Huaian | 0.0148 | 39 |
| Kunming | 0.1194 | 19 | Foshan | 0.0100 | 40 |
| Nanning | 0.1167 | 20 | Sanya | 0.0040 | 41 |
| Dalian | 0.1086 | 21 | Zhuhai | 0.0031 | 42 |
| Mean | 0.1876 |
Table 5.
TOPSIS values of SUD system.
| City | Relative Closeness Value (uB) | Rank | City | Relative Closeness Value (uB) | Rank |
|---|---|---|---|---|---|
| Beijing | 0.6106 | 1 | Nanchang | 0.2749 | 22 |
| Shanghai | 0.5687 | 2 | Kunming | 0.2749 | 23 |
| Shenzhen | 0.5416 | 3 | Shenyang | 0.2716 | 24 |
| Guangzhou | 0.5000 | 4 | Hefei | 0.2711 | 25 |
| Chengdu | 0.4907 | 5 | Urumqi | 0.2706 | 26 |
| Chongqing | 0.4658 | 6 | Xiamen | 0.2693 | 27 |
| Nanjing | 0.4495 | 7 | Fuzhou | 0.2691 | 28 |
| Hangzhou | 0.4318 | 8 | Changzhou | 0.2688 | 29 |
| Wuhan | 0.4074 | 9 | Guiyang | 0.2413 | 30 |
| Suzhou | 0.4027 | 10 | Taiyuan | 0.2399 | 31 |
| Dongguan | 0.3858 | 11 | Dalian | 0.2390 | 32 |
| Zhengzhou | 0.3463 | 12 | Nanning | 0.2325 | 33 |
| Zhuhai | 0.3459 | 13 | Wenzhou | 0.2318 | 34 |
| Tianjin | 0.3408 | 14 | Changchun | 0.2250 | 35 |
| Xi’an | 0.3338 | 15 | Harbin | 0.2185 | 36 |
| Ningbo | 0.3303 | 16 | Lanzhou | 0.2113 | 37 |
| Wuxi | 0.3222 | 17 | Sanya | 0.1932 | 38 |
| Changsha | 0.3197 | 18 | Hohhot | 0.1906 | 39 |
| Qingdao | 0.3178 | 19 | Huaian | 0.1889 | 40 |
| Jinan | 0.3034 | 20 | Xuzhou | 0.1846 | 41 |
| Foshan | 0.2901 | 21 | Shijiazhuang | 0.1843 | 42 |
| Mean | 0.3204 |
Table 6.
Coupling coordination degree values of two systems.
| City | C | T | D | D Rank | City | C | T | D | D Rank |
|---|---|---|---|---|---|---|---|---|---|
| Beijing | 0.9820 | 0.7529 | 0.8598 | 1 | Nanchang | 0.8792 | 0.1862 | 0.4046 | 22 |
| Shanghai | 0.9705 | 0.7492 | 0.8527 | 2 | Dalian | 0.9269 | 0.1738 | 0.4013 | 23 |
| Guangzhou | 0.9923 | 0.5707 | 0.7525 | 3 | Wuxi | 0.7752 | 0.1974 | 0.3912 | 24 |
| Shenzhen | 0.9994 | 0.5614 | 0.7490 | 4 | Xiamen | 0.8146 | 0.1704 | 0.3726 | 25 |
| Chengdu | 0.9960 | 0.5391 | 0.7327 | 5 | Fuzhou | 0.7786 | 0.1654 | 0.3588 | 26 |
| Wuhan | 0.9997 | 0.3969 | 0.6299 | 6 | Taiyuan | 0.8155 | 0.1519 | 0.3520 | 27 |
| Chongqing | 0.9859 | 0.3990 | 0.6271 | 7 | Lanzhou | 0.8450 | 0.1376 | 0.3410 | 28 |
| Nanjing | 0.9809 | 0.3762 | 0.6074 | 8 | Dongguan | 0.5272 | 0.2086 | 0.3316 | 29 |
| Hangzhou | 0.9797 | 0.3597 | 0.5936 | 9 | Shijiazhuang | 0.8737 | 0.1240 | 0.3291 | 30 |
| Xi’an | 0.9977 | 0.3127 | 0.5585 | 10 | Harbin | 0.7919 | 0.1356 | 0.3277 | 31 |
| Suzhou | 0.9316 | 0.2954 | 0.5246 | 11 | Guiyang | 0.6721 | 0.1387 | 0.3053 | 32 |
| Tianjin | 0.9729 | 0.2768 | 0.5189 | 12 | Jinan | 0.5425 | 0.1649 | 0.2991 | 33 |
| Zhengzhou | 0.9666 | 0.2756 | 0.5162 | 13 | Hohhot | 0.7591 | 0.1154 | 0.2960 | 34 |
| Changsha | 0.9584 | 0.2487 | 0.4882 | 14 | Xuzhou | 0.7656 | 0.1123 | 0.2932 | 35 |
| Shenyang | 0.9828 | 0.2293 | 0.4747 | 15 | Changzhou | 0.5704 | 0.1476 | 0.2901 | 36 |
| Qingdao | 0.9287 | 0.2318 | 0.4640 | 16 | Urumqi | 0.5667 | 0.1484 | 0.2900 | 37 |
| Ningbo | 0.8936 | 0.2279 | 0.4513 | 17 | Wenzhou | 0.5234 | 0.1251 | 0.2559 | 38 |
| Kunming | 0.9189 | 0.1972 | 0.4256 | 18 | Foshan | 0.3593 | 0.1500 | 0.2322 | 39 |
| Hefei | 0.9030 | 0.1896 | 0.4138 | 19 | Huaian | 0.5184 | 0.1018 | 0.2298 | 40 |
| Changchun | 0.9593 | 0.1755 | 0.4103 | 20 | Zhuhai | 0.1886 | 0.1745 | 0.1814 | 41 |
| Nanning | 0.9434 | 0.1746 | 0.4059 | 21 | Sanya | 0.2807 | 0.0986 | 0.1664 | 42 |
| Mean | 0.8099 | 0.2540 | 0.4406 |
Note: C means coupling degree value, T means coordination degree value and D means coupling degree value.
Table 7.
GRDs between coupling coordination degree and influencing factors.
| Indicators | GRD | Rank | Indicators | GRD | Rank |
|---|---|---|---|---|---|
| B21 | 0.9628 | 1 | A22 | 0.9077 | 18 |
| B16 | 0.9608 | 2 | A13 | 0.9074 | 19 |
| B24 | 0.9542 | 3 | A24 | 0.9051 | 20 |
| B39 | 0.9485 | 4 | B36 | 0.9022 | 21 |
| B11 | 0.9410 | 5 | B27 | 0.8977 | 22 |
| B14 | 0.9408 | 6 | B31 | 0.8859 | 23 |
| A23 | 0.9390 | 7 | B38 | 0.8719 | 24 |
| B12 | 0.9379 | 8 | B26 | 0.8701 | 25 |
| B23 | 0.9367 | 9 | B33 | 0.8512 | 26 |
| A12 | 0.9328 | 10 | B34 | 0.8489 | 27 |
| B28 | 0.9310 | 11 | B13 | 0.8399 | 28 |
| B15 | 0.9249 | 12 | B35 | 0.8084 | 29 |
| A11 | 0.9207 | 13 | B32 | 0.6834 | 30 |
| B25 | 0.9189 | 14 | B22 | 0.6723 | 31 |
| A14 | 0.9097 | 15 | B17 | 0.5509 | 32 |
| A21 | 0.9097 | 16 | B18 | 0.5173 | 33 |
| B37 | 0.9091 | 17 |
Publisher’s Note: MDPI stays neutral with regard to jurisdictional claims in published maps and institutional affiliations. |
© 2022 by the authors. Licensee MDPI, Basel, Switzerland. This article is an open access article distributed under the terms and conditions of the Creative Commons Attribution (CC BY) license (https://creativecommons.org/licenses/by/4.0/).
Share and Cite
MDPI and ACS Style
Jiao, L.; Wu, F.; Zhu, Y.; Luo, Q.; Luo, F.; Zhang, Y. Research on the Coupling Coordination Relationship between Urban Rail Transit System and Sustainable Urban Development. Systems 2022, 10, 110. https://doi.org/10.3390/systems10040110
AMA Style
Jiao L, Wu F, Zhu Y, Luo Q, Luo F, Zhang Y. Research on the Coupling Coordination Relationship between Urban Rail Transit System and Sustainable Urban Development. Systems. 2022; 10(4):110. https://doi.org/10.3390/systems10040110
Chicago/Turabian StyleJiao, Liudan, Fengyan Wu, Yinghan Zhu, Qiudie Luo, Fenglian Luo, and Yu Zhang. 2022. "Research on the Coupling Coordination Relationship between Urban Rail Transit System and Sustainable Urban Development" Systems 10, no. 4: 110. https://doi.org/10.3390/systems10040110
Note that from the first issue of 2016, this journal uses article numbers instead of page numbers. See further details here.