
AHP-RAPS Approach for Evaluating the Productivity of Engineering Departments at a Public University


Department of Industrial Engineering, College of Engineering, King Abdulaziz University, Jeddah 22254, Saudi Arabia
*
Author to whom correspondence should be addressed.
Systems 2022, 10(4), 107; https://doi.org/10.3390/systems10040107
Submission received: 3 July 2022
/
Revised: 18 July 2022
/
Accepted: 27 July 2022
/
Published: 29 July 2022
Abstract
:Education is an essential component for nations preparing to take advantage of the opportunities and confront the challenges of the 21st century. Universities, colleges, and research centers must work effectively and efficiently to achieve maximum results. In order to provide a comparable and verifiable evaluation of such institutions’ efforts, administrators need to adopt measurement tools such as those offered by multi-criteria decision-making (MCDM). The use of MCDM to solve complex real-world problems in the educational sector has dramatically increased in the past decade. This paper ranked the Engineering departments in a public university from 2019 to 2021 using combined MCDM methods between Analytical Hierarchy Analysis (AHP) and Ranking Alternatives by Perimeter Similarity (RAPS). The AHP technique assisted in the weighting for each evaluation criterion covered in this study. The RAPS technique assisted in ranking the Engineering departments using weights derived from the AHP technique. For the first time, the use of RAPS in the educational sector is presented in this paper. The findings revealed some of the departments under investigation’s vulnerabilities, indicating that they require assistance from the institution’s administration. Moreover, the results demonstrate that combining the AHP and RAPS techniques to evaluate and rank university departments is a successful method.
1. Introduction
The rising level of uncertainty in most organizations, industries, and other areas predetermines the growing complexity of decision-making. Parties tasked with making critical decisions are supposed to take into account the increasing number of criteria in order to identify and address all the risks and meet the expectations of varied stakeholders [1]. In this situation, a traditional approach toward decision-making that is based on intuition and previous experience might no longer capture all the relevant nuances of particular settings. Accordingly, scientists and practitioners are looking for formalized decision-making instruments that would minimize bias risks and maximize the quality of final decisions. One possible solution is to use mathematical techniques such as multi-criteria decision-making (MCDM) methods. MCDM is a useful instrument that is frequently used in several fields of research and industry. The mechanism of MCDM emerged as a set of novel techniques for facilitating and improving decision-making in situations where the consideration of multiple criteria is required [1]. One of the advantages of using MCDM is that it can generate consistent, structured, rational, robust, and transparent information in complex situations [2]. The academic literature defines MCDM as an approach that involves the analysis of various available choices in a particular situation [3]. MCDM is successfully utilized in numerous areas, including business, medicine, engineering, government, and even daily life [4,5,6,7,8,9]. There are many customized MCDM tools that were specifically designed for use in particular areas. The paradigm of MCDM implies following a series of steps. In accordance with Karunathilake et al. [10], a typical MCDM process entails formulating a problem, identifying requirements, setting goals, determining alternatives, developing criteria, and applying a decision-making technique. Decision-makers often apply the MCDM technique when they intend to consider conflicting criteria in decision-making. For instance, risks and potential returns are examples of conflicting criteria of portfolio management, as investors try to choose an optimal portfolio based on their risk tolerance levels and return expectations [11]. In comparison with many other instruments, MCDM might encompass many different factors. For example, the research by Kabassi [7], which reviews MCDM models for evaluating environmental education programs, considers such criteria as adaptivity, completeness, pedagogy, clarity, effectiveness, knowledge, skills, behaviors, enjoyment, and multimodality. A critical analysis of the ways in which MCDM techniques could be applied in various settings remains a topical research area. However, decision-makers, analysts, and specialists are entities involved in identifying which MCDM models are to be implemented in the decision-making process in organizations [2,12].
1.1. Motivation of the Study
One of the areas in which the MCDM approach can be applied is the educational sector. Higher education institutions may face challenges in many aspects, such as providing high-quality education, obtaining top world rankings, or increasing self-funds. The fast growth of education models makes the evaluation models gradually attract the attention of scholars [13]. These challenges are due to many factors facing educational institutions. A successful education system requires evaluation at all levels, from the institution to the departmental to the study programs. Therefore, it is crucial to continuously measure and evaluate the performance of faculties, departments, and centers in an educational institution so that decision-makers can make decisions that contribute to the achievement of organizational goals.
On the college scale, the recent high demand for engineers with excellent capabilities and skills to apply their knowledge creatively and innovatively to solve real-life problems necessitates the need for an engineering education institution to produce graduates who meet the high standards required by industry, government, and other sectors of society [14]. The effective administration must find the best means and methods to evaluate its engineering colleges in an optimal manner and take the necessary measures to ensure that they continue to improve their performance [14,15,16].
Hence, this paper aims to present an effective method for evaluating and ranking departments within the college using integrated MCDM methods. The College of Engineering, one of the major public universities in the Middle East, was chosen to be under investigation because of the importance of the department’s outputs in general worldwide and also because of the cooperation of its management in the evaluation process at that university.
This paper selected a combined MCDM between The Analytical Hierarchy Process (AHP) and Ranking Alternatives by Perimeter Similarity (RAPS). The use of AHP-RAPS as the AHP was chosen due to its power to translate management needs, preferences, and strategies on a qualitative concepts scale. Thus, the AHP in this study was used to calculate the weight of each criterion specified by university experts. On the other hand, RAPS was chosen due to its logical procedures, generalization, and credibility and validity of the approach [17]. Therefore, RAPS was used in this study to rank the Engineering college’s departments using the weights derived from the AHP calculations. This paper presents the first use of AHP-RAPS in the education sector.
1.2. Structure of the Study
The remainder of the paper is structured as follows: Section 2 presents an overview of current research using MCDM techniques in general and in the educational sector. Section 3 describes specifically step by step in both AHP and RAPS methods. Section 4 depicts the numerical phases of the case study as well as the decision-making process’s application methodologies. Section 5 presents the study’s findings as well as a comparative analysis of different methods with the advantages and disadvantages of the proposed approach. Section 6 introduces sensitivity analysis by switching the weights of the most sensitive criterion and performing three different cases; thus, the ratings obtained under these cases are represented. Section 7 gives the recommendations for improving the department’s outcomes are presented in the conclusion section.
2. Background of the MCDM Techniques
The MCDM technique was used to solve complex real-life problems because of its ability to examine various alternatives and choose the best option [18]. There are a large number of MCDM techniques in the literature. However, this paper covers some of the known and used techniques in education. For instance, Elimination Et Choix Traduisant la Realité (ELECTRE) is an MCDM tool that allows identifying and removing alternatives that are outranked by others, thus leaving a set of suitable actions [19]. Instead of trying to solve a problem in the form of a function, ELECTRE focuses on relations between varied solutions. Experts use ELECTRE to analyze the consequences of criteria and compare them with each other based on projected performance [20]. It is important to emphasize that, unlike many other techniques, ELECTRE can be successfully used to analyze the performance of qualitative criteria that cannot be measured using common quantifiable indicators.
Simple Additive Weighting (SAW) is another MCDM technique that seeks to analyze the performance of alternative solutions. Sembiring et al. [21] stated that its goal is to find the weighted sum of performance ratings on each alternative on all attributes. Implementation of SAW strongly depends on decision-makers, as they are supposed to decide on weight preferences for all the criteria. For example, in research by Ibrahim and Surya [5], which sought to offer a SAW method for selecting the best school in Jambi, decision-makers were supposed to agree on the weight preferences concerning school achievements, school environment, school accreditation, implementation of curricula, and availability of extracurricular activities. In this situation, it seems justified to claim that the effectiveness of SAW to a large extent depends on the ability of decision-makers to determine adequate weighting criteria.
Stepwise Weight Assessment Ratio Analysis (SWARA) is part of MCDM. The SWARA technique provides an opportunity for policymakers to make the best choice depending on dissimilar situations. When using the SWARA technique, criteria requirements are arranged with respect to their importance. Experts try to rank the defined criteria according to their importance [22]. For instance, the most important criteria appear in the first position, while the least important one rank the last. Experts are the main elements of the SWARA method.
The Analytic Hierarchy Process (AHP) is a relatively old MCDM technique that still remains popular. It was developed in the 1980s by L.Saaty [23] and has been enhanced since then. AHP provides a coherent framework for a necessary choice by quantifying its criteria and alternative possibilities and linking those parts to the overall purpose. The approach is a systematic MCDM method to generate weights based on the well-defined mathematical structures of pairwise comparison metrics [24]. Application of the AHP technique starts with problem structuring, which encompasses the definition of a problem and the identification and structuring of criteria and alternatives [19,20]. Evaluation of alternatives occurs through the steps of judging relative values, judging relative importance, grouping aggregation of judgments, and carrying out an analysis of judgments’ inconsistency [25]. Finally, decision-makers select optimal alternatives based on the calculation of the criteria’s weights and alternatives’ priorities as well as the results of the sensitivity analysis [26]. An ability to quantify complex and ambiguous criteria and alternatives predetermines the popularity of AHP.
Best Worst Method (BWM) is an MCDM technique that was introduced by Rezaei [27]. The BWM technique can evaluate data in a structured manner along with fewer input data than comparable methods [28], such as the AHP technique. Many authors in a variety of fields and sectors have used the application of the BWM technique [29]. It may be used to assess alternatives in relation to the criteria and to determine the relevance of the criteria that are utilized in finding a solution to achieve the major objective(s) of the problem. The BWM involves fewer pairwise comparisons and fewer data points as compared to other MCDM techniques, and it is characterized by its reference pairwise comparison. Data for pairwise comparisons can be obtained in the BWM technique using the survey method [29]. According to Khan et al. [29], a complete detailed overview of the BWM technique is provided in Mi et al.’s [30] study.
VlseKriterijuska Optimizacija I Komoromisno Resenje (VIKOR) is another MCDM technique. The name of the VIKOR method could be loosely translated from the Serbian language as a “multi-criteria optimization and compromise solution” [31]. The emergence of this methodology was a response to the popular call for developing tools aimed at finding a compromise solution, which was first expressed by Yu [32]. The method implies evaluating and choosing alternatives on the basis of conflicting criteria by specifically describing how close each alternative is located to the “ideal” hypothetical solution.
Unlike VIKOR, the Technique for Order of Preference by Similarity to Ideal Solution (TOPSIS) considers both the positive and the negative ideal solutions [26]. The primary purpose of the methodology is to locate an optimal solution that would have the longest and the shortest distance to the positive and negative ideal solutions, respectively [33], [34]. TOPSIS was introduced in 1981 by Yoon and Hwang [35]. The TOPSIS method has a number of advantages over many other MCDM techniques. In particular, it is relatively simple in use and could be applied in different areas [6]. Furthermore, whereas most methods exclude alternative solutions solely because they do not meet certain criteria, TOPSIS considers trade-offs between criteria, thus ensuring more realistic modeling [26]. TOPSIS is a comprehensive technique that could be effectively used in many areas where the exclusion of alternatives based on predefined criteria would be counterproductive.
A universal method is considered to be the Organizing Preference Ranking for Evaluation Enrichment (PROMETHEE), which is used in a variety of fields [36]. The technique allows for structuring a problem, determining conflicts and actions, and identifying alternatives [25]. The eventual goal of PROMETHEE is to find those solutions that would be suitable for specific parties [36]. Therefore, if another practitioner uses the method to solve the same problem, the results of its application might be fundamentally different. PROMETHEE is used by experts in a range of scenarios, including prioritization, ranking, resource allocation, conflict resolution, and decision-making [25].
Grey Relational Analysis (GRA) is a method that was designed in 1989 by Deng [37] for problems that were to be solved in an environment with a high level of uncertainty. In comparison with other techniques, GRA proved its effectiveness in systems with incomplete information [38]. Similarly, with VIKOR, GRA considers both positive and negative ideal solutions, using the term “degree of grey relation” to determine their closeness to a particular alternative [36]. The main advantages of GRA are connected with the reliance on the original data and the simplicity of calculations [38]. The technique offers a flexible process that could be integrated with other MCDM techniques. For example, Chen [4] applied the IF-GRA technique along with the TOPSIS method to select the best supplier of building materials.
Multi-Objective Optimization on the Basis of Ratio Analysis (MOORA) is a relatively novel MCDM technique that was introduced in the 2000s by Brauers and Zavadskas [39]. The main goal of the method is to compare all the alternatives with each other based on their overall performance, which is calculated using sums of normalized performances. Application of the MOORA method implies passing the stages of determining the decision-making matrix, calculating the normalized matrix, calculating the weighted normalized matrix, calculating the overall ratings of alternatives’ cost and benefit criteria, and computing alternatives’ contributions [40]. In practice, however, decision-makers usually employ MULTIMOORA, which is a recent variation of MOORA that is characterized by robustness and an ability to involve all the relevant stakeholders [6,35].
Complex Proportional Assessment (COPRAS) technique was designed by Zavadskas and Kaklauskas [41] to select constructors in Lithuania. In the most general view, implementation of the method entails constructing a decision matrix, normalizing the decision-making matrix, determining the weighted matrix, calculating maximizing and minimizing indices for alternatives, calculating alternatives’ relative weights, determining the priority of alternatives, and calculating the performance index for each solution [42]. The method has a number of advantages over other MCDM techniques, such as an ability to consider qualitative criteria, simplicity, the focus on both minimizing and maximizing criteria, and a focus on the utility degree [42]. Simultaneously, Kraujalienė [6] criticized this method for being sensitive to data variation.
Another MCDM tool is the Additive Ratio Assessment (ARAS) technique. In accordance with Thakkar [9], the main principle of ARAS is that “a utility function value determining the complex relative efficiency of a feasible alternative is directly proportional to the relative effect of values and weights of the main criteria considered in a project”. Similarly, with many other tools, ARAS ranks criteria using a set of steps, including the formation of a decision-making matrix, its normalization, determination of the normalized matrix’s weights, determination of the optimization function’s value, and determination of the highest rank level [43].
Overview of MCDM Techniques Used in the Educational Sector
The academic literature offers a significant amount of information about different MCDM techniques employed in the educational sector. Higher education institutions may face the problem of providing quality education due to the lack of qualified educators. In order to acquire quality teachers, it is vital to develop a suitable technique for the selection and ranking of teachers. In this section, previous MCDM techniques that were used in the educational sector are covered. Note that the RAPS technique has not been used in any studies so far except for the original research conducted by Urošević et al. [17]. Therefore, important previous studies that used other MCDM techniques were covered.
The Fuzzy TOPSIS technique was applied to a set of data gathered from various institutions related to higher education sectors, and weights were obtained with the assistance of the AHP method [44]. By using a set of data for 5 criteria and 10 teachers, the Fuzzy TOPSIS method was used to rank the candidates. A university’s position and quality of training are greatly influenced by the research productivity of its lecturers [41,45]. Various objective and subjective criteria should be considered when rating the research productivity of lecturers, such as the number of books produced, research grants secured as project leaders, number of scientific publications, the average number of citations per publication, and many others [42,43,44]. Tuan et al. [46] used combined MCDM techniques between fuzzy AHP and TOPSIS to rank the evaluation of several lectures.
Because of the rising significance of distance education due to its many advantages, a study conducted by Turan [47] dealt with the application of both the AHP and the SWARA methods, both of which represent multi-criteria decision-making methods. The purpose of Turan’s [47] study is to evaluate the evaluation factors that affect e-learning technology in the Industrial Engineering department in one of the Turkish universities. Thus, the study demonstrates that multi-criteria decision-making methods can be used in e-learning applications to evaluate many factors.
Biswas et al. [48] used a modified SAW technique to analyze the quality of the operation of several Indian institutes of technology. The authors included criteria such as “the percentage of vacant seats during student intake”, “the strength of the faculty”, “research publications”, “the sponsored research fund”, “the number of the students who are employed through the placement cell”, and “the number of the students who opted for higher studies and the number of Ph.Ds. awarded”.
TOPSIS was applied by Kazan et al. [49] to examine student learning performance based on subject names as selection criteria for schools, such as Turkish, Mathematics, and Science and Technology. In another study by Koltharkar et al. [50], based on the factual performance and importance of eight decision criteria measured by TOPSIS, the authors prioritized the requirements of students in the case of a techno-managerial institute. Moreover, Mohammed et al. [51] used the AHP-TOPSIS technique to rank the best appropriate e-learning type.
Shekhovtsov and Sałabun [52] demonstrated the usage of TOPSIS and VIKOR methods in measuring webometrics ranking to dependable quantitative data on universities’ websites. The measures significantly helped in changing the competitive nature of universities across the world. Often, the method was dogged by controversies. Higher education stakeholders and researchers identified better models such as the VIKOR method to assist in providing better webometrics results and rankings for university websites [53]. The approach will be instrumental in improving to quality of education and academic prestige. VIKOR will also eliminate major methodological flaws that have led to controversial debates on rankings. Quality evaluations and modeling in rankings aim at ensuring reliable tools of website ranking and foster improvements to education and scholarship quality in higher learning institutions. Ayouni et al. [54] explored the usage of the VIKOR method in the evaluation and choice of Learning Management systems LMS in higher learning institutions in a complex environment. The authors proposed a quality framework that selects alternatives from a number of universities. The findings indicate that policymakers in institutions should consider time behavior and understandability. This is instrumental toward the development of standards and guidelines for LMS that foster the attainment of education quality.
A multi-criteria methodology was applied in the educational sector using the PROMETHEE method in selecting the best teacher competition, and the results were extracted by means of multiple criteria set by the educational authorities [55].
3. The AHP-RAPS Approach for Evaluating the Productivity of Engineering Departments
Multi-criteria decision-making (MCDM) approach integrates alternative performance measures in conflicting options and results to generate a feasible solution [18]. This methodology involves an assessment of several available choices in complex situations in areas such as medicine, social sciences, technology, and engineering. The qualitative and quantitative data used in the method foster the attainment of a compromising alternative.
This paper proposes an integrated MCDM technique between AHP and RAPS. The AHP is used to identify the weights of each criterion involved in this study. On the other hand, RAPS is used to rank the alternatives using the weights derived from the AHP technique.
RAPS is a relatively new MCMD technique. The instruments were proposed in the paper by Urošević et al. [17] as a novel method to which the authors refer as Ranking Alternatives by Perimeter Similarity (RAPS). The idea of developing this method originates from the critical shortcomings of the previous MCDM tools. In particular, despite the fact that TOPSIS is capable of using allocated information, it poorly addresses the issue of attributes’ correlations, which might result in the adverse influence of a deviation of indicators on final results [4]. VIKOR does not have this shortcoming but is problematic in practice due to the need to use initial weights and quantitative data [31]. These issues predetermine the interest of practitioners in developing new instruments that could help effectively solve problems with multiple criteria, addressing the limitations of the previous tools. Urošević et al. [17] argued that the idea of developing RAPS originated from the three constraints of MCDM techniques, including the complexity of comparing MCDM methods to each other and the achievement of different results using the same methods, and reporting of different results utilizing different techniques. Despite these limitations, the development of new MCDM methods is a surprisingly unpopular research area [57]. Urošević et al. [17] believed that the availability of numerous MCDM techniques, a low amount of information about new methods, and significant requirements for new methods in terms of their validation are the key reasons behind this regularity. The development of RAPS, therefore, could be considered a rare contribution to the academic literature on MCDM techniques.
3.1. Analytical Hierarchy Process (AHP)
As indicated before in this article, Engineering departments at one of the public institutions in the Middle East were ranked using a combination of AHP and RAPS approaches. The methodology of the AHP can be explained in the following steps [58]:
Step #1: A hierarchy of goals, criteria, sub-criteria, and alternatives is used to break down the problem. The hierarchy suggests that components on one level are related to those on the next level down;
Step #2: Data are collected from decision-makers/experts corresponding to the hierarchic structure to create a pairwise evaluation of options on a qualitative scale. The Saaty 1–9 preferred scale is used to create the similarity matrix [59];
Step #3: For multiple factors, the pairwise comparisons created in step 2 are grouped into a square matrix, with one as the diagonal member. If the value of the element (i, j) is greater than 1, the ith row criterion is superior to the jth column criterion; otherwise, the jth column criterion is superior to the ith row criterion. The (j, i) matrix element is the inverse of the (i, j) element;
Step #4: The comparison matrix’s major eigenvalue and related normalized right eigenvector show the relative relevance of the many criteria being evaluated. With regard to the criteria or sub-criteria, the elements of the normalized eigenvector are referred to as weights, and with regard to the alternatives, they are referred to as ratings;
Step #5: Calculate the consistency index (CI) as where the maximum eigenvalue of the judgment matrix is presented as . Then, a random index called (RI) is compared with the calculated CI, which needs to be compared. is termed the consistency ratio (CR). It is suggested that the value of CR should be no more than 10%. However, CR values greater than 10% are still considered acceptable in certain circumstances;
Step #6: Obtain the local rating by multiplying the rating of each alternative by the weights of the sub-criteria and summing the result with respect to each criterion. Then, obtain the global ranking by multiplying the weights of the criteria and summing the results.
3.2. Ranking Alternatives by Perimeter Similarity (RAPS)
The methodology of the RAPS technique can be explained in the following steps [17]:
Step #1: In this step, the input data are normalized, which is necessary to convert from a multidimensional into a nondimensional decision space. Equation (1) is used to perform normalization for max criteria, and for the min criteria Equation (2) is used to perform normalization:
where is the decision-making matrix of m alternatives and n criteria, i = 1, …, m and j = 1, …, n; is the maximization criteria set; is the minimization criteria set.
Step #2: The process of normalization yields the normalized decision matrix as shown in Equation (3);
Step #3: Weighted normalization. For each normalized assessment , weighted normalization in Equation (4) is used. The result value of the normalized weight is the weighted normalized matrix, and its shown in Equation (5);
Step #4: Determine the optimal alternative by identifying each element of the optimal alternative using Equation (6) which leads to the optimal alternative set in Equation (7);
Step #5: Decomposition of the optimal alternative implies the decomposition of the optimal alternative in the two subsets or two components. The set Q can be represented as the union of the two subsets, as shown in Equation (8). If k represents the total number of criteria that should be maximized, then h = n−k represents the total number of criteria that should be minimized. Hence, the optimal alternative is shown in Equation (9);
Step #6: The decomposition of the alternative is similar to step #5. This step is the decomposition of each alternative, as shown in Equations (10) and (11);
Step #7: This step is related to the magnitude of the component, which needs to calculate each component of the optimal alternative. Thus, calculate the magnitude using Equations (12) and (13) and for each alternative using Equations (14) and (15);
Step #8: Ranking the Alternatives by Perimeter Similarity (RAPS). The optimal alternative perimeter is represented as the right-angle triangle perimeter. Components and are the base and perpendicular sides of this triangle, respectively, are expressed in Equation (16). For each alternative, using Equation (17), calculate the perimeter. The ratio between the perimeter of each alternative and the optimal alternative is expressed in Equation (18). Arrange and rank alternatives according to the descending order of values of each alternative.
4. Application and Results
This paper proposes a new way to evaluate and rank departments at universities. The facts for the ranking decision, including the assessment criteria, were obtained from a public institution in the Middle East. As stated earlier, the AHP technique is used to identify the criteria weights. The evaluation score used in the pairwise matrices was collected from the university management, which evaluated the criteria based on its view of achieving the goals of the organization. Therefore, a group of three members from the college’s top management, including the dean, vice-dean for student affairs, and vice-dean for graduate studies, made the pairwise comparisons. Four main criteria were included with fourteen sub-criteria. Eight alternatives represented the departments of the engineering college. Figure 1 shows the AHP hierarchy structure, which includes the major criteria and sub-criteria. As shown in Exhibit 1, the goal is to rank Engineering departments in terms of efficiency for each department. The hierarchy model includes 4 primary criteria and 14 sub-criteria. Research and scientific productivity, graduate programs, resources, and capacity are the primary criteria.
Table 1 shows the features of the primary criterion in terms of maximizing or minimization. The weights of the main criterion and sub-criteria are determined using the Saaty Preference Scale 1–9, as indicated in Table 2. Table 3, Table 4, Table 5, Table 6 and Table 7 exhibit the pairwise comparison matrix for key criteria and sub-criteria. The normalized sub-criteria weightings are presented in Table 8, which shows that the research and scientific productivity criterion has the most valuable weight at 0.70. Therefore, Figure 2 shows the weights calculated from AHP, which is used in the RAPS technique. Table 9 shows the input data used in this study, which is from 2019 to 2021. The final ranking for each year is presented by RAPS techniques and is presented in Table 10.
5. Discussion
Based on the weights calculated from the AHP technique, Figure 2 shows the importance of each criterion calculated using the AHP technique. The data were obtained from the public university and were used in the RAPS technique and presented in Table 9. The final rank score for Engineering departments for 2019, 2020, and 2021, respectively, is presented in Table 10.
The most important criterion is C12, which represents the total number of publications by the department in the Scopus database at 0.5. The second highest weight criterion is C11, which represents the total number of book chapters produced by the departments at 0.15. The third most important criterion is the total number of students accepted in the B.S. program at 0.10. The remaining weights are disputed to the rest of the criteria between 0.01 and 0.04 based on the importance of the criteria.
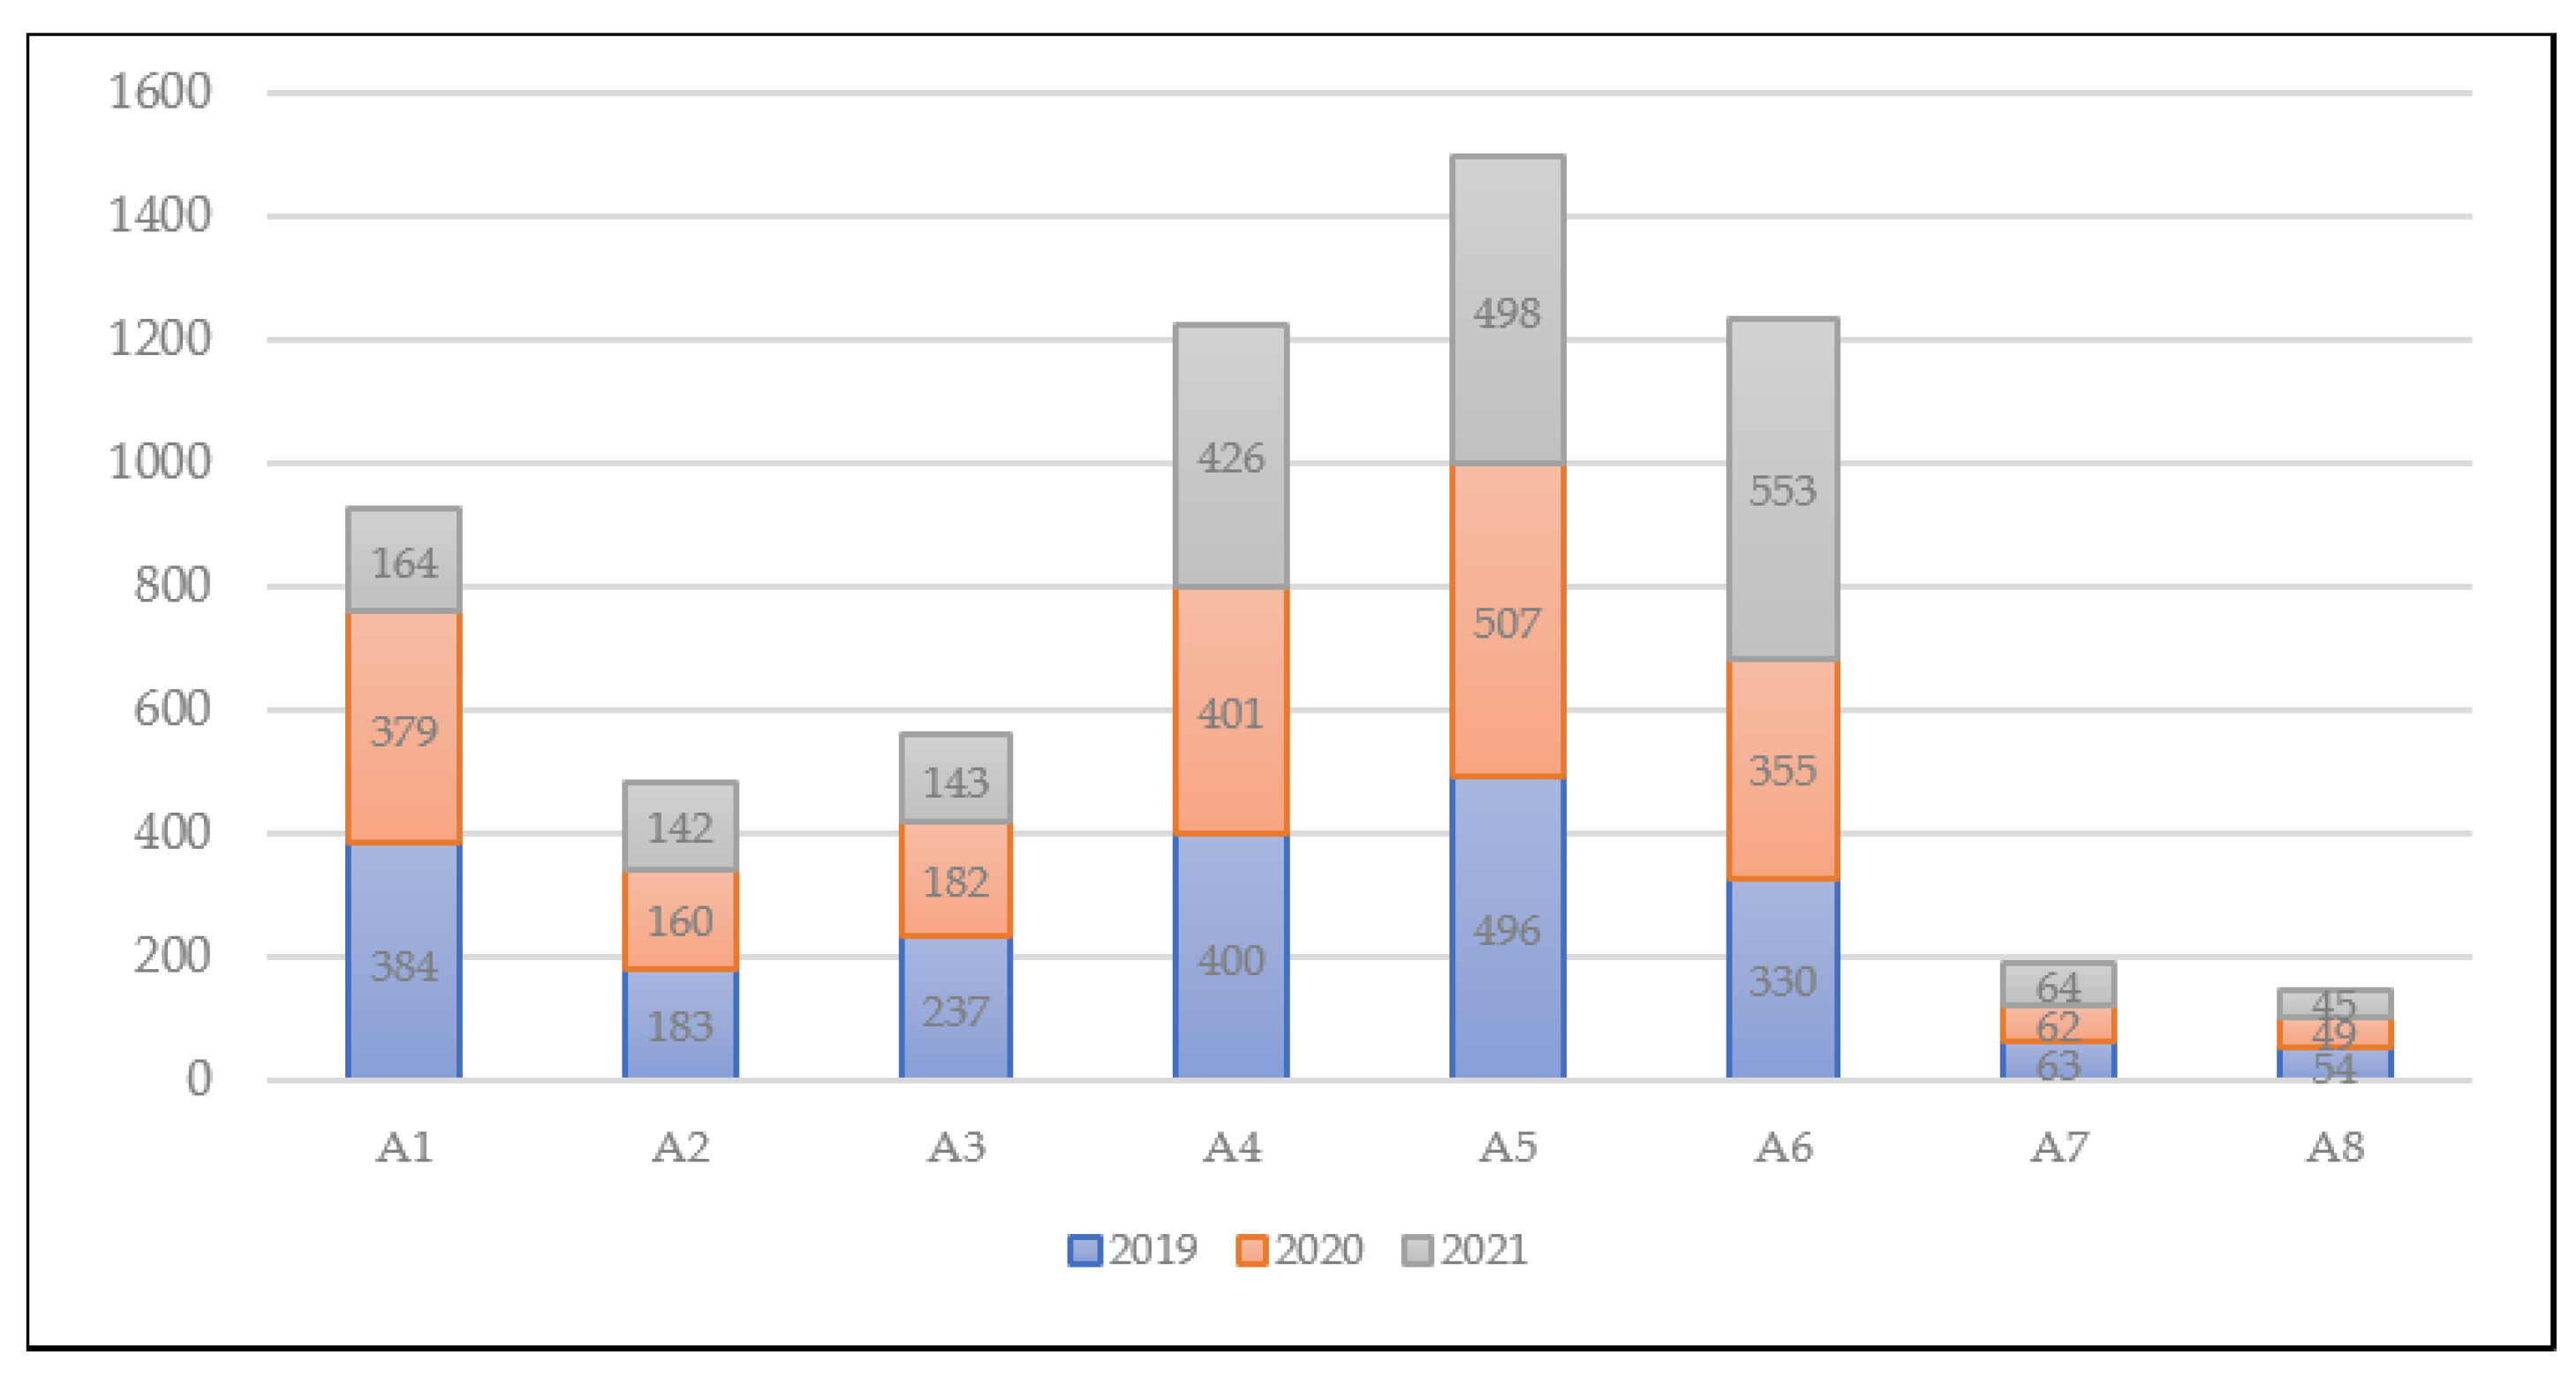
As shown in Table 10, there are departments whose ranking was stable in the three years and did not change. For instance, “A4” is in the top ranking in 2019, 2020, and 2021, respectively. The number of department publications in the Scopus database contributes to placing “A4” in the highest rank. It is very clear that “A4” is superior in the number of published research among other departments in all three years. In contrast, “A7” ranked in the last position for all three years, and the low number of published papers is a contributing factor. Another advantage that made “A4” to be ranked the highest was the number of engineering students enrolled for the bachelor’s degree, which is an important criterion from the college’s point of view. On the other hand, the enrollment of students in department “A7” ranks low among other departments. Moreover, one of the important criteria from the institution’s point of view is producing a book chapter, which that criterion has been missing in “A7” for three years. All these factors mentioned led to the declining position of department “A7” among other departments. Table 10 also reveals a fluctuation in the ranking for some departments, such as “A2”, “A5”, and “A6”. For example, in 2019, “A2” ranked fourth; in 2020, it ranked third; and in 2021, it ranked fifth. Despite the lack of published research for department A2 in all three years, the department had a book chapter published in 2019 and 2020, which helped the department to obtain advanced positions in 2019 and 2020.
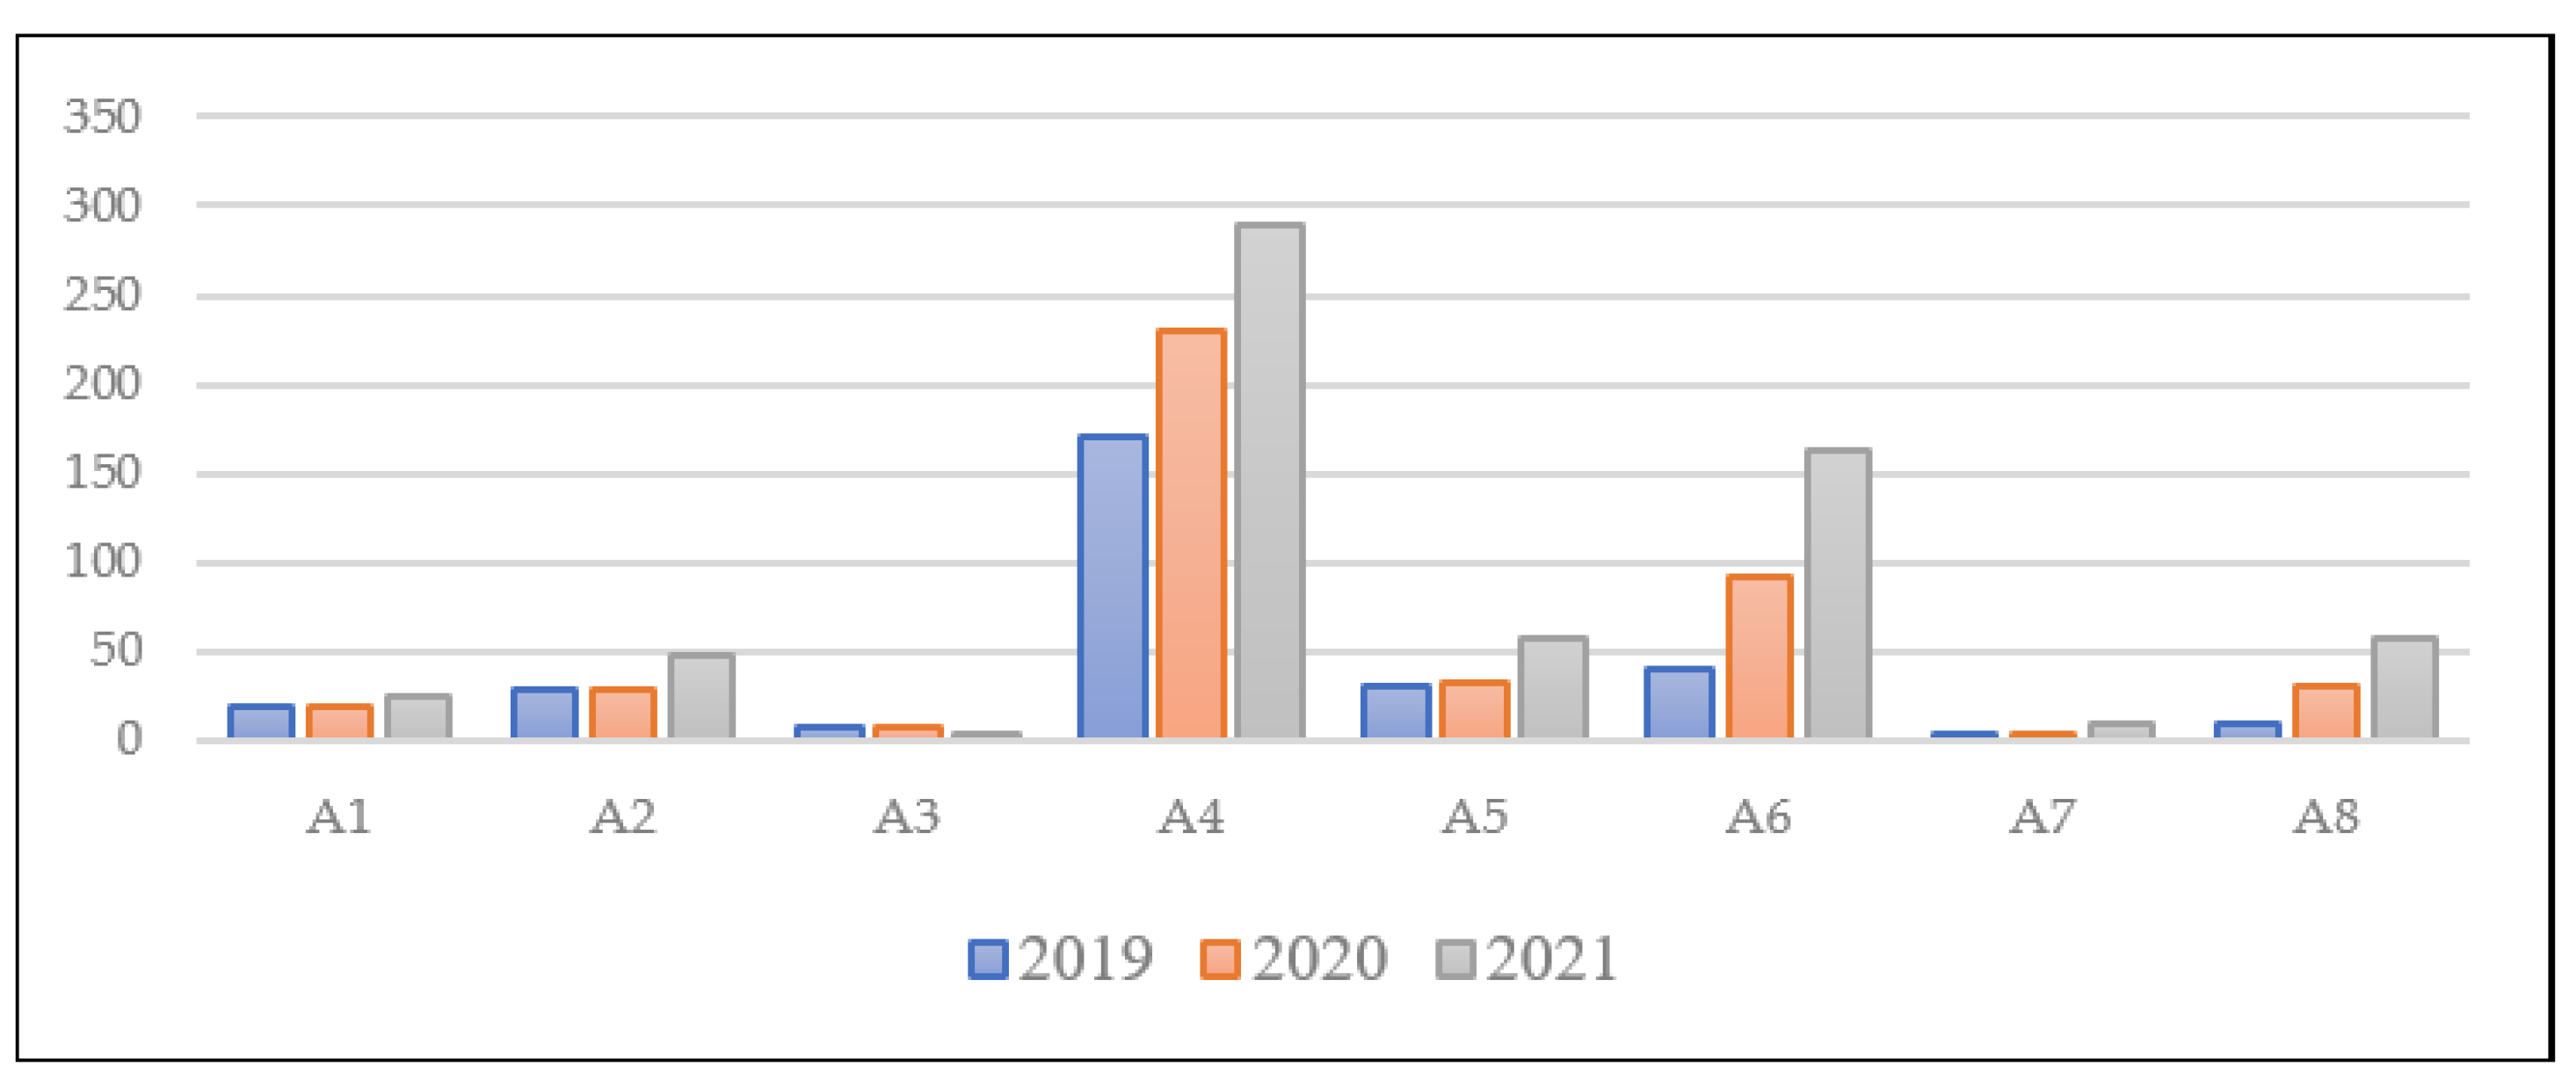
Table 10 indicates that there is competition between some departments, such as “A5” and “A6”. In 2019, A5 ranked second, while “A6” ranked third. In 2020, “A5” ranked fourth, while “A6” ranked second. In 2021, “A5” ranked third, and “A6” ranked second. The department’s superiority “A6” in 2021 was due to the department’s superiority in publishing research and publishing a book, and the total number of students joining the department contributed to its progression. Figure 2 and Figure 3 show a comparison between departments for the most important criteria.
Comparative Analysis of Different MCDM Methods
Currently, there are numerous MCDM methods available, each with its own advantages and disadvantages. In this study, the AHP method was chosen over the rest of the criteria assessment methods because of its strength in arranging the criteria’s importance as well as the presence of the consistency test to ensure evaluation consistency. On the other hand, AHP has a subjective nature and relies on emotions to be transferred to numerical judgments. In addition to that, having a large number of criteria demands a long time and effort to carry out all pairwise comparisons.
The RAPS method was chosen over the rest of the alternative assessment methods due to its logical procedure, justification, generalization, validity, and credibility of the method. While RAPS is considered a robust method, it is also considered a relatively complex procedure.
With a large number of different available MCDM methods, it is necessary to compare the results of the proposed method with other MCDM methods. Therefore, the result obtained from the proposed method used (AHP-RAPS) was compared with other well-known MCDM methods, including TOPSIS, MOORA, and VIKOR. The outcome results of the comparison are presented in Table 11. From the result obtained from the comparison analysis, the ranking order of the alternatives did not change over all MCDM methods in 2019 and 2021. This gives an indication of the stability and validity of the results for the performance of the eight sections in 2019 and 2021. However, there was a slight difference in the ranking order of the alternatives between different MCDM methods in 2020, but it is worth noting that all MCDM methods in Table 11 agreed on the consistency of the top two rankings among all MCDM methods, A4 and A6.
6. Sensitivity Analysis
For a deeper understanding of the sensitivity of the weights assigned for each criterion, conducting a sensitivity analysis offers a number of benefits to decision-makers. First, it serves as an in-depth study of some sensitive criteria. Second, it allows decision-makers to identify places where they can make improvements in the future. Finally, it allows the ability to make decisions about the continuous improvement of departments and colleges. However, there are some drawbacks to using sensitivity analysis. For example, the results coming from the sensitivity analysis are based on assumptions because the criteria are all based on historical data. This means that it is not entirely accurate, so there may be room for error when applying the analysis to future predictions.
In this study, three different cases were undertaken to increase understanding of the relationships between the most sensitive criteria. Since the highest weight value was in favor of the C12 criterion, which expresses the top management’s interest in scientific research, the weights were exchanged with other criteria that have a direct or indirect relationship to scientific research. The rankings obtained under these cases are represented in Table 12.
6.1. Case 1
In the first case, the weights of the total number of publications in Scopus (C12) and the number of proceeding papers (C13) were changed to be equally weighted. Hence, C12 and C13 were both carrying an equal weight of 0.275. Regarding changing the values given by the decision makers for C12 and C13, it was found that the ranking order of alternatives changed dramatically in 2019, 2020, and 2021. This indicates that C13 is one of the factors responsible for changing the ranking order of engineering departments.
6.2. Case 2
In the second case, the weights of the total number of publications (C12) and the total number of M.S. students (C42) were changed to be equally weighted. Hence, both C12 and C42 carried an equal weight of 0.26. Regarding changing the given values by decision-makers for C12 and C42, it was found that the ranking order of alternatives changed slightly. This shows that C42 is one of the factors that have little impact on the ranking of the Engineering departments. It was noted that the number of master’s students might contribute to an increase in the number of research publications, as some universities require graduate students to publish their research thesis as one of the requirements for obtaining the degree.
6.3. Case 3
In the third case, the weights of the total number of publications (C12) and the total number of Ph.D. students (C43) were changed to be equally weighted. Hence, both C12 and C43 carried an equal weight of 0.255. Regarding changing the given values by decision-makers for C12 and C43, it was found that the ranking changed very slightly. This shows that C43 has a very slight impact on the ranking of the Engineering departments. It was noted that the number of Ph.D. students might contribute to an increase in the number of research publications, as some universities require graduate students to publish their research thesis as one of the requirements for obtaining the degree.
7. Conclusions
In complex real-life problems, a decision-making team of experts needs to evaluate and improve the performance of the worst alternatives. There are many methods available in the field of MCDM that rank the alternatives based on the level of performance. One of the areas in which MCDM can be applied is the field of education.
Education institutions may face challenges in many aspects, such as providing high-quality education, obtaining the highest global ratings, or increasing self-financing. These challenges are due to many factors facing educational institutions. A successful education system requires evaluation at all levels. Therefore, it is necessary to continuously measure and evaluate the performance of faculties, departments, and centers in the educational institution so that decision-makers can make decisions that will contribute to achieving organizational goals.
Among all available MCDM methods, this paper primarily focused on the use of integrated MCDM tools between AHP and RAPS for ranking the departments within a college. The RAPS method was used to rank the alternatives, while the AHP technique was utilized to establish the weight of each criterion specified in this paper. The data from 2019 to 2021 were used in this study. The use of AHP-RAPS in the educational sector was presented for the first time. Based on the results of the proposed method, the levels of superiority and inferiority of alternatives can be identified, which in turn gives more room for decision-makers to take necessary actions to raise the overall performance of low-ranked alternatives. The College of Engineering in a public university was chosen to be the case of this study. The selected university is considered one of the top 150 universities in the world according to the Shanghai classification 2022, which depends on the outcomes of the educational and research process, in addition to the fact that the college of Engineering is accredited by the Accreditation Board for Engineering and Technology (ABET).
Based on the calculated criteria weights, the “total number of publications in the Scopus database” C12 had the highest weight among other criteria, and this indicates the importance of scientific research at the selected university. Therefore, the performance of departments that have high publication records in the Scopes database was high.
Sensitivity analysis was performed in this study, and its results showed that the ranking might fluctuate when the weights change between the criteria.
This study recommends that the departments in the last ranking need more support from faculty members such as encouragement to publish research papers in the Scopus database or produce and publish book chapters.
Moreover, this study recommends providing different types of motivation to the low-ranking department to encourage faculty members to publish more research papers, which will help and contribute to improving the department’s ranking positions.
This paper also recommends decision-makers who are attentive to scientific research to study the increase in the number of postgraduate students in the departments, which may contribute to an increase in the number of research publications, as some universities require graduate students to publish their research thesis as one of the requirements for obtaining the degree.
Finally, the outcomes of this study suggest that combining AHP and RAPS to evaluate and rank university departments yields highly promising results.
Author Contributions
Conceptualization and methodology, O.A.B., R.M.S.A. and M.R.K.; validation, O.A.B., R.M.S.A. and M.R.K.; data curation, M.R.K.; writing—review and editing, O.A.B., R.M.S.A. and M.R.K. All authors have read and agreed to the published version of the manuscript.
Funding
This research received no external funding.
Institutional Review Board Statement
Not applicable.
Informed Consent Statement
Not applicable.
Data Availability Statement
The data supporting the findings of this study are available within the article.
Conflicts of Interest
The authors declare no conflict of interest.
References
- Yap, J.Y.L.; Ho, C.C.; Ting, C.-Y. A systematic review of the applications of multi-criteria decision-making methods in site selection problems. Built Environ. Proj. Asset Manag. 2019, 9, 548–563. [Google Scholar] [CrossRef]
- Fofan, A.C.; de Oliveira, L.A.B.; de Melo, F.J.C.; de Jerônimo, T.B.; de Medeiros, D.D. An Integrated Methodology Using PROMETHEE and Kano’s Model to Rank Strategic Decisions. Eng. Manag. J. 2019, 31, 270–283. [Google Scholar] [CrossRef]
- Ozsahin, D.U.; Denker, A.; Kibarer, A.G.; Kaba, S. Evaluation of stage IV brain cancer treatment techniques. In Applications of Multi-Criteria Decision-Making Theories in Healthcare and Biomedical Engineering; Elsevier: Amsterdam, The Netherlands, 2021; pp. 59–69. [Google Scholar]
- Chen, C.-H. A new multi-criteria assessment model combining GRA techniques with intuitionistic fuzzy entropy-based TOPSIS method for sustainable building materials supplier selection. Sustainability 2019, 11, 2265. [Google Scholar] [CrossRef] [Green Version]
- Ibrahim, A.; Surya, R.A. The implementation of simple additive weighting (SAW) method in decision support system for the best school selection in Jambi. J. Phys. Conf. Ser. 2019, 1338, 12054. [Google Scholar] [CrossRef] [Green Version]
- Kraujalienė, L. Comparative analysis of multicriteria decision-making methods evaluating the efficiency of technology transfer. Bus. Manag. Educ. 2019, 17, 72–93. [Google Scholar] [CrossRef]
- Kabassi, K. Comparing Multi-Criteria Decision Making Models for Evaluating Environmental Education Programs. Sustainability 2021, 13, 11220. [Google Scholar] [CrossRef]
- Miç, P.; Antmen, Z.F. A Decision-Making Model Based on TOPSIS, WASPAS, and MULTIMOORA Methods for University Location Selection Problem. SAGE Open 2021, 11, 21582440211040116. [Google Scholar] [CrossRef]
- Thakkar, J.J. Multi-Criteria Decision Making; Springer: Berlin/Heidelberg, Germany, 2021; Volume 336. [Google Scholar]
- Karunathilake, H.; Bakhtavar, E.; Chhipi-Shrestha, G.; Mian, H.R.; Hewage, K.; Sadiq, R. Decision making for risk management: A multi-criteria perspective. In Methods in chemical Process Safety; Elsevier: Amsterdam, The Netherlands, 2020; Volume 4, pp. 239–287. [Google Scholar]
- Vásquez, J.A.; Escobar, J.W.; Manotas, D.F. AHP–TOPSIS Methodology for Stock Portfolio Investments. Risks 2021, 10, 4. [Google Scholar] [CrossRef]
- De Almeida, A.T.; Cavalcante, C.A.V.; Alencar, M.H.; Ferreira, R.J.P.; de Almeida-Filho, A.T.; Garcez, T.V. Multicriteria and Multiobjective Models for Risk, Reliability and Maintenance Decision Analysis; Springer: Berlin/Heidelberg, Germany, 2015; Volume 231. [Google Scholar]
- Su, W.; Zhang, L.; Zhang, C.; Zeng, S.; Liu, W.A. Heterogeneous Information-Based Multi-Attribute Decision Making Framework for Teaching Model Evaluation in Economic Statistics. Systems 2022, 10, 86. [Google Scholar] [CrossRef]
- Syed Hassan, S.A.H.; Tan, S.C.; Yusof, K.M. MCDM for engineering education: Literature review and research issues. In Engineering Education for a Smart Society; Spring: Berlin/Heidelberg, Germany, 2016; pp. 204–214. [Google Scholar]
- Jongbloed, B.; Vossensteyn, H. Keeping up performances: An international survey of performance-based funding in higher education. J. High. Educ. Policy Manag. 2001, 23, 127–145. [Google Scholar] [CrossRef]
- Buzzigoli, L.; Giusti, A.; Viviani, A. The evaluation of university departments. A case study for Firenze. Int. Adv. Econ. Res. 2010, 16, 24–38. [Google Scholar] [CrossRef]
- Urošević, K.; Gligorić, Z.; Miljanović, I.; Beljić, C.; Gligorić, M. Novel methods in multiple criteria decision-making process (Mcrat and raps)—Application in the mining industry. Mathematics 2021, 9, 1980. [Google Scholar] [CrossRef]
- Marqués, A.I.; García, V.; Sánchez, J.S. Ranking-based MCDM models in financial management applications: Analysis and emerging challenges. Prog. Artif. Intell. 2020, 9, 171–193. [Google Scholar] [CrossRef]
- Akram, M.; Ilyas, F.; Garg, H. Multi-criteria group decision making based on ELECTRE I method in Pythagorean fuzzy information. Soft Comput. 2020, 24, 3425–3453. [Google Scholar] [CrossRef]
- Komsiyah, S.; Wongso, R.; Pratiwi, S.W. Applications of the fuzzy ELECTRE method for decision support systems of cement vendor selection. Procedia Comput. Sci. 2019, 157, 479–488. [Google Scholar] [CrossRef]
- Sembiring, B.S.B.; Zarlis, M.; Agusnady, A.; Qowidho, T. Comparison of SMART and SAW Methods in Decision Making. J. Phys. Conf. Ser. 2019, 1255, 12095. [Google Scholar] [CrossRef]
- Shahsavar, S.; Jafari Rad, A.; Afzal, P.; Nezafati, N.; Akhavan Aghdam, M. Prospecting for polymetallic mineralization using step-wise weight assessment ratio analysis (SWARA) and fractal modeling in Aghkand Area, NW Iran. Arab. J. Geosci. 2019, 12, 248. [Google Scholar] [CrossRef]
- Saaty, T.L. The Analytic Hierarchy Process: Decision Making in Complex Environments BT—Quantitative Assessment in Arms Control: Mathematical Modeling and Simulation in the Analysis of Arms Control Problems; Avenhaus, R., Huber, R.K., Eds.; Springer: Boston, MA, USA, 1984; pp. 285–308. [Google Scholar]
- Pakkar, M.S. A hierarchical aggregation approach for indicators based on data envelopment analysis and analytic hierarchy process. Systems 2016, 4, 6. [Google Scholar] [CrossRef] [Green Version]
- Sari, F.; Kandemir, İ.; Ceylan, D.A.; Gül, A. Using AHP and PROMETHEE multi-criteria decision making methods to define suitable apiary locations. J. Apic. Res. 2020, 59, 546–557. [Google Scholar] [CrossRef]
- Issa, U.; Saeed, F.; Miky, Y.; Alqurashi, M.; Osman, E. Hybrid AHP-Fuzzy TOPSIS Approach for Selecting Deep Excavation Support System. Buildings 2022, 12, 295. [Google Scholar] [CrossRef]
- Rezaei, J. Best-worst Multi-criteria Decision-making Method. Omega 2015, 53, 49–57. [Google Scholar] [CrossRef]
- Van de Kaa, G.; Fens, T.; Rezaei, J.; Kaynak, D.; Hatun, Z.; Tsilimeni-Archangelidi, A. Realizing smart meter connectivity: Analyzing the competing technologies Power line communication, mobile telephony, and radio frequency using the best worst method. Renew. Sustain. Energy Rev. 2019, 103, 320–327. [Google Scholar] [CrossRef]
- Khan, S.A.; Ojiako, U.; Marshall, A.; Dalalah, D.; Ceylan, S.; Ali Shabani, N.N.; Al Sharqawi, S.I. The Critical Risk Factors that Influence Production-oriented Projects in the United Arab Emirates: A ‘Best-worst Method’(BWM) Analysis. Eng. Manag. J. 2022, 1–17. [Google Scholar] [CrossRef]
- Mi, X.; Tang, M.; Liao, H.; Shen, W.; Lev, B. The state-of-the-art survey on integrations and applications of the best worst method in decision making: Why, what, what for and what’s next? Omega 2019, 87, 205–225. [Google Scholar] [CrossRef]
- Akram, M.; Al-Kenani, A.N.; Alcantud, J.C.R. Group decision-making based on the VIKOR method with trapezoidal bipolar fuzzy information. Symmetry 2019, 11, 1313. [Google Scholar] [CrossRef] [Green Version]
- Yu, P.-L. A class of solutions for group decision problems. Manag. Sci. 1973, 19, 936–946. [Google Scholar] [CrossRef]
- Arslan, A.E.; Arslan, O.; Kandemir, S.Y. AHP–TOPSIS hybrid decision-making analysis: Simav integrated system case study. J. Therm. Anal. Calorim. 2021, 145, 1191–1202. [Google Scholar] [CrossRef]
- Taylan, O.; Bafail, A.O.; Abdulaal, R.M.S.; Kabli, M.R. Construction projects selection and risk assessment by fuzzy AHP and fuzzy TOPSIS methodologies. Appl. Soft Comput. 2014, 17, 105–116. [Google Scholar] [CrossRef]
- Hwang, C.-L.; Yoon, K. Multiple Attribute Decision Making, 1st ed.; Springer: Berlin/Heidelberg, Germany, 1981. [Google Scholar]
- Ishak, A.; Akmaliah, V. Analytical Hierarchy Process and PROMETHEE as Decision Making Tool: A Review. IOP Conf. Ser. Mater. Sci. Eng. 2019, 505, 12085. [Google Scholar] [CrossRef] [Green Version]
- Julong, D. Introduction to grey system theory. J. Grey Syst. 1989, 1, 1–24. [Google Scholar]
- Supçiller, A.A.; Bayramoğlu, S. Wind farm location selection with interval grey numbers based I-GRA and grey EDAS methods. J. Fac. Eng. Archit. Gazi Univ. 2020, 35, 1847–1860. [Google Scholar]
- Brauers, W.K.; Zavadskas, E.K. The MOORA method and its application to privatization in a transition economy. Control Cybern. 2006, 35, 445–469. [Google Scholar]
- Moradian, M.; Modanloo, V.; Aghaiee, S. Comparative analysis of multi criteria decision making techniques for material selection of brake booster valve body. J. Traffic Transp. Eng. 2019, 6, 526–534. [Google Scholar] [CrossRef]
- Zavadskas, E.K.; Kaklauskas, A. Pastatų sistemotechninis įvertinimas [eng. Systemic-technical assessment of buildings]. Vilnius Tech. 1996, 4. [Google Scholar]
- Krishankumar, R.; Garg, H.; Arun, K.; Saha, A.; Ravichandran, K.S.; Kar, S. An integrated decision-making COPRAS approach to probabilistic hesitant fuzzy set information. Complex Intell. Syst. 2021, 7, 2281–2298. [Google Scholar] [CrossRef]
- Kusnady, D. Implementation of Computer-Based Systems in Efficient Credit Acceptance Decisions Applying the Addi-tive Ratio Assessment (ARAS) Method. J. Phys. Conf. Ser. 2019, 1424, 12018. [Google Scholar]
- Zulqarnain, R.M.; Xin, X.L.; Saeed, M.; Ahmad, N.; Dayan, F.; Ahmad, B. Recruitment of medical staff in health department by using TOPSIS method. Int. J. Pharm. Sci. Rev. Res. 2020, 62, 1–7. [Google Scholar]
- Hafezalkotob, A.; Hafezalkotob, A.; Liao, H.; Herrera, F. An overview of MULTIMOORA for multi-criteria decision-making: Theory, developments, applications, and challenges. Inf. Fusion 2019, 51, 145–177. [Google Scholar] [CrossRef]
- Tuan, N.A.; Hue, T.T.; Lien, L.T.; Thao, T.D.; Quyet, N.D.; Van, L.H.; Anh, L.T. A new integrated MCDM approach for lecturers’ research productivity evaluation. Decis. Sci. Lett. 2020, 9, 355–364. [Google Scholar] [CrossRef]
- Turan, H. Assessment factors affecting e-learning using fuzzy analytic hierarchy process and SWARA. Int. J. Eng. Educ. 2018, 34, 915–923. [Google Scholar]
- Biswas, T.K.; Chaki, S.; Das, M.C. MCDM technique application to the selection of an Indian institute of technology. Oper. Res. Eng. Sci. Theory Appl. 2019, 2, 65–76. [Google Scholar] [CrossRef]
- Kazan, H.; Karaman, E.; Akçalı, B.Y.; Şişmanoğlu, E. Assessment of teog examination success: Topsis multi-criteria decision-making method practice. Procedia-Soc. Behav. Sci. 2015, 195, 915–924. [Google Scholar] [CrossRef] [Green Version]
- Koltharkar, P.; Eldhose, K.K.; Sridharan, R. Application of fuzzy TOPSIS for the prioritization of students’ requirements in higher education institutions: A case study: A multi-criteria decision making approach. In Proceedings of the 2020 International Conference on System, Computation, Automation and Networking (ICSCAN), Pondicherry, India, 30 November 2020; pp. 1–7. [Google Scholar]
- Mohammed, H.J.; Kasim, M.M.; Shaharanee, I.N. Evaluation of E-learning approaches using AHP-TOPSIS technique. J. Telecommun. Electron. Comput. Eng. 2018, 10, 7–10. [Google Scholar]
- Shekhovtsov, A.; Sałabun, W. A comparative case study of the VIKOR and TOPSIS rankings similarity. Procedia Comput. Sci. 2020, 176, 3730–3740. [Google Scholar] [CrossRef]
- Perdana, A.; Budiman, A. College Ranking Analysis Using VIKOR Method. J. Comput. Netw. Archit. High Perform. Comput. 2021, 3, 241–248. [Google Scholar] [CrossRef]
- Ayouni, S.; Menzli, L.J.; Hajjej, F.; Maddeh, M.; Al-Otaibi, S. Fuzzy Vikor application for learning management systems evaluation in higher education. Int. J. Inf. Commun. Technol. Educ. 2021, 17, 17–35. [Google Scholar] [CrossRef]
- Monalisa, R.; Kusnawi, K. Decision support system of model teacher selection using PROMETHEE method. In Proceedings of the 2017 International Conference on Innovative and Creative Information Technology (ICITech), Salatiga, Indonesia, 2–4 November 2017; pp. 1–8. [Google Scholar]
- Hanifatulqolbi, D.; Ismail, I.E.; Hammad, J.; Al-Hooti, M.H. Decision support system for considering the best teacher performance using MOORA method. J. Phys. Conf. Ser. 2019, 1193, 12018. [Google Scholar] [CrossRef]
- Alinezhad, A.; Khalili, J. New Methods and Applications in Multiple Attribute Decision Making (MADM); Springer: Berlin/Heidelberg, Germany, 2019; Volume 277. [Google Scholar]
- Bhushan, N.; Rai, K. Strategic Decision Making. In Strategic Decision Making; Springer: London, UK, 2004. [Google Scholar]
- Saaty, T.L. The analytic hierarchy and analytic network measurement processes: Applications to decisions under Risk. Eur. J. Pure Appl. Math. 2008, 1, 122–196. [Google Scholar] [CrossRef]
Figure 1.
Hierarchy model of Engineering department’s selection.
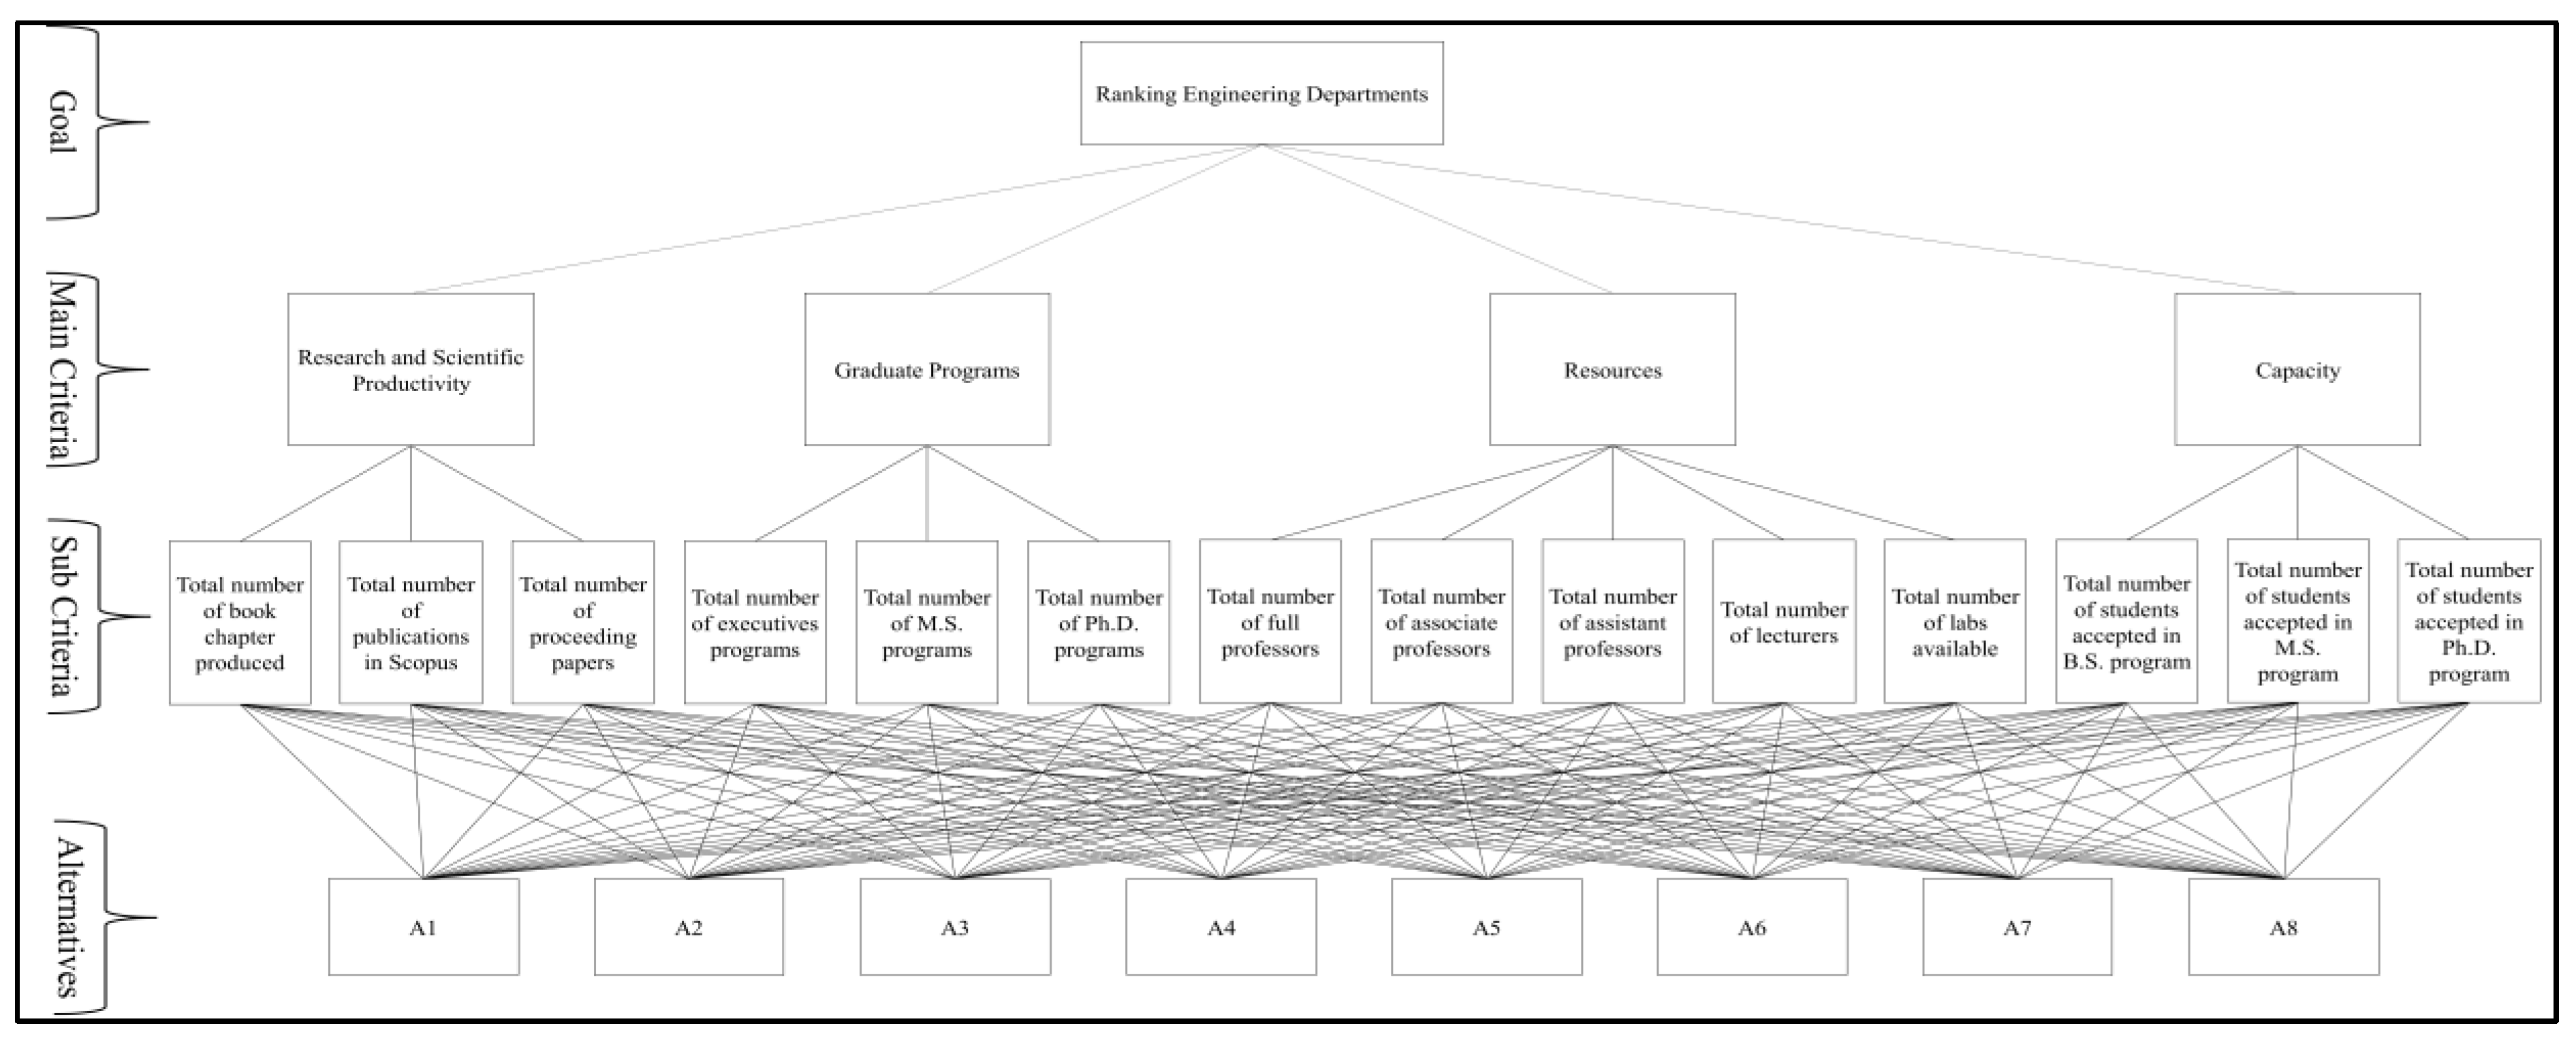
Figure 2.
Total number of published papers in the Scopus for each department.

Figure 3.
Total number of enrollment students for each department over the three years.

Table 1.
Main-criteria and sub-criteria with their feature.
| Criteria/Sub-Criteria | Feature |
|---|---|
| Research and Scientific Productivity (C1) | Max |
| Total number of book chapters produced (C11) | Max |
| Total number of publications in Scopus (C12) | Max |
| Total number of proceeding papers (C13) | Max |
| Graduate Programs (C2) | Max |
| Total number of executives programs (C21) | Max |
| Total number of M.S. programs (C22) | Max |
| Total number of Ph.D. programs (C23) | Max |
| Resources (C3) | Max |
| Total number of full professors (C31) | Max |
| Total number of associate professors (C32) | Max |
| Total number of assistant professors (C33) | Max |
| Total number of lecturers (C34) | Max |
| Total number of labs available (C35) | Max |
| Capacity (C4) | Max |
| Total number of students accepted in B.S. program (C41) | Max |
| Total number of students accepted in M.S. program (C42) | Max |
| Total number of students accepted in Ph.D. program (C43) | Max |
Table 2.
Evaluation score used in the pairwise matrix.
| Verbal Judgment | Numeric Value |
|---|---|
| Extremely important | 9 |
| 8 | |
| Very strongly more important | 7 |
| 6 | |
| Strongly more important | 5 |
| 4 | |
| Moderately more important | 3 |
| 2 | |
| Equally important | 1 |
Table 3.
The pairwise comparison matrix of the main criteria.
| Criteria No. | C1 | C2 | C3 | C4 | Weights |
|---|---|---|---|---|---|
| C1 | 1 | 9 | 8 | 7 | 0.70 |
| C2 | 1/9 | 1 | 1/3 | 1/3 | 0.05 |
| C3 | 1/8 | 3 | 1 | 1 | 0.12 |
| C4 | 1/7 | 3 | 1 | 1 | 0.13 |
| Consistency ratio = 8% | |||||
Table 4.
The pairwise comparison matrix of the sub‐criteria with respect to criterion C1.
| Criteria No. | C11 | C12 | C13 | Weights |
|---|---|---|---|---|
| C11 | 1 | 1 | 6 | 0.44 |
| C12 | 1 | 1 | 8 | 0.49 |
| C13 | 1/6 | 1/8 | 1 | 0.07 |
| Consistency ratio = 1% | ||||
Table 5.
The pairwise comparison matrix of the sub‐criteria with respect to criterion C2.
| Criteria No. | C21 | C22 | C23 | Weights |
|---|---|---|---|---|
| C21 | 1 | 6 | 4 | 0.71 |
| C22 | 1/6 | 1 | 1 | 0.13 |
| C23 | 1/4 | 1 | 1 | 0.16 |
| Consistency ratio = 3% | ||||
Table 6.
The pairwise comparison matrix of the sub‐criteria with respect to criterion C3.
| Criteria No. | C31 | C32 | C33 | C34 | C35 | Weights |
|---|---|---|---|---|---|---|
| C31 | 1 | 3 | 4 | 5 | 8 | 0.35 |
| C32 | 1/3 | 1 | 1 | 2 | 4 | 0.15 |
| C33 | 2 | 3 | 1 | 3 | 3 | 0.35 |
| C34 | 1/5 | 1/2 | 1/3 | 1 | 2 | 0.09 |
| C35 | 1/8 | 1/4 | 1/3 | 1/2 | 1 | 0.06 |
| Consistency ratio = 3% | ||||||
Table 7.
The pairwise comparison matrix of the sub‐criteria with respect to criterion C4.
| Criteria No. | C41 | C42 | C43 | Weights |
|---|---|---|---|---|
| C41 | 1 | 5 | 7 | 0.73 |
| C42 | 1/5 | 1 | 3 | 0.19 |
| C43 | 1/7 | 1/3 | 1 | 0.08 |
| Consistency ratio = 10% | ||||
Table 8.
The normalized sub-criteria weightings.
| Criteria/Sub-Criteria | Level-One Weight | Level-Two Weight | Overall Weight |
|---|---|---|---|
| Research and Scientific Productivity | 0.70 | 0.70 | |
| Total number of book chapters produced | 0.21 | 0.15 | |
| Total number of publications in Scopus | 0.72 | 0.50 | |
| Total number of proceeding papers | 0.07 | 0.05 | |
| Graduate Programs | 0.05 | 0.05 | |
| Total number of executives programs | 0.71 | 0.04 | |
| Total number of M.S. programs | 0.13 | 0.01 | |
| Total number of Ph.D. programs | 0.16 | 0.01 | |
| Resources | 0.12 | 0.12 | |
| Total number of full professors | 0.35 | 0.04 | |
| Total number of associate professors | 0.15 | 0.02 | |
| Total number of assistant professors | 0.35 | 0.04 | |
| Total number of lecturers | 0.09 | 0.01 | |
| Total number of labs available | 0.06 | 0.01 | |
| Capacity | 0.13 | 0.13 | |
| Total number of students accepted into B.S. program | 0.73 | 0.10 | |
| Total number of students accepted into M.S. program | 0.19 | 0.02 | |
| Total number of students accepted into Ph.D. program | 0.08 | 0.01 |
Table 9.
Input data from the year 2019 to the year 2021.
| Alternatives | Criteria | |||||||||||||
|---|---|---|---|---|---|---|---|---|---|---|---|---|---|---|
| C11 | C12 | C13 | C21 | C22 | C23 | C31 | C32 | C33 | C34 | C35 | C41 | C42 | C43 | |
| Weights | ||||||||||||||
| 0.15 | 0.50 | 0.05 | 0.04 | 0.01 | 0.01 | 0.04 | 0.02 | 0.04 | 0.01 | 0.01 | 0.10 | 0.02 | 0.01 | |
| 2019 | ||||||||||||||
| A1 | 0 | 19 | 11 | 0 | 1 | 1 | 6 | 3 | 5 | 1 | 16 | 384 | 0 | 0 |
| A2 | 1 | 29 | 2 | 0 | 1 | 1 | 7 | 7 | 4 | 3 | 17 | 183 | 2 | 1 |
| A3 | 0 | 7 | 0 | 0 | 2 | 1 | 14 | 7 | 13 | 0 | 32 | 237 | 11 | 0 |
| A4 | 0 | 170 | 39 | 0 | 4 | 1 | 17 | 15 | 35 | 6 | 31 | 400 | 41 | 7 |
| A5 | 3 | 30 | 4 | 1 | 3 | 1 | 9 | 13 | 24 | 6 | 7 | 496 | 67 | 0 |
| A6 | 0 | 41 | 2 | 0 | 2 | 1 | 15 | 15 | 13 | 0 | 24 | 330 | 17 | 0 |
| A7 | 0 | 4 | 0 | 0 | 2 | 1 | 4 | 4 | 2 | 1 | 5 | 63 | 0 | 1 |
| A8 | 0 | 10 | 2 | 0 | 1 | 0 | 4 | 6 | 13 | 0 | 10 | 54 | 3 | 0 |
| 2020 | ||||||||||||||
| A1 | 0 | 19 | 4 | 0 | 1 | 1 | 6 | 3 | 5 | 1 | 16 | 379 | 7 | 3 |
| A2 | 2 | 28 | 0 | 0 | 1 | 1 | 7 | 7 | 4 | 3 | 17 | 160 | 8 | 3 |
| A3 | 0 | 8 | 3 | 0 | 2 | 1 | 14 | 7 | 13 | 0 | 32 | 182 | 13 | 2 |
| A4 | 0 | 230 | 170 | 0 | 4 | 1 | 17 | 15 | 35 | 6 | 31 | 401 | 58 | 6 |
| A5 | 1 | 32 | 5 | 1 | 3 | 1 | 9 | 13 | 24 | 6 | 7 | 507 | 98 | 0 |
| A6 | 0 | 93 | 0 | 0 | 2 | 1 | 15 | 15 | 13 | 0 | 24 | 355 | 29 | 7 |
| A7 | 0 | 5 | 0 | 0 | 2 | 1 | 4 | 4 | 2 | 1 | 5 | 62 | 1 | 1 |
| A8 | 0 | 31 | 2 | 0 | 1 | 0 | 4 | 6 | 13 | 0 | 10 | 49 | 2 | 0 |
| 2021 | ||||||||||||||
| A1 | 0 | 26 | 4 | 0 | 1 | 1 | 4 | 2 | 4 | 1 | 16 | 164 | 2 | 0 |
| A2 | 0 | 48 | 0 | 0 | 1 | 1 | 7 | 8 | 10 | 0 | 17 | 142 | 3 | 0 |
| A3 | 0 | 4 | 0 | 0 | 2 | 1 | 11 | 12 | 17 | 0 | 32 | 143 | 7 | 0 |
| A4 | 1 | 289 | 26 | 0 | 4 | 1 | 16 | 29 | 31 | 3 | 31 | 426 | 26 | 12 |
| A5 | 0 | 57 | 4 | 1 | 3 | 1 | 9 | 11 | 18 | 5 | 7 | 498 | 92 | 0 |
| A6 | 1 | 163 | 2 | 0 | 2 | 1 | 13 | 11 | 24 | 0 | 24 | 553 | 11 | 2 |
| A7 | 0 | 10 | 0 | 0 | 2 | 1 | 2 | 2 | 6 | 1 | 5 | 64 | 1 | 0 |
| A8 | 0 | 57 | 0 | 0 | 1 | 0 | 6 | 8 | 12 | 2 | 10 | 45 | 4 | 0 |
Table 10.
Final rank for Engineering departments using RAPS.
| 2019 | |||||
|---|---|---|---|---|---|
| Alternatives | Q | P | PSi | Final Rank | |
| 0.5395 | 0.0000 | 1.08 | |||
| A1 | 0.0985 | 0.0000 | 0.20 | 0.183 | 5 |
| A2 | 0.1081 | 0.0000 | 0.22 | 0.200 | 4 |
| A3 | 0.0658 | 0.0000 | 0.13 | 0.122 | 6 |
| A4 | 0.5131 | 0.0000 | 1.03 | 0.951 | 1 |
| A5 | 0.2099 | 0.0000 | 0.42 | 0.389 | 2 |
| A6 | 0.1451 | 0.0000 | 0.29 | 0.269 | 3 |
| A7 | 0.0235 | 0.0000 | 0.05 | 0.044 | 8 |
| A8 | 0.0372 | 0.0000 | 0.07 | 0.069 | 7 |
| 2020 | |||||
| A1 | 0.0877 | 0.0000 | 0.18 | 0.163 | 5 |
| A2 | 0.1666 | 0.0000 | 0.33 | 0.309 | 3 |
| A3 | 0.0568 | 0.0000 | 0.11 | 0.105 | 7 |
| A4 | 0.5128 | 0.0000 | 1.03 | 0.950 | 1 |
| A5 | 0.1557 | 0.0000 | 0.31 | 0.288 | 4 |
| A6 | 0.2190 | 0.0000 | 0.44 | 0.406 | 2 |
| A7 | 0.0229 | 0.0000 | 0.05 | 0.042 | 8 |
| A8 | 0.0709 | 0.0000 | 0.14 | 0.131 | 6 |
| 2021 | |||||
| A1 | 0.0568 | 0.0000 | 0.11 | 0.105 | 6 |
| A2 | 0.0905 | 0.0000 | 0.18 | 0.168 | 5 |
| A3 | 0.0474 | 0.0000 | 0.09 | 0.088 | 7 |
| A4 | 0.5339 | 0.0000 | 1.07 | 0.989 | 1 |
| A5 | 0.1458 | 0.0000 | 0.29 | 0.270 | 3 |
| A6 | 0.3381 | 0.0000 | 0.68 | 0.627 | 2 |
| A7 | 0.0255 | 0.0000 | 0.05 | 0.047 | 8 |
| A8 | 0.1016 | 0.0000 | 0.20 | 0.188 | 4 |
Table 11.
A comparative MCDM analysis of the Final rank for Engineering departments.
| Alternatives | AHP-RAPS | AHP-TOPSIS | AHP-MOORA | AHP-VIKOR V = 0.5 |
|---|---|---|---|---|
| 2019 | ||||
| A1 | 5 | 5 | 5 | 5 |
| A2 | 4 | 4 | 4 | 4 |
| A3 | 6 | 6 | 6 | 6 |
| A4 | 1 | 1 | 1 | 1 |
| A5 | 2 | 2 | 2 | 2 |
| A6 | 3 | 3 | 3 | 3 |
| A7 | 8 | 8 | 8 | 8 |
| A8 | 7 | 7 | 7 | 7 |
| 2020 | ||||
| A1 | 5 | 6 | 6 | 5 |
| A2 | 3 | 3 | 3 | 4 |
| A3 | 7 | 7 | 7 | 7 |
| A4 | 1 | 1 | 1 | 1 |
| A5 | 4 | 4 | 4 | 3 |
| A6 | 2 | 2 | 2 | 2 |
| A7 | 8 | 8 | 8 | 8 |
| A8 | 6 | 5 | 5 | 6 |
| 2021 | ||||
| A1 | 6 | 6 | 6 | 6 |
| A2 | 5 | 5 | 5 | 5 |
| A3 | 7 | 7 | 7 | 7 |
| A4 | 1 | 1 | 1 | 1 |
| A5 | 3 | 3 | 3 | 3 |
| A6 | 2 | 2 | 2 | 2 |
| A7 | 8 | 8 | 8 | 8 |
| A8 | 4 | 4 | 3 | 4 |
Table 12.
Sensitivity analysis of the Final rank for Engineering departments.
| Alternatives | Original | Case 1 | Case 2 | Case 3 |
|---|---|---|---|---|
| 2019 | ||||
| A1 | 5 | 3 | 4 | 5 |
| A2 | 4 | 5 | 5 | 4 |
| A3 | 6 | 6 | 6 | 6 |
| A4 | 1 | 1 | 1 | 1 |
| A5 | 2 | 2 | 2 | 2 |
| A6 | 3 | 4 | 3 | 3 |
| A7 | 8 | 8 | 8 | 7 |
| A8 | 7 | 7 | 7 | 8 |
| 2020 | ||||
| A1 | 5 | 5 | 5 | 5 |
| A2 | 3 | 2 | 3 | 3 |
| A3 | 7 | 6 | 6 | 6 |
| A4 | 1 | 1 | 1 | 1 |
| A5 | 4 | 3 | 2 | 4 |
| A6 | 2 | 4 | 4 | 2 |
| A7 | 8 | 8 | 8 | 7 |
| A8 | 6 | 7 | 7 | 8 |
| 2021 | ||||
| A1 | 6 | 4 | 7 | 7 |
| A2 | 5 | 6 | 5 | 5 |
| A3 | 7 | 7 | 6 | 6 |
| A4 | 1 | 1 | 1 | 1 |
| A5 | 3 | 3 | 2 | 3 |
| A6 | 2 | 2 | 3 | 2 |
| A7 | 8 | 8 | 8 | 8 |
| A8 | 4 | 5 | 4 | 4 |
Publisher’s Note: MDPI stays neutral with regard to jurisdictional claims in published maps and institutional affiliations. |
© 2022 by the authors. Licensee MDPI, Basel, Switzerland. This article is an open access article distributed under the terms and conditions of the Creative Commons Attribution (CC BY) license (https://creativecommons.org/licenses/by/4.0/).
Share and Cite
MDPI and ACS Style
Bafail, O.A.; Abdulaal, R.M.S.; Kabli, M.R. AHP-RAPS Approach for Evaluating the Productivity of Engineering Departments at a Public University. Systems 2022, 10, 107. https://doi.org/10.3390/systems10040107
AMA Style
Bafail OA, Abdulaal RMS, Kabli MR. AHP-RAPS Approach for Evaluating the Productivity of Engineering Departments at a Public University. Systems. 2022; 10(4):107. https://doi.org/10.3390/systems10040107
Chicago/Turabian StyleBafail, Omer A., Reda M. S. Abdulaal, and Mohammad R. Kabli. 2022. "AHP-RAPS Approach for Evaluating the Productivity of Engineering Departments at a Public University" Systems 10, no. 4: 107. https://doi.org/10.3390/systems10040107
Note that from the first issue of 2016, this journal uses article numbers instead of page numbers. See further details here.