
The Determinants of Passengers’ Consumption Motivation at High-Speed Rail Stations


Abstract
:1. Introduction
2. Constructing a Framework for Exploring Passengers’ Consumption Motivations at HSR Stations: A Short Literature Review
2.1. Station Attributes (D1)
2.2. Product Attributes (D2)
2.3. Consumption Environment Attributes (D3)
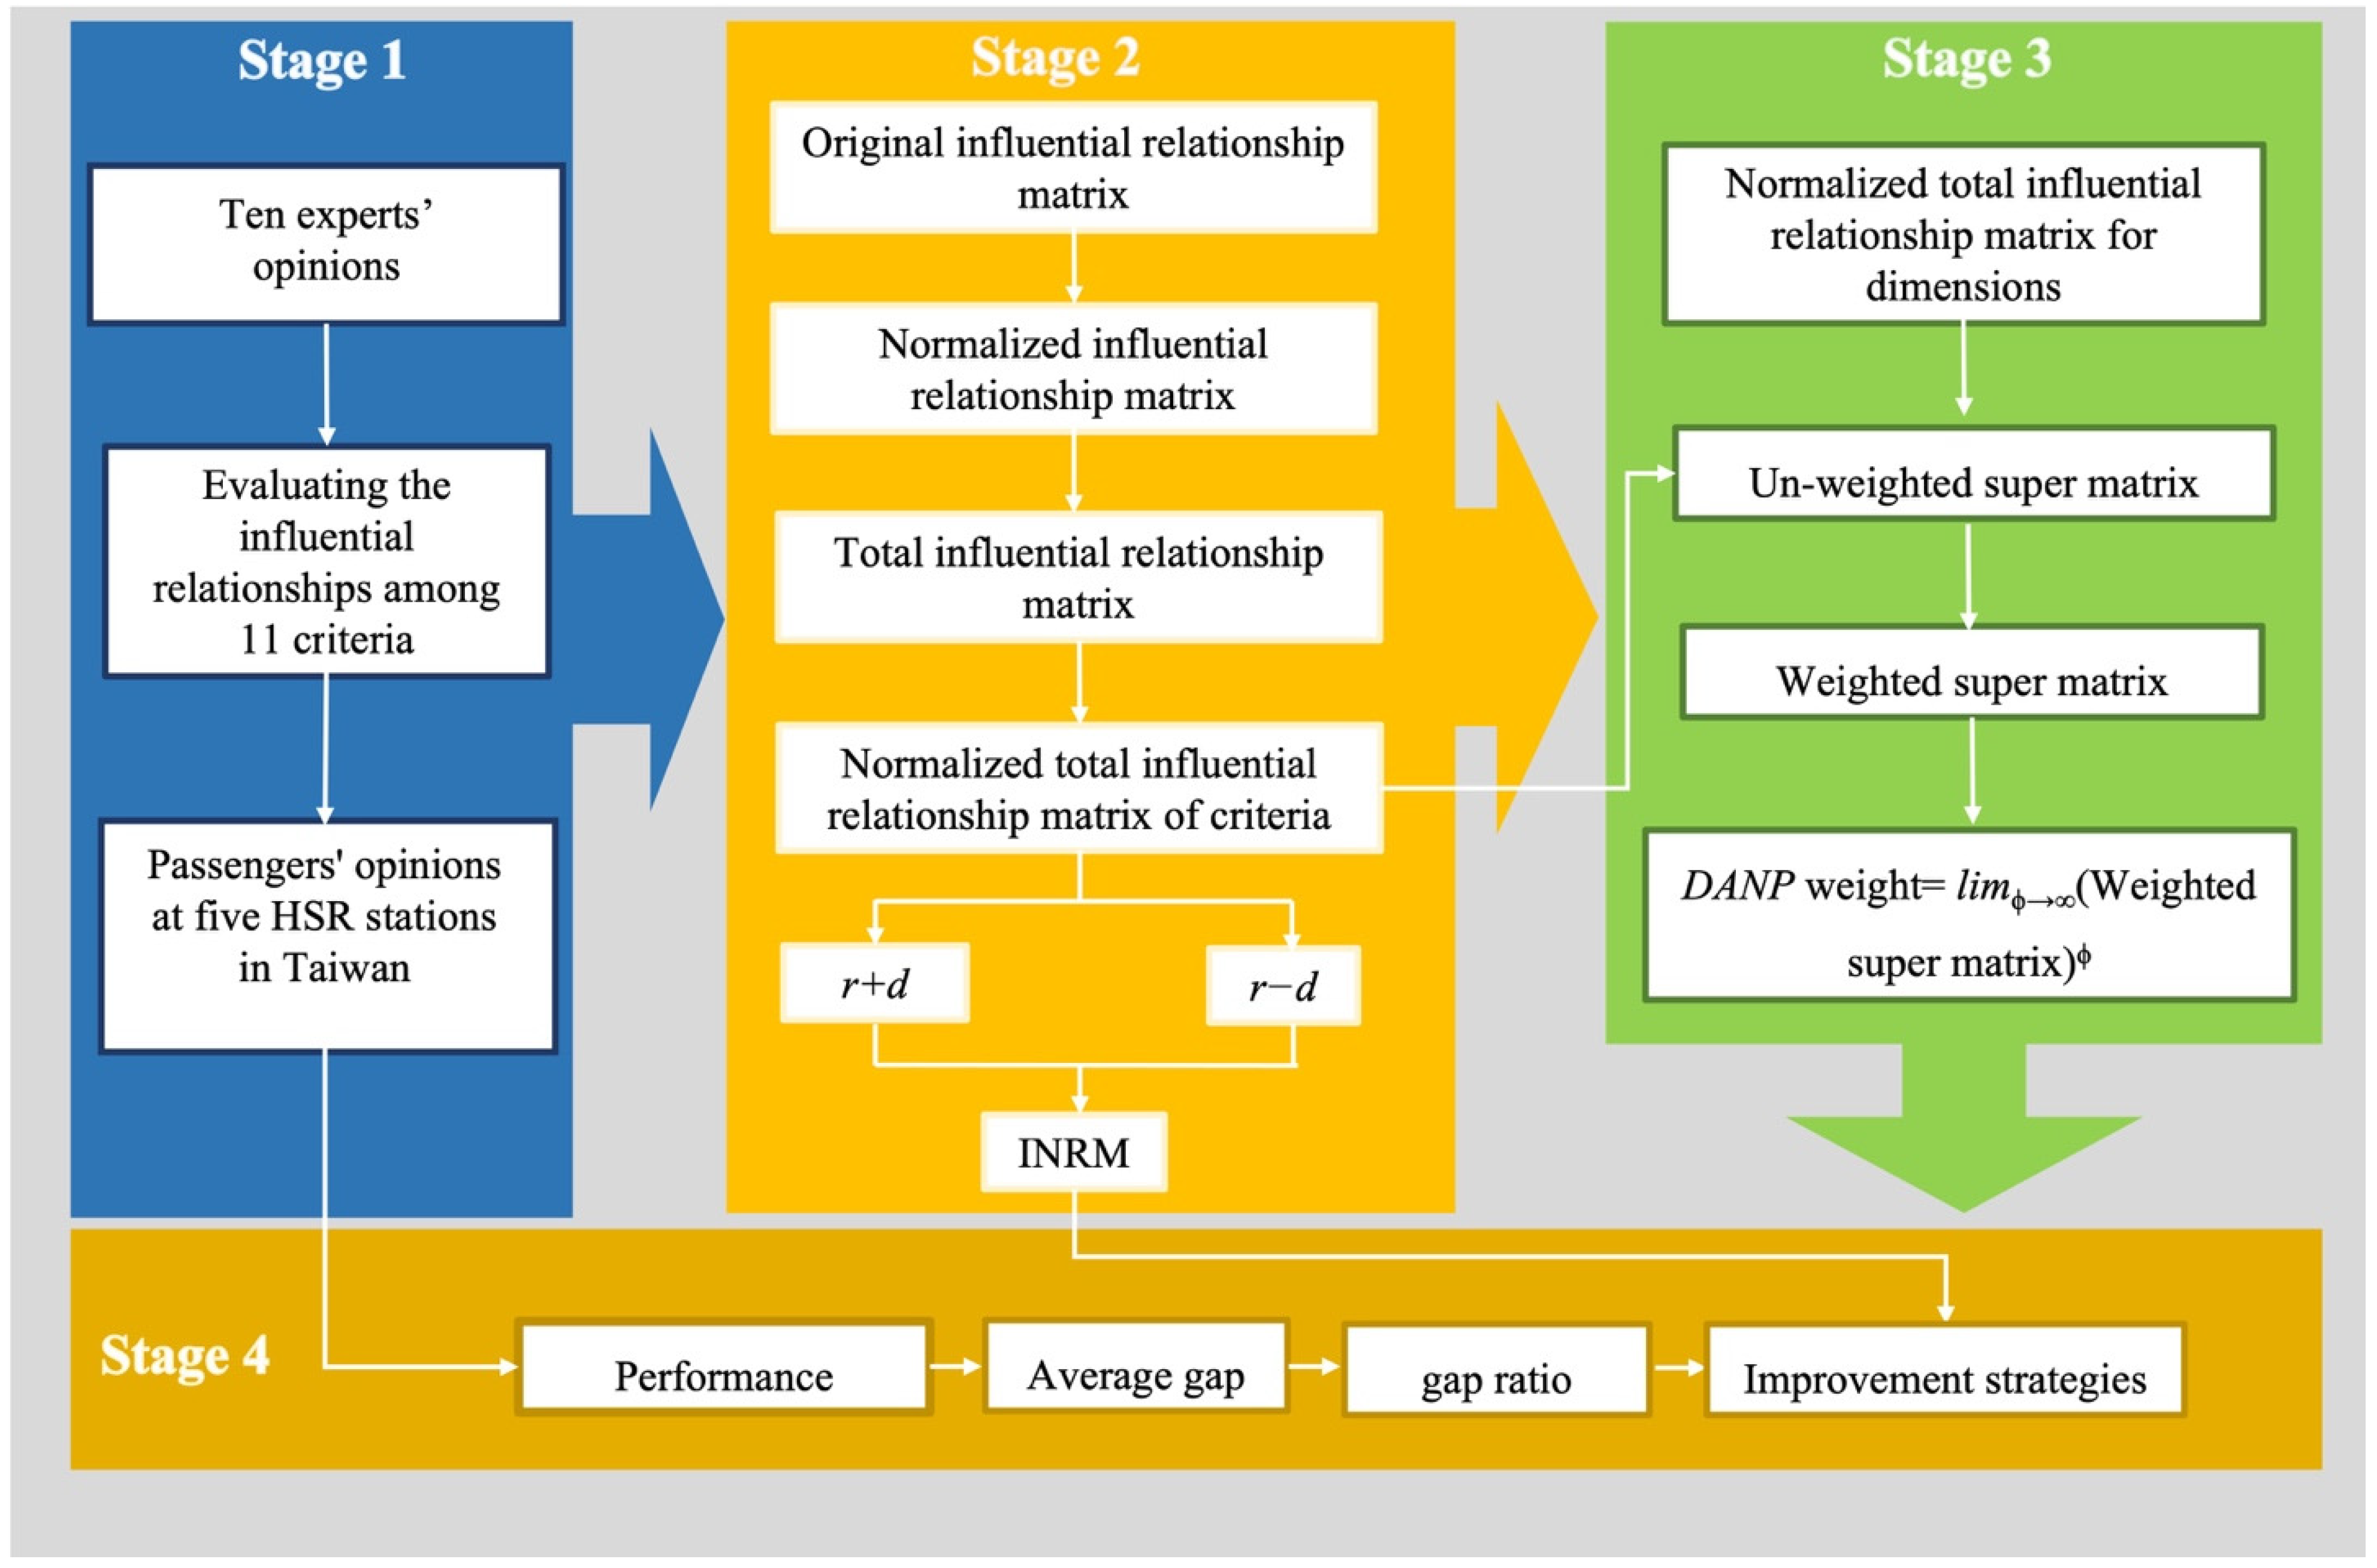
3. Methodology
3.1. The First Stage: Two Questionnaires for Data Collection
3.2. The Second Stage: DEMATEL
3.3. The Third Stage: DANP
3.4. The Fourth Stage: Modified VIKOR
4. Solution
4.1. DEMATEL and DANP
4.2. Modified VIKOR Results for Five HSR Stations
4.3. Discussion
5. Conclusions
Author Contributions
Funding
Informed Consent Statement
Data Availability Statement
Conflicts of Interest
Appendix A

| C1 | C2 | C3 | C4 | C5 | C6 | C7 | C8 | C9 | C10 | C11 | |
|---|---|---|---|---|---|---|---|---|---|---|---|
| C1 | 2.000 | 1.800 | 2.100 | 1.400 | 1.200 | 1.800 | 1.600 | 1.400 | 1.400 | 1.400 | |
| C2 | 2.300 | 1.900 | 1.900 | 1.300 | 1.900 | 1.800 | 1.700 | 2.100 | 1.600 | 2.400 | |
| C3 | 2.500 | 2.700 | 2.200 | 1.600 | 1.500 | 2.500 | 2.300 | 1.500 | 2.100 | 1.600 | |
| C4 | 2.600 | 1.400 | 2.000 | 2.000 | 2.000 | 1.800 | 1.800 | 1.200 | 1.700 | 1.100 | |
| C5 | 1.000 | 1.000 | 1.100 | 1.400 | 2.600 | 2.300 | 1.700 | 1.300 | 1.600 | 1.200 | |
| C6 | 1.200 | 1.500 | 1.300 | 1.800 | 2.200 | 2.600 | 2.300 | 1.000 | 1.700 | 1.300 | |
| C7 | 1.700 | 1.800 | 1.600 | 1.500 | 2.200 | 2.300 | 2.100 | 0.800 | 1.700 | 1.300 | |
| C8 | 2.100 | 1.700 | 1.300 | 1.000 | 1.200 | 1.400 | 1.400 | 0.700 | 1.200 | 0.700 | |
| C9 | 2.300 | 2.500 | 1.800 | 2.000 | 1.700 | 1.900 | 1.800 | 1.800 | 1.900 | 2.700 | |
| C10 | 1.200 | 1.000 | 1.100 | 1.600 | 2.000 | 1.800 | 2.100 | 1.700 | 1.300 | 1.500 | |
| C11 | 2.100 | 2.800 | 1.800 | 1.700 | 1.600 | 1.600 | 1.500 | 1.600 | 2.400 | 1.800 |
| C1 | C2 | C3 | C4 | C5 | C6 | C7 | C8 | C9 | C10 | C11 | |
|---|---|---|---|---|---|---|---|---|---|---|---|
| C1 | 0.000 | 0.102 | 0.092 | 0.107 | 0.071 | 0.061 | 0.092 | 0.082 | 0.071 | 0.071 | 0.071 |
| C2 | 0.117 | 0.000 | 0.097 | 0.097 | 0.066 | 0.097 | 0.092 | 0.087 | 0.107 | 0.082 | 0.122 |
| C3 | 0.128 | 0.138 | 0.000 | 0.112 | 0.082 | 0.077 | 0.128 | 0.117 | 0.077 | 0.107 | 0.082 |
| C4 | 0.133 | 0.071 | 0.102 | 0.000 | 0.102 | 0.102 | 0.092 | 0.092 | 0.061 | 0.087 | 0.056 |
| C5 | 0.051 | 0.051 | 0.056 | 0.071 | 0.000 | 0.133 | 0.117 | 0.087 | 0.066 | 0.082 | 0.061 |
| C6 | 0.061 | 0.077 | 0.066 | 0.092 | 0.112 | 0.000 | 0.133 | 0.117 | 0.051 | 0.087 | 0.066 |
| C7 | 0.087 | 0.092 | 0.082 | 0.077 | 0.112 | 0.117 | 0.000 | 0.107 | 0.041 | 0.087 | 0.066 |
| C8 | 0.107 | 0.087 | 0.066 | 0.051 | 0.061 | 0.071 | 0.071 | 0.000 | 0.036 | 0.061 | 0.036 |
| C9 | 0.117 | 0.128 | 0.092 | 0.102 | 0.087 | 0.097 | 0.092 | 0.092 | 0.000 | 0.097 | 0.138 |
| C10 | 0.061 | 0.051 | 0.056 | 0.082 | 0.102 | 0.092 | 0.107 | 0.087 | 0.066 | 0.000 | 0.077 |
| C11 | 0.107 | 0.143 | 0.092 | 0.087 | 0.082 | 0.082 | 0.077 | 0.082 | 0.122 | 0.092 | 0.000 |
| C1 | C2 | C3 | C4 | C5 | C6 | C7 | C8 | C9 | C10 | C11 | |
|---|---|---|---|---|---|---|---|---|---|---|---|
| C1 | 0.575 | 0.645 | 0.568 | 0.621 | 0.593 | 0.613 | 0.677 | 0.642 | 0.487 | 0.575 | 0.529 |
| C2 | 0.774 | 0.647 | 0.652 | 0.699 | 0.676 | 0.733 | 0.774 | 0.739 | 0.589 | 0.668 | 0.649 |
| C3 | 0.824 | 0.805 | 0.598 | 0.748 | 0.726 | 0.757 | 0.847 | 0.806 | 0.590 | 0.725 | 0.646 |
| C4 | 0.729 | 0.655 | 0.608 | 0.559 | 0.656 | 0.685 | 0.720 | 0.690 | 0.505 | 0.622 | 0.544 |
| C5 | 0.578 | 0.560 | 0.500 | 0.551 | 0.493 | 0.636 | 0.659 | 0.608 | 0.449 | 0.548 | 0.484 |
| C6 | 0.639 | 0.630 | 0.552 | 0.614 | 0.639 | 0.567 | 0.723 | 0.683 | 0.473 | 0.596 | 0.529 |
| C7 | 0.665 | 0.648 | 0.569 | 0.607 | 0.643 | 0.676 | 0.611 | 0.680 | 0.470 | 0.601 | 0.534 |
| C8 | 0.549 | 0.515 | 0.444 | 0.463 | 0.474 | 0.504 | 0.536 | 0.448 | 0.367 | 0.459 | 0.400 |
| C9 | 0.820 | 0.804 | 0.687 | 0.746 | 0.735 | 0.779 | 0.822 | 0.789 | 0.527 | 0.722 | 0.700 |
| C10 | 0.591 | 0.564 | 0.504 | 0.563 | 0.588 | 0.605 | 0.653 | 0.610 | 0.453 | 0.475 | 0.501 |
| C11 | 0.768 | 0.774 | 0.649 | 0.693 | 0.690 | 0.723 | 0.764 | 0.737 | 0.604 | 0.678 | 0.544 |
| C1 | C2 | C3 | C4 | C5 | C6 | C7 | C8 | C9 | C10 | C11 | |
|---|---|---|---|---|---|---|---|---|---|---|---|
| C1 | 0.321 | 0.374 | 0.370 | 0.366 | 0.353 | 0.351 | 0.353 | 0.364 | 0.355 | 0.356 | 0.350 |
| C2 | 0.361 | 0.312 | 0.362 | 0.329 | 0.342 | 0.346 | 0.344 | 0.342 | 0.348 | 0.340 | 0.353 |
| C3 | 0.318 | 0.315 | 0.269 | 0.305 | 0.305 | 0.303 | 0.302 | 0.294 | 0.297 | 0.304 | 0.296 |
| C4 | 0.248 | 0.243 | 0.243 | 0.214 | 0.236 | 0.241 | 0.239 | 0.234 | 0.242 | 0.234 | 0.241 |
| C5 | 0.237 | 0.234 | 0.236 | 0.250 | 0.211 | 0.251 | 0.253 | 0.240 | 0.239 | 0.244 | 0.240 |
| C6 | 0.245 | 0.254 | 0.246 | 0.261 | 0.272 | 0.223 | 0.267 | 0.255 | 0.253 | 0.251 | 0.252 |
| C7 | 0.270 | 0.269 | 0.275 | 0.275 | 0.282 | 0.284 | 0.241 | 0.271 | 0.267 | 0.271 | 0.266 |
| C8 | 0.287 | 0.279 | 0.291 | 0.292 | 0.291 | 0.299 | 0.298 | 0.268 | 0.288 | 0.299 | 0.287 |
| C9 | 0.218 | 0.222 | 0.213 | 0.214 | 0.215 | 0.208 | 0.206 | 0.219 | 0.192 | 0.222 | 0.236 |
| C10 | 0.258 | 0.253 | 0.262 | 0.264 | 0.262 | 0.261 | 0.263 | 0.274 | 0.264 | 0.233 | 0.265 |
| C11 | 0.237 | 0.245 | 0.234 | 0.231 | 0.232 | 0.232 | 0.234 | 0.239 | 0.256 | 0.245 | 0.212 |
| C1 | C2 | C3 | C4 | C5 | C6 | C7 | C8 | C9 | C10 | C11 | |
|---|---|---|---|---|---|---|---|---|---|---|---|
| C1 | 0.088 | 0.102 | 0.101 | 0.102 | 0.098 | 0.098 | 0.098 | 0.103 | 0.101 | 0.101 | 0.099 |
| C2 | 0.099 | 0.086 | 0.099 | 0.091 | 0.095 | 0.096 | 0.096 | 0.097 | 0.099 | 0.096 | 0.100 |
| C3 | 0.087 | 0.086 | 0.074 | 0.085 | 0.085 | 0.084 | 0.084 | 0.084 | 0.084 | 0.086 | 0.084 |
| C4 | 0.095 | 0.093 | 0.093 | 0.081 | 0.090 | 0.092 | 0.091 | 0.090 | 0.093 | 0.089 | 0.092 |
| C5 | 0.090 | 0.089 | 0.090 | 0.095 | 0.080 | 0.096 | 0.096 | 0.092 | 0.091 | 0.093 | 0.092 |
| C6 | 0.093 | 0.097 | 0.094 | 0.099 | 0.103 | 0.085 | 0.101 | 0.098 | 0.097 | 0.096 | 0.096 |
| C7 | 0.103 | 0.102 | 0.105 | 0.105 | 0.107 | 0.108 | 0.092 | 0.104 | 0.102 | 0.104 | 0.102 |
| C8 | 0.099 | 0.096 | 0.100 | 0.100 | 0.099 | 0.102 | 0.102 | 0.089 | 0.096 | 0.100 | 0.096 |
| C9 | 0.075 | 0.077 | 0.073 | 0.073 | 0.073 | 0.071 | 0.070 | 0.073 | 0.064 | 0.074 | 0.079 |
| C10 | 0.089 | 0.087 | 0.090 | 0.090 | 0.090 | 0.089 | 0.090 | 0.091 | 0.088 | 0.078 | 0.088 |
| C11 | 0.082 | 0.085 | 0.080 | 0.079 | 0.079 | 0.079 | 0.080 | 0.080 | 0.085 | 0.082 | 0.071 |
References
- Almujibah, H.; Preston, J. The Total Social Costs of Constructing and Operating a High-Speed Rail Line Using a Case Study of the Riyadh-Dammam Corridor, Saudi Arabia. Front. Built Environ. 2019, 5, 79. [Google Scholar] [CrossRef]
- Cheng, Y.-H. High-speed rail in Taiwan: New experience and issues for future development. Transp. Policy 2010, 17, 51–63. [Google Scholar] [CrossRef]
- Garmendia, M.; Ribalaygua, C.; Ureña, J.M. High speed rail: Implication for cities. Cities 2012, 29, S26–S31. [Google Scholar] [CrossRef]
- Brovarone, E.V. Design as if bus stops mattered: Exploring the potential role of public transport stops in the urban environment. Urban Des. Int. 2021, 26, 82–96. [Google Scholar] [CrossRef]
- Abutaleb, A.; Mcdougall, K.; Basson, M.; Hassan, R.; Mahmood, M.N. Understanding Contextual Attractiveness Factors of Transit Orientated Shopping Mall Developments (Tosmds) for Shopping Mall Passengers on the Dubai Metro Red Line. Plan. Pract. Res. 2020, 36, 292–313. [Google Scholar] [CrossRef]
- JR West Company. Financial Report. 2021. Available online: https://www.westjr.co.jp/company/ir/finance/results/ (accessed on 17 May 2021).
- Baron, N. Designing Paris Gare du Nord for pedestrians or for clients? New retail patterns as flow optimization strategies. Eur. Plan. Stud. 2019, 27, 618–637. [Google Scholar] [CrossRef]
- Machado-León, J.L.; de Oña, R.; Baouni, T.; de Oña, J. Railway transit services in Algiers: Priority improvement actions based on users perceptions. Transp. Policy 2017, 53, 175–185. [Google Scholar] [CrossRef]
- Chang, J.; Yang, B.-T.; Yu, C.-G. The moderating effect of salespersons’ selling behaviour on shopping motivation and satis-faction: Taiwan tourists in China. Tour. Manag. 2006, 27, 934–942. [Google Scholar] [CrossRef]
- Perng, S.-W.; Chow, C.-C.; Liao, W.-C. Analysis of shopping preference and satisfaction with airport retailing products. J. Air Transp. Manag. 2010, 16, 279–283. [Google Scholar] [CrossRef]
- Lin, Y.-H.; Chen, C.-F. Passengers’ shopping motivations and commercial activities at airports—The moderating effects of time pressure and impulse buying tendency. Tour. Manag. 2013, 36, 426–434. [Google Scholar] [CrossRef]
- Sahak, S.Z.; Yusof, A.W.M.; Mudri, E.Y.A.; Saidin, S. The Effect of Retail Mix on Passengers Motivation to Shop at AirportTerminal Outlets. J. Int. Bus. Econ. Entrep. 2018, 3, 30–36. [Google Scholar] [CrossRef]
- Tseng, W.-C.; Wu, C.-L. A choice model of airline passengers’ spending behaviour in the airport terminal. Transp. Plan. Technol. 2019, 42, 380–390. [Google Scholar] [CrossRef]
- Chen, Y.; Wu, C.-L.; Koo, T.T.R.; Douglas, I. Determinants of airport retail revenue: A review of literature. Transp. Rev. 2020, 40, 479–505. [Google Scholar] [CrossRef]
- Lee, J.I.; Ren, T.; Park, J. Investigating travelers’ multi-impulse buying behavior in airport duty-free shopping for Chinese traveler: Intrinsic and extrinsic motivations. J. Air Transp. Manag. 2021, 92, 102023. [Google Scholar] [CrossRef]
- Lin, W.-T.; Chen, C.-Y. Shopping Satisfaction at Airport Duty-Free Stores: A Cross-Cultural Comparison. J. Hosp. Mark. Manag. 2013, 22, 47–66. [Google Scholar] [CrossRef]
- Yıldız, N.; Tüysüz, N. A hybrid multi-criteria decision making approach for strategic retail location investment: Application to Turkish food retailing. Socio-Econ. Plan. Sci. 2019, 68, 100619. [Google Scholar] [CrossRef]
- Saaty, T.L. The Analytic Hierarchy Process; McGraw-Hill: New York, NY, USA, 1980. [Google Scholar]
- Broniewicz, E.; Ogrodnik, K. Multi-criteria analysis of transport infrastructure projects. Transp. Res. Part D Transp. Environ. 2020, 83, 102351. [Google Scholar] [CrossRef]
- Zhang, X.; Liu, H.; Xu, M.; Mao, C.; Shi, J.; Meng, G.; Wu, J. Evaluation of passenger satisfaction of urban multi-mode public transport. PLoS ONE 2020, 15, e0241004. [Google Scholar] [CrossRef]
- Kumar, A. Analysing the drivers of customer happiness at authorized workshops and improving retention. J. Retail. Consum. Serv. 2021, 62, 102619. [Google Scholar] [CrossRef]
- Tzeng, G.-H.; Shen, K.-Y. New Concepts and Trends of Hybrid Multiple Criteria Decision Making; CRC Press: Boca Raton, FL, USA, 2017. [Google Scholar]
- Saaty, T.L. The Analytic Network Process; RWS Publications Press: Pittsburgh, PA, USA, 1996. [Google Scholar]
- Gölcük, I.; Baykasoğlu, A. An analysis of DEMATEL approaches for criteria interaction handling within ANP. Expert Syst. Appl. 2016, 46, 346–366. [Google Scholar] [CrossRef]
- Chen, H.-M.; Wu, C.-H.; Tsai, S.-B.; Yu, J.; Wang, J.; Zheng, Y. Exploring key factors in online shopping with a hybrid model. SpringerPlus 2016, 5, 2046. [Google Scholar] [CrossRef] [PubMed] [Green Version]
- Perçin, S. Evaluating airline service quality using a combined fuzzy decision-making approach. J. Air Transp. Manag. 2018, 68, 48–60. [Google Scholar] [CrossRef]
- Tsai, P.-H.; Lin, G.-Y.; Zheng, Y.-L.; Chen, Y.-C.; Chen, P.-Z.; Su, Z.-C. Exploring the effect of Starbucks’ green marketing on consumers’ purchase decisions from consumers’ perspective. J. Retail. Consum. Serv. 2020, 56, 102162. [Google Scholar] [CrossRef]
- Medalla, M.E.F.; Yamagishi, K.D.; Tiu, A.M.C.; Tanaid, R.A.B.; Abellana, D.P.M.; Caballes, S.A.A.; Jabilles, E.M.Y.; Selerio, E.F., Jr.; Bongo, M.F.; Ocampo, L.A. Relationship mapping of consumer buying behavior antecedents of secondhand clothing with fuzzy DEMATEL. J. Manag. Anal. 2021, 8, 530–568. [Google Scholar] [CrossRef]
- Rao, S.-H. Transportation synthetic sustainability indices: A case of Taiwan intercity railway transport. Ecol. Indic. 2021, 127, 107753. [Google Scholar] [CrossRef]
- Lee, H.-S.; Tzeng, G.-H.; Yeih, W.; Wang, Y.-J.; Yang, S.-C. Revised DEMATEL: Resolving the Infeasibility of Dematel. Appl. Math. Model. 2013, 37, 6746–6757. [Google Scholar] [CrossRef]
- Rao, S.-H. A hybrid MCDM model based on DEMATEL and ANP for improving the measurement of corporate sustainability indicators: A study of Taiwan High Speed Rail. Res. Transp. Bus. Manag. 2021, 41, 100657. [Google Scholar] [CrossRef]
- Vuchic, V.R. Urban Transit: Operations, Planning and Economics; Wiley: Hoboken, NJ, USA, 2005. [Google Scholar]
- Zemp, S.; Stauffacher, M.; Lang, D.J.; Scholz, R.W. Classifying railway stations for strategic transport and land use planning: Context matters! J. Transp. Geogr. 2011, 19, 670–679. [Google Scholar] [CrossRef]
- Guirao, B.; García-Pastor, A.; López-Lambas, M.E. The importance of service quality attributes in public transportation: Narrowing the gap between scientific research and practitioners’ needs. Transp. Policy 2016, 49, 68–77. [Google Scholar] [CrossRef]
- Ghosh, P.; Ojha, M.K.; Geetika. Determining passenger satisfaction out of platform-based amenities: A study of Kanpur Central Railway Station. Transp. Policy 2017, 60, 108–118. [Google Scholar] [CrossRef]
- Xiao-Rong, L.; Hai-Xiao, P. The effects of the integration of metro station and mega-multi-mall on consumers’ activities: A case study of Shanghai. Transp. Res. Procedia 2017, 25, 2574–2582. [Google Scholar] [CrossRef]
- Siewwuttanagul, S.; Inohae, T. Spatio-temporal Retail Competition Factors Accessibility in Hakata Station, Japan. In Introduction to the Lecture Notes in Mobility; Weerawat, W., Kirawanich, P., Fraszczyk, A., Marinov, M., Eds.; Springer: Singapore, 2021; pp. 167–184. [Google Scholar]
- Tsuji, A. Developing Station Commercial Facilities to Increase Line Section Value. Jpn. Railw. Trans. Rev. 2010, 56, 14–21. [Google Scholar]
- Kim, H.; Sultana, S.; Weber, J. A geographic assessment of the economic development impact of Korean high-speed rail stations. Transp. Policy 2018, 66, 127–1137. [Google Scholar] [CrossRef]
- Ojha, M.K. Quality of service delivery at railway platforms: A case of Allahabad junction railway station. Case Stud. Transp. Policy 2020, 8, 1087–1095. [Google Scholar] [CrossRef]
- Lin, S.-H.; Hsu, C.-C.; Zhong, T.; He, X.; Li, J.-H.; Tzeng, G.-H.; Hsieh, J.-C. Exploring location determinants of Asia’s unique beverage shops based on a hybrid MADM model. Int. J. Strat. Prop. Manag. 2021, 25, 291–315. [Google Scholar] [CrossRef]
- Cushman & Wakefield. Railway Retail in France and Southern Europe; Cushman & Wakefield: Paris, France, 2018. [Google Scholar]
- Kesari, B.; Atulkar, S. Satisfaction of mall shoppers: A study on perceived utilitarian and hedonic shopping values. J. Retail. Consum. Serv. 2016, 31, 22–31. [Google Scholar] [CrossRef]
- Wagner, T.; Rudolph, T. Towards a hierarchical theory of shopping motivation. J. Retail. Consum. Serv. 2010, 17, 415–429. [Google Scholar] [CrossRef]
- Hong, S.-J.; Choi, D.; Chae, J. Exploring different airport users’ service quality satisfaction between service providers and air travelers. J. Retail. Consum. Serv. 2020, 52, 101917. [Google Scholar] [CrossRef]
- Volkova, N. Determinants of Retail Revenue for Today’s Airports. German Airport Performance (GAP) Project; Berlin School of Economics: Berlin, Germany, 2009. [Google Scholar]
- Wu, C.-L.; Chen, Y. Effects of passenger characteristics and terminal layout on airport retail revenue: An agent-based simulation approach. Transp. Plan. Technol. 2019, 42, 167–186. [Google Scholar] [CrossRef]
- Ando, K. Japan’s Rail Stations. Jpn. Railw. Transp. Rev. 2010, 56, 26–35. [Google Scholar]
- Ünder, Ü.; Atalık, Ö. Investigating Airport Shoppers’ Buying Behaviors and Satisfaction at Duty Free Shops: Impact of Demographic and Travel Related Factors. Transp. Logist. 2020, 20, 45–60. [Google Scholar]
- Geuens, M.; Vantomme, D.; Brengman, M. Developing a typology of airport shoppers. Tour. Manag. 2004, 25, 615–622. [Google Scholar] [CrossRef]
- Lu, J.-L. Investigating factors that influence passengers’ shopping intentions at airports—Evidence from Taiwan. J. Air Transp. Manag. 2014, 35, 72–77. [Google Scholar] [CrossRef]
- Han, H.; Hyun, S.S. Investigating customers’ shopping behaviors at airport duty-free shops: Impact of shopping flow and alternative shopping malls’ attractiveness. Asia Pac. J. Tour. Res. 2018, 23, 627–638. [Google Scholar] [CrossRef]
- Park, J.-W.; Choi, Y.-J.; Moon, W.-C. Investigating the effects of sales promotions on customer behavioral intentions at duty-free shops: An Incheon International Airport case study. J. Airl. Airpt. Manag. 2013, 3, 18–30. [Google Scholar] [CrossRef]
- van den Oel, C.J.; Berkhof, F.W.; Derk, V.D. Consumer preferences in the design of airport passenger areas. J. Environ. Psychol. 2013, 36, 280–290. [Google Scholar] [CrossRef]
- Sadikoglu, G. Modeling of the travelers’ shopping motivation and their buying behavior using fuzzy logic. Procedia Comput. Sci. 2017, 120, 805–811. [Google Scholar] [CrossRef]
- Sohn, H.-K.; Lee, T.J. Tourists’ impulse buying behavior at duty-free shops: The moderating effects of time pressure and shopping involvement. J. Travel Tour. Mark. 2017, 34, 341–356. [Google Scholar] [CrossRef]
- Park, J.-W.; Se-Yeon, J. Transfer passengers’ perceptions of airport service quality: A case study of Incheon international airport. Int. Bus. Res. 2011, 4, 75. [Google Scholar] [CrossRef]
- Seiders, K.; Voss, G.B.; Grewal, D.; Godfrey, A.L. Do Satisfied Customers Buy More? Examining Moderating Influences in a Retailing Context. J. Mark. Manag. 2005, 69, 26–43. [Google Scholar] [CrossRef]
- Chung, Y.-S.; Wu, C.-L.; Chiang, W.-E. Air passengers’ shopping motivation and information seeking behaviour. J. Air Transp. Manag. 2013, 27, 25–28. [Google Scholar] [CrossRef]
- Prentice, C.; Kadan, M. The role of airport service quality in airport and destination choice. J. Retail. Consum. Serv. 2019, 47, 40–48. [Google Scholar] [CrossRef]
- Bezerra, G.C.; Gomes, C.F. The effects of service quality dimensions and passenger characteristics on passenger’s overall satisfaction with an airport. J. Air Transp. Manag. 2015, 44–45, 77–81. [Google Scholar] [CrossRef]
- Liou, J.; Tzeng, G.-H. Comments on “Multiple criteria decision making (MCDM) methods in economics: An overview”. Technol. Econ. Dev. Econ. 2012, 18, 672–695. [Google Scholar] [CrossRef]
- Liu, J.; Lv, J.; Dinçer, H.; Yüksel, S.; Karakuş, H. Selection of Renewable Energy Alternatives for Green Blockchain Investments: A Hybrid IT2-based Fuzzy Modelling. Arch. Comput. Methods Eng. 2021, 28, 3687–3701. [Google Scholar] [CrossRef]
- Gupta, H.; Barua, M.K. A novel hybrid multi-criteria method for supplier selection among SMEs on the basis of innovation ability. Int. J. Logist. Res. Appl. 2018, 21, 201–223. [Google Scholar] [CrossRef]
- Liu, Y.; Han, M. Determining the key factors of wearable devices consumers’ adoption behavior based on an MADM model for product improvement. IEEE Trans. Eng. Manag. 2020, 1–16. [Google Scholar] [CrossRef]
- Si, S.-L.; You, X.-Y.; Liu, H.-C.; Zhang, P. DEMATEL Technique: A Systematic Review of the State-of-the-Art Literature on Methodologies and Applications. Math. Probl. Eng. 2018, 2018, 1–33. [Google Scholar] [CrossRef] [Green Version]
- Kheybari, S.; Rezaie, F.M.; Farazmand, H. Analytic network process: An overview of applications. Appl. Math. Comput. 2020, 367, 124780. [Google Scholar] [CrossRef]
- Mardani, A.; Zavadskas, E.K.; Govindan, K.; Senin, A.A.; Jusoh, A. VIKOR Technique: A Systematic Review of the State of the Art Literature on Methodologies and Applications. Sustainability 2016, 8, 37. [Google Scholar] [CrossRef] [Green Version]
- Liu, K.-M.; Lin, S.-H.; Hsieh, J.-C.; Tzeng, G.-H. Improving the food waste composting facilities site selection for sustainable development using a hybrid modified MADM model. Waste Manag. 2018, 75, 44–59. [Google Scholar] [CrossRef] [PubMed]
- Peng, K.-H.; Tzeng, G.-H. Exploring heritage tourism performance improvement for making sustainable development strategies using the hybrid-modified MADM model. Curr. Issues Tour. 2019, 22, 921–947. [Google Scholar] [CrossRef]
- Opricovic, S.; Tzeng, G.-H. Compromise solution by MCDM methods: A comparative analysis of VIKOR and TOPSIS. Eur. J. Oper. Res. 2004, 156, 445–455. [Google Scholar] [CrossRef]
- Opricovic, S.; Tzeng, G.-H. Extended VIKOR method in comparison with outranking methods. Eur. J. Oper. Res. 2007, 178, 514–529. [Google Scholar] [CrossRef]


| Dimension | Criteria | Definitions | Cited Literature |
|---|---|---|---|
| Station attributes (D1) | Station scale (C1) | The scale of HSR stations | [14,46,47] |
| Store location (C2) | Location of stores in HSR stations | [12,14,46,47] | |
| Commercial activities offered (C3) | Commercial activities provided in HSR stations, such as dining, shopping, and entertainment facilities | [13,48,49] | |
| Product attributes (D2) | Product diversity (C4) | The variety of products offered by the shops in the HSR station | [12,43,50,51] |
| Product quality (C5) | The quality of the products provided by the stores in the HSR station | [43,51,52] | |
| Product retail price (C6) | The prices of the products sold by the shops in the HSR stations are reasonable | [16,43,51,53] | |
| Brand name (C7) | Whether the brands sold in the HSR stations are well-known to passengers | [10,43,51] | |
| Consumption environment attributes (D3) | Environment (C8) | The ambient atmosphere of the shops in the HSR stations, such as cleanliness, lighting, or temperature | [11,45,52,54] |
| Time pressure (C9) | The free time available from the time a passenger enters the HSR station till the time of embarking. If there is too little free time, there will be a time pressure. | [15,16,55,56] | |
| Service quality (C10) | The service quality of the service staff in the stores in HSR stations and whether the quality is high or low | [11,12,51,55,57] | |
| Service convenience (C11) | Convenience of consumption by passengers in HSR stations, such as the convenience of obtaining products, making payments, and deciding the type of business activities to consume | [45,51,58,59] |
| Background | Serial Num. | Professional Field | Years of Experience | Job Title | Service Unit |
|---|---|---|---|---|---|
| Academia | 1 | Marketing planning | 18 | Professor | Department of Shipping Management |
| 2 | Marketing planning | 30 | Professor | Department of Business Management | |
| 3 | Marketing management | 22 | Professor | Department of Transportation and Logistics | |
| Industry | 4 | Store management | 15 | Manager | Logistics Corporation |
| 5 | Store management | 20 | Manager | Retail Corporation | |
| 6 | Store marketing planning | 5 | Assistant Manager | Retail Corporation | |
| 7 | Store management, Store marketing planning | 25 | District Supervisor | Retail Corporation | |
| 8 | Store management, Store marketing planning | 17 | Director | Retail Corporation | |
| Government | 9 | Industrial development | 10 | Engineering Division | Taiwan HSR Corporation |
| 10 | Industrial development | 27 | Engineering Division | Taiwan HSR Corporation |
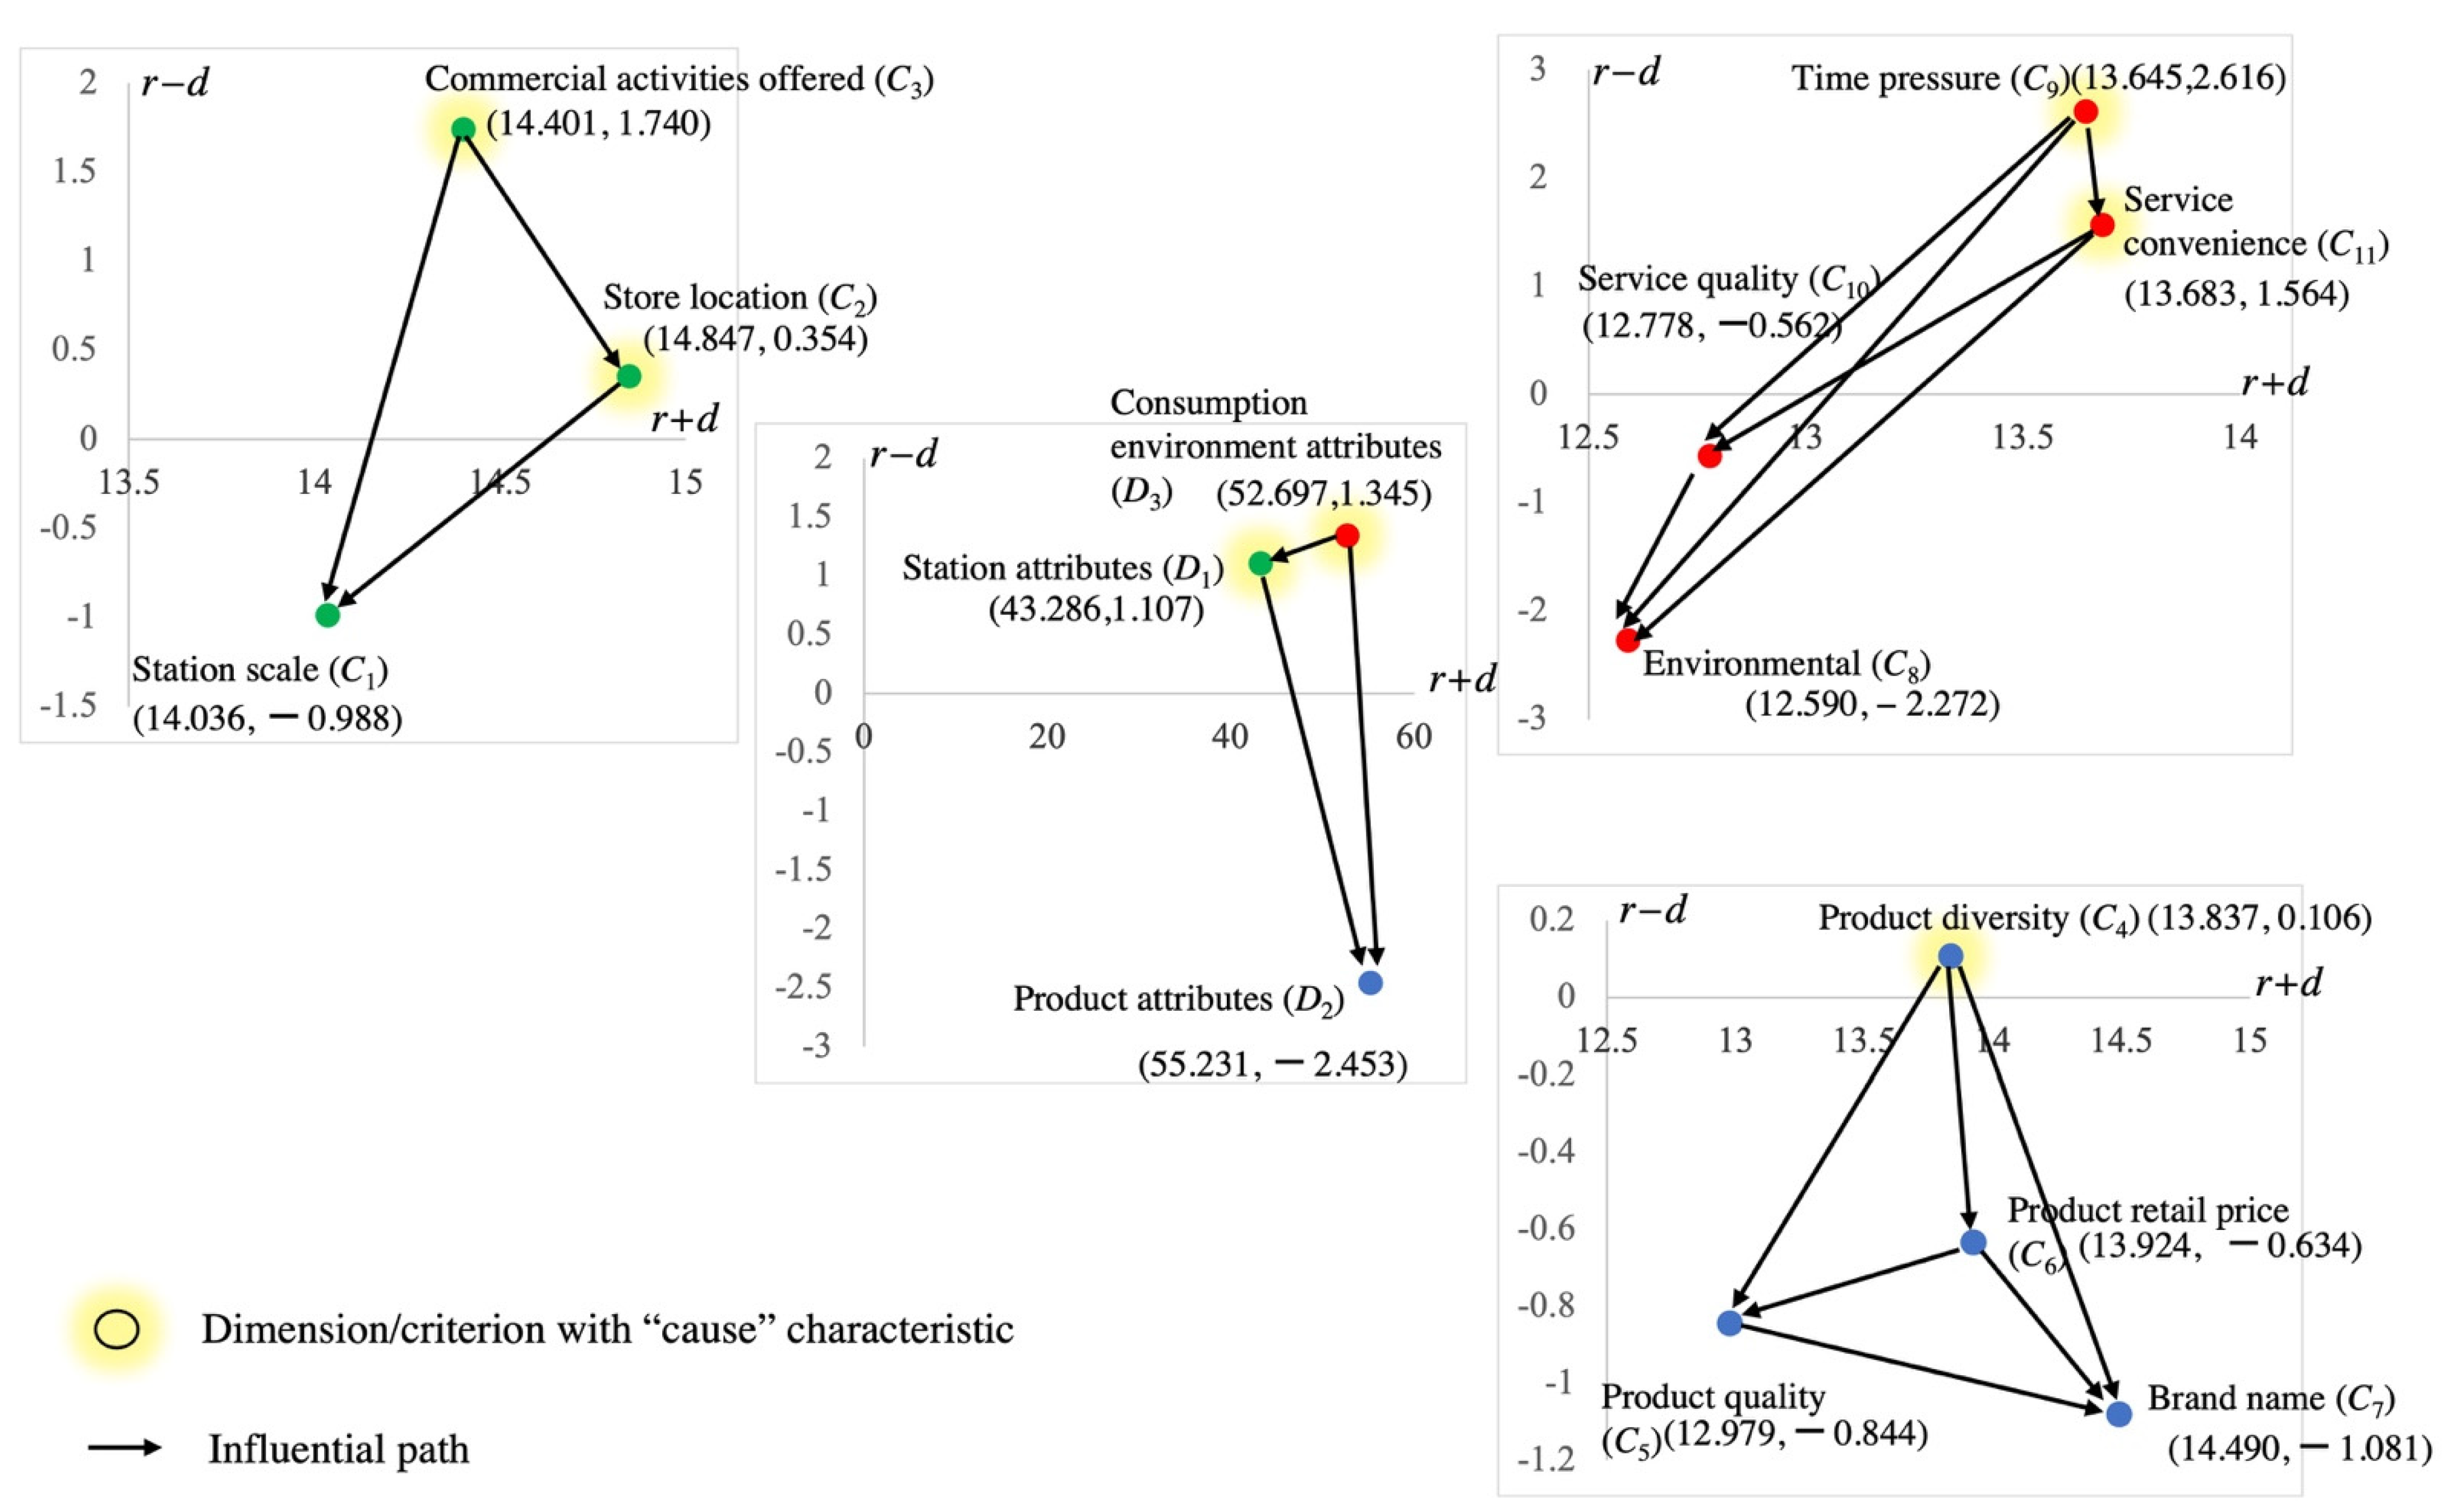
| DEMATEL | DANP | ||||||
|---|---|---|---|---|---|---|---|
| Dimensions/Criteria | r (Received) | d (Given) | r + d | r − d | Characteristic | Regional Weights | Global Weights |
| Station attributes (D1) | 22.196 | 21.089 | 43.286 | 1.107 | Cause | 0.279 | - |
| Station scale (C1) | 6.524 | 7.512 | 14.036 | −0.988 | Effect | 0.099 | 0.356 |
| Store location (C2) | 7.601 | 7.246 | 14.848 | 0.355 | Cause | 0.096 | 0.343 |
| Commercial activities offered (C3) | 8.071 | 6.330 | 14.402 | 1.741 | Cause | 0.084 | 0.301 |
| Product attributes (D2) | 26.389 | 28.842 | 55.231 | −2.453 | Effect | 0.381 | - |
| Product diversity (C4) | 6.972 | 6.865 | 13.838 | 0.107 | Cause | 0.091 | 0.238 |
| Product quality (C5) | 6.068 | 6.912 | 12.979 | −0.844 | Effect | 0.091 | 0.240 |
| Product retail price (C6) | 6.645 | 7.279 | 13.924 | −0.634 | Effect | 0.096 | 0.253 |
| Brand name (C7) | 6.705 | 7.786 | 14.490 | −1.081 | Effect | 0.103 | 0.270 |
| Consumption environment attributes (D3) | 27.021 | 25.676 | 52.697 | 1.345 | Cause | 0.340 | - |
| Environment (C8) | 5.159 | 7.432 | 12.591 | −2.273 | Effect | 0.098 | 0.289 |
| Time pressure (C9) | 8.131 | 5.514 | 13.645 | 2.617 | Cause | 0.073 | 0.215 |
| Service quality (C10) | 6.108 | 6.671 | 12.779 | −0.563 | Effect | 0.088 | 0.260 |
| Service convenience (C11) | 7.624 | 6.059 | 13.683 | 1.564 | Cause | 0.080 | 0.236 |
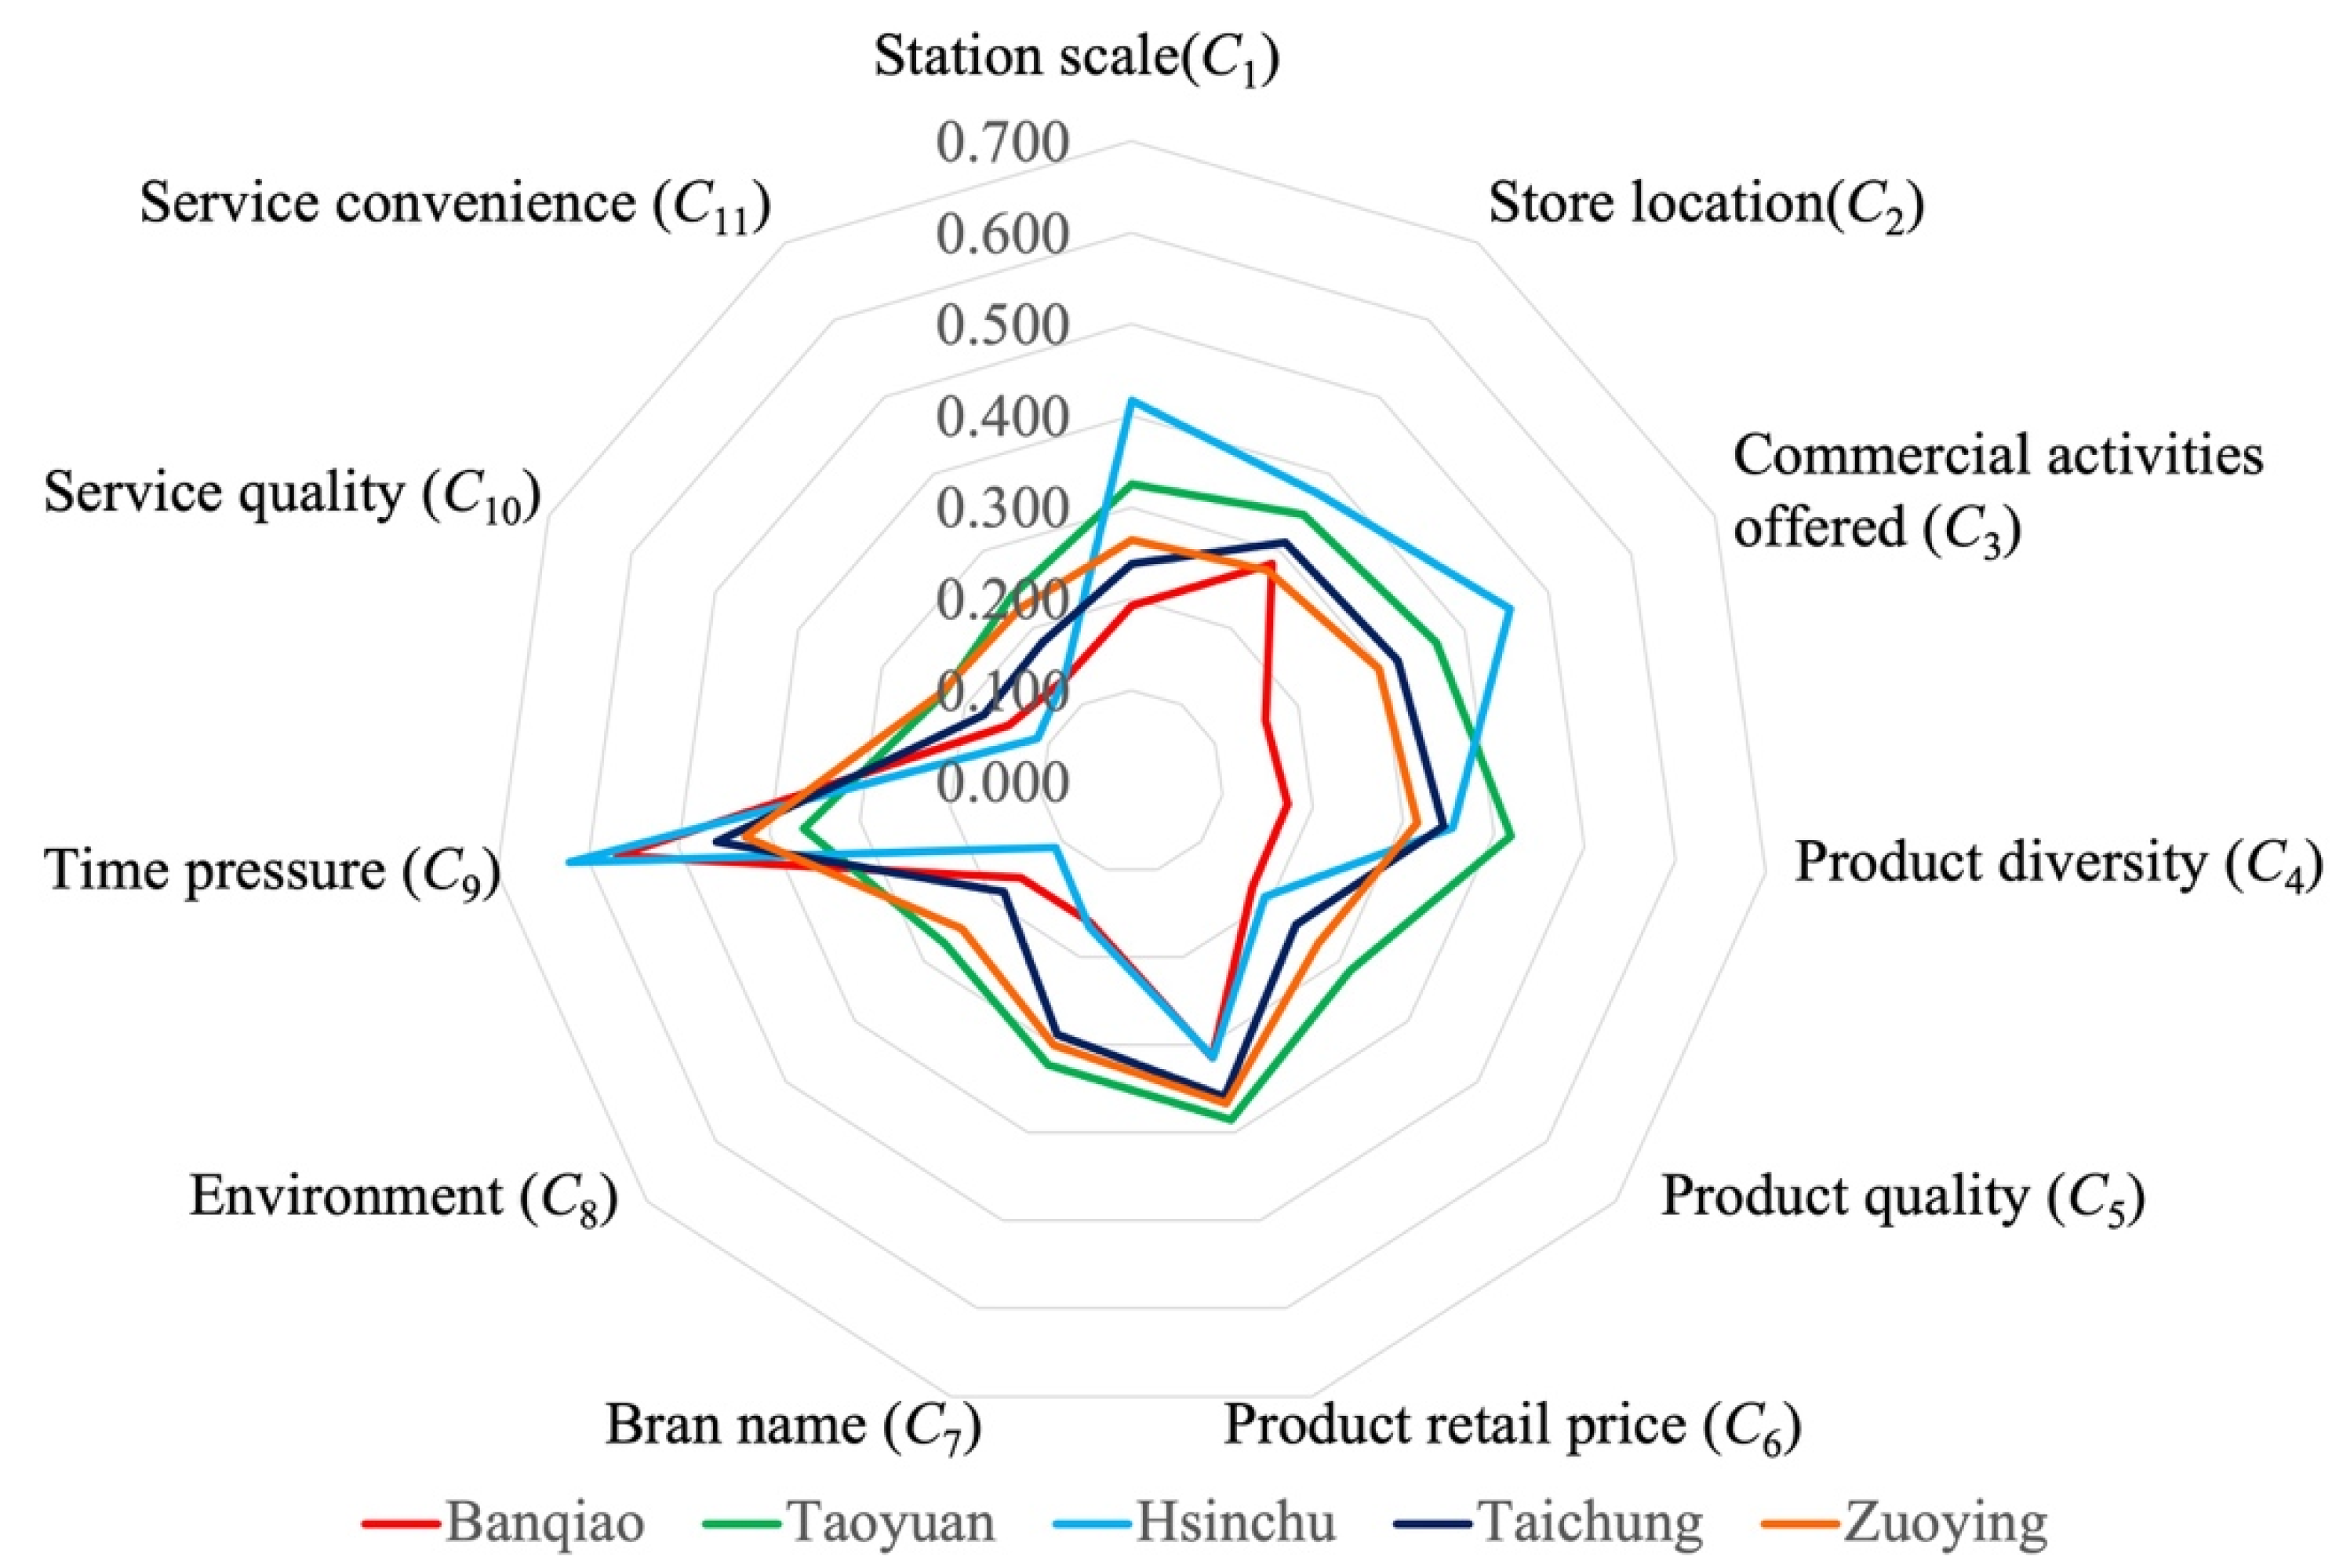
| Dimensions/Criteria | Banqiao HSR Station | Taoyuan HSR Station | Hsinchu HSR Station | Taichung HSR Station | Zuoying HSR Station | |||||
|---|---|---|---|---|---|---|---|---|---|---|
| Performance | GR | Performance | GR | Performance | GR | Performance | GR | Performance | GR | |
| Station attributes (D1) | 2.191 | 0.781 | 1.827 | 0.817 | 1.635 | 0.837 | 1.986 | 0.801 | 2.015 | 0.798 |
| Station scale (C1) | 8.074 | 0.193 | 6.749 | 0.325 | 5.837 | 0.416 | 7.615 | 0.239 | 7.361 | 0.264 |
| Store location (C2) | 7.167 | 0.283 | 6.527 | 0.347 | 6.248 | 0.375 | 6.888 | 0.311 | 7.255 | 0.275 |
| Commercial activities offered (C3) | 8.392 | 0.161 | 6.343 | 0.366 | 5.450 | 0.455 | 6.807 | 0.319 | 7.034 | 0.297 |
| Product attributes (D2) | 3.030 | 0.697 | 2.444 | 0.756 | 2.843 | 0.716 | 2.642 | 0.736 | 2.620 | 0.738 |
| Product diversity (C4) | 8.275 | 0.173 | 5.816 | 0.418 | 6.455 | 0.354 | 6.557 | 0.344 | 6.851 | 0.315 |
| Product quality (C5) | 8.250 | 0.175 | 6.845 | 0.315 | 8.074 | 0.193 | 7.621 | 0.238 | 7.303 | 0.270 |
| Product retail price (C6) | 6.863 | 0.314 | 6.151 | 0.385 | 6.856 | 0.314 | 6.408 | 0.359 | 6.332 | 0.367 |
| Brand Name (C7) | 8.397 | 0.160 | 6.778 | 0.322 | 8.347 | 0.165 | 7.121 | 0.288 | 7.000 | 0.300 |
| Consumption environment attributes (D3) | 3.049 | 0.695 | 2.587 | 0.741 | 3.079 | 0.692 | 2.803 | 0.720 | 2.693 | 0.731 |
| Environment (C8) | 8.397 | 0.160 | 7.297 | 0.270 | 8.896 | 0.110 | 8.158 | 0.184 | 7.548 | 0.245 |
| Time pressure (C9) | 4.328 | 0.567 | 6.377 | 0.362 | 3.797 | 0.620 | 5.417 | 0.458 | 5.740 | 0.426 |
| Service quality (C10) | 8.525 | 0.148 | 7.724 | 0.228 | 8.871 | 0.113 | 8.230 | 0.177 | 7.697 | 0.230 |
| Service convenience (C11) | 8.662 | 0.134 | 7.582 | 0.242 | 8.653 | 0.135 | 8.193 | 0.181 | 7.745 | 0.225 |
| Total | 8.271 | 0.173 | 6.858 | 0.314 | 7.557 | 0.244 | 7.431 | 0.257 | 7.327 | |
| Banqiao HSR Station | Taoyuan HSR Station | Hsinchu HSR Station | Taichung HSR Station | Zuoying HSR Station | ||||||
|---|---|---|---|---|---|---|---|---|---|---|
| Times | % | Times | % | Times | % | Times | % | Times | % | |
| Work | 74 | 36.3 | 85 | 35.6 | 105 | 52.0 | 160 | 46.0 | 65 | 31.3 |
| Travel | 72 | 35.3 | 71 | 29.7 | 39 | 19.3 | 71 | 20.4 | 77 | 37.0 |
| Visit | 45 | 22.1 | 61 | 25.5 | 31 | 15.3 | 73 | 21.0 | 47 | 22.6 |
| Other | 13 | 6.4 | 22 | 9.2 | 27 | 13.4 | 44 | 12.6 | 19 | 9.1 |
| Total | 204 | 100 | 239 | 100 | 202 | 100 | 348 | 100 | 208 | 100 |
Publisher’s Note: MDPI stays neutral with regard to jurisdictional claims in published maps and institutional affiliations. |
© 2022 by the authors. Licensee MDPI, Basel, Switzerland. This article is an open access article distributed under the terms and conditions of the Creative Commons Attribution (CC BY) license (https://creativecommons.org/licenses/by/4.0/).
Share and Cite
Lin, S.-H.; Ho, C.-Y.; Lu, S.-Y.; Hsieh, J.-C. The Determinants of Passengers’ Consumption Motivation at High-Speed Rail Stations. Systems 2022, 10, 45. https://doi.org/10.3390/systems10020045
Lin S-H, Ho C-Y, Lu S-Y, Hsieh J-C. The Determinants of Passengers’ Consumption Motivation at High-Speed Rail Stations. Systems. 2022; 10(2):45. https://doi.org/10.3390/systems10020045
Chicago/Turabian StyleLin, Sheng-Hau, Chin-Yu Ho, Song-Ying Lu, and Jing-Chi Hsieh. 2022. "The Determinants of Passengers’ Consumption Motivation at High-Speed Rail Stations" Systems 10, no. 2: 45. https://doi.org/10.3390/systems10020045
APA StyleLin, S.-H., Ho, C.-Y., Lu, S.-Y., & Hsieh, J.-C. (2022). The Determinants of Passengers’ Consumption Motivation at High-Speed Rail Stations. Systems, 10(2), 45. https://doi.org/10.3390/systems10020045