Abstract
Many believe good government to be essential for a nation’s progress, but, in fact, governance is a multidimensional concept with uncertain implications for economic development and global sustainability. The World Bank has tracked six country-level Worldwide Governance Indicators since 1996. Statistical regression analysis across 150 countries identified two of these indicators, Government Effectiveness and Regulatory Quality, that consistently help to explain changes in economic growth and CO2 emissions. The regression results provided the evidence needed to incorporate the effects of governance in an existing climate-population simulation model. Policy testing of the revised model led to findings about what improved governance can and cannot do. The testing suggested that the best combination of such improvements could boost progress on emissions reduction without hindering economic development—but not enough to strongly mitigate climate change. Achieving the double goal of economic development and strong climate change mitigation would thus require some kind of extra effort that does not fall under the usual definitions of good national governance.
1. Introduction
It is widely accepted that good government is a cornerstone of national and global progress. Goal 16 of the UN’s 17 Sustainable Development Goals (SDG) proclaims the importance of effective governance, including promoting the rule of law, ensuring equal access to justice for all, reducing corruption and bribery, and ensuring responsive, inclusive, participatory, and representative decision-making at all levels [1].
Indeed, the World Bank has long maintained that all six of its Worldwide Governance Indicators (WGI, listed in Table 1 and tracked country by country since 1996 [2]) are strongly related to faster or better national development [3,4]. However, some analyses call this claim into question as a general proposition—finding, for example, that governance has effects that differ by region, with Asia behaving differently than other regions [5,6,7].

Table 1.
The six Worldwide Governance Indicators (adapted from [2]).
Some observers are quite enthusiastic about the potential of good government, saying that it not only speeds economic growth but also could be the key to addressing climate change [8]. One causal-loop analysis finds that good governance may be among the most important SDGs for global sustainability [9]. Similarly, a qualitative cross-impact analysis finds that effective governance can support progress toward many of the other SDGs: reducing poverty and inequality while improving health, sanitation, public infrastructure, natural resource protection, and climate change mitigation and adaptation [10].
But these are qualitative analyses, and, when it comes to climate change, they beg a fundamental quantitative question. Can something that promotes economic growth also drive down the emissions intensity of GDP (i.e., kilograms of CO2-equivalent emissions per dollar of GDP) enough to yield a net reduction in greenhouse gas (GHG) emissions?
Economic growth to date has in fact reduced GHG emissions intensity, through greater use of energy efficient technologies (including electrification), but not nearly enough to reduce overall emissions [11,12]. As a result, global emissions have continued to rise. Could much better governance change this equation and get us out of the awful bind in which economic development is both friend and existential enemy?
2. Materials and Methods
This paper is intended to at least make a start on answering this question. The approach was to start with a relatively compact model of climate, population, and economy [13] and to incorporate key governance variables (selected from the World Bank’s WGI) based on statistical analysis across 150 countries and over more than 20 years.
This statistical analysis should be seen as a kind of “partial-model testing”, in which one examines the ability of a proposed structure (even one as small as a single equation) to produce historically accurate outputs when subjected to historical inputs. Partial-model testing, using model components as small as the input and output evidence will allow, has been established as a valid way of selecting and conducting initial calibration (with the possibility of later fine-tuning) of pieces of structure for inclusion in a larger system dynamics simulation model [14,15].
After ensuring that the revised model provided a good fit to historical data and published projections, a number of policy tests were performed. The primary goal of this testing was to determine whether improvements in the governance variables could by themselves reduce emissions enough to strongly reduce climate change by 2060, but without harming economic growth.
This use of data analysis and modeling to examine the impact of governance on climate change and global economic development is a novel approach. Other system dynamics models addressing the Sustainable Development Goals do include governance, but primarily for its ability to boost public spending overall, rather than its specific ability to reduce greenhouse gas emissions [16,17].
3. Results
3.1. Data
World Bank data were gathered on the more than 150 countries with 2020 population of one million or more, encompassing more than 97% of the global population. These data included:
- The six World Governance Indicators (1996–2020 annual except 1997 and 1999 [2]), originally reported on a scale of −2.5 to 2.5, converted to 0 to 1 indices;
- GDP per capita (GDPPC) in constant U.S. dollars (1990–2019 annual), from which annual GDPPC growth rate (GDPPCGR) was also calculated, as well as the natural logarithm of GDPPC; and
- CO2 emissions per capita in metric tons (1991–2018 annual), from which CO2 intensity of GDP (kilograms per dollar) was also calculated by dividing by GDPPC and multiplying by 1000.
The WGI data show that countries may do better in some areas of governance than others. Table 2 presents rankings for the 2015–2020 period for the 15 most populous countries in the world, from 1 (best) to 150 (worst). China gets generally middling scores but does better on Government Effectiveness and much worse on Voice & Voting. India performs similarly to China on four of the six metrics but is much better on Voice & Voting and worse on Stability & Non-Violence. The U.S. and Japan rank very well, though the U.S. slips lower on Stability & Non-Violence. Indonesia, Mexico, Philippines, and Vietnam get generally middling scores, while Russia, Ethiopia, and Egypt get generally poor scores, but with exceptions for some metrics.
Table 2.
Governance rankings (N = 150, ranking of 1 is best, 150 is worst) for the world’s 15 most populous countries as of 2015–2020.
Consider also global trends over time:
- WGI: On a population-weighted basis across 150 countries, most of the WGI indicators either stayed about the same from 1996 to 2020 or slipped slightly. The worst of these was Stability & Peace, which slipped by 10% in the early 2000s and has remained at this lower level since then. Only Government Effectiveness has improved a bit, by about 6% over the 24-year period.
- GDPPC and GDPPCGR: Global average real GDP per capita grew by about 60% from 1990 to 2020. The annual growth rate has been erratic but generally increased from the 1990s (rising from 0% to 3% per year) to the 2000s (mostly about 3% per year), then declining in the 2010s (mostly 1.5% to 2% per year). The decline may reflect what has been described as the convergence effect [18], in which a country’s economic growth typically slows as its GDPPC climbs to middle or higher income. “Unified growth theory” suggests that convergence across all economies will take place in the long run [19].
- CO2 intensity of GDP: This metric declined steadily throughout 1991–2018, from 0.55 kg/USD2015 in the early 1990s down to 0.42 in the late 2010s, a rate of about 1% per year.
3.2. Statistical Analysis
For purposes of statistical analysis, the gathered data were averaged across five 5-year time periods: 1995–2000, 2000–2005, 2005–2010, 2010–2015, and 2015–2020. The 1995–2000 period was designated as the baseline period, and differences against the baseline were calculated for each of the four subsequent 5-year periods. A series of linear regressions were performed to test the following hypotheses for possible inclusion in the simulation model:
Hypothesis 1(H1).
Improvements in good governance boost GDPPC growth, after controlling for the convergence (reducing) effect of increased GDPPC.
Hypothesis 2(H2).
Improvements in good governance reduce CO2 intensity of GDP, after controlling for the efficient technologies effect of increased GDPPC.
Hypothesis 3(H3).
Increases in GDPPC lead to improvements in good governance. This is suggested, for example, by a qualitative analysis that found lower poverty and unemployment to be moderate boosters of good governance [10], perhaps reflecting greater citizen involvement and reduced social unrest.
Regressions were performed for each time period separately, hoping to find strong associations that are consistent across most or all of the time periods. Insignificant factors (with higher p-values) were winnowed sequentially to maximize adjusted R-squared. Key results of the regression analysis are shown in Table 3 and may be summarized as follows:
Table 3.
Statistical regression results across many countries (N = 150 or N = 147). by 5-year time period, based on variables expressed as changes since 1995–2000. (ns = not significant and not present in best regression equation).
- H1 (for GDPPCGR) was tested initially by including ln(GDPPC) plus all six of the WGI. After winnowing, the strongest equation included ln(GDPPC) with a negative coefficient (thus confirming the convergence effect), Government Effectiveness (GE) with a positive coefficient, and Regulatory Quality (RQ) with a negative coefficient. None of the other four WGI proved significant. H1 is thus partially supported (GE boosts GDPPCGR after controlling for convergence), but we also encounter a surprise (RQ suppresses GDPPCGR).
- Like H1, testing for H2 (for CO2 intensity) initially included ln(GDPPC) plus all six of the WGI. After winnowing, the strongest equation included ln(GDPPC) with a negative coefficient (thus confirming the efficient technologies effect), as well as RQ with a negative coefficient. None of the other five WGI proved significant. H2 is thus supported, with Regulatory Quality revealed as the one aspect of governance in the WGI that predictably reduces CO2 intensity.
- Testing of H3 indicates that ln(GDPPC) is indeed a significant factor (with small p-values) positively affecting both GE and RQ. (Similar results were found for the other four WGI, but these results are irrelevant in light of the H1 and H2 results, which suggested that only GE and RQ should be included in the extended simulation model.)
An observation may be helpful before moving on to discuss the model revision. Although the WGI variables are described officially (Table 1) in a way that may seem entirely positive and supportive of development, the statistical analysis here suggests that the metrics are in fact defined in a way that (a) concentrates in Government Effectiveness the economy-boosting aspects of government, and (b) concentrates in Regulatory Quality those aspects of government that lead to greater energy efficiency but at some cost to economic growth.
3.3. Model Revision and Base Run Results
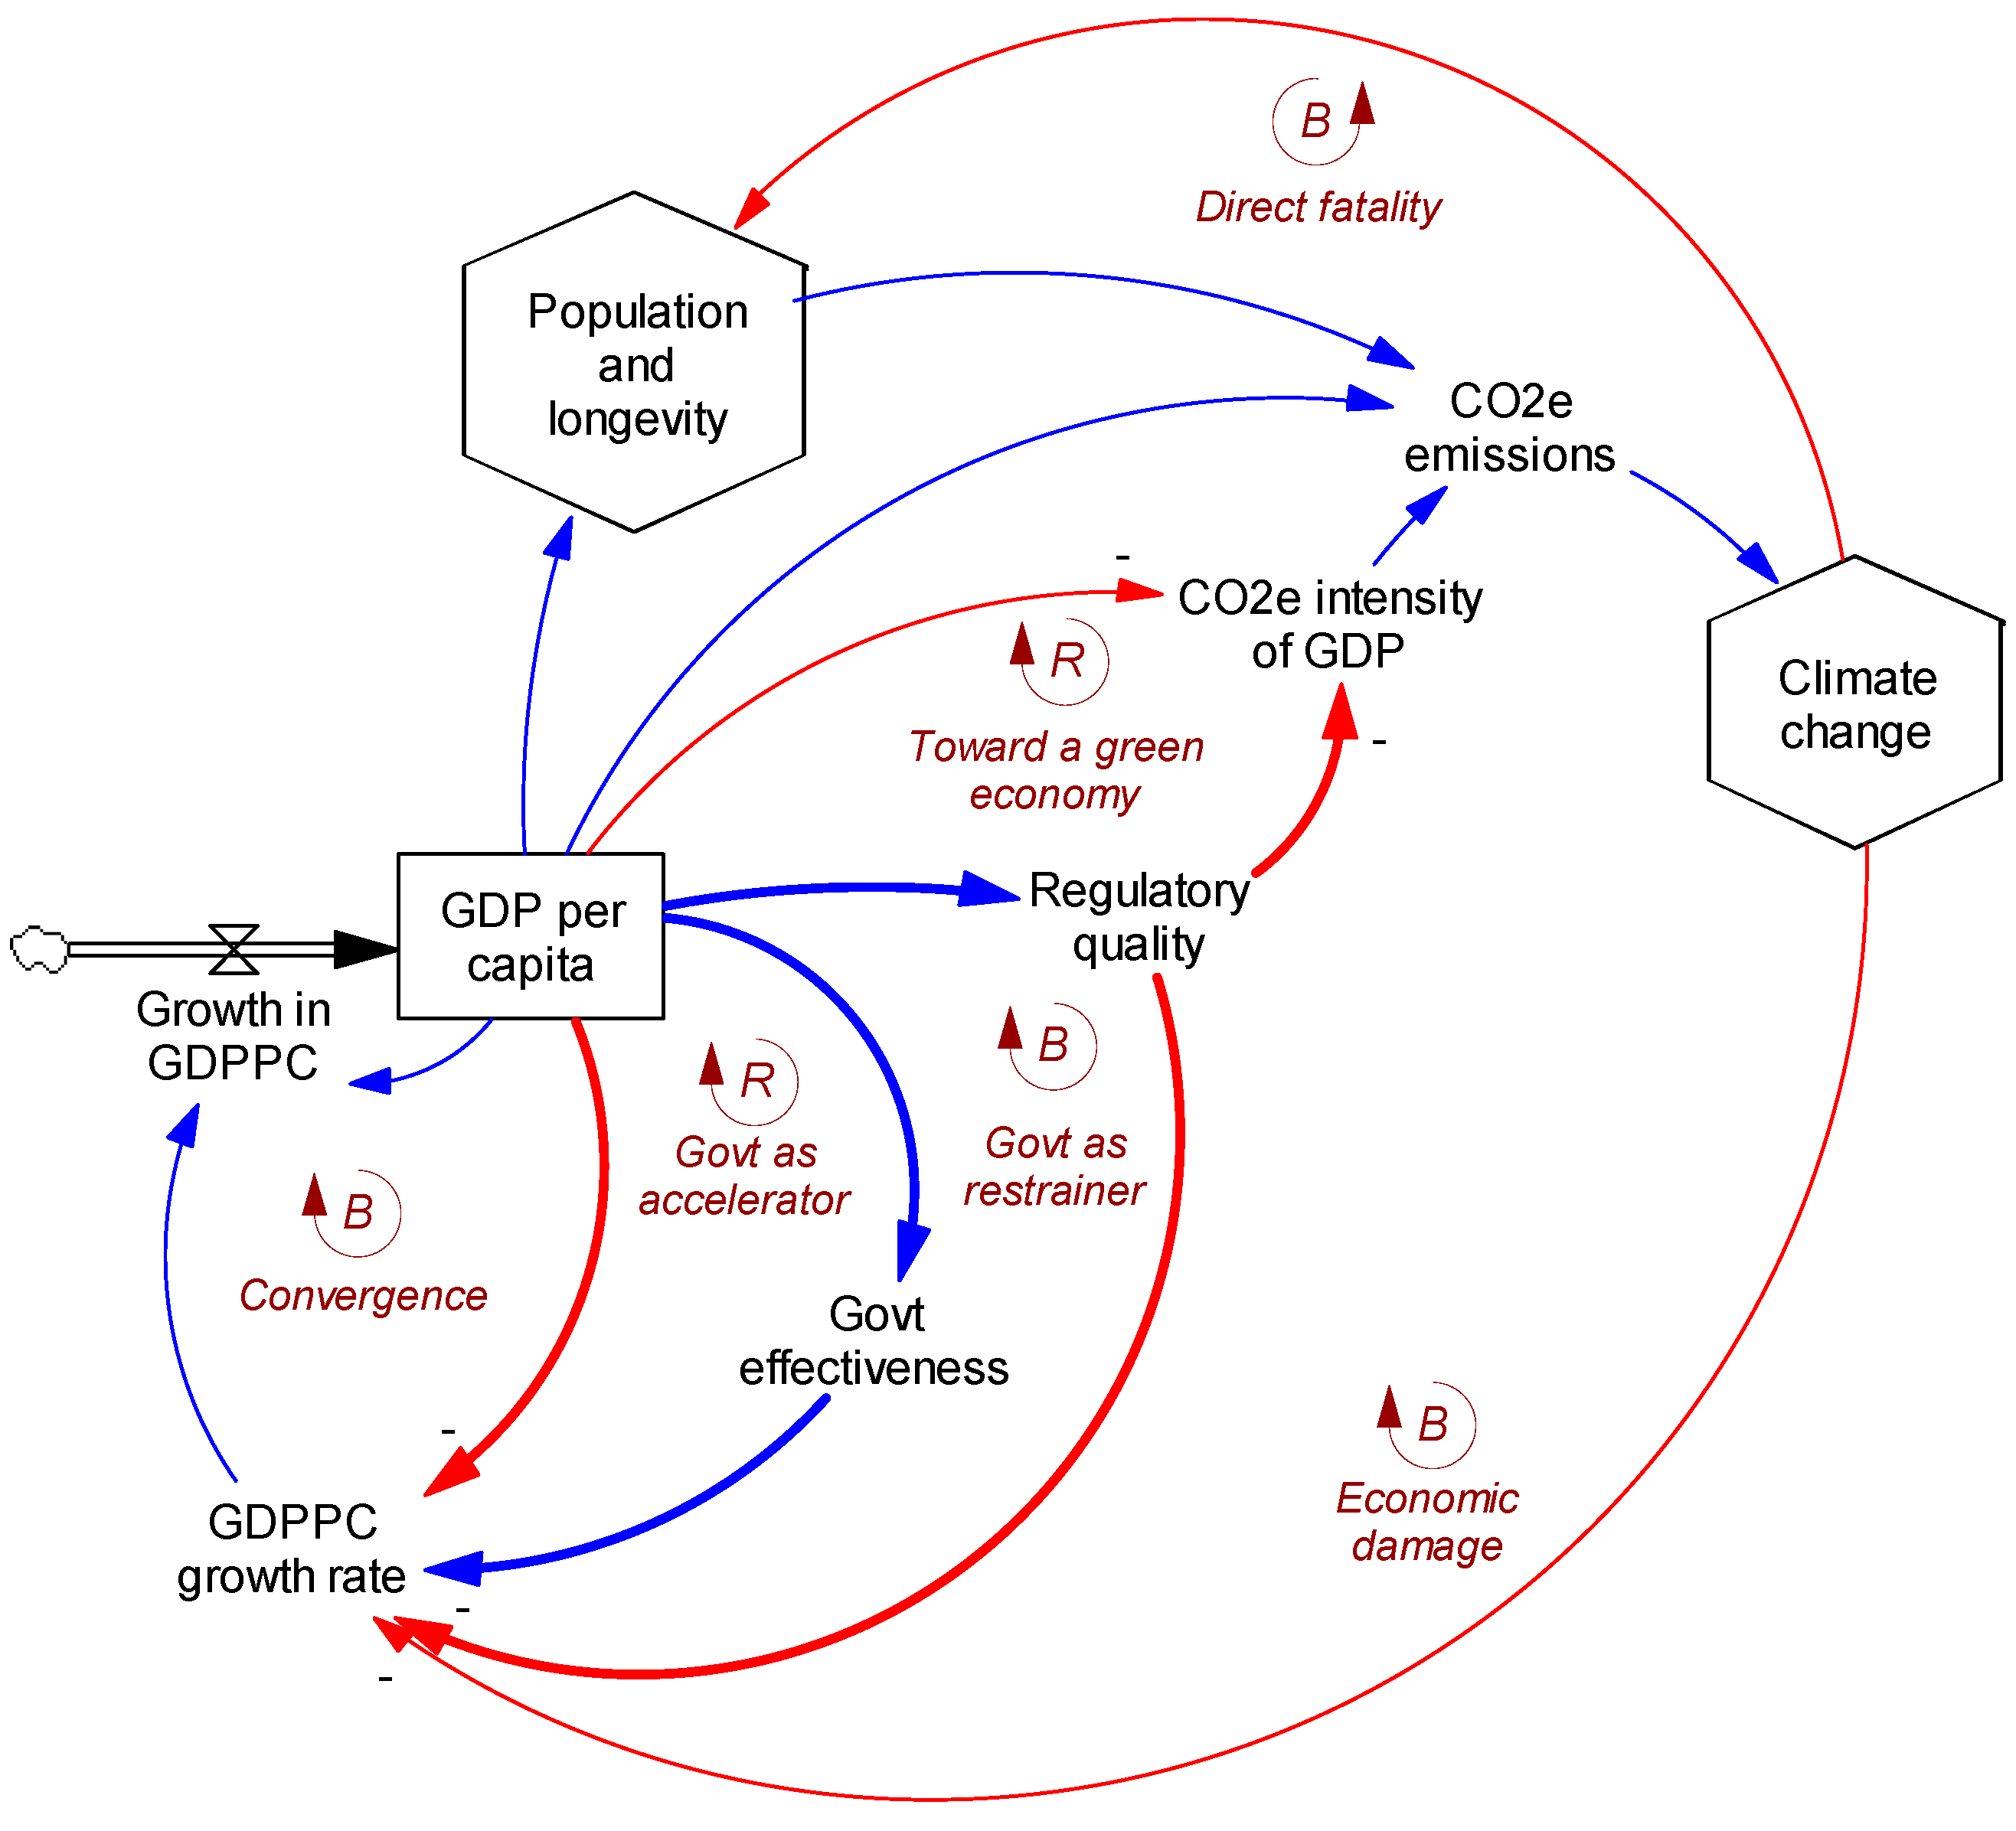
The statistical analysis above suggests formulation enhancements for two elements of the original climate-population model [13]—namely, the GDPPC growth rate and the CO2-equivalent emissions intensity of GDP. It also suggests how the new variables, Government Effectiveness and Regulatory Quality, might be formulated. These model changes may be seen diagrammatically in Figure 1, which gives an overview of the entire revised model (implemented using Vensim™ Professional x64 version 8.2.1).
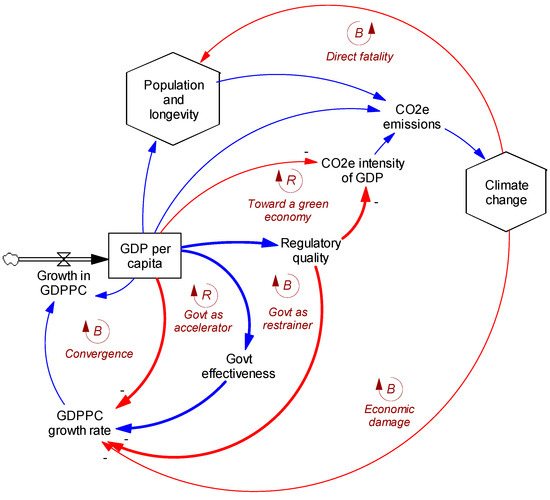
Figure 1.
Simulation model logic. Thicker arrows indicate revised structure since [13]. Blue arrows indicate positive link polarity; red arrows negative. “B” feedback loops are balancing; “R” are reinforcing.
The revised and new equations are shown in Table 4. Graphs from the revised model’s base run are shown in Figure 2 (GDPPCGR and GDPPC compared with the original model) and Figure 3 (GE and RQ compared with WGI data 1996–2020). Estimation of the equations (and the resulting outputs) may be described as follows:
Table 4.
Six revised or new equations in the model, based on regression results and adjustment for fit to analyst projections (Equations (1)–(4)) and historical data (Equations (5) and (6)).

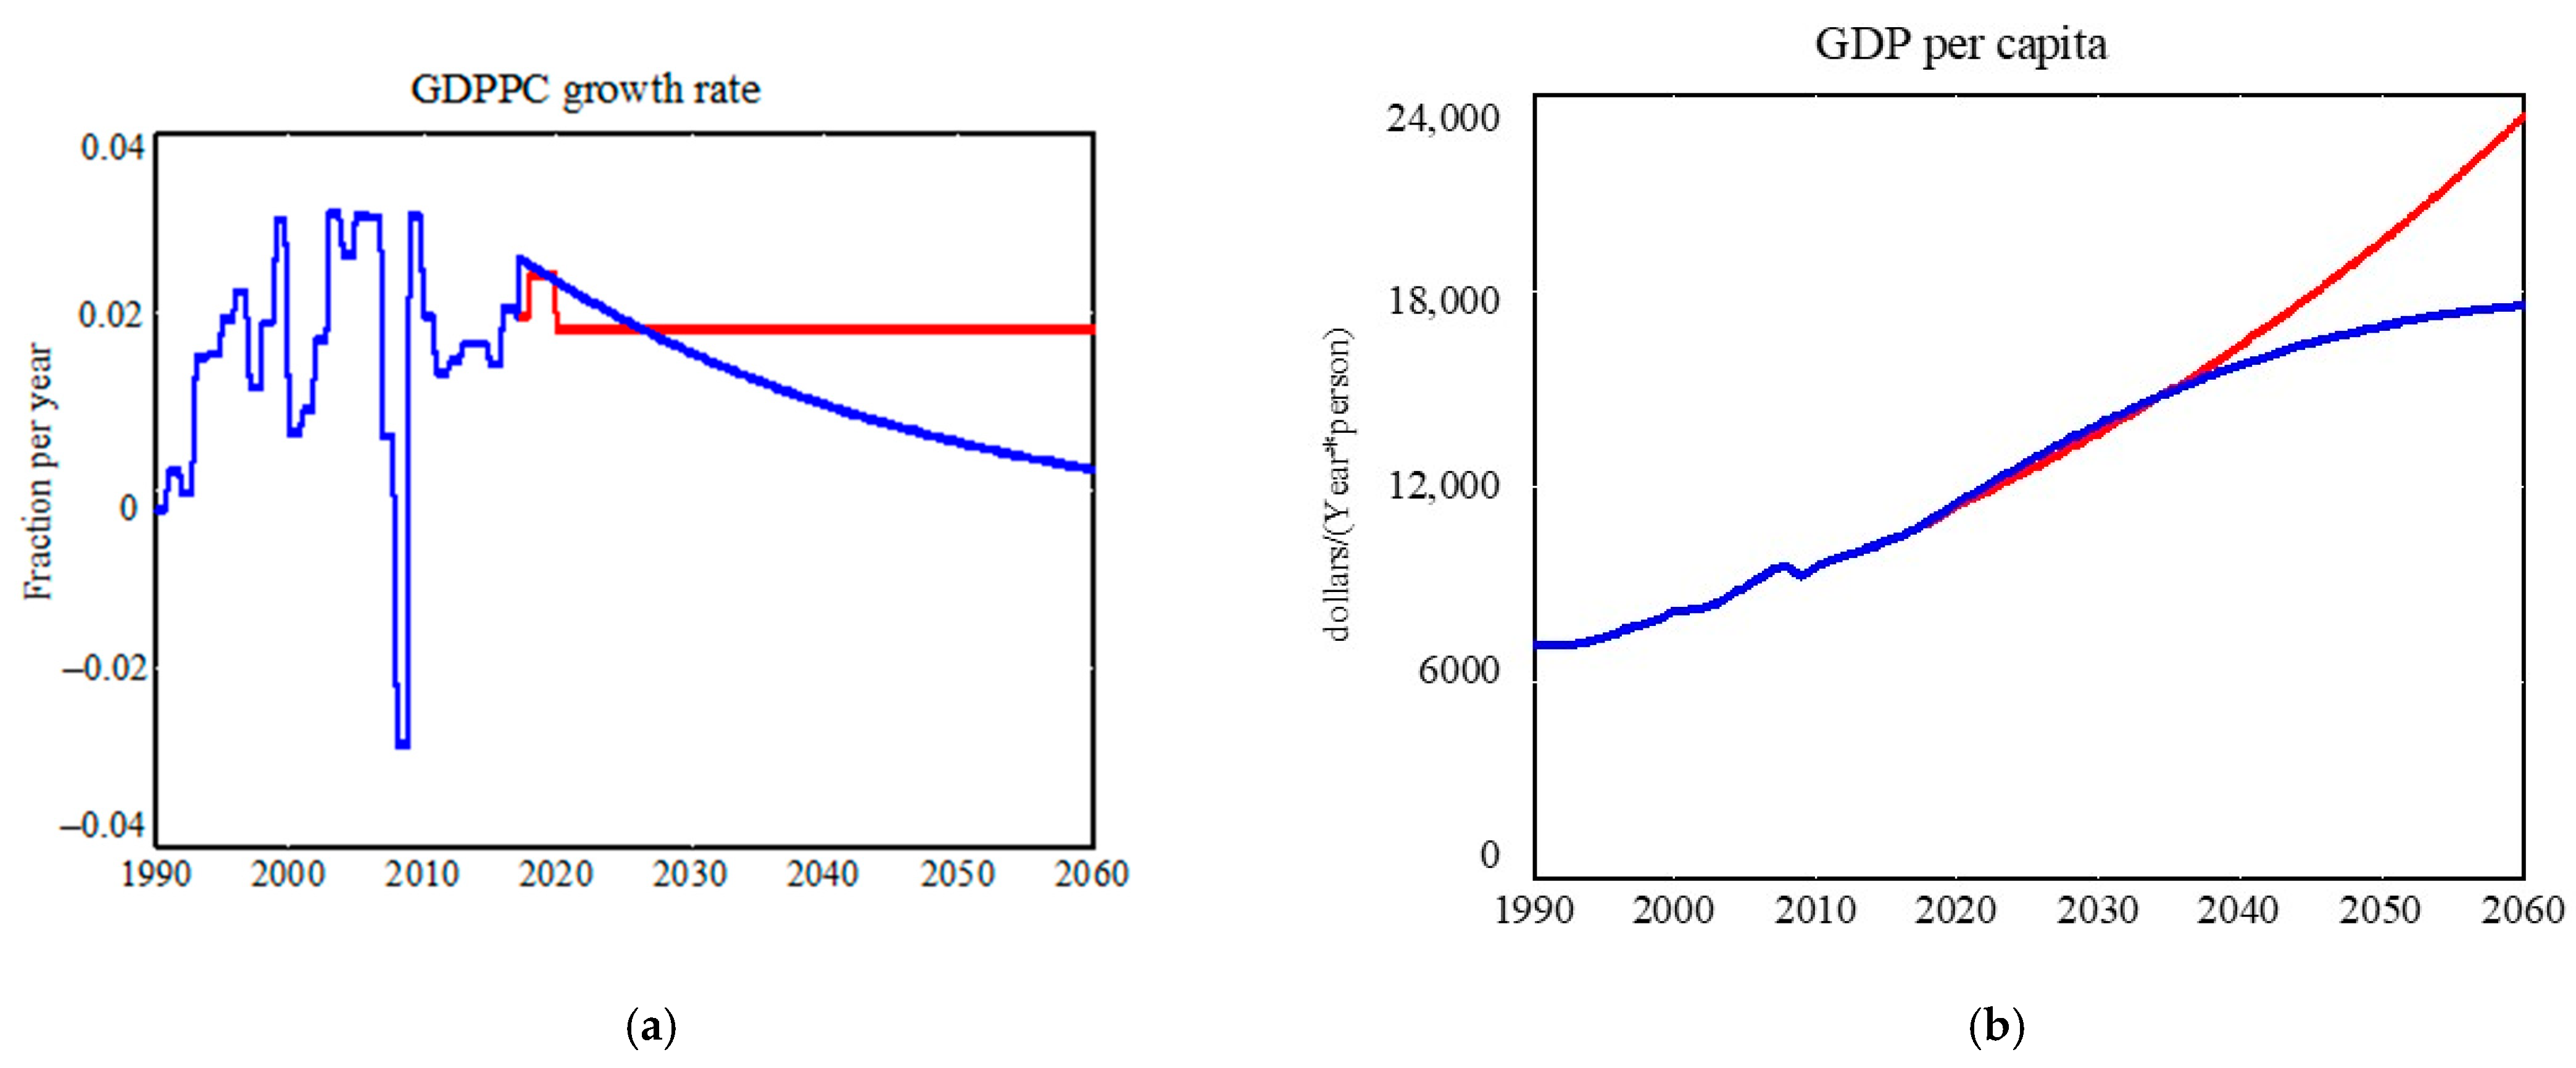
Figure 2.
Original (red) and revised (blue) base run results 1990–2060 for world average (a) GDP per capita growth rate (1/year) and (b) GDP per capita (2010 USD/person/year).
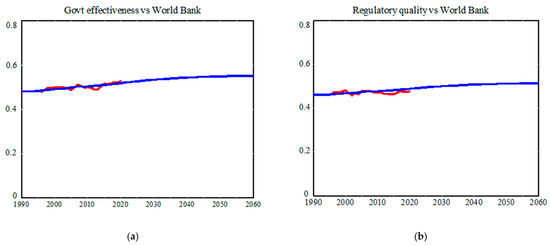
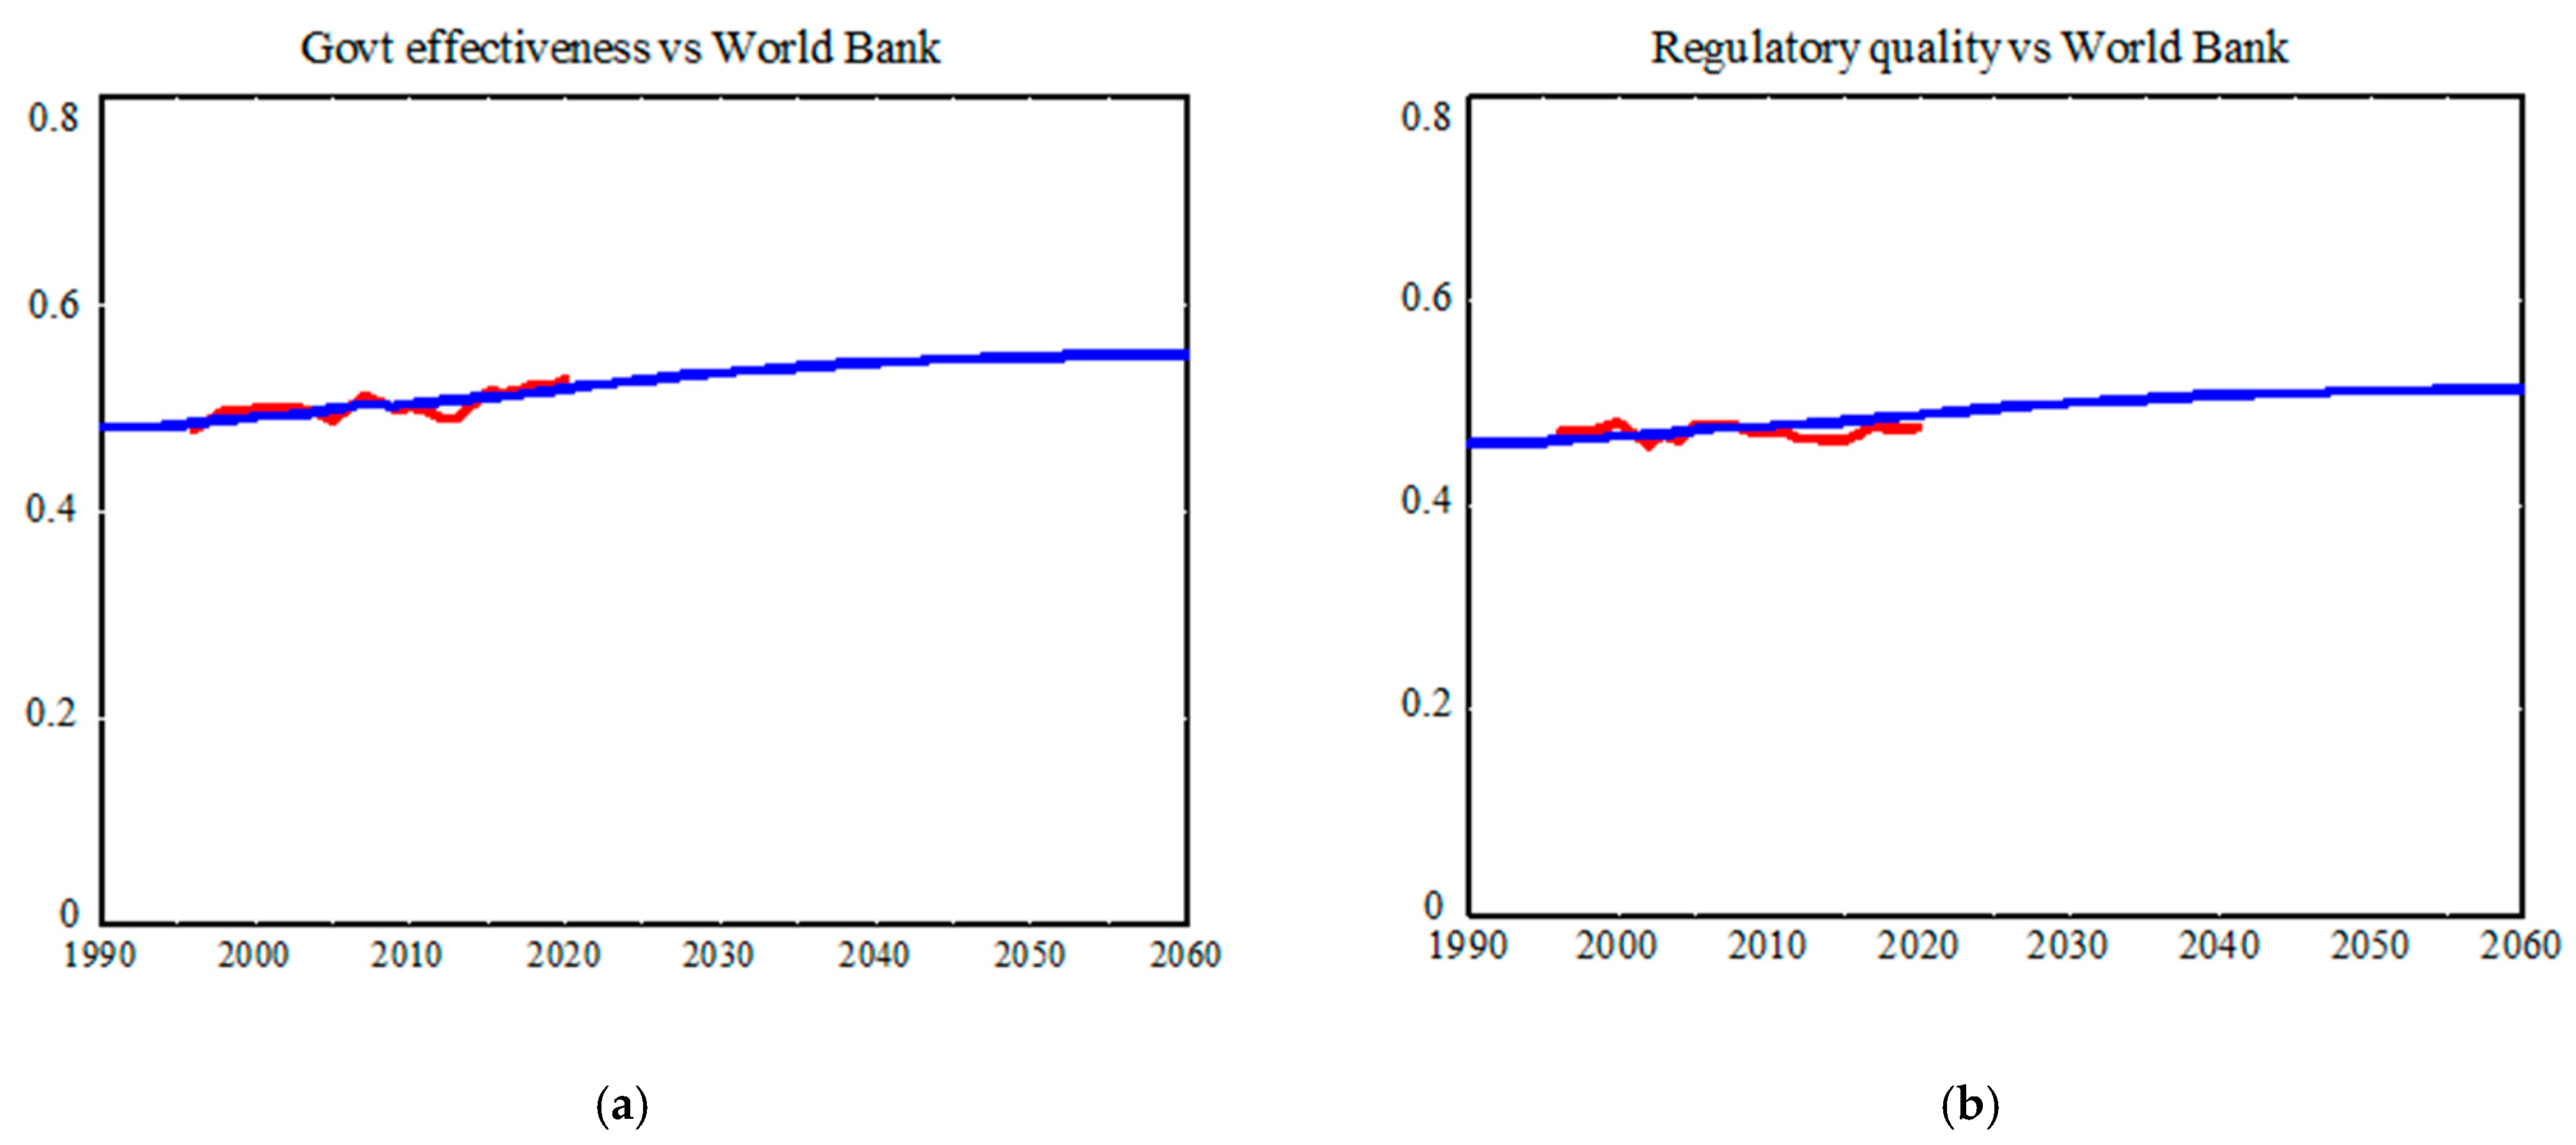
Figure 3.
Base run output 1990–2060 (blue) and world average calculated from WGI data 1996–2020 (red) for (a) Government Effectiveness (0–1) and (b) Regulatory Quality (0–1).
- Equation (1) (GDPPC growth rate): Coefficients for ln(GDDPC), GE, and RQ were adjusted (within ranges suggested by regression H1 in Table 3) to maintain a good fit to baseline projections for global GDPPC [20] through the 2020s and 2030s (Figure 2). The new base run produces a more realistic convergent glide path (blue line; compared with original model red line), with the growth rate declining to 0.2%/year by 2060, similar to that of higher-income countries today. Lower GDPPC in the revised model during 2040–2060 leads, in turn, to lower average life expectancy in 2060 (75.8 vs. 78.1 years). There is virtually no effect on the projection of total population (10.15 vs. 10.14 billion in 2060) because the lower life expectancy is fully offset by a higher birth rate due to lower GDPPC. (For more detail on the projected impacts of changes in GDPPC on life expectancy, birth rate, and total population, see [13]).
- Equations (2) to (4) (Energy CO2 intensity, Non-energy CO2 intensity, Other GHG CO2-equivalent intensity): Coefficients for ln(GDPPC) and RQ were adjusted (as guided by regression H2 in Table 3) to maintain a good fit to baseline projections for these emissions intensities through the 2020s and 2030s (and for CO2e emissions overall) from the En-ROADS model [21]. Beyond 2040, CO2e emissions in the revised model dip slightly below those in the original model, ending in 2060 at 90.4 gigatons per year (revised) compared with 94.1 (original). The impact on projected climate change is very small: temperature above preindustrial (hereafter “temperature delta” in degrees centigrade) in 2060 is 2.54 °C (revised) compared with 2.57 °C (original).
- Equations (5) and (6) (Government Effectiveness, Regulatory Quality): Coefficients for ln(GDPPC) were adjusted (within ranges suggested by regressions H3 in Table 3) to produce good fits to population-weighted global averages for GE and RQ from 1996 to 2020 (Figure 3). These coefficients are relatively small, so that, although global GDPPC rose by 60% from 1990 to 2020 and in the base run rises another 53% from 2020 to 2060, global GE rises only from 0.48 to 0.52 to 0.55, and global RQ only from 0.46 to 0.49 to 0.51. One may see this same sort of sluggish improvement in GE and RQ at the level of individual countries historically; for example, while India’s GDPPC grew more than threefold from the early 1990s to 2020, its GE grew only from 0.48 to 0.54 and its RQ from 0.42 to 0.45.
3.4. Policy Testing
Hypothetical policy tests were performed to determine whether strong improvement in Regulatory Quality, balanced by strong improvement in Government Effectiveness, could, in theory, (a) reduce emissions enough to significantly reduce the temperature delta (from its baseline 2.54 °C above in 2060 down to about 2.0 °C) but (b) without harming global economic development (and thus, life expectancy, which in the base run reaches 75.8 years by 2060). If even very strong governance improvements by themselves cannot accomplish this double goal, then how much more action on emissions reductions (i.e., beyond strong regulations) must be undertaken to get the temperature delta down to about 2.0 °C by 2060?
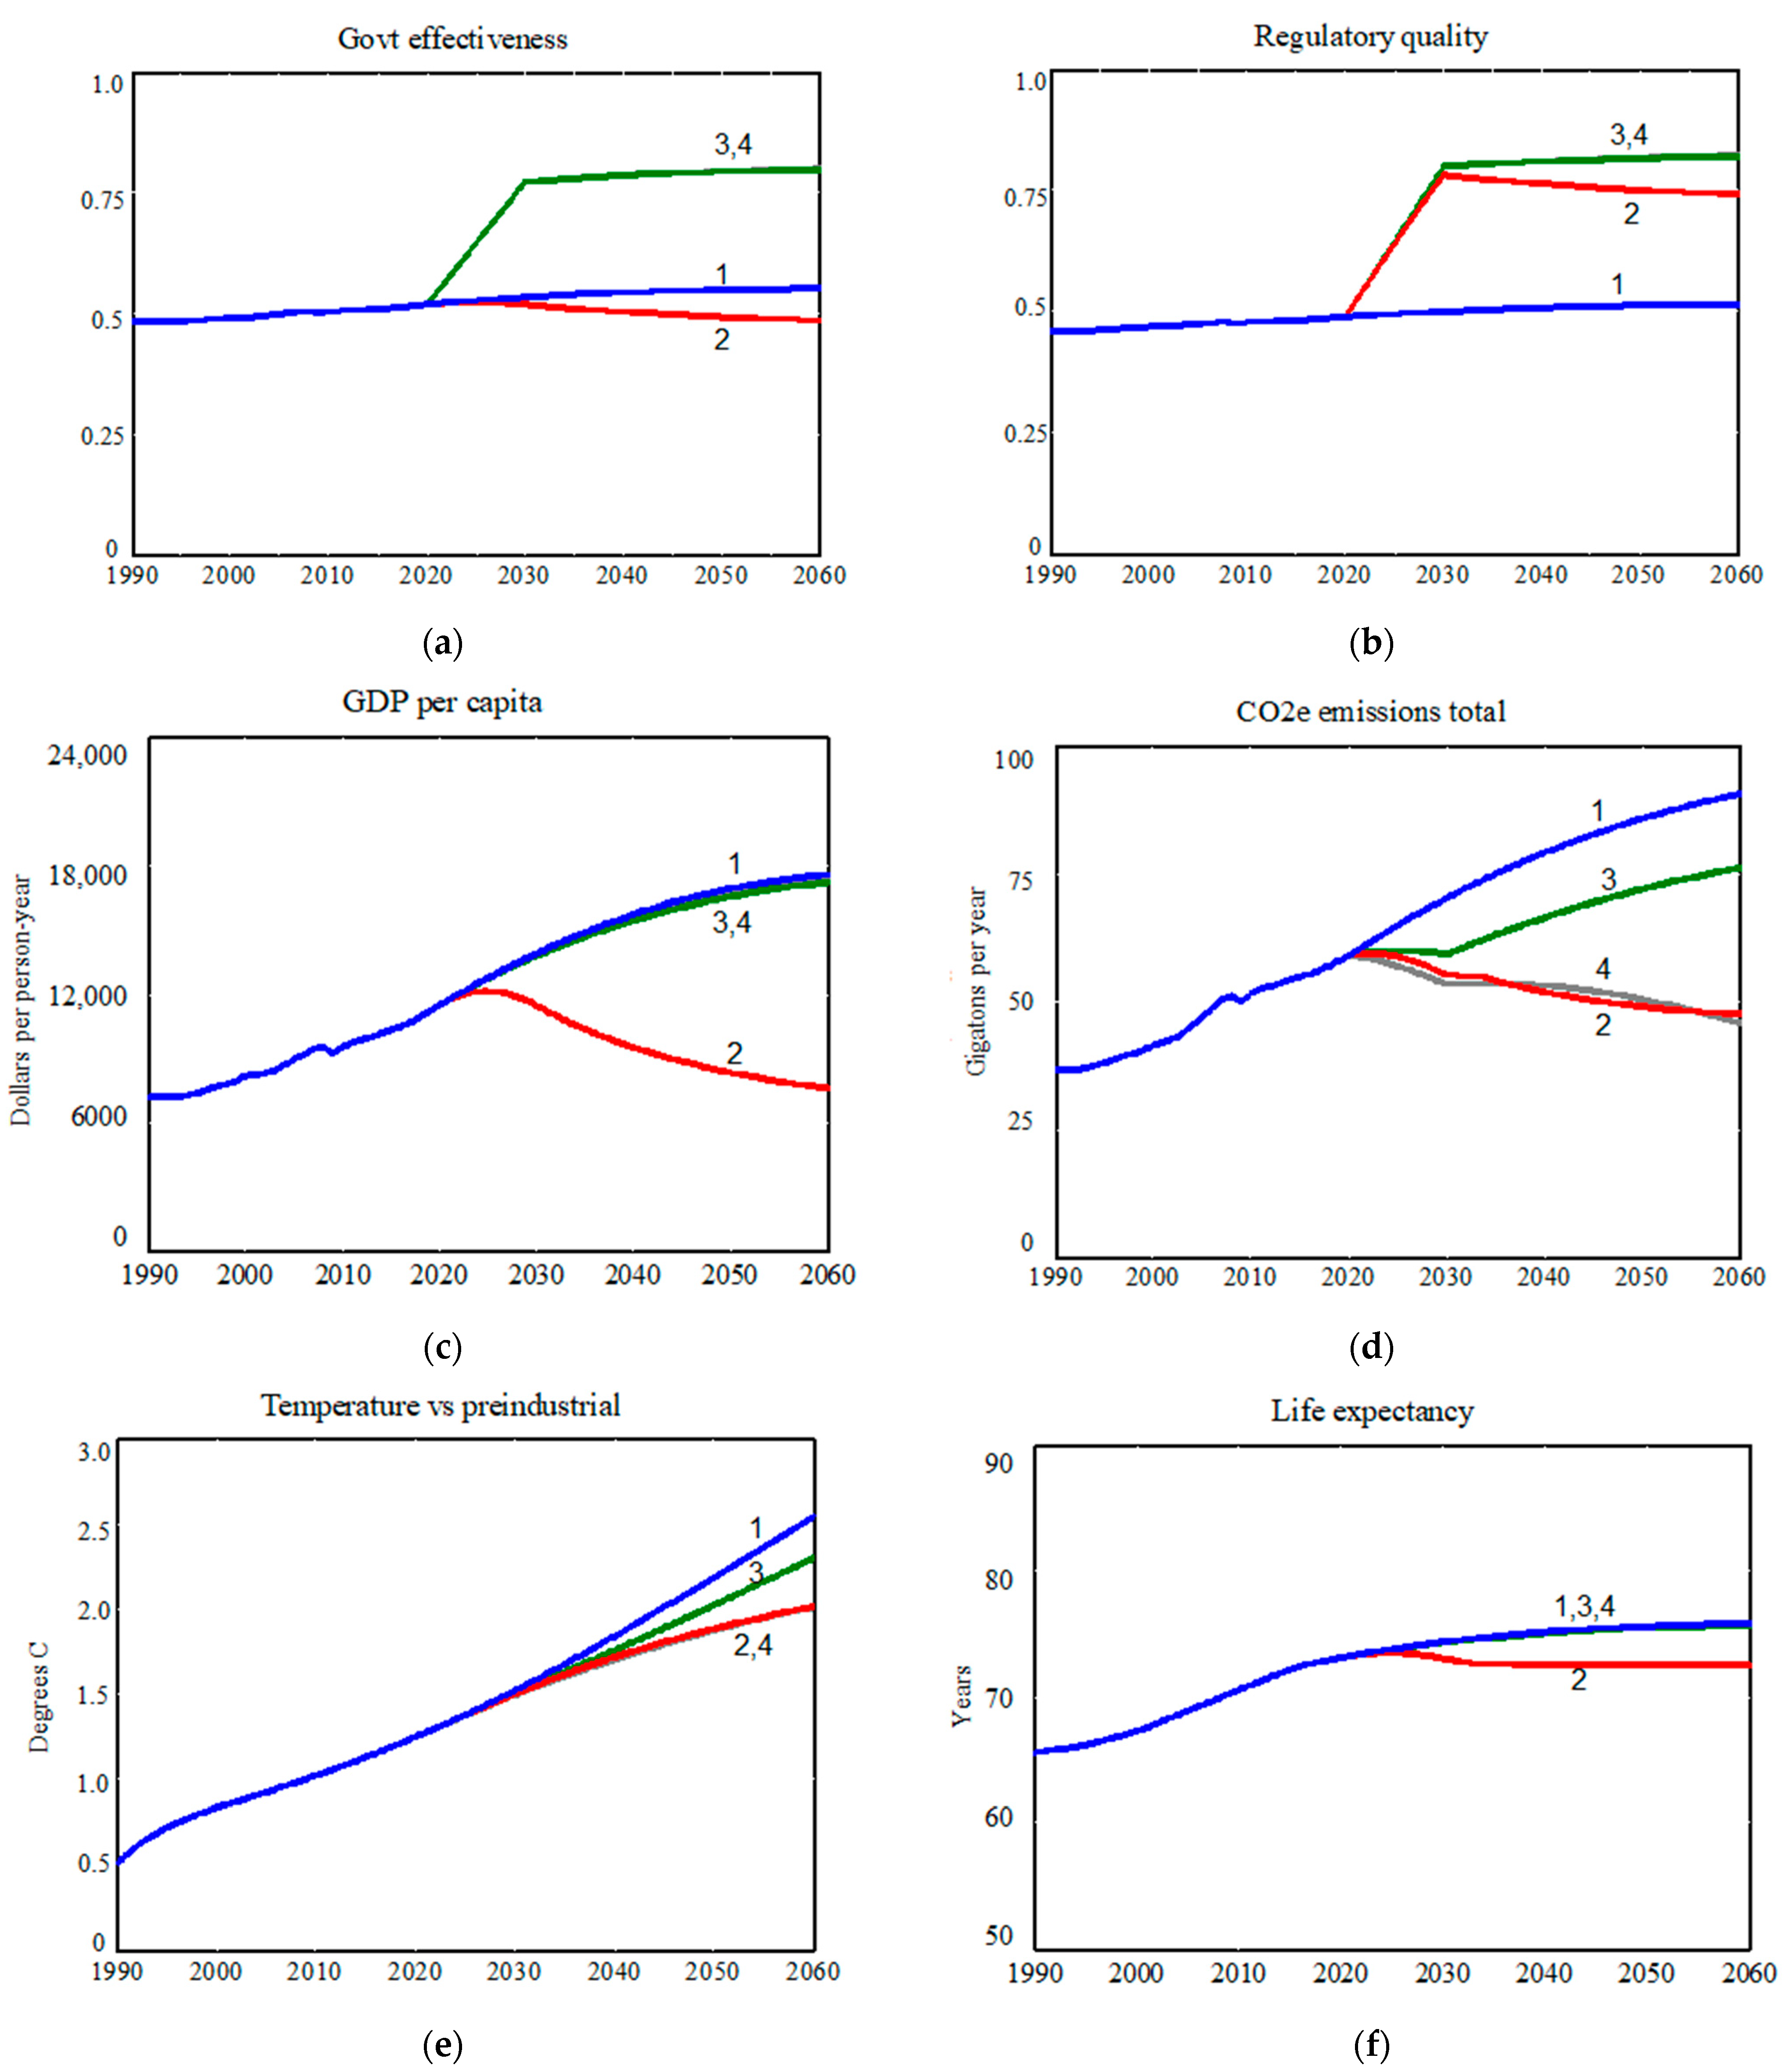
Figure 4 presents the results (for six model variables) of a representative layered sequence of simulations. First comes the base run (blue line). Second, RQ is ramped up by 60% from 2020 to 2030 (red line). Third, in addition to the RQ ramp-up, GE is ramped up by 45% from 2020 to 2030 (green line). Fourth, in addition to the RQ and GE ramp-ups, the three GHG emissions intensities are ramped down gradually by an additional 40% from 2020 to 2060 (grey line).
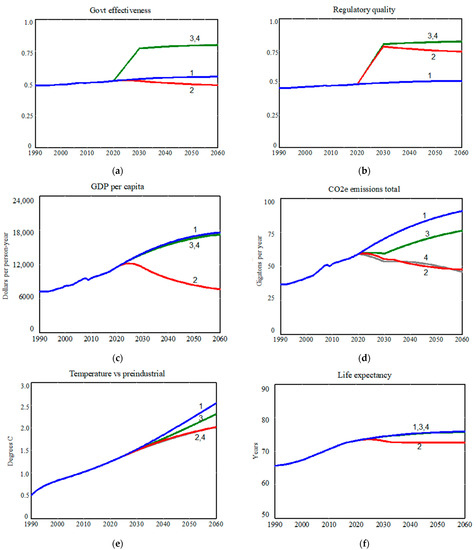
Figure 4.
Layered policy testing results: 1-Blue: base run; 2-Red: boost Regulatory Quality 60% by 2030; 3-Green: also boost Government Effectiveness 45% by 2030; 4-Grey: also ramp emissions intensity of GDP down an additional 40% by 2060. For six output variables 1990–2060: (a) Government Effectiveness (0–1), (b) Regulatory Quality (0–1), (c) GDP per capita (2010 USD/person/year), (d) CO2e emissions (gigatons/year), (e) temperature delta (°C), (f) life expectancy (years).
Start with the boost in Regulatory Quality (red line). This boost does reduce emissions by 48%, but it also acts as a major restraint on economic growth (GDPPC is reduced 57% vs. the base run by 2060). Reduced GDPPC, in turn, hurts life expectancy (reduced from 75.8 to 72.5 years in 2060), as well as GE (reduced from 0.55 to 0.48) and even RQ itself (the 60% boost in 2030 is eroded to a 44% boost by 2060). Although the RQ boost is somewhat eroded, CO2e emissions are reduced by nearly 50%, and the temperature delta in 2060 is reduced to 2.02 °C. Thus, climate change is mitigated as desired, but at the cost of severe economic decline and concomitant decline in life expectancy.
Adding in a 45% boost in Government Effectiveness (green line) is sufficient to offset the economic harm done by tightened regulations. GDPPC loses only 2% against the base run through 2060, life expectancy reaches 75.7, and there is no erosion in GE or RQ. However, having restored GDPPC growth, CO2e emissions are now reduced only 16% rather than 48%, and the temperature delta ends at 2.30 °C (44% of the way from 2.54 °C to 2.0). Thus, it appears that a balanced policy of governance improvements that maintains growth in the economy (and life expectancy) is not capable by itself of bringing the temperature delta down to the goal of 2.0 °C, although it does result in good progress toward that goal.
All policy tests combining various improvement ramps for GE and RQ lead to this same finding that governance improvement by itself cannot accomplish the double goal. It is necessary to layer in an additional policy targeting emissions specifically, presumably in ways that are non-regulatory and thus neutral with respect to economic growth. In the last run (grey line), layering in an additional 40% reduction in GHG emissions intensities by 2060 does achieve the double goal. CO2e emissions now assume a steep downward trajectory like that seen in the RQ-only test (red line), and temperature delta is reduced to 2.01 °C by 2060.
4. Discussion
Regression analysis of World Bank data on some 150 countries from the 1990s to 2020 made it possible to identify two Worldwide Governance Indicators, Government Effectiveness and Regulatory Quality, that help to explain changes in global-level changes in economic growth and CO2 emissions. GE was found to stimulate growth in GDP per capita, while RQ was found to reduce the emissions intensity of GDP but to hinder economic growth. The regression results provide the evidence needed to incorporate the effects of governance (as well as the convergence effect of growing GDPPC) in an existing climate-population simulation model.
Policy testing of the revised model led to findings about what improvements in governance can and cannot do. First, the current global pace of progress in GE and RQ (in the base run) is slow and should not be expected to give much support to economic development or climate change mitigation through 2060. Second, a commitment to tighter regulations by itself could greatly reduce emissions but risks economic decline (and thus, a reversal of global progress on life expectancy). Third, a commitment to both tighter regulations and more effective government (e.g., guiding robust infrastructure development, with proper vetting and oversight of government-funded contractors) could permit progress on emissions intensity reduction while avoiding economic decline. However, fourth, even the best combination of improvements in GE and RQ is not able to make enough progress on emissions reduction to bring the 2060 temperature delta down to 2.0 °C as desired (without hindering economic development).
Achieving the double goal of economic development and climate change mitigation would thus require some kind of non-regulatory extra effort that does not fall under the usual definitions of good governance. Much of this extra effort may need to occur through global accords (e.g., incentivizing green technology diffusion) leading to a “green growth paradigm” [22].
The present analysis does, of course, face the usual limitations of any data analysis and modeling of a complex phenomenon. For example, the linear regressions were carried out across 150 countries without stratification and may have missed nonlinear effects that depend on a country’s starting GDPPC. If, say, the positive effects of GE and RQ remain strong at higher GDPPC, while the negative effect of RQ diminishes, one might reach a rosier conclusion about the ability of good governance alone to achieve (or come close to achieving) the double goal. A stratified data analysis might, therefore, be a good next step.
Funding
This research received no external funding.
Institutional Review Board Statement
Not applicable.
Informed Consent Statement
Not applicable.
Data Availability Statement
Publicly available data were analyzed in this study: Worldwide Governance Indicators: https://info.worldbank.org/governance/wgi/; GDP per capita: https://data.worldbank.org/indicator/NY.GDP.PCAP.KD; CO2 emissions per capita: https://data.worldbank.org/indicator/EN.ATM.CO2E.PC. (All accessed on 11 February 2022.) The simulation model is available from the author by request.
Acknowledgments
My thanks to Tom Fiddaman (Ventana Systems and Climate Interactive) for his helpful detailed comments on an earlier version of this work.
Conflicts of Interest
The author declares no conflict of interest.
References
- United Nations. Global Indicator Framework for the Sustainable Development Goals and Targets of the 2030 Agenda for Sustainable Development. Annex of UN Resolution A/RES/70/1. 2017. Available online: https://ggim.un.org/documents/a_res_71_313.pdf (accessed on 11 February 2022).
- World Bank/WGI. Worldwide Governance Indicators Online Database. Available online: https://info.worldbank.org/governance/wgi/ (accessed on 11 February 2022).
- Kraay, A.; Zoido-Lobaton, P.; Kaufmann, D. Governance Matters. World Bank Policy Research Working Paper. 1999, p. 2196. Available online: https://doi.1596/1813-9450-2196 (accessed on 11 February 2022).
- Kaufmann, D.; Kraay, A.; Mastruzzi, M. The Worldwide Governance Indicators: A Summary of Methodology, Data and Analytical Issues. World Bank Policy Research Working Paper. 2010, p. 5430. Available online: https://doi.1596/1813-9450-5430 (accessed on 11 February 2022).
- Quibria, M.G. Does governance matter? Yes, no, or maybe: Some evidence from developing Asia. Kyklos 2006, 59, 99–114. [Google Scholar] [CrossRef]
- Han, X.; Khan, H.; Zhuang, J. Do Governance Indicators Explain Development Performance? A Cross-Country Analysis; ADB Economics Working Paper Series No. 417; Asian Development Bank: Manila, Philippines, 2014. [Google Scholar]
- Doucouliagos, H.; Ulubasoglu, M.A. Democracy and economic growth: A meta-analysis. Am. J. Polit. Sci. 2008, 52, 61–83. [Google Scholar] [CrossRef]
- Bailey, R. Fast Growth Can Solve Climate Change. 30 November 2015. Available online: https://www.scientificamerican.com/article/fast-growth-can-solve-climate-change/ (accessed on 11 February 2022).
- Cernev, T.; Fenner, R. The importance of achieving foundational Sustainable Development Goals in reducing global risk. Futures 2020, 115, 12. [Google Scholar] [CrossRef]
- Weitz, N.; Carlsen, H.; Nilsson, M.; Skanberg, K. Towards systemic and contextual priority setting for implementing the 2030 agenda. Sustain. Sci. 2018, 13, 531–548. [Google Scholar] [CrossRef] [Green Version]
- Riahi, K.; van Vuuren, D.P.; Kriegler, E.; Edmonds, J. The Shared Socioeconomic Pathways and their energy, land use, and greenhouse gas emissions implications: An overview. Glob. Environ. Chang. 2017, 42, 153–168. [Google Scholar] [CrossRef] [Green Version]
- Fricko, O.; Havlik, P.; Rogelj, J.; Klimont, Z. The marker quantification of the Shared Socioeconomic Pathway 2: A middle-of-the-road scenario for the 21st century. Glob. Environ. Chang. 2017, 42, 251–267. [Google Scholar] [CrossRef] [Green Version]
- Homer, J. Modeling global loss of life from climate change through 2060. Syst. Dyn. Rev. 2020, 36, 523–535. [Google Scholar] [CrossRef]
- Oliva, R. Model calibration as a testing strategy for system dynamics models. Eur. J. Oper. Res. 2003, 151, 552–568. [Google Scholar] [CrossRef]
- Homer, J.B. Partial-model testing as a validation tool for system dynamcs (1983). Sys. Dyn. Rev. 2012, 28, 281–294. [Google Scholar] [CrossRef]
- Collste, D.; Pedercini, M.; Cornell, S. Policy coherence to achieve the SDGs: Using integrated simulation models to assess effective policies. Sustain. Sci. 2017, 12, 921–931. [Google Scholar] [CrossRef] [PubMed]
- Randers, J.; Rockström, J.; Stoknes, P.-E.; Goluke, U. Achieving the 17 Sustainable Development Goals within 9 planetary boundaries. Glob. Sustain. 2019, 2, 1–11. [Google Scholar] [CrossRef] [Green Version]
- Barro, R.J.; Sala-i-Martin, X. Convergence. J. Polit. Econ. 1992, 100, 223–251. [Google Scholar] [CrossRef]
- Galor, O. Unified Growth Theory; Princeton University Press: Princeton, NJ, USA, 2011. [Google Scholar]
- PriceWaterhouseCoopers (PWC). The World in 2050: Will the Shift in Global Economic Power Continue? 2015. Available online: https://www.pwc.com/gx/en/issues/the-economy/assets/world-in-2050-february-2015.pdf (accessed on 11 February 2022).
- Jones, A.P.; Zahar, Y.; Johnston, E.; Sterman, J.D.; Siegel, L. En-ROADS User Guide. Climate Interactive and MIT Sloan Sustainability Initiative. 2019. Available online: https://docs.climateinteractive.org/projects/en-roads/en/latest/index.html (accessed on 11 February 2022).
- van Vuuren, D.P.; Stehfest, E.; Gernaat, D.E.H.J.; Doelman, J.C. Energy, land-use and greenhouse gas emissions trajectories under a green growth paradigm. Glob. Environ. Chang. 2017, 42, 237–250. [Google Scholar] [CrossRef] [Green Version]
Publisher’s Note: MDPI stays neutral with regard to jurisdictional claims in published maps and institutional affiliations. |
© 2022 by the author. Licensee MDPI, Basel, Switzerland. This article is an open access article distributed under the terms and conditions of the Creative Commons Attribution (CC BY) license (https://creativecommons.org/licenses/by/4.0/).