1. Introduction
Rock differs from most other engineering materials in that it contains fractures of one type or another which render its structure discontinuous. Hence, a clear distinction must be made between the intact rock and the rock mass [
1]. The intact rock refers to the unfractured blocks between discontinuities comprised of rock-forming minerals. The rock mass is the in situ medium consisting of intact rock blocks separated by discontinuities, such as bedding plane, faults, joints, and folds, and often has in inhomogeneous and anisotropic properties. Numerous classification systems of intact rock and rock mass have been developed and the overview of the classification systems is given in [
2].
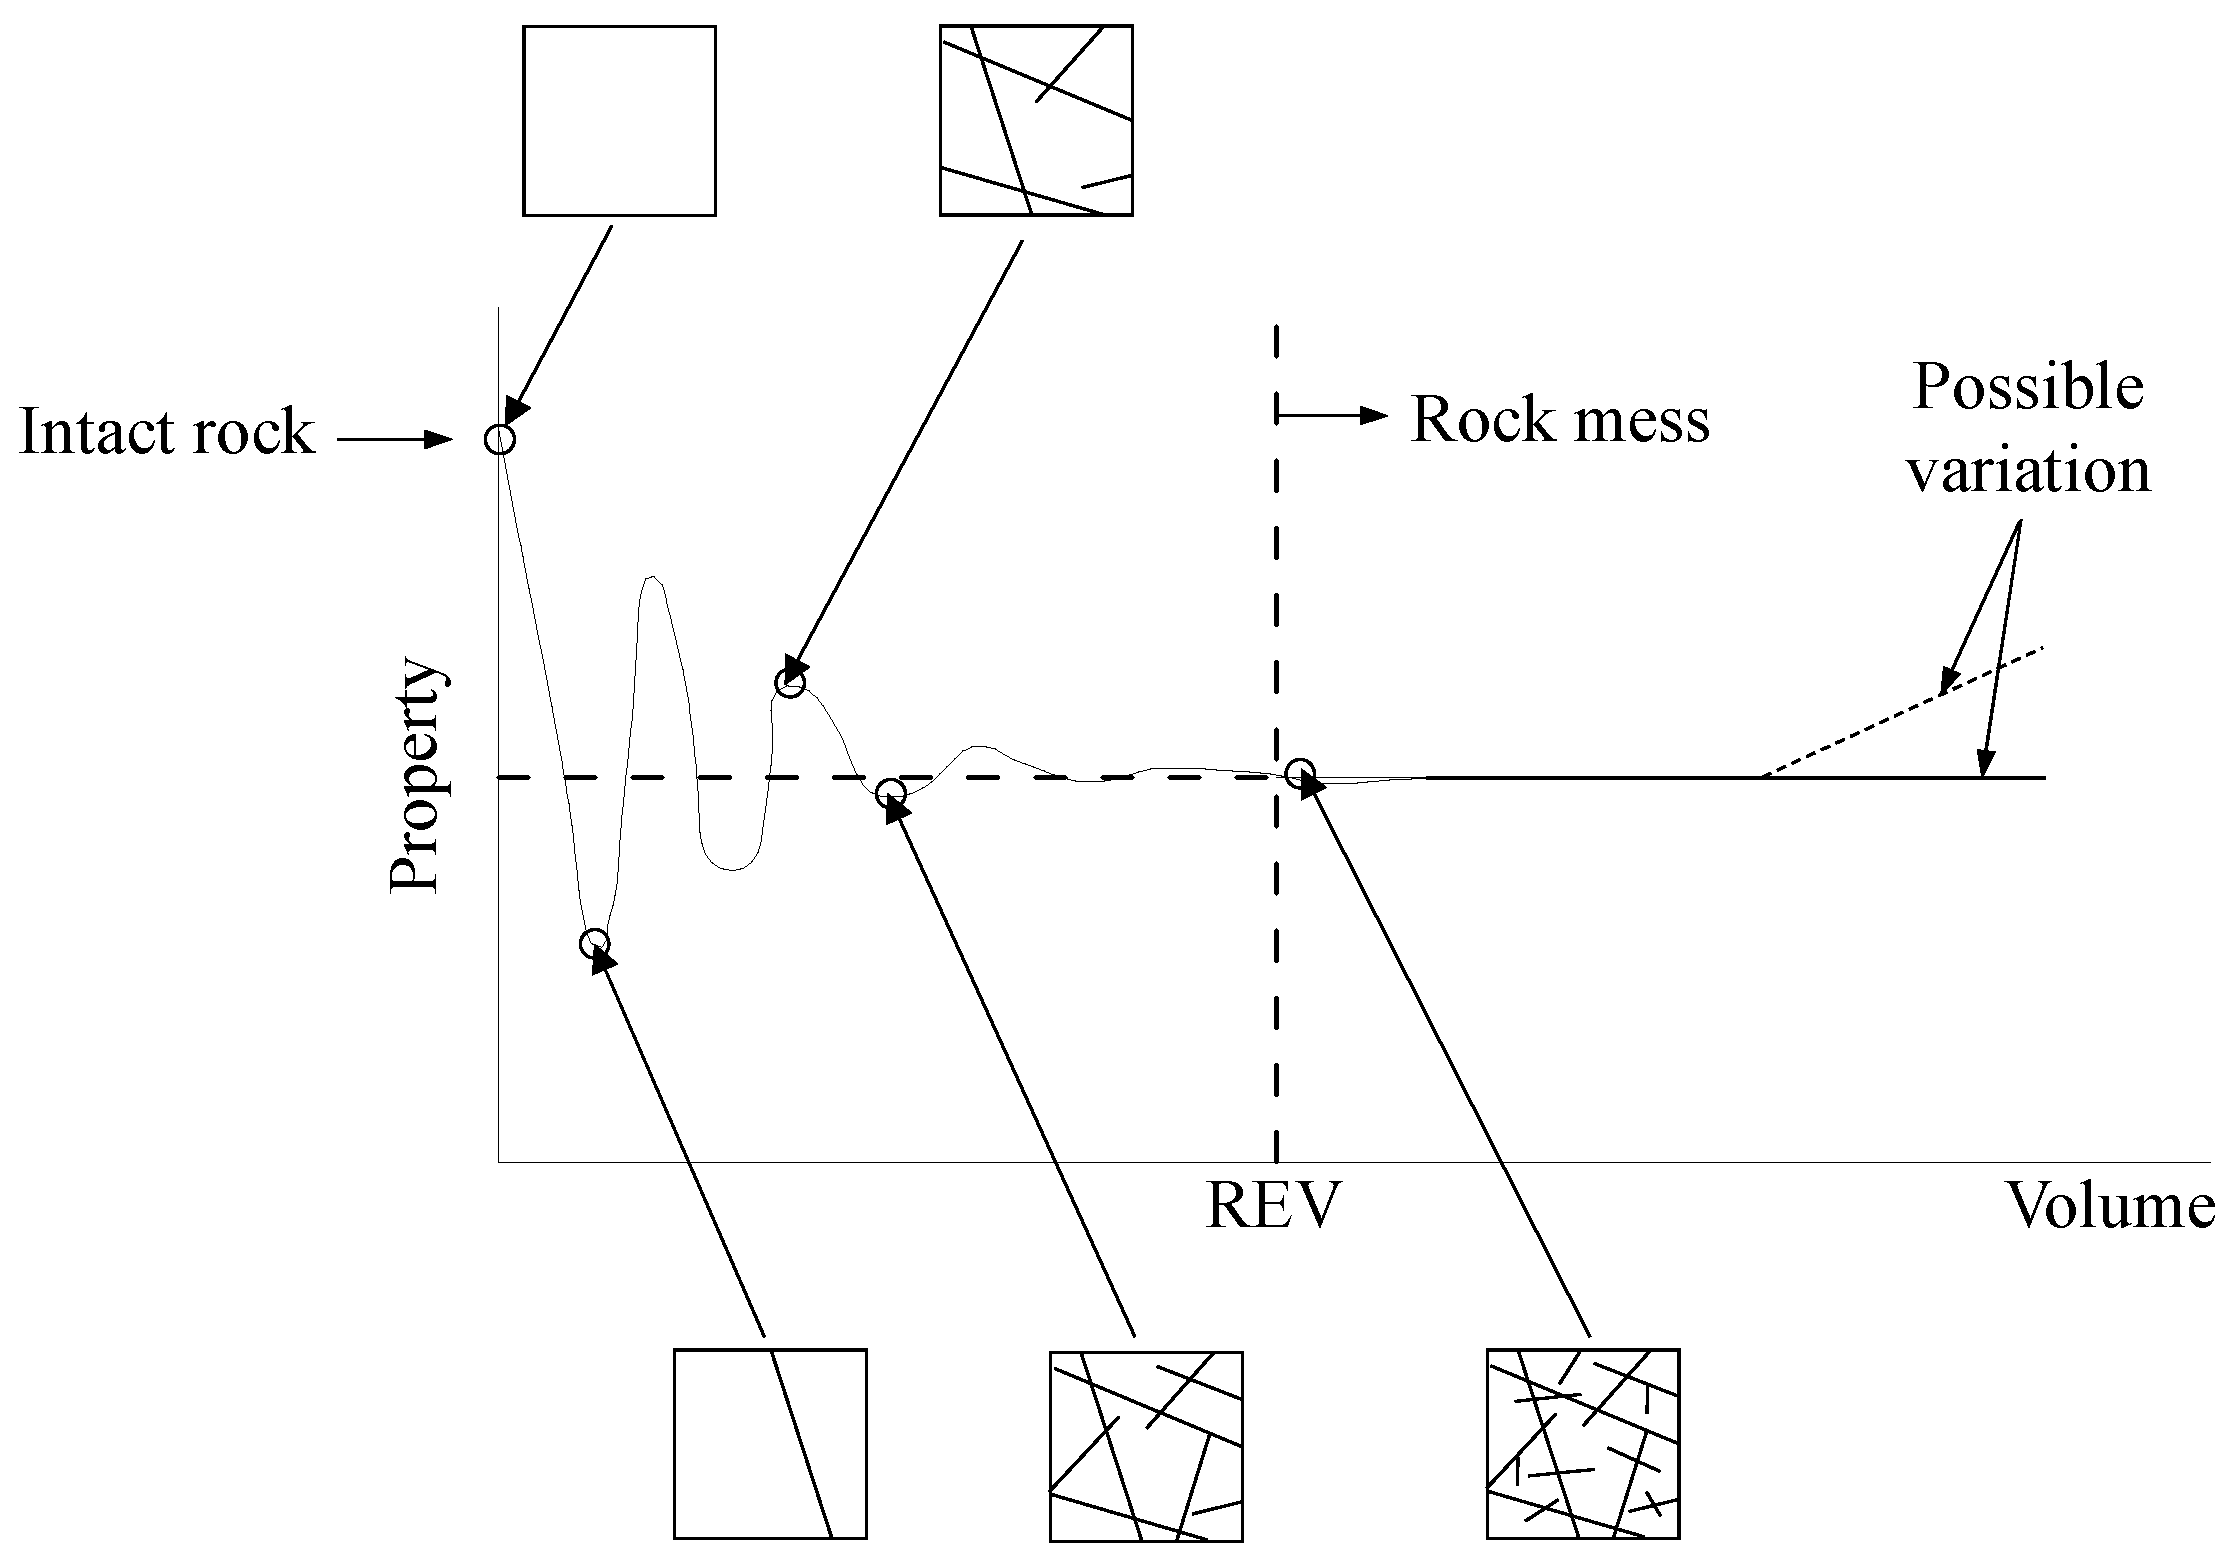
As shown in
Figure 1, the properties of the rock mass are significantly dependent on the problem domain, When the domain enlarges to a certain volume, called representative elementary volume (REV), the rock properties will reach a steady magnitude [
3]. In other words, the rock properties become constant at some REV if the discontinuity existence is statistically homogeneous in the domain considered. The rock properties may further oscillations in the trace if the discontinuity existence is heterogeneous. Thus, numerical stress analysis consists of discontinuous method for sub-REV scale and continuum method for large volume of rock mass.
In engineering practice, it is necessary to place footings so close to each other or to build them adjacent to another structures. Especially, multiple equally spaced footings are encountered in the form of railway sleepers and grillage foundations [
4,
5,
6]. From the available literature for a group of multiple footings, it is revealed that the ultimate bearing capacity of interfering footings is always greater than that of single isolated footings due to the overlapping of their failure surface. The different investigations were based on small scale model test [
7,
8], field plate load test [
9], stress characteristic method [
7], finite element method [
10,
11], lower bound limit analysis [
12], and upper bound limit analysis [
13,
14].
All existing studies mentioned above are concerned with multiple strip footings on soils following Mohr–Coulomb failure criterion. However, these solutions have some limitations in determining the bearing capacity of rock masses with joints and fractures. Additionally, the linear Mohr–Coulomb failure criterion may not capture the nonlinear failure behavior of rock mass [
15,
16]. Alternatively, a non-linear failure criterion proposed by Hoek and Brown [
17] is considered for the ultimate bearing capacity of footings over rock mass, although only limited studies on the interfering effect of rock footings were reported. Javid et al. [
18] estimated the bearing capacity of two closely spaced strip footings using the distinct element method. More recently, Shamloo and Imani [
19] evaluated the bearing capacity of two neighboring strip footings based on the upper bound limit analysis.
In this study, the vertical bearing capacity of a group of multiple strip footings, identically spaced and equally loaded to failure simultaneously, is computed with the finite element limit analysis. The modified Hoek–Brown non-linear failure criterion is used for intact rock or heavily jointed rock mass. The obtained results are compared with the existing solutions and the bearing capacity calculations are presented as a function of spacing between the footings, rock mass properties, footing roughness, and surface surcharge. Collapse mechanisms of rock mass under multiple closely spaced footings are broadly discussed.
2. Background
The numerical methods commonly used for predicting the response of rock mass are presented in
Figure 2. The method selection depends on system geometry and problem domain. The numerical analysis consists of discontinuous method for sub-REV scale and continuum method for large volume of rock mass.
To estimate the non-linear strength envelope of intact rock and jointed rock masses, the original Hoek–Brown (HB) failure criterion was proposed in 1980 and has been subsequently updated. The last version, used here, is expressed as [
20]
where
σci is the uniaxial compressive strength of the intact rock.
σ1 and
σ3 are the major and minor principal stresses, respectively, which are considered as positive when tensile in nature.
mb,
s, and
a are the dimensionless material parameters, defined as
where
mi is the value of
mb for intact rock. The value of
mi is related to the minerology and texture of the intact rock, varying from 4 for very fine weak rock (e.g., claystone) to 33 for coarse igneous light-colored rocks (e.g., granite). The value of
mi can be obtained from experiments.
GSI is the geological strength index which features the quality of the rock mass [
21]. The value of
GSI ranges from about 10 for extremely poor rock masses to 100 for intact rock.
D is the disturbance factor which depends on the extent of weathering and blast damage of the rock mass. The value of
D varies from 0 for the undisturbed in situ rock masses to 1 form extremely disturbed rock masses. The modified HB criterion is applicable to intact rock or heavy jointed rock mass that can be considered is isotropic and homogeneous and therefore is proper to estimate the bearing capacity of surface footings on rock.
The ultimate bearing capacity of a strip footing subjected to vertical loading is expressed as
where
Nσ is the bearing capacity factor, which is related to the HB material parameters, namely,
mi,
GSI, and
D. However, the value of
σci is very little effect on the footing capacity [
16,
18].
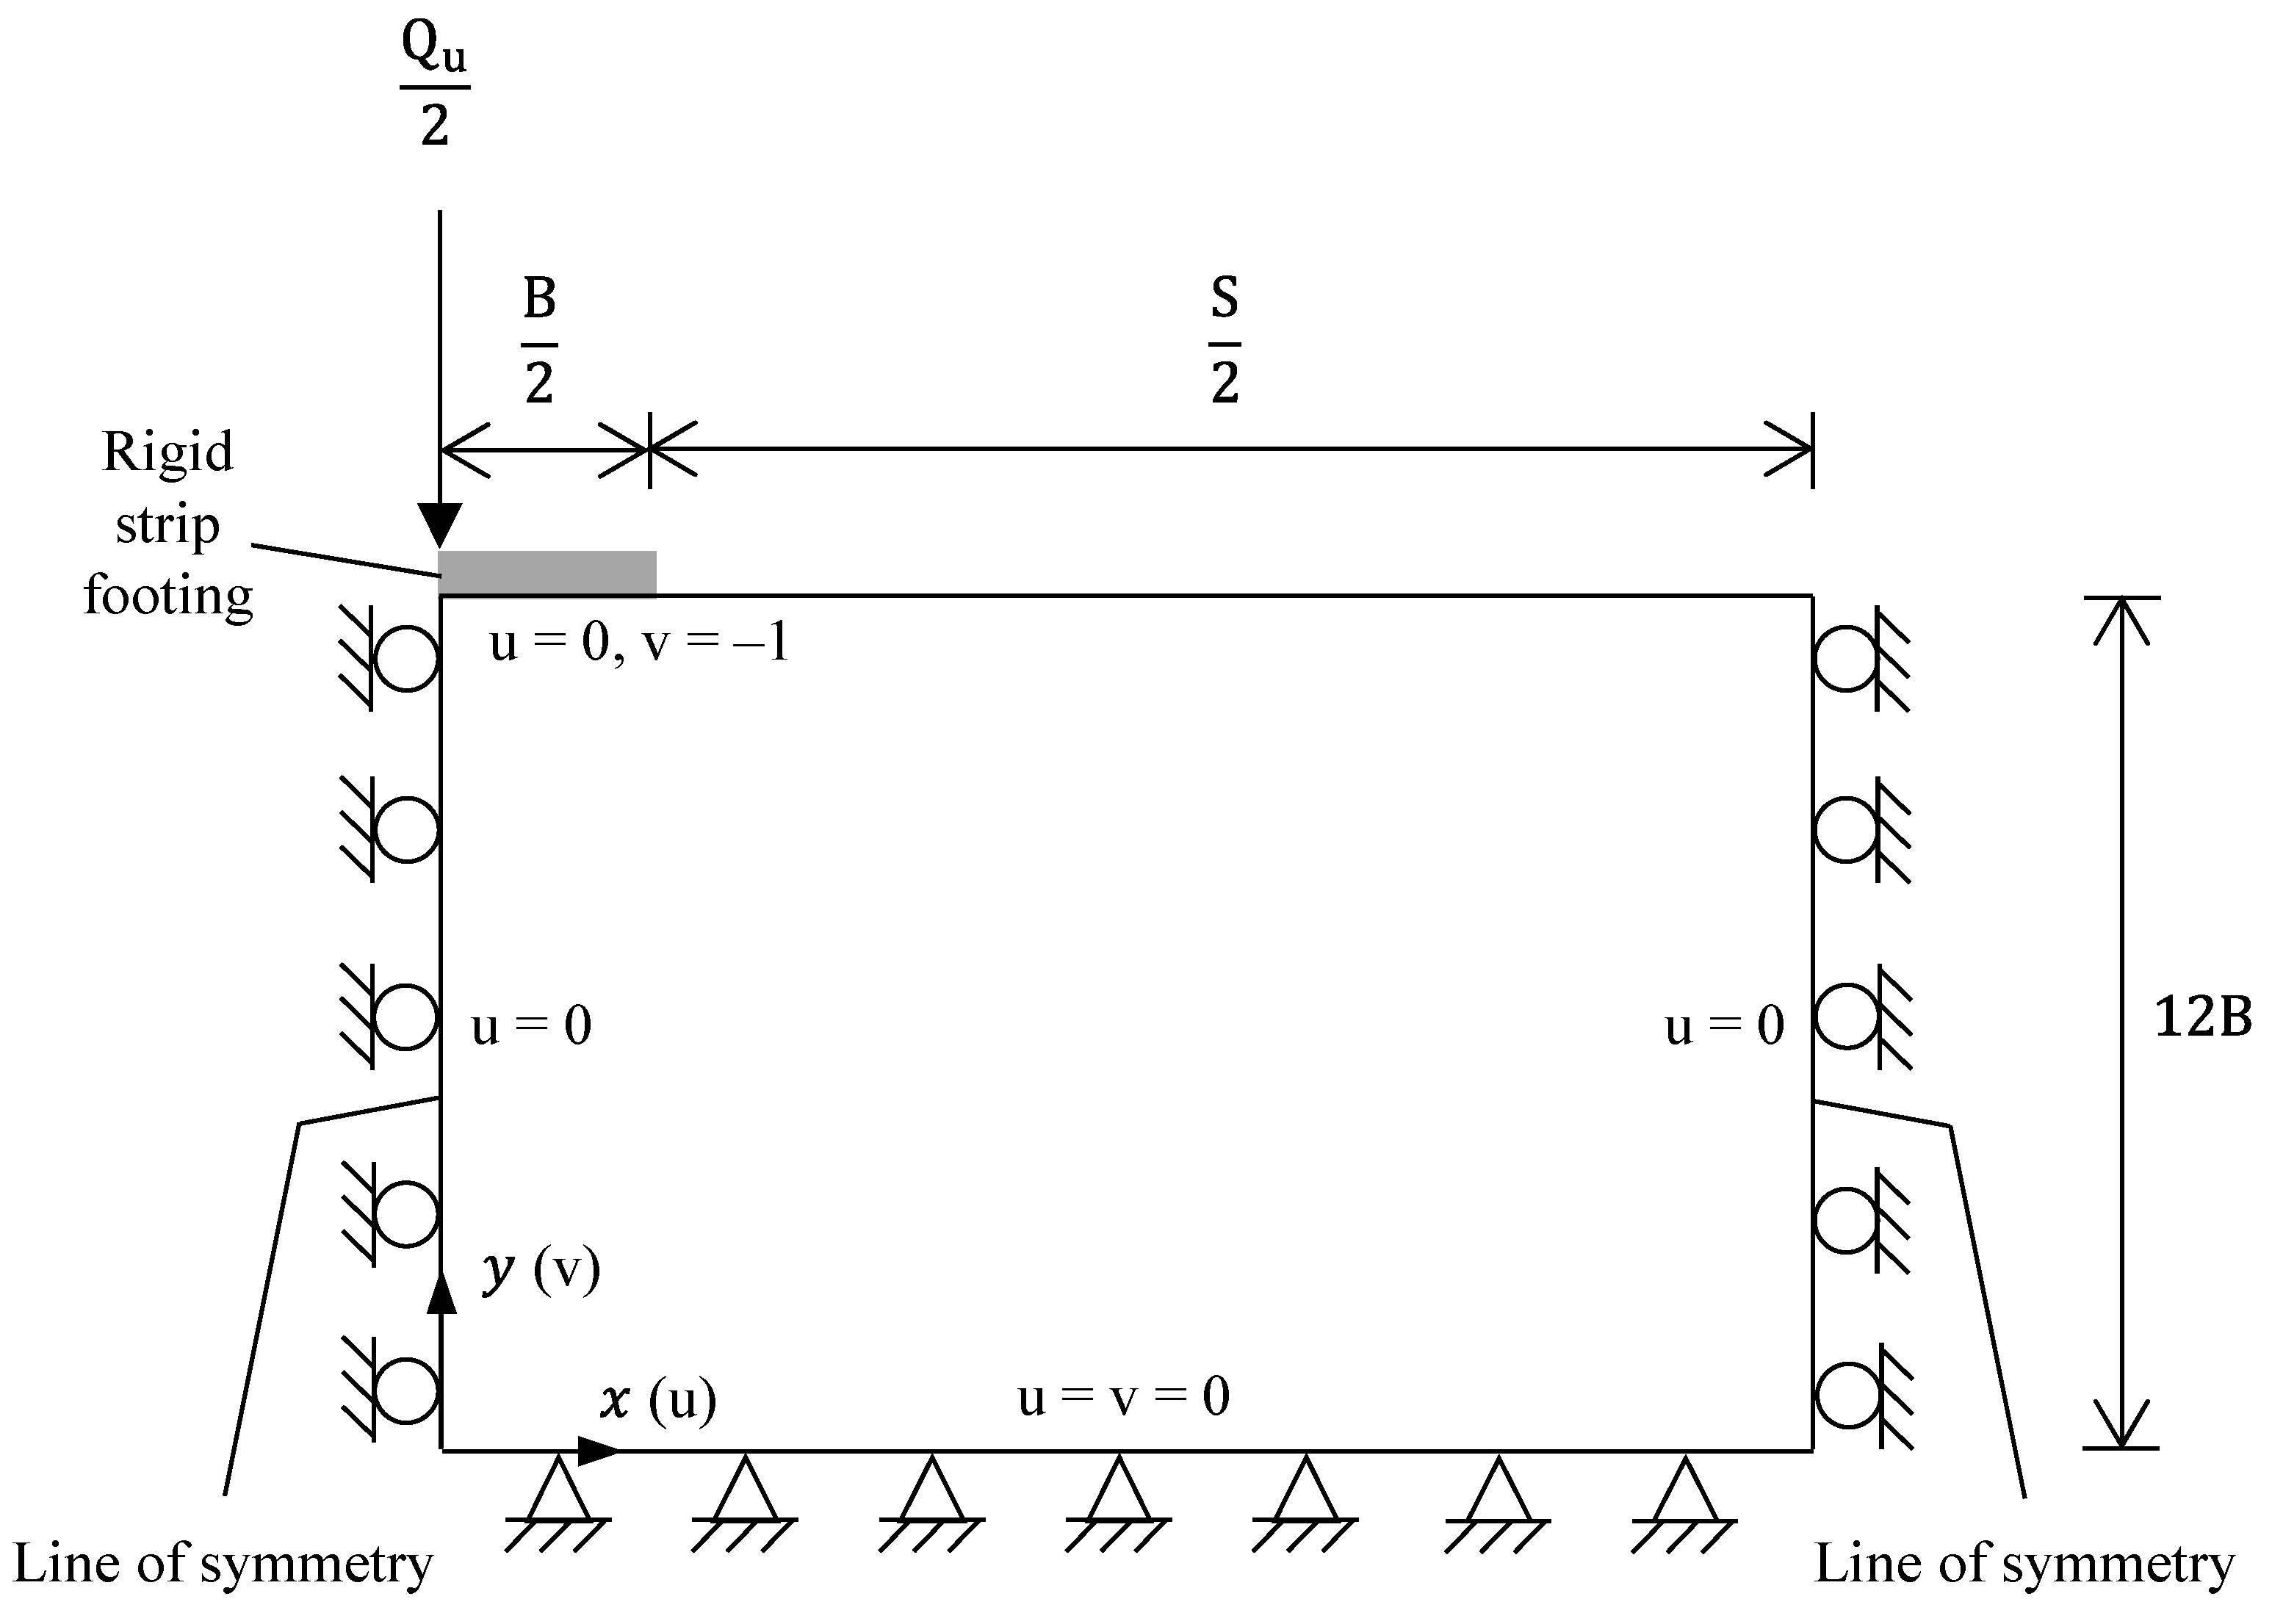
3. Problem Statement
Figure 3 illustrates the geometry and parameters of the rock-footing system considered. A number of multiple strip rigid footings rest upon a rock medium with horizontal ground surface. The footings are having width
B and are placed at equal clear spacing
S. The interfering effect of multiple footings is quantified by the adjacent spacing ratio
S/B, which ranges from 0.1 to 6. The base of the footing is considered as the perfectly smooth and perfectly rough providing upper and lower limits of capacity for multiple footings with given material properties. The rock mass obeys the Hoek–Brown failure criterion as a function of
σci,
mi,
GSI, and
D. The
σci value is kept equal to 20 MPa [
22] and the
mi values are taken as 7, 10, 15, 17, and 25 for five types of rocks [
23]. The values of
GSI and
D are within the range of 10 to 90 and 0 to 1, respectively. The rock mass has unit weight
γ, which is quantified by
σci/γB. The value of
σci/γB varies from 125 to ∞ that indicates the weightless rock mass [
24]. The ground is loaded with a uniform surcharge pressure
q and its effect is represented by
q/σci. The value of
q/σci ranges between 0 to 1, which cover most problems of practical interest [
25]. The vertical downward load is simultaneously applied to the center of each footing and all footings are collapsed exactly at the identical bearing load
Qu.
To compare the bearing capacity of an interfering strip footing with that of a single isolated footing, the efficiency factor
ξ is introduced:
where
Nσ(mul) is the bearing capacity factor for an interfering footing in a group of multiple footings and
Nσ(iso) is the bearing capacity factor for single isolated footing with the same width of the interfering footing. From this, the ultimate bearing capacity of an intervening footing is determined using the following expression:
5. Results and Comparison
To validate the results of the present study on strip footings for weightless rock mass with different
GSI and
mi, a comparison of bearing capacity
Nσ0 obtained in this study with the analyses of Serrano et al. [
28] using the slip line method, Merifield et al. [
24] using the finite element limit analysis, Chakraborty and Kumar [
29] using lower bound finite element limit analysis, and Keshavarz and Kumar [
25] using the stress characteristics method. A comparative representation of all these values is given in
Table 1. The present results remain very close to the existing solutions. Additionally, the values of
Nσ0 for isolated foundation with rough and smooth roughness for
GSI = 50,
mi = 20 are determined to be 1.722 and 1.709, respectively, which are 1.2% and 3.0% in error compared with those from Keshavarz and Kumar [
25].
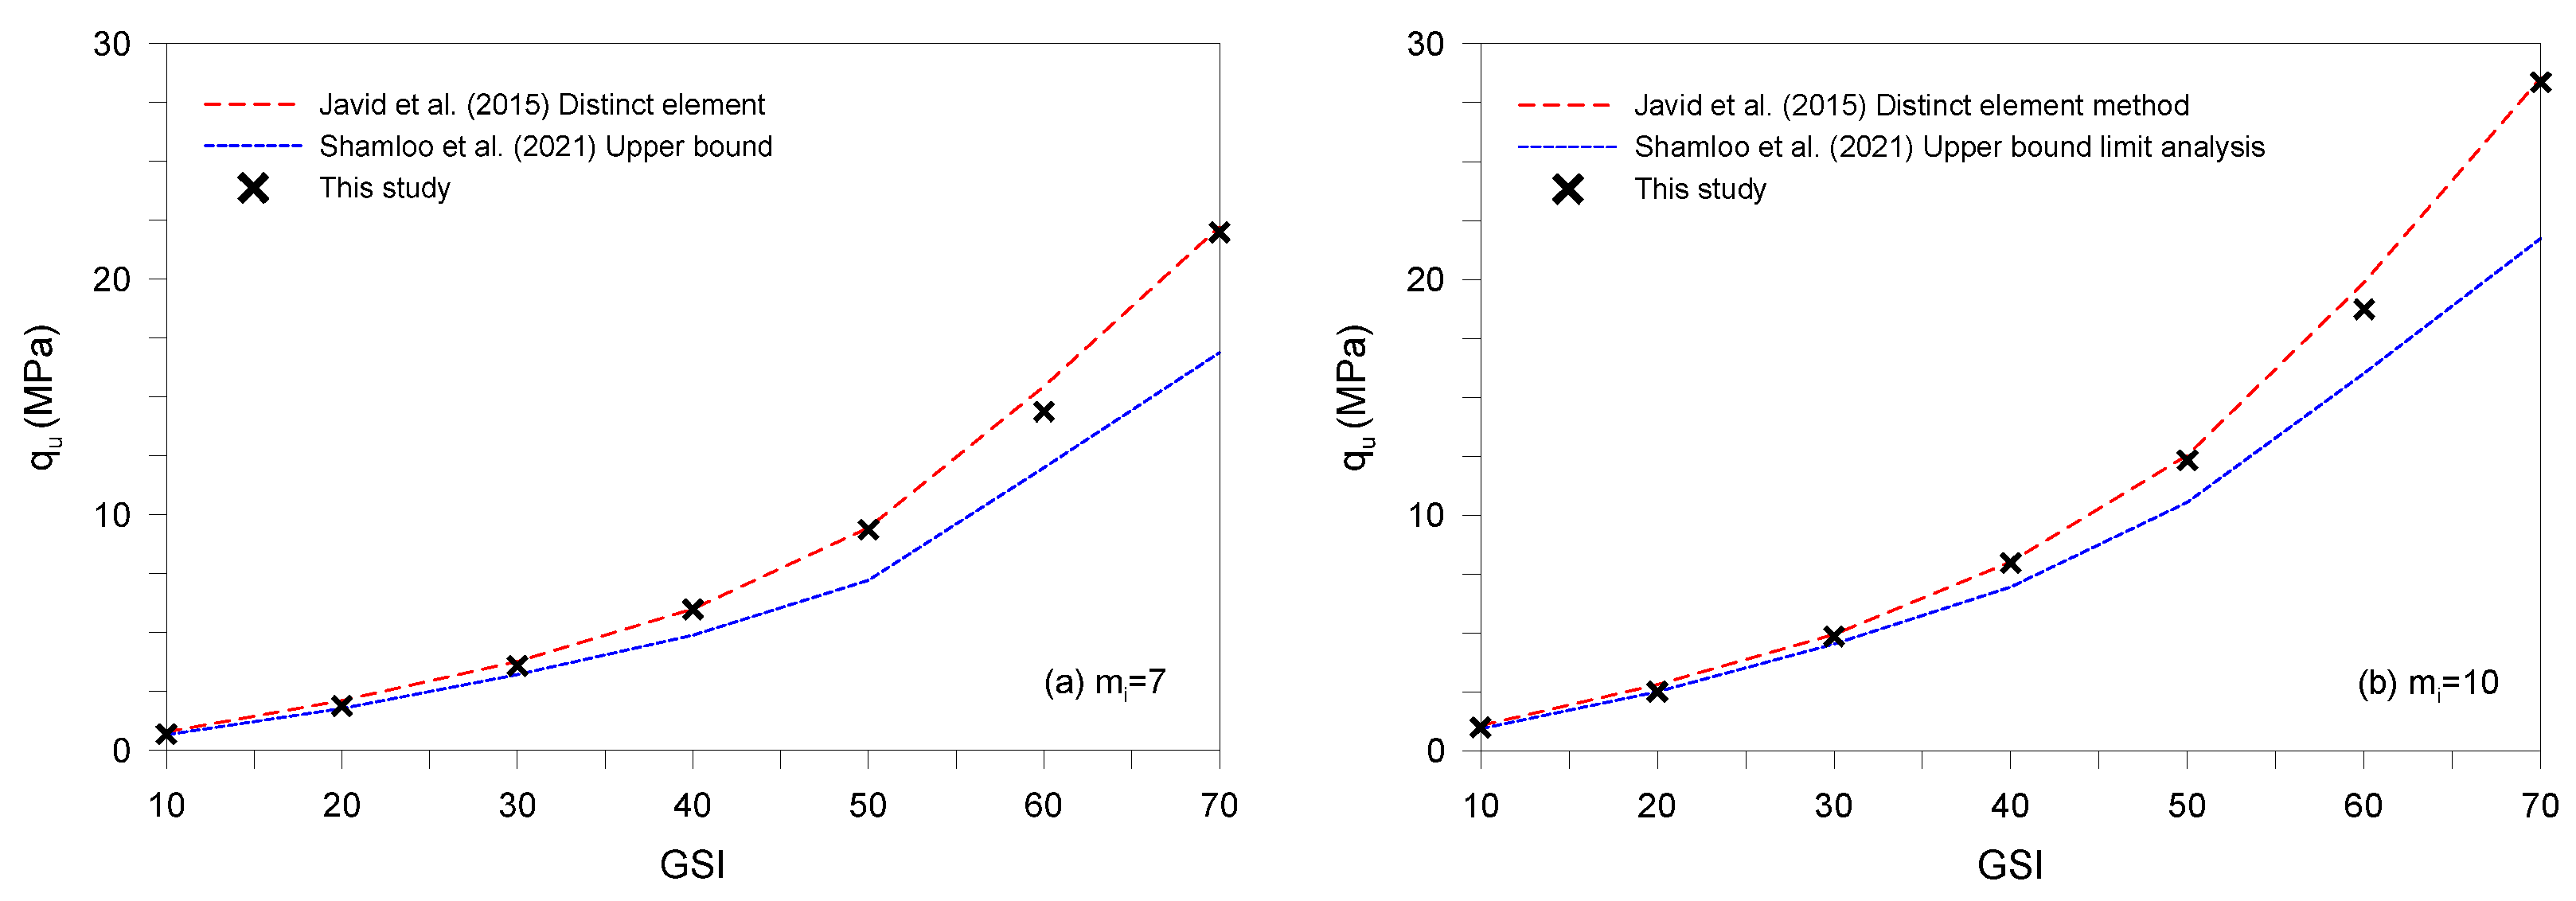
Figure 5 provides the obtained
qu value of two interfering footings (
S/B = 1) on rock mass, together with other numerical analysis for same footing and soil conditions. The
Figure 5 shows the variation of
qu values with
GSI for the case of
mi = 7 and 10. As shown in the
Figure 5, the results of the numerical analysis are very close to those obtained with distinct element method of Javid et al. [
18]. However, the value of
qu in upper bound solutions by Shamloo et al. [
19] was under-predicted, and the difference increases with increasing
GSI. Given that the result of present study is included in the result of Javid et al. [
15] and Shamloo et al. [
19], it can be seen that agree well with previous study.
The variation of the efficiency factors
ξ for different combinations of
S/B and
GSI is shown in
Figure 6 for the case of
D = 0,
σci/γB = infinite,
q/σci = 0 and
mi = 7, 15, and 25.
Figure 6 shows that the
ξ value decreases as
S/B increases. It is important to note that the lower
GSI, the greater
ξ value, however the greater rate at which
ξ values decreases as adjacent space increases. Furthermore, as
mi increases, the
ξ values according to each
GSI increases in the same adjacent space. All
ξ values decrease as
S/B increases, reached value of 1. In the case of
ξ = 1, the bearing capacity of multiple footing has no adjacent distance influence, meaning that the behavior of isolated footing is performed. In the present study, the space ratio corresponding to
ξ = 1 is defined as
Smax/B.
Smax/B varies depending on
GSI and
mi, respectively, and details of this are illustrated in
Figure 7.
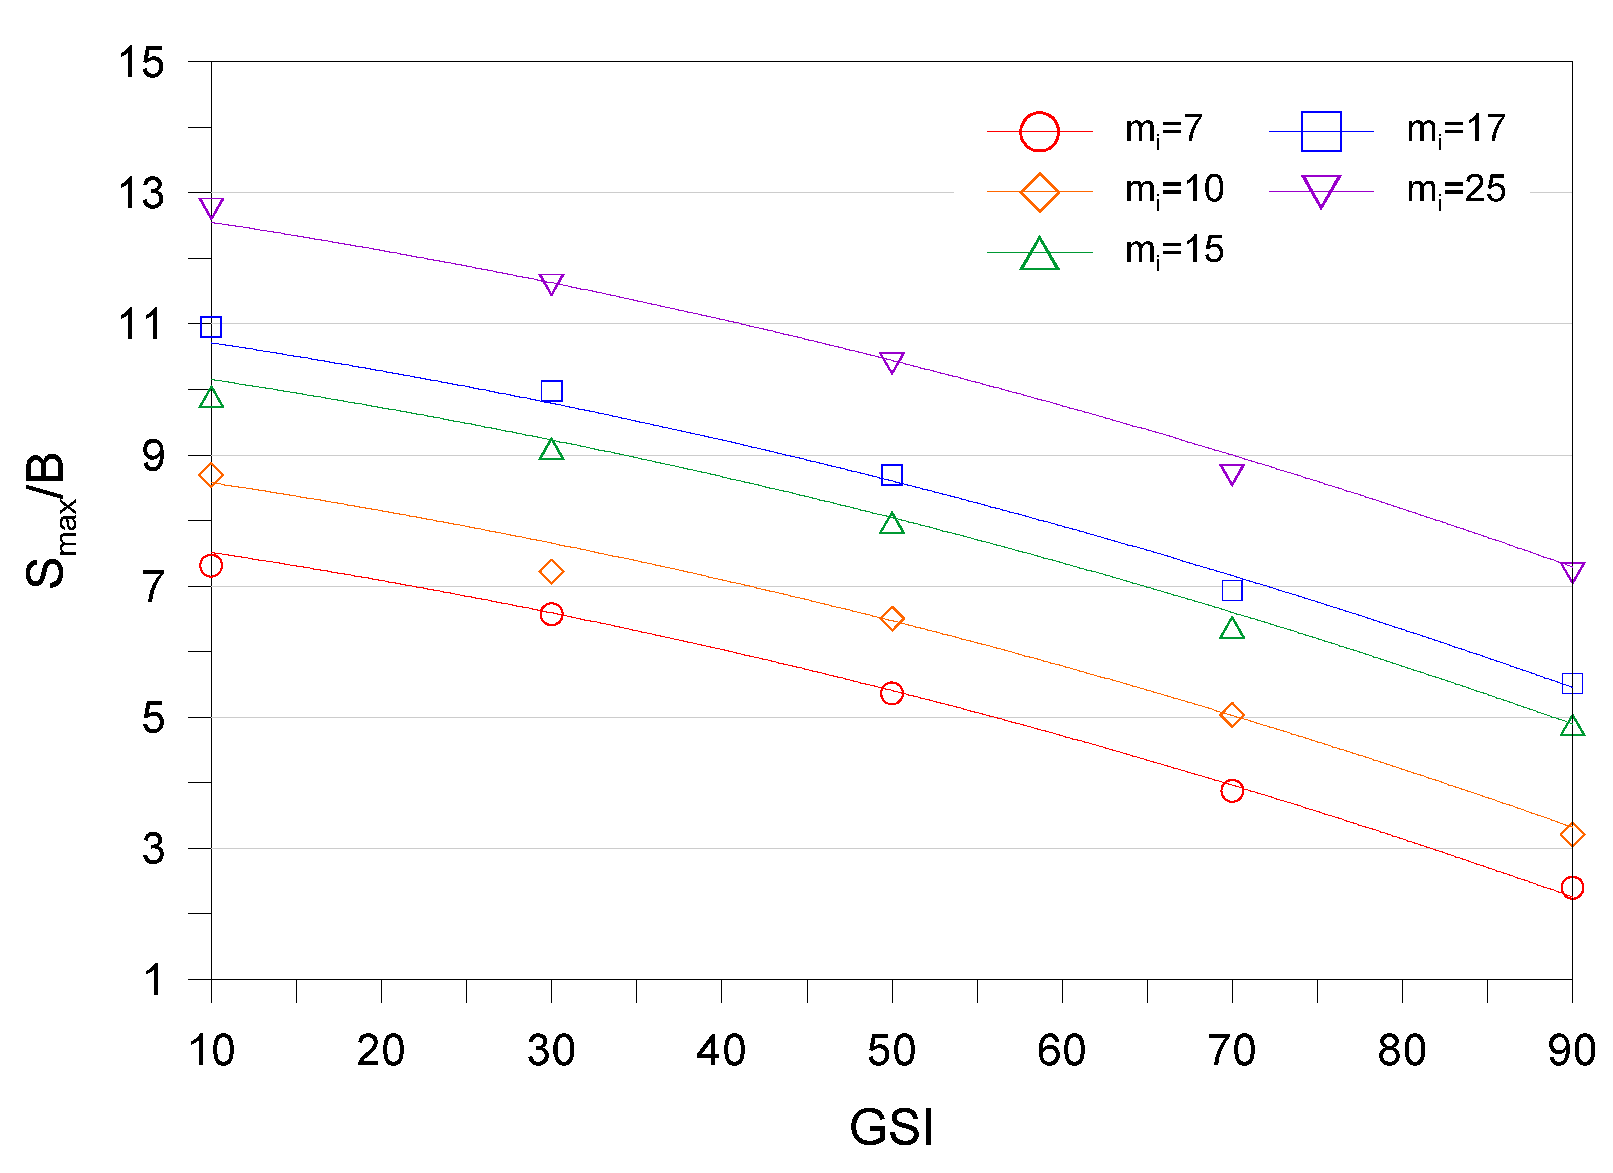
The variation of
Smax/B for different combinations
GSI and
mi is shown in
Figure 7 for the case of
D = 0,
σci/γB = infinite,
q/σci = 0.
Figure 7 shows that
Smax/B decreases with increasing
GSI, but for a given
GSI,
Smax/B increases with increasing
mi. It should be noted that the maximum value of
Smax/B is 12.76 for
GSI = 10,
mi = 25 and the minimum value of
Smax/B is 2.41 for
GSI = 90,
mi = 7. In addition, the
Smax/B can be described as exponential function of
GSI. Expressed in terms of the
Smax/B:
where
a is the coefficients for the parameters of
mi. As stated in Equation (9), it is obvious that the value of
Smax/B for multiple footings on rock mass drops towards decreases with increasing of
GSI. It is worth noting that these coefficients are accurate for interpolation only, and should not be used for extrapolation beyond 10 <
GSI < 90. The relations of a with
mi have the form of (R
2 = 0.991 and R
2 = 0.997, respectively)
The proposed expressions of Equations (9) and (10) provide a satisfactory fit and good prediction.
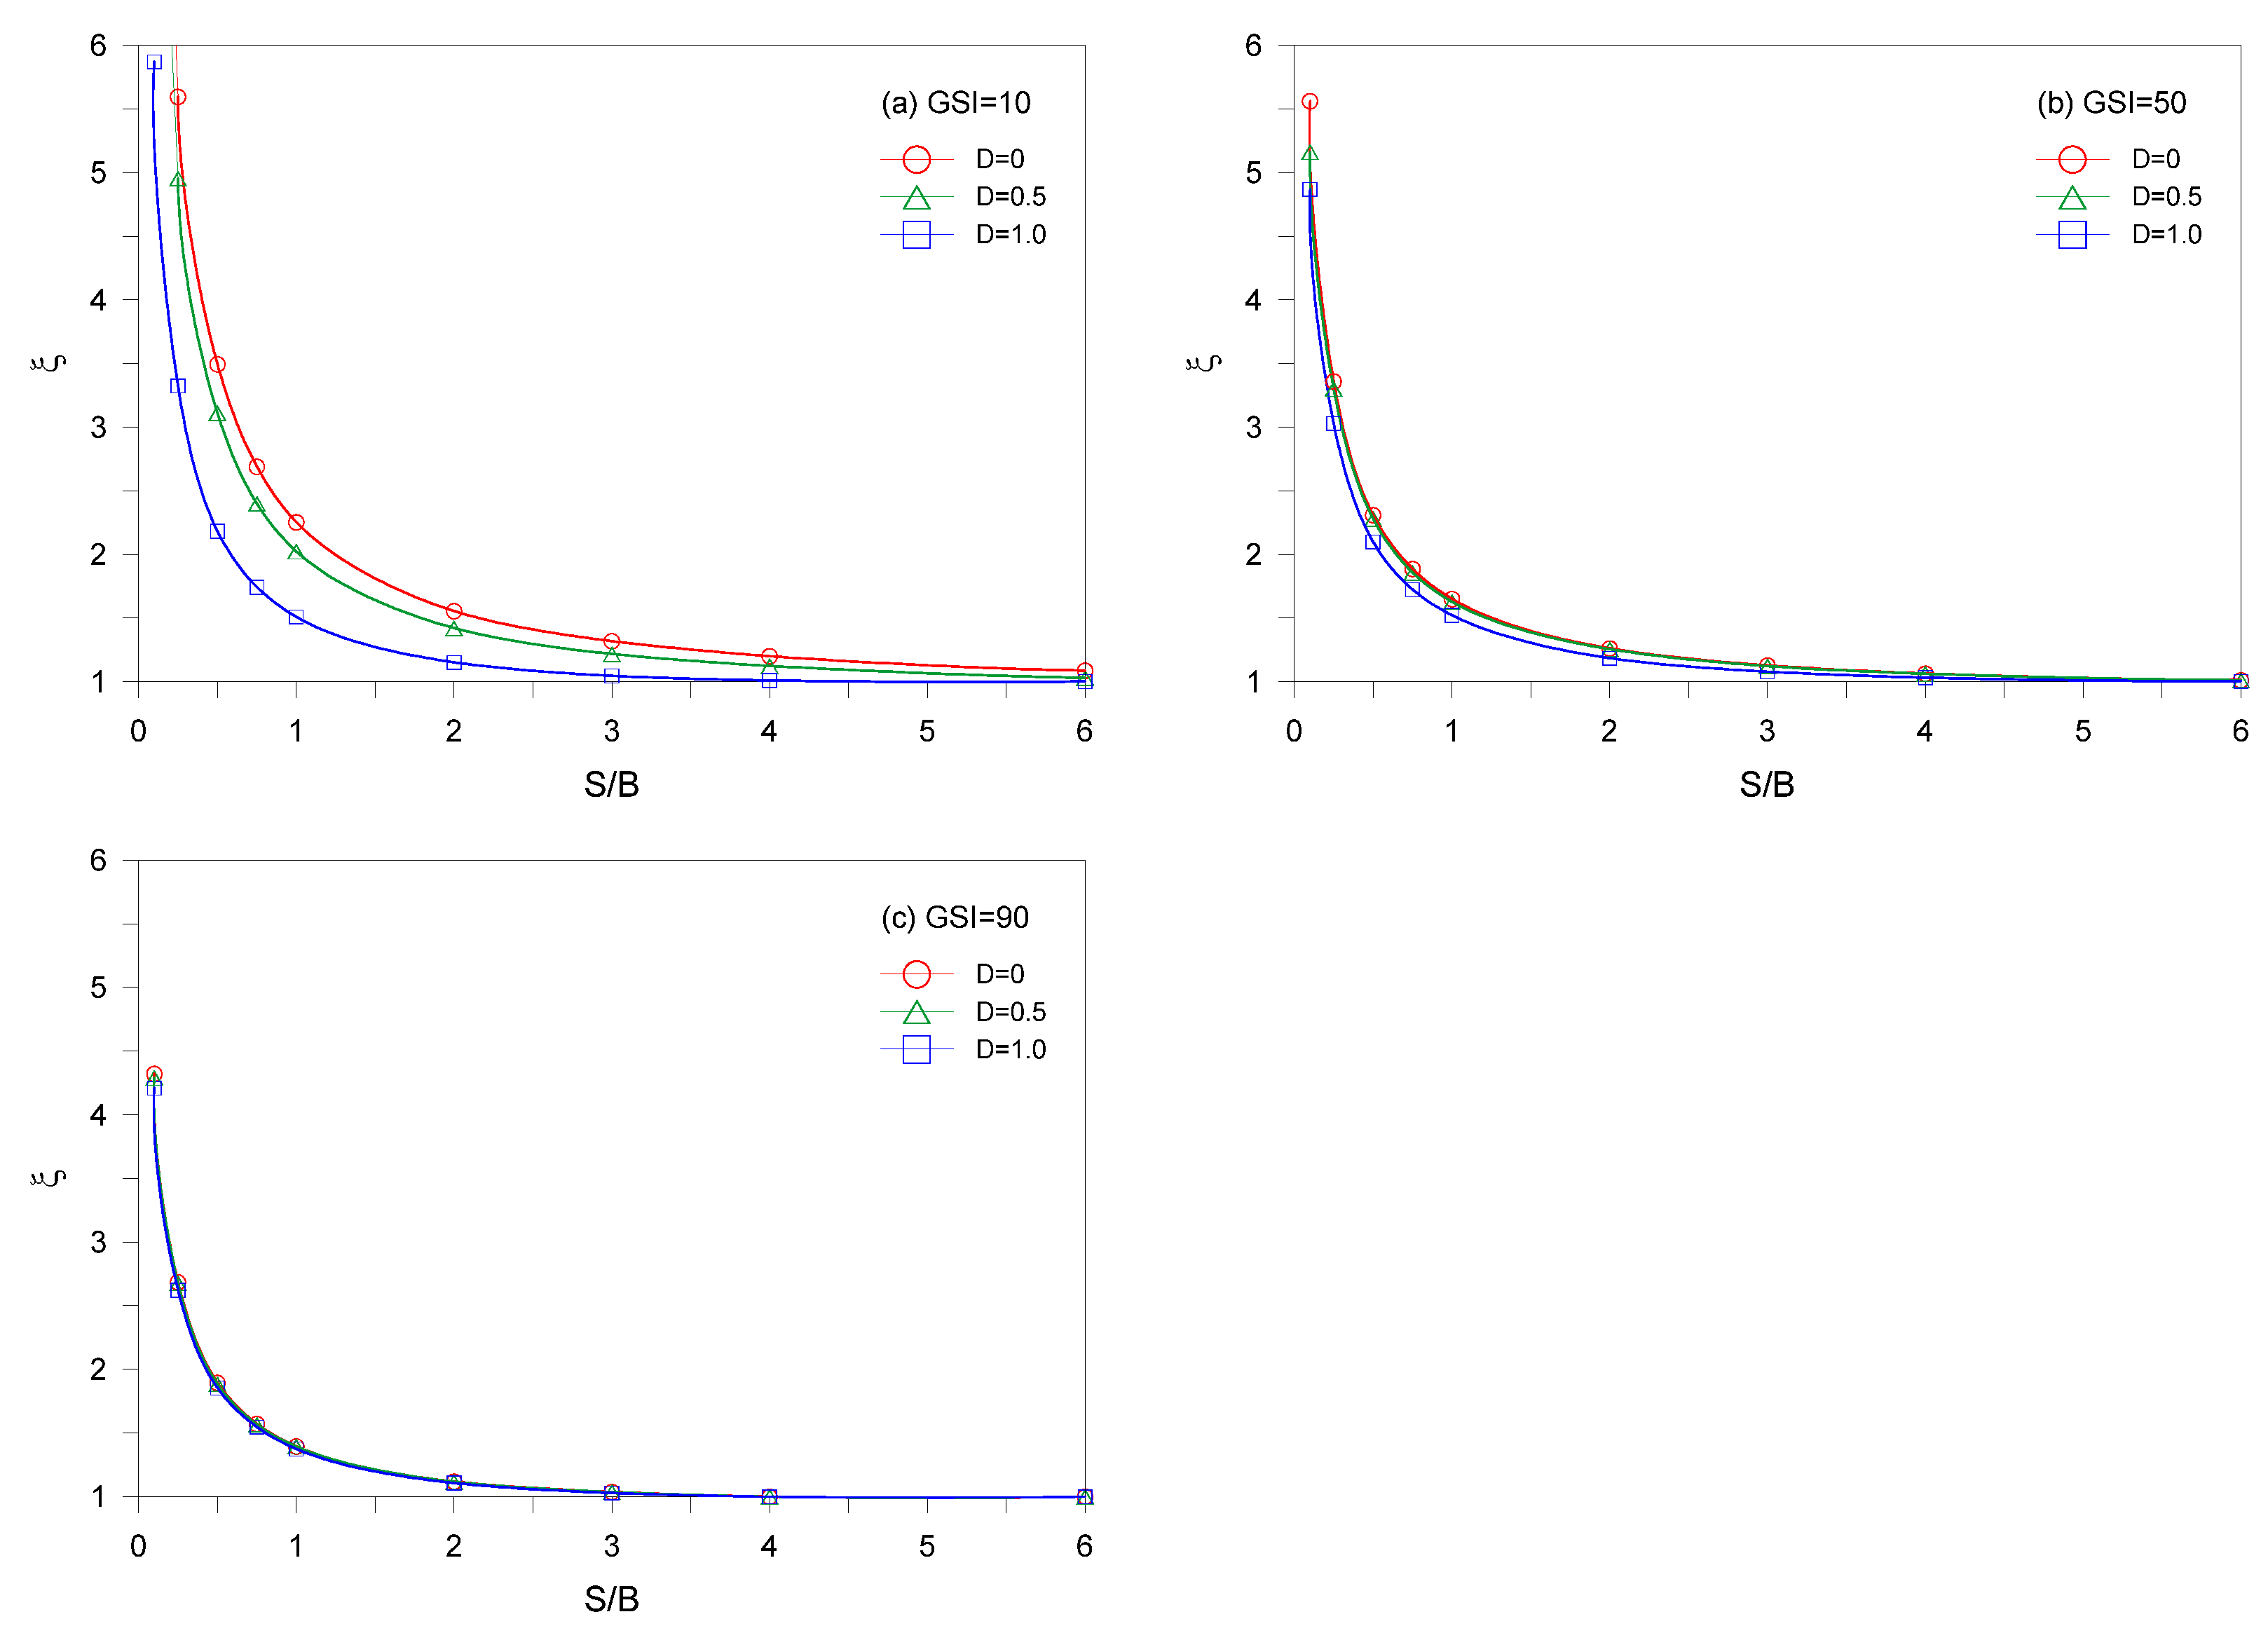
The variation of the efficiency factor
ξ for different combinations of
S/B and
D is shown in
Figure 8 for the case of
mi = 10,
σci/γB = infinite,
q/σci = 0 and
GSI = 10, 50, and 90.
Figure 8 shows that the value of
ξ decreases as
D increases. It can also be seen that as
GSI increases, the value of
ξ decreases and this trend increases as
D decreases.
The variation of the efficiency factors
ξ for different combinations of
S/B and
σci/γB is shown in
Figure 9 for the case of
mi = 10,
D = 0,
q/σci = 0 and
GSI = 10, 50, and 90.
Figure 9 shows that the greater
σci/γB for a given value of
σci/γB, the greater the value of
ξ. However, it should be noted that the smaller
GSI, the significant the difference in the value of
ξ according to
σci/γB, but the greater
GSI, the smaller the difference in the value of
ξ. This indicated that for the case of
GSI = 90, the unit weight of rock mass has little effect on the value of
ξ of multiple footings. In addition, as
GSI decreases, the efficiency factor of
σci/γB except 125 decreases. For the case of
σci/γB = 125, the value of
ξ increases slightly when
GSI increases from 10 to 50, but when it is greater than 50, the value of
ξ decreases.
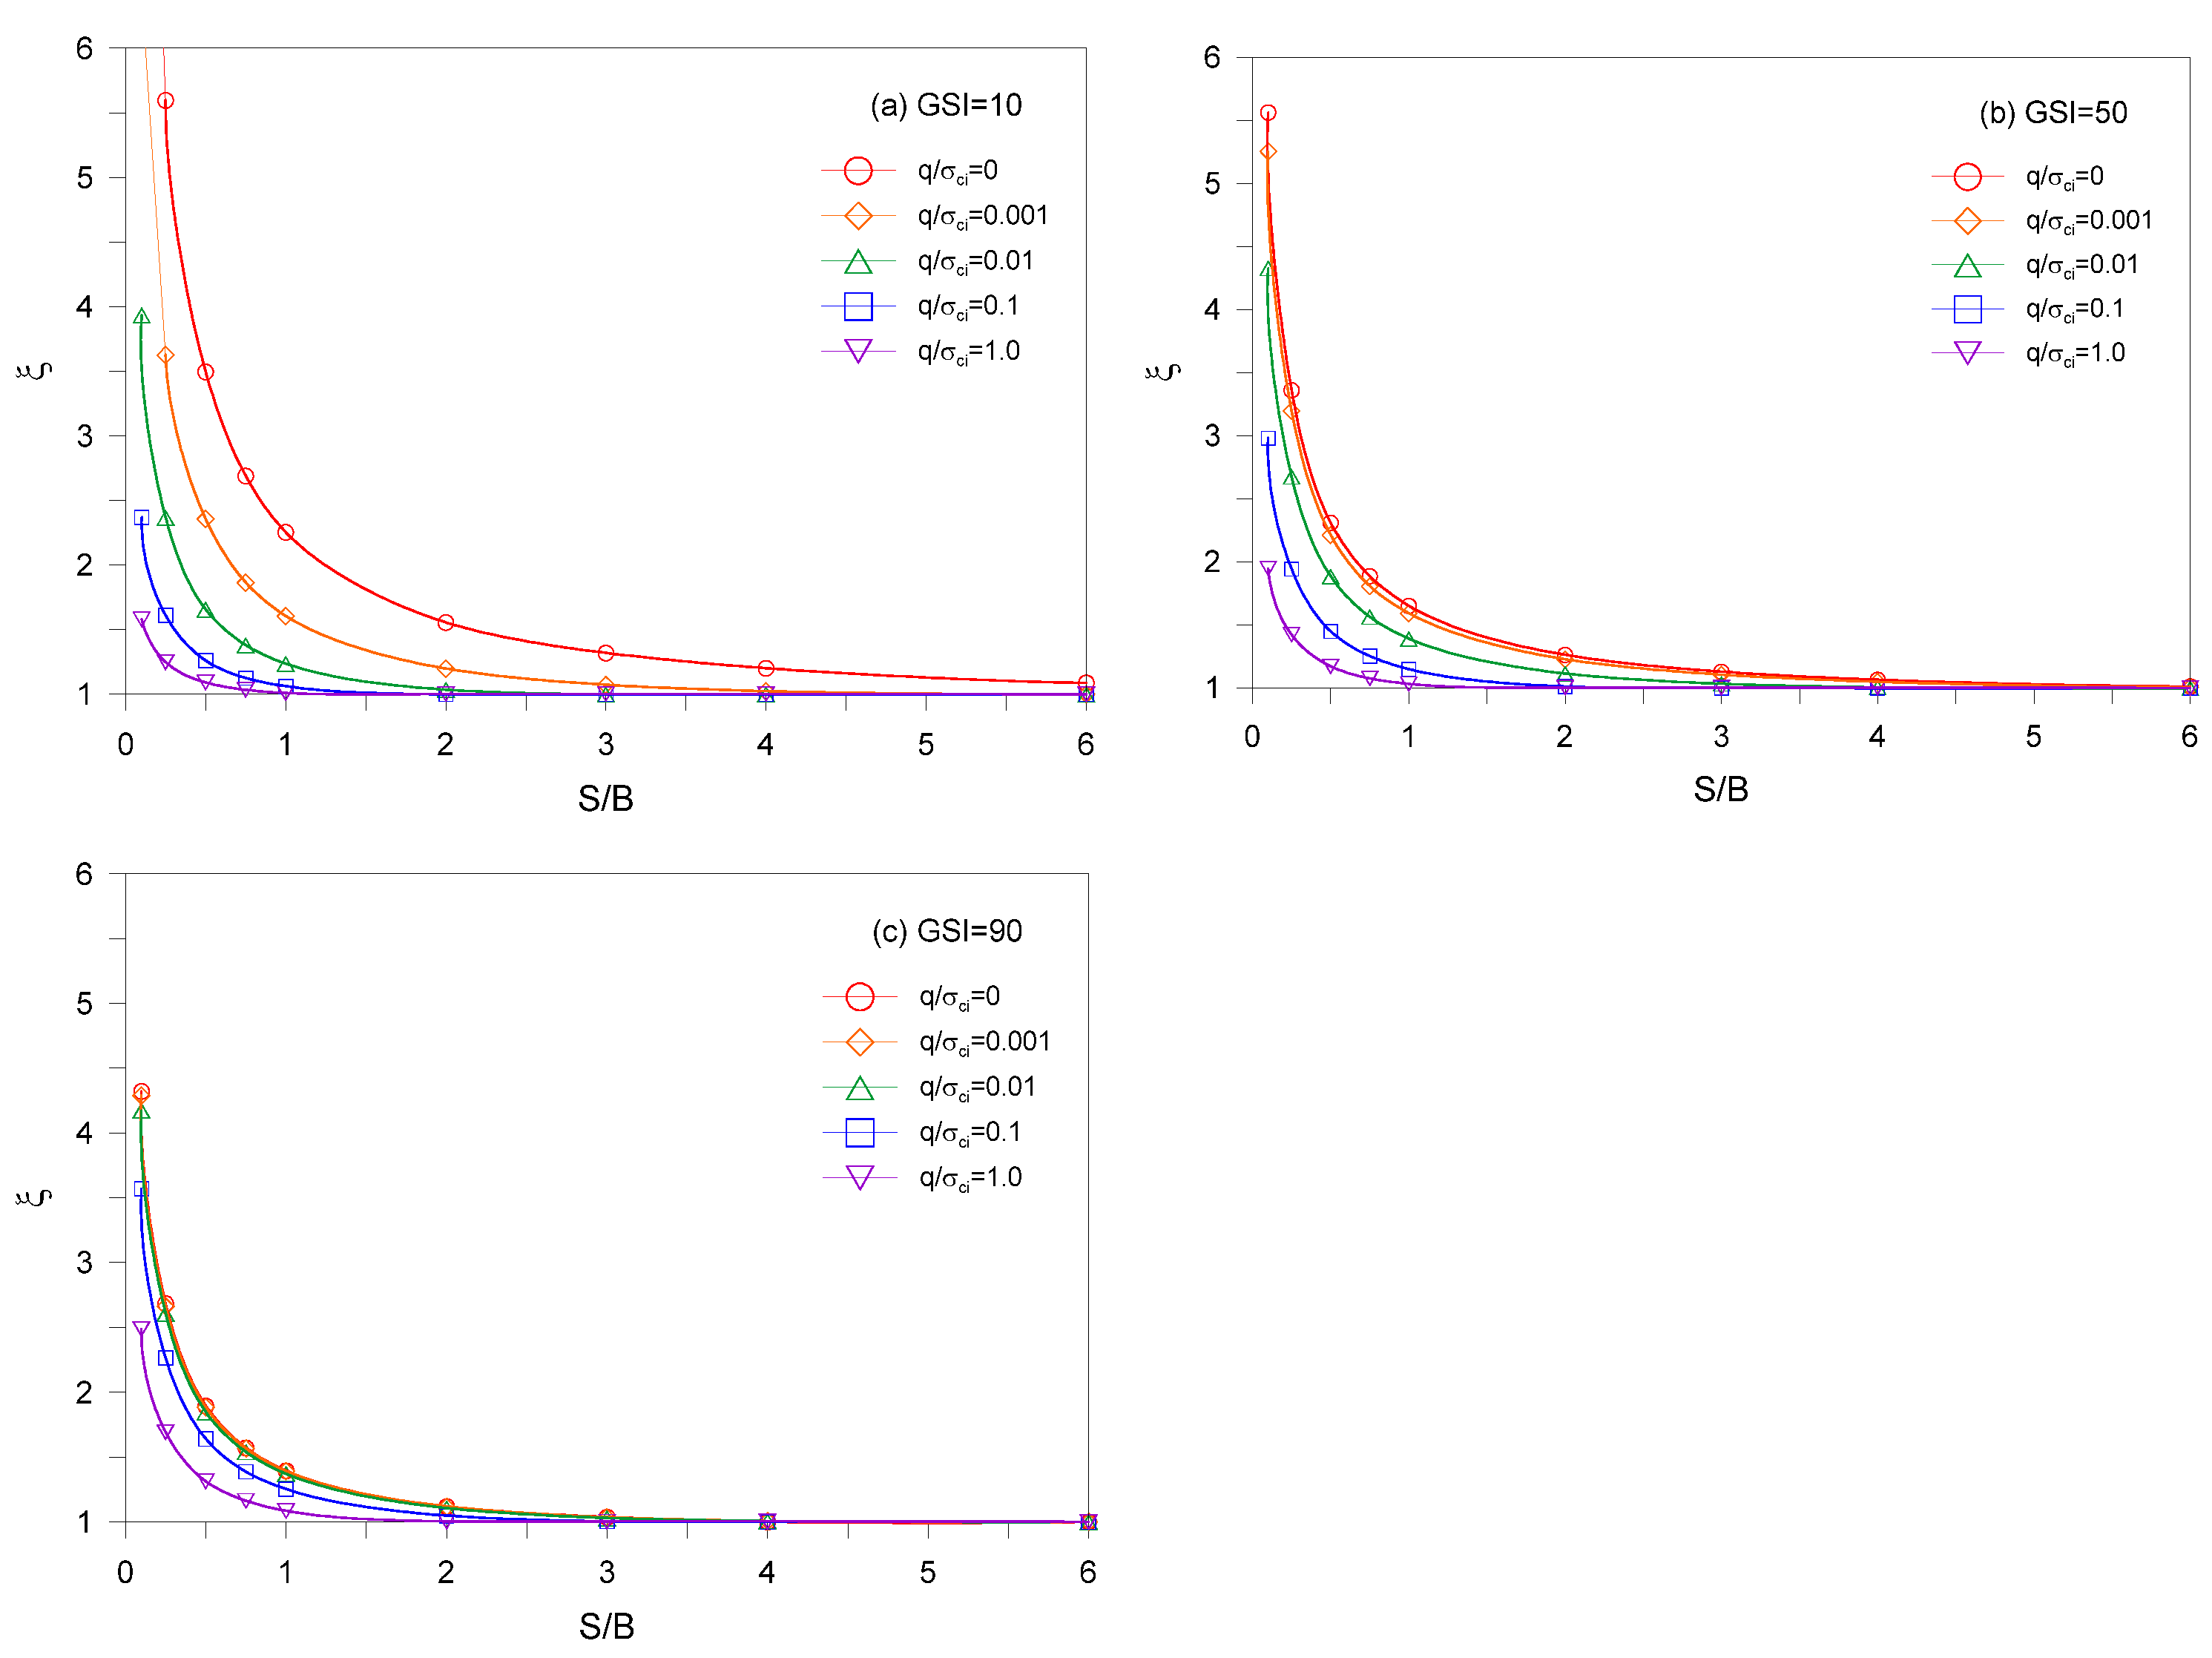
The variation of the efficiency factor
ξ for different combinations of
S/B and
q/σci is shown in
Figure 10 for the case of
mi = 10,
D = 0,
σci/γB = infinite and
GSI = 10, 50, and 90.
Figure 10 shows that decrease in the value of
ξ when surcharges are applied. Given that the value of
ξ resulting from the applied of surcharge is smaller than the value of
ξ in the without of surcharge, this implies that surcharge reduces the value of
ξ. As the
GSI increases, the
ξ values continues to decrease for
q/σci = 0 and 0.001, while for
q/σci = 0.1 and 1.0, the
ξ values increases. For the case of
q/σci = 0.01, the
ξ values varies slightly with the change in
GSI. It should also be noted that increasing
GSI from 10 to 50 increases
ξ values, however decreasing
ξ value from 50 to 90.
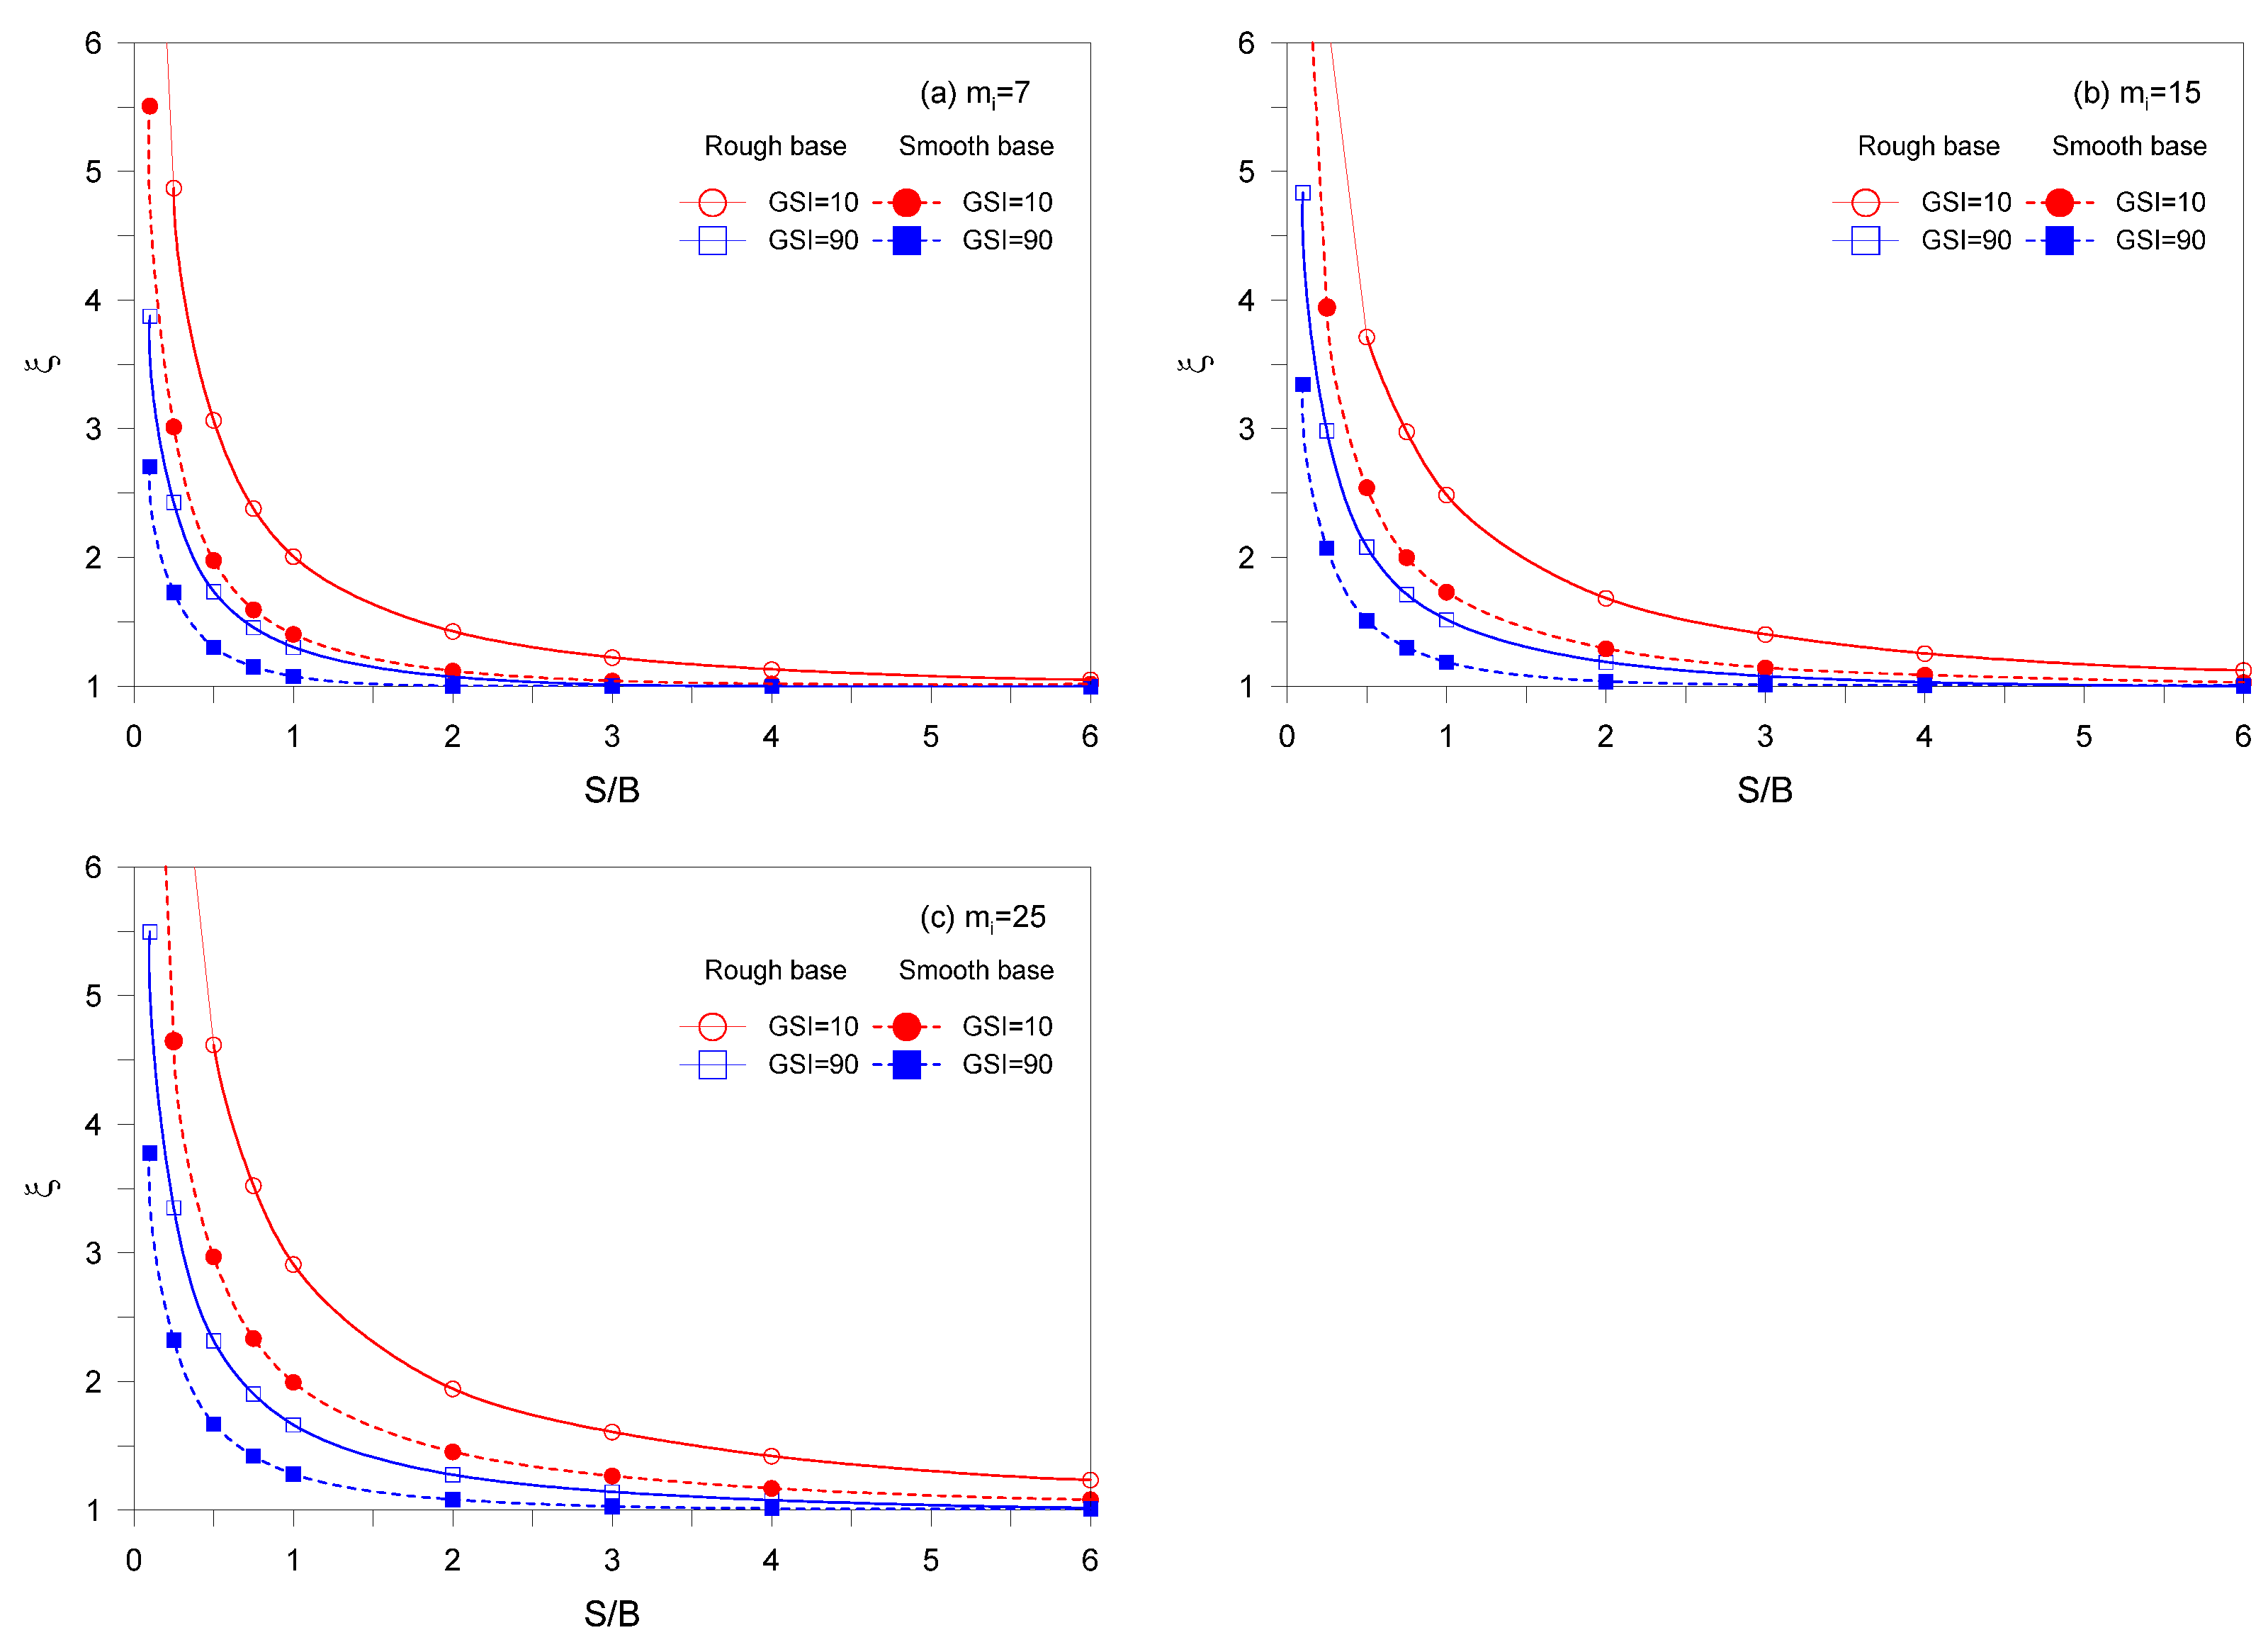
The variation of the efficiency factor
ξ for different combinations of
S/B and
GSI = 10, 90 for smooth and rough bases footings are shown in
Figure 11 for the case of
D = 0,
σci/γB = infinite,
q/σci = 0 and
mi = 7, 15, and 25.
Figure 11 shows that rough bases always maintain
ξ value greater than smooth bases. It can be seen that the varies in
ξ values due to roughness becomes smaller as
GSI increases and vice versa increases as
mi increases. However, it should be noted that
mi has a small effect on the
ξ value and that
GSI is significant.
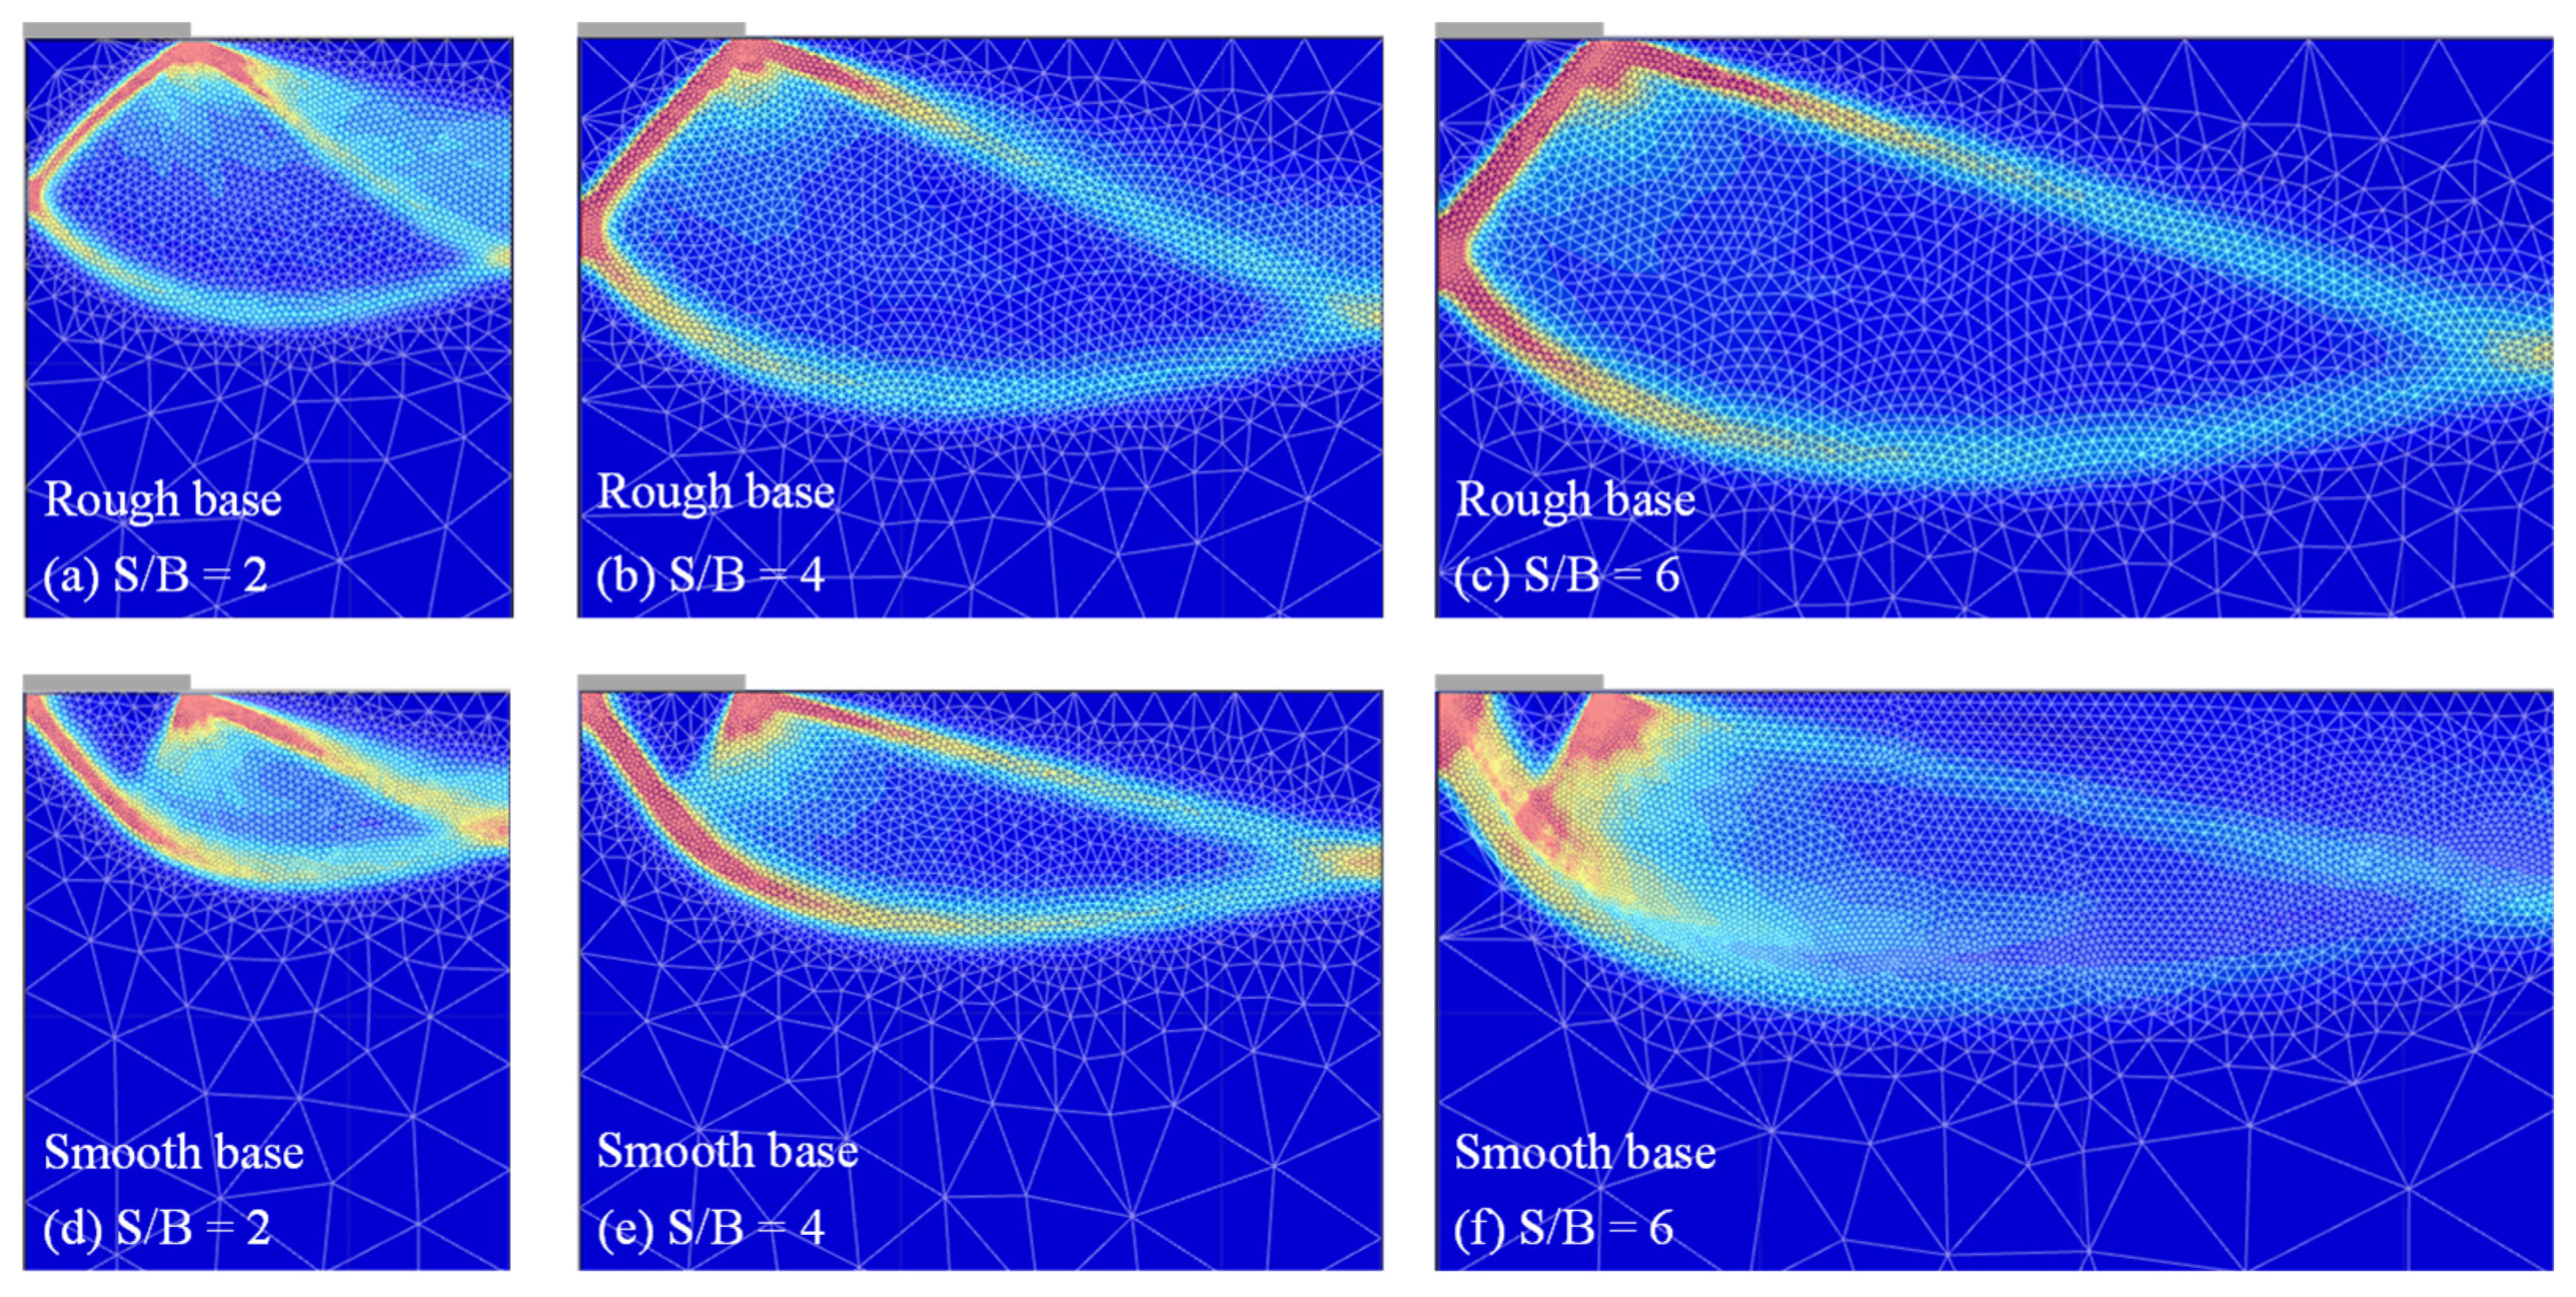
Figure 12 shows the failure mechanism of the smooth and rough base multiple footings on the rock masses for different adjacent spacing ratios
S/B with
GSI = 30,
mi = 10,
D = 0,
σci/γB = infinite and
q/σci = 0.
Figure 12 shows that unlike isolated footings, the failure mechanism of multiple footings does not lead to surface and is formed below the surface. As the
S/B of multiple footing increases, the failure mechanism of multiple footings changes close to failure mechanism of independent foundations. In the case of
S/B = 2, adjacent effects are expressed between the spacing of multiple footing and failure mechanisms are formed at relatively low depths. These effects can be seen to become decreases as
S/B increases. For rough bases, failure mechanism of multiple footing is formed in the external rather than center of the footing. On the other hand, for smooth bases, it should be noted that failure mechanism of multiple footings is formed simultaneously at center of footing and at the external.


