Article

The Impact of Perceived Interactivity and Intrinsic Value on Users’ Continuance Intention in Using Mobile Augmented Reality Virtual Shoe-Try-On Function

1
School of Design, Jiangnan University, Wuxi 214122, China
2
Department of Culture and Arts Management, Honam University, Gwangju 62399, Korea
*
Author to whom correspondence should be addressed.
Systems 2022, 10(1), 3; https://doi.org/10.3390/systems10010003
Submission received: 7 November 2021 / Revised: 12 December 2021 / Accepted: 23 December 2021 / Published: 27 December 2021
(This article belongs to the Special Issue Multimedia Systems)

Abstract

:
In response to the rapid growth of mobile Internet, online retailers have created better shopping experiences through new technologies. These shopping experiences are the product of the new interaction methods created by new technologies and the intrinsic value of these technologies. To achieve a better understanding of how new technologies improve consumers’ intention to use them continuously, this study established a theoretical model of how consumers’ perceived interactivity affects intrinsic value, which then affects attitudes, and ultimately contributes to the theoretical model. Within the perceived interactivity construct, there is perceived control, personalization and responsiveness, and as part of the intrinsic value construct there is playfulness and aesthetics. The results demonstrate that intrinsic value and perceived interactivity play important roles in predicting consumers’ attitudes and continuance intention to use new technologies applied to mobile e-commerce, but do not include perceived control in perceived interactivity. To highlight the results of this study, relevant enterprises or practitioners may use the findings to design or improve the features of existing mobile apps to provide better services and experiences to consumers based on their internal perceptions.

1. Introduction

1.1. Background

Smartphones and other mobile technologies have become an integral part of modern consumption and life [1], forcing a transformation of the global business environment, especially the global retail industry [2]. As technology advances, Augmented Reality (AR) technologies have become more advanced and widespread, enhancing the functionality and user experience of smartphones. AR is being implemented in many industries including education, engineering, healthcare, military, real estate, retail, and the game industry. The retail and the game industry are two of the earliest industries to extensively utilize AR technology [3].
Successful implementation of AR has drawn the attention of Chinese e-commerce companies. Since 2016, major e-commerce platforms have announced or released plans and progress associated with Augmented Reality (AR/VR) [4]. Meanwhile, the Chinese government’s Opinions on Promoting Innovation and Transformation of Physical Retailing supports the integration, innovation, and transformation of online and offline shopping [5]. Despite the improvement in purchasing power in the huge Chinese market, many consumers in second- and third-tier cities have difficulty shopping in physical stores for the latest products. Moreover, due to repeated epidemic waves in the last two years [6], online shopping has become increasingly popular. In order to compensate for the insufficiency of the online shopping experience, e-commerce companies are utilizing AR technology to address the problems of online shopping that are difficult to experience directly, such as the inability to try on clothing and shoes [4]. Moreover, due to the novelty and sense of the AR technology, many consumers are attracted to it, for example to the virtual shoe test function on the POIZON APP. Therefore, after the initial excitement, e-commerce companies should take the time to explore the inner relationship between AR functions and consumers, while at the same time shifting their focus to the perceivable value of consumers’ behavior to increase service and attract consumers better.
Therefore, this study takes POIZON APP as the research carrier and takes consumers who have used POIZON APP virtual shoes as the research object to explore how perceived interactivity and intrinsic value affect users’ continuation of the use of mobile augmented reality (MAR) of the virtual shoe-try-on function and their correlations. Then improvement suggestions are proposed to the government, industry, consumers, and other relevant units for reference.

1.2. Significance of Research

AR is a medium that uses machine vision and 3D graphics to cover virtual elements in the physical environment [7]. It is capable of providing a different interactive environment than the one established by the previous virtual environment. With the background of a real-life scene, it can help consumers perform various functions and behaviors more directly. Meanwhile, the interaction between people and their phones and the outside world is also enhanced. Due to the rapid development of AR technology, it is also highly valued by practitioners and developers. It is considered vital to address the issue of how to attract consumers more effectively and develop AR functions and technologies that consumers prefer [8]. Recent studies explore a range of topics, including brand AR interaction [9], AR’s role in driving consumer decision-making [10], AR’s impact on reducing the return rate [11], and AR applications on shopping guides [12]. Research indicates that AR is capable of filling the information gap between online shopping consumers and products [13], and it has a significant positive effect on online shopping.
In comparison to ordinary AR, MAR has a low cost, a high degree of flexibility, and a high level of interactivity, and has been determined as the preferred platform for product information and interactive presentations [14]. As one of the fastest-growing research areas in augmented reality [15], numerous studies have focused on the interaction between mobile apps that utilize MAR technology and users [16,17,18,19]. A MAR APP enables consumers to visualize and evaluate products or services instantly through their smart devices [19]. As part of this research carrier, it is also the field and technology involved in the POIZON APP.
According to statistics, approximately 25% of MAR applications are not used after the initial download [2], so the continuance intention to use MAR requires attention. Lo et al. observed consumers’ purchase intentions following MAR interactions [20]. Tsai and Hung investigated the influence of community identity and interpersonal relationships on continuance intention to use [21]. Hung et al. studied the impact of perceived mobility, perceived enjoyment, and perceived connectivity on consumer perception [22]. Consequently, this study fills the research gap by evaluating consumers’ continuance intention to use MAR from two perspectives: perceived interactivity and intrinsic value.

1.3. The Suitability of MAR for Virtual Shoe-Try-On Function

The virtual shoe-try-on function is enabled by augmented reality technology, which uses foot characterizations to detect the characteristics of the individual’s feet to track and display the motion trajectory of virtual shoes [23]. However, in the case of non-mobile online stores, the limitations of camera equipment should be considered. In this regard, laptops and desktops with fixed lenses are ineffective at capturing real-time images of the user’s foot and demonstrating the try-on effect. When designing the lenses of such devices, there is not much consideration given to the needs of the user’s feet. Despite the availability of movable cameras in some computers, the users are still required to look up at the screen to observe the AR images. Thus, the AR shoe-try-on function is highly dependent on the angle of shooting and the ambient light, making it incompatible with online stores that are not mobile. However, through mobile devices, such as mobile phones, MAR provides a solution to the simultaneous shooting and display problem and the feasibility of virtual shoe-try-on function in practice. In addition, this technology is capable of improving the user experience [24]. Additionally, MAR enables users to virtually try on shoes in a variety of settings. Users are provided with practical information to enhance their real-time visualization of the world [25]. MAR encourages creativity and spontaneity in users [26,27]. It is crucial for platforms or brands that provide virtual shoe-try-on functions to explore these features actively. A virtual shoe-try-on function would benefit from the implementation of MAR. In the context of MAR, it is necessary to discuss the user’s perceptions and preferences regarding virtual shoe-try-on functions. Hence, this study is different from the virtual trial research conducted in non-mobile online stores, such as online furniture stores and online cosmetic stores [28]. Since there is currently little discussion on consumers’ experience of virtual shoe-try-on functions under MAR conditions, this research provides a theoretical basis for future marketing research in this area, which has academic and commercial relevance.

2. Relevant Research

2.1. Continuing Intention and Attitude

Continuing intention refers to consumer behavior that is affected by re-use or experience [29], and is one of the factors used to assess a product or service’s success [30]. To put it another way, the longer customers continue to use the product after it has lost its freshness and heat, the greater chance that the product will be successful [31]. The relationship between consumers’ intention and attitude has been discussed in many models, including TRA [32], TPB [33,34] and TAM [35]. Attitudes are viewed as aspects of a person’s internal experiences that can affect consumer intentions, making them one of the most important factors affecting consumer intentions. Previous studies on AR mobile games have shown that attitude affects behavioral intention [36].

2.2. Perceived Interactivity

Interactivity is defined as “technology that operates via telecommunication channels (e.g., telephone) to provide person-to-person or machine-to-machine interaction that imitates interpersonal communication (e.g., electronic banking transactions)” [37]. In contrast, with the development of digital communication, the concept of interactivity has become diverse, including interactive processes [38], technical products [39], user perception [40], etc. From the perspective of perception, perceived interactivity is defined as “users perceiving their experience via the imitation of interpersonal interaction and the extent of their perception as they interact socially with others” [41].
In terms of perceived interactivity, it is a concept that is still developing, so it may have different components in varying circumstances [3], but generally, it consists of the following: control, responsiveness, real-time interactions, connectedness, personalization, and playfulness. Each represents a different aspect of perceived interactivity: control refers to the perception of consumers as being in control of the information and content of tech-products; responsiveness refers to the degree or speed with which tech-products respond to consumers; real-time interaction refers to the speed of occurrence or response when tech-products are used for communication; connectedness refers to the possibility of sharing relevant experiences with other consumers; personalization refers to the capacity of tech-products to adapt to the unique needs of consumers; playfulness refers to the entertainment value that tech-products provide [42,43,44,45,46].
Despite the presence of many aspects of perceived interactivity, different researchers explore the subject from different angles as a result of various research topics. Due to the fact that the virtual shoe-try-on function in POIZON APP involved in this study enables individuals to complete shoe-try-on function by using MAR technology through their smartphones, real-time interactions and connectedness are not relevant to the study. In terms of playfulness, it goes is in accordance with the research of Kang et al. According to this study, playfulness refers to “perceived playfulness”, i.e., the enjoyment and escape consumers perceive [47], as opposed to the playfulness the tech-products themselves exists as a substructure construct of perceived interactivity [42]. Therefore, the perceived playfulness is also excluded from the perceived interactivity, and Section 2.3 provides further explanation. In summary, the perceived interactivity in this study is examined in three dimensions: control, responsiveness, and personalization.

2.3. Intrinsic Value

Because attitudes are perceived as the intrinsic experiences of individuals that influence consumer intentions, it is essential to understand what type of “intrinsic” influences attitudes. In the context of this study, control, responsiveness, and personalization will ultimately affect attitudes and intentions. According to Section 2.2, control, responsiveness and personalization are more likely to form various characteristics of technological products in interaction [48], so they need to be converted into consumers’ intrinsic attitudes and intentions by some unknown factors. The unknown factor has been interpreted differently by various scholars due to issues, such as mental imagery [3], efficiency, effectiveness, enjoyment, and trust [46]. This study interprets this “intrinsic” as “intrinsic value” to explain the factors that affect consumer attitudes. Perceived interactivity intrinsic value, which in turn influences attitude and then intention.
The purpose of the MAR virtual shoe-try-on function is to facilitate the mobile online shopping experience. Consumer experiences are also of value, which is derived from the interaction between direct use or remote appreciation of commodities and services [49]. Several studies have shown that experience value offers external and internal benefits [50,51,52]. Viewed from the perspective of the retail industry, the external benefits normally arise from the primarily utilitarian shopping process [51], whereas the intrinsic value comes from the appreciation of the experience [53]. In Holbrook et al.’s research, experience value is categorized into four quadrants, with intrinsic and extrinsic value sources on one axis and active and passive values on the other [53]. However, in the study by Mathwick et al., the intrinsic value is marked as playfulness and aesthetics [49], which this study uses as a basis for future investigation.
Nowadays, APPs have advanced significantly in terms of their functionality, ease of use, security, privacy, etc. [54,55,56], and there are very few instances of poor functionality or fatal bugs. Therefore, it is necessary to consider competitiveness from the perspective of attracting and retaining consumers. Kumar et al. have proposed that it is possible to increase the appeal of APP from an aesthetic perspective [57]; aesthetics play a crucial role in online shopping as well [58]. Consumers will be more likely to be attracted to a mobile application if its interface, process, color, and experience are more aesthetic [59]. It has also been demonstrated that aesthetics play a significant role in human-computer interaction [60]. Therefore, the current study believes that the degree of aesthetics perceived by consumers is one of the factors contributing to the perception of intrinsic value by consumers.
From the perspective of value-conscious hedonism, if you want users to enjoy an application, you have to make the user experience engaging [61]. The playfulness in this study refers to the subjective evaluation of the consumer’s experience of the AR virtual shoe-try-on function from an emotional perspective. As an intrinsic motivation, playfulness is considered one of the significant factors that determine whether a consumer will accept a technological system and continue to use it. If consumers perceive more interest in the interaction, the intention of use will be higher [62]. As a result of the unique attributes of augmented reality, it may facilitate the enjoyment of customer shopping experiences through applications, and ultimately increase consumer participation by providing a more interactive and interesting shopping experience and bringing the in-store experience to home [3].

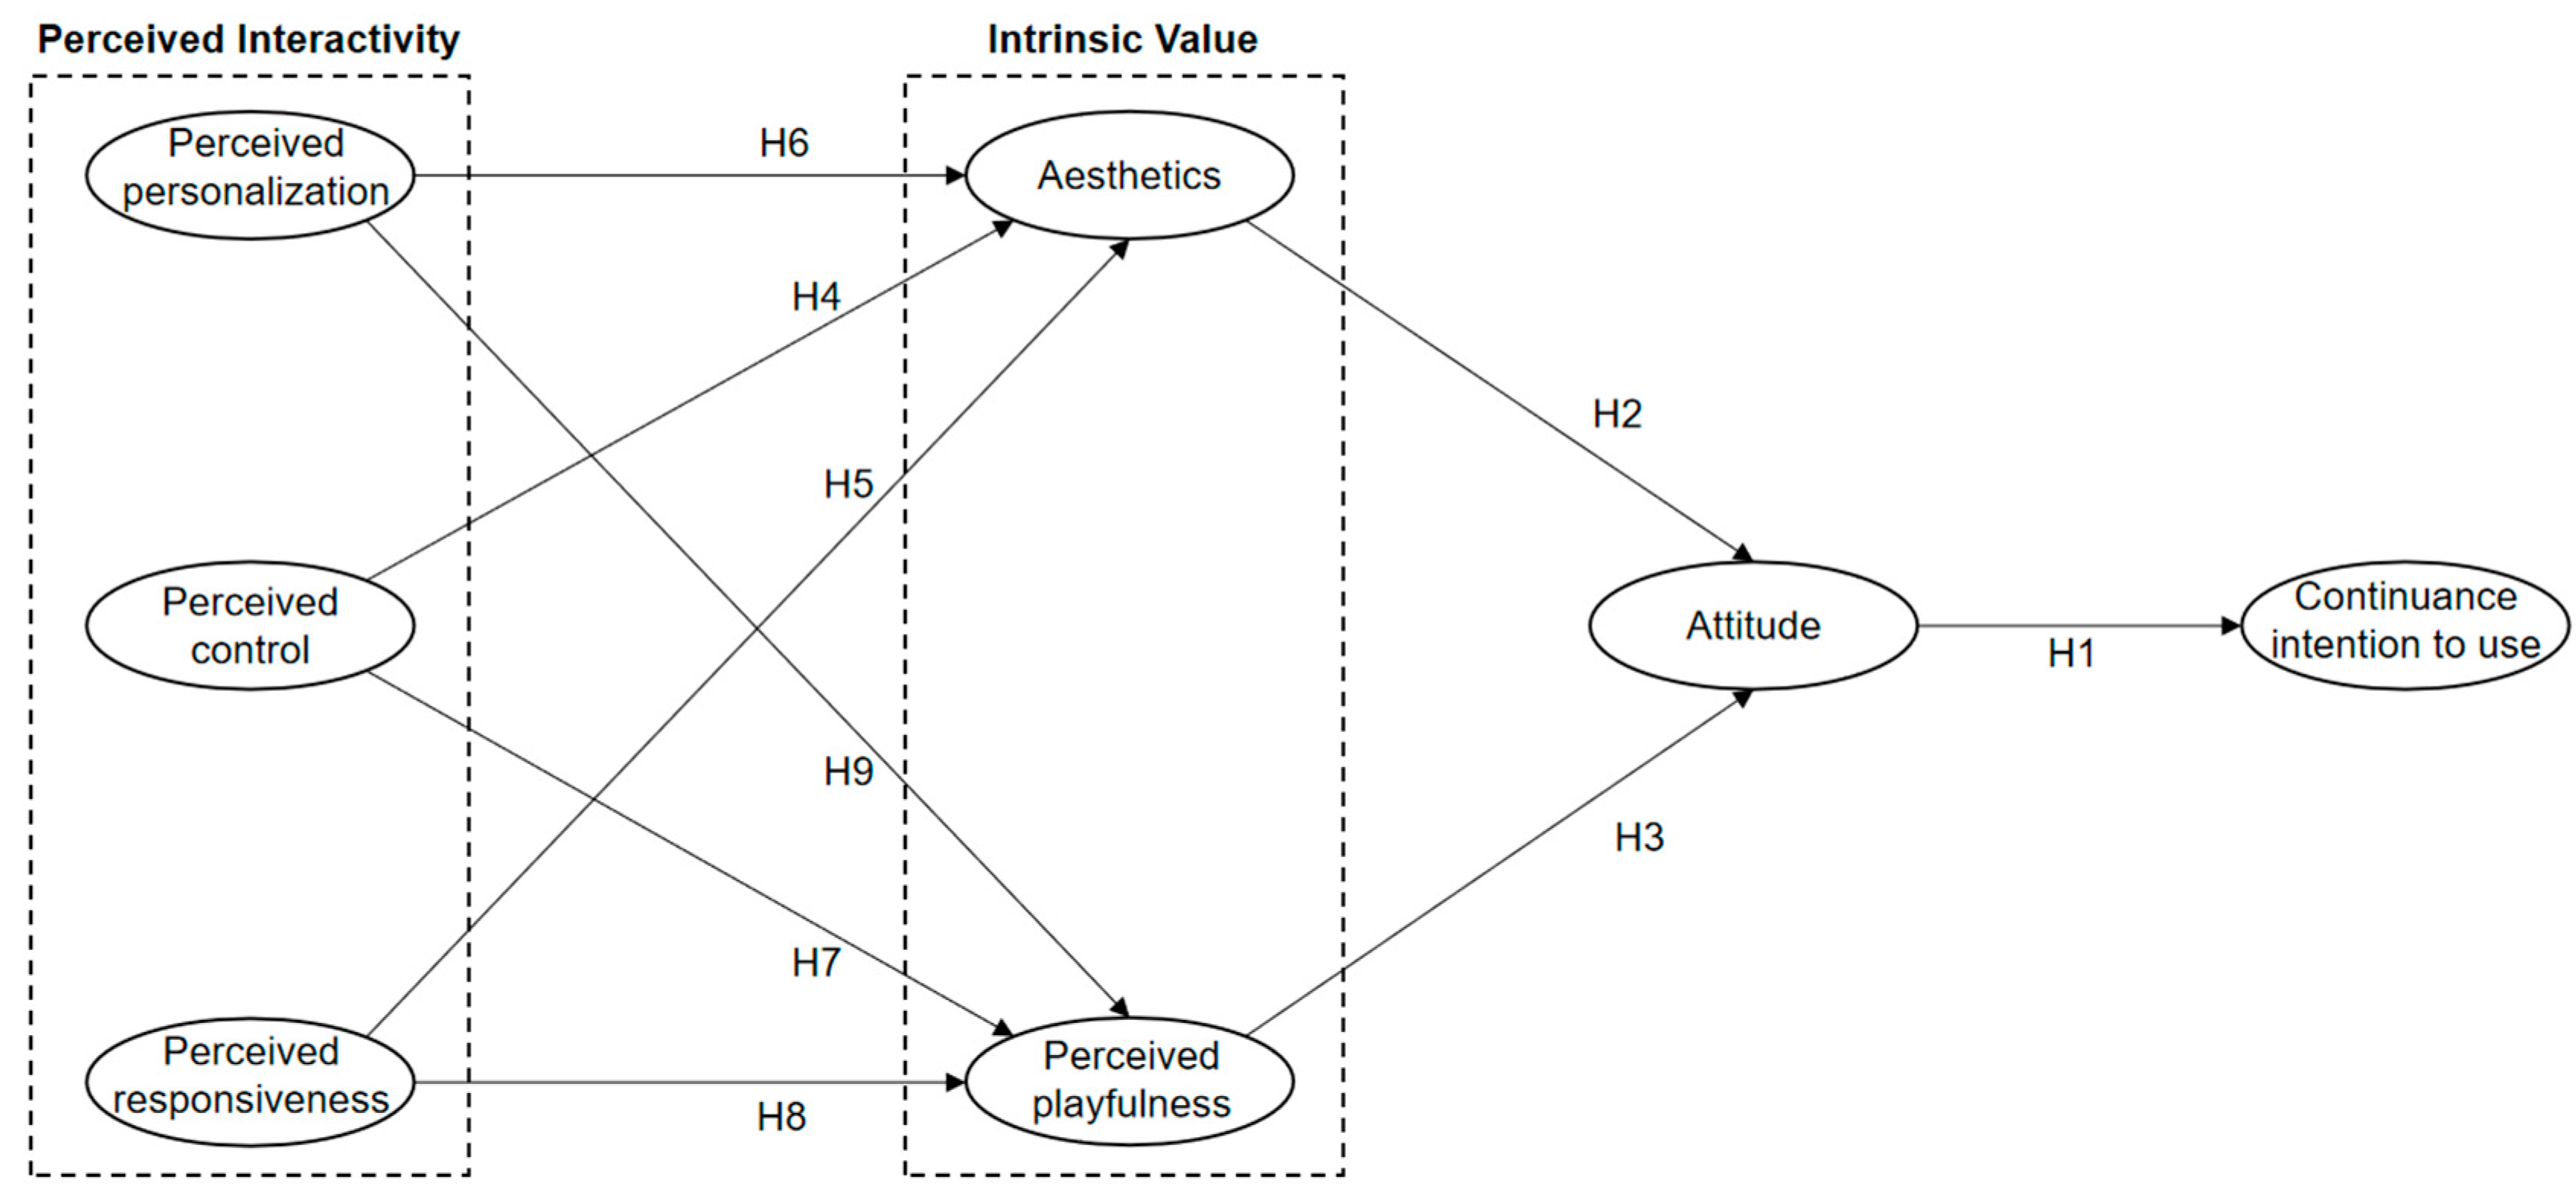
2.4. Research Structure and Research Hypothesis

As stated above, this study confirms the importance of perceived interactivity and intrinsic value. Based on this study, the interactivity of consumers using the AR virtual shoe-try-on function affects the intrinsic value perceived by them, which in turn impacts their attitude toward and intent to use the product in the future. Accordingly, this study develops an architecture model within which perceived interactivity (perceived personalization, perceived control and perceived responsiveness) affects intrinsic value (aesthetics and perceived playfulness), which in turn affects the research structure of the attitudes and continuance intention to use (Figure 1), and makes the following assumptions:
Hypothesis 1 (H1).
The attitudes of consumers toward the AR virtual shoe-try-on function will positively affect the continuance intention to use.
Hypothesis 2 (H2).
The aesthetics of the AR virtual shoe-try-on function perceived by consumers will have a positive impact on their attitudes.
Hypothesis 3 (H3).
The perceived playfulness of consumers in AR virtual shoe-try-on function will positively influence their attitudes toward it.
Hypothesis 4 (H4).
The perceived control of consumers in AR virtual shoe-try-on function will positively influence their attitudes toward the perceived aesthetics.
Hypothesis 5 (H5).
The perceived responsiveness of consumers in AR virtual shoe-try-on function will positively influence their attitudes toward the perceived aesthetics.
Hypothesis 6 (H6).
The perceived personalization of consumers in AR virtual shoe-try-on function will positively influence their attitudes toward the perceived aesthetics.
Hypothesis 7 (H7).
The perceived control of consumers in AR virtual shoe-try-on function will positively influence their attitudes toward the perceived playfulness.
Hypothesis 8 (H8).
The perceived responsiveness of consumers in AR virtual shoe-try-on function will positively influence their attitudes toward the perceived playfulness.
Hypothesis 9 (H9).
The perceived personalization of consumers in AR virtual shoe-try-on function will positively influence their attitudes toward the perceived playfulness.

3. Research Design and Methods

3.1. Research Object

The purpose of this study is to investigate the factors that influence consumers’ continuous intentions to use AR virtual shoe-try-on function. For the purpose of exploring the relationship between various factors, this study utilized structural equation modeling (SEM) for data analysis. Due to the POZION APP’s popularity among the young generation, it is primarily enjoyed by young adults (college students), who are interested in sneakers and trendy shoes. Therefore, in this study, the respondents to the questionnaire are college students who have used the POZION APP and the AR virtual shoe-try-on function more than twice. Multiple-use is chosen as the survey object due to the fact that multiple-use suggests the intention to use the service continuously, which meets the requirements of the research object.

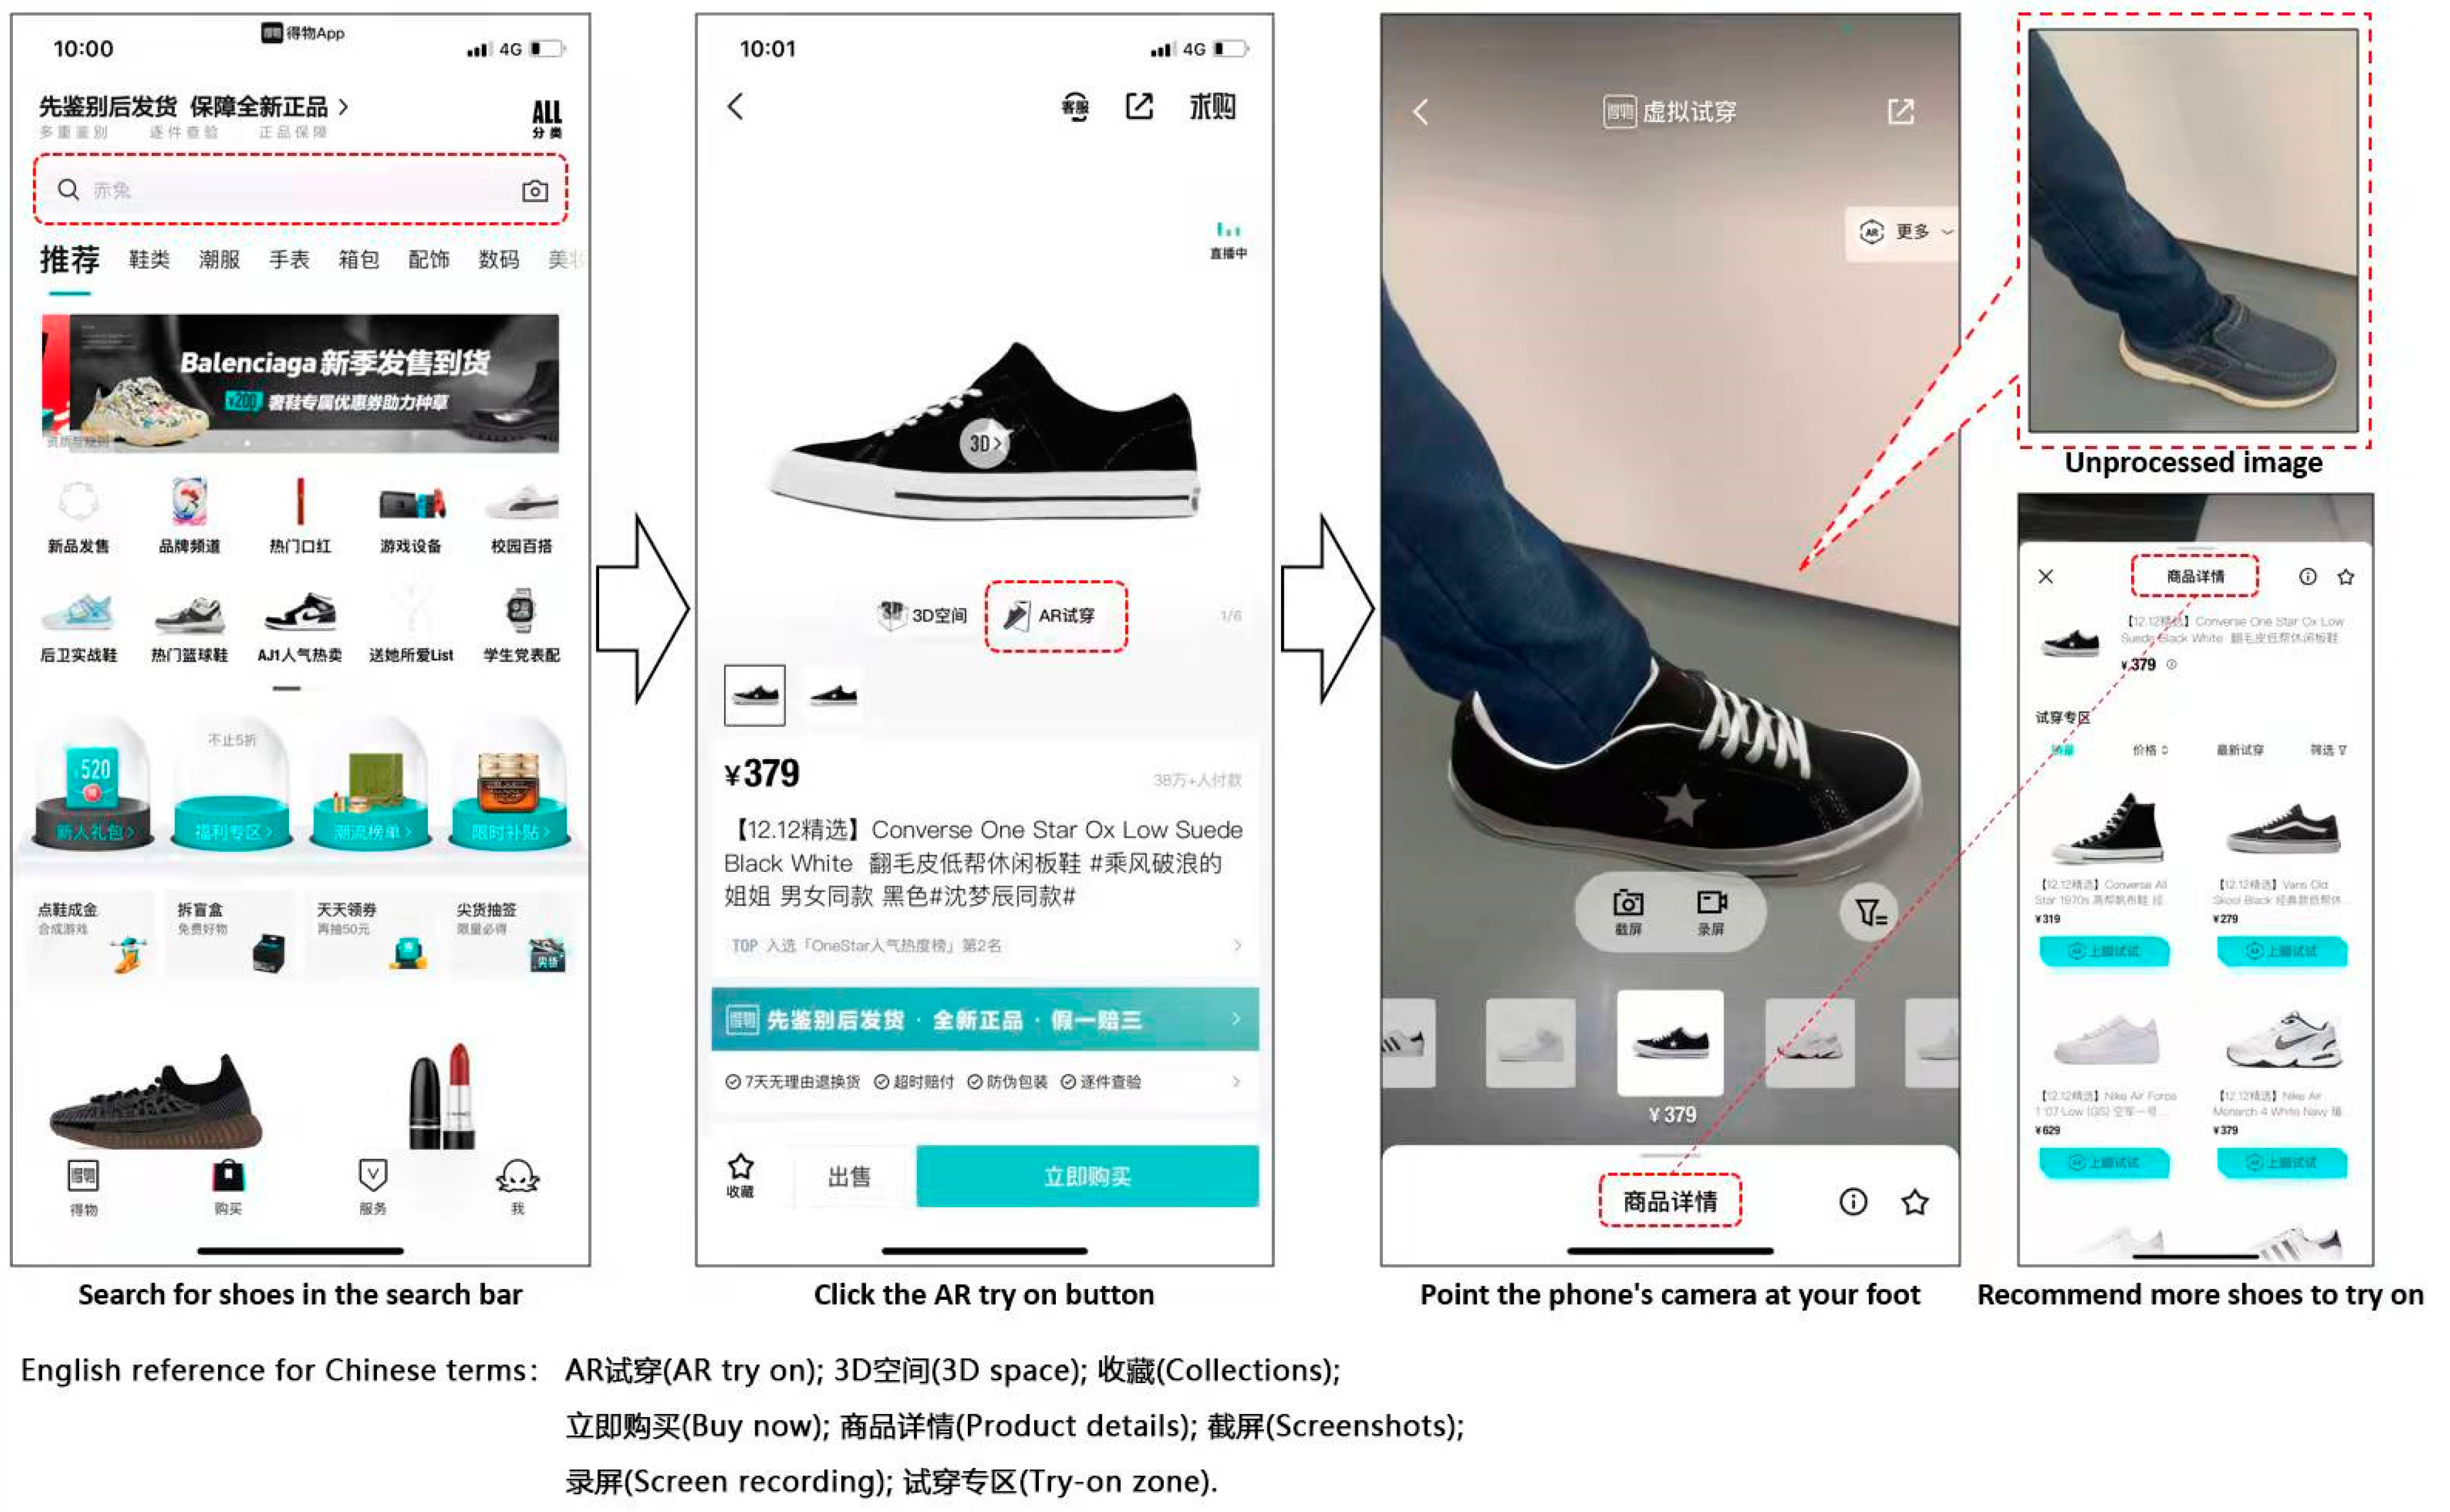
3.2. The Process of Using Virtual Shoe-Try-On Function

The procedure for using the POZION APP’s virtual shoe-try-on function is as follows: 1. Click the search bar on the shopping interface of the POIZON APP to search for the shoes (It should be noted that this feature does not include all of the shoes for sale, and their database is still in development); 2. Click the AR try button on the detail interface of the shoe you wish to try on; 3. On the try-on interface, the AR virtual shoe function can be implemented by aiming at the user’s foot with the camera of the mobile phone, which will allow the virtual shoes to adjust to the user’s movements or changes in angle (Figure 2).

3.3. Questionnaire Design

The questionnaire items were designed based on the theme and related literature in this study. Table 1 presents the reference sources of latent variable, coding, item and source information.

3.4. Data Collection

The study was conducted through an online questionnaire from September to October 2021. In addition to basic personal information, the Likert 7-point scale was used, ranging from 1 representing strongly disagree to 7 representing strongly agree. All those who completed the questionnaire clicked on the link of the questionnaire to view the survey description. Participants answer the research questions voluntarily and could withdraw at any time. In this regard, all participants agreed to fill out the questionnaire voluntarily and were fully informed.
Ultimately, 311 samples were collected in this study and after removing invalid samples (logical errors or too many similar options), the remaining samples were 286, and the recycling efficiency was 91.96%. Accordingly, there were 21 questionnaire questions in this study, and 286 valid samples met Jackson’s standard that the ratio of estimated parameters to the number of samples should not be less than 1:10 [66]. Therefore, subsequent data analysis was carried out based on this. Statistical analyses were performed on the data collected from valid questionnaires. Table 2 presents the statistical results.

4. Data Analysis

4.1. Reliability Analysis

Cronbach’s α coefficient and total correlation coefficient of correction items (CITC) were used to validate the questionnaire. According to Table 3, the CITC of all constructs is higher than 0.6, and the reliability coefficient does not improve significantly after the deletion of questions. Furthermore, Cronbach’s coefficient of reliability is higher than 0.7. Thus, the questionnaire and scale used in this study demonstrate a high degree of internal consistency, which allows for further analysis.

4.2. Exploratory Factor Analysis

SPSS 26.0 was used in this study for exploratory factor analysis to verify the single construct of each construct, and the results are shown in Table 4. The principal component analysis was used to identify new factors with eigenvalues greater than 1. Results indicate that the KMO values of all constructs are greater than 0.70, and the Bartlett sphericity test significance is less than 0.05, indicating that exploratory factor analysis would be appropriate [67,68]. The items belonging to each construct are involved in the extraction of new factors, and only one factor with an eigenvalue greater than 1 can be recovered [69], indicating a good single construct [70].

4.3. Confirmatory Factor Analysis
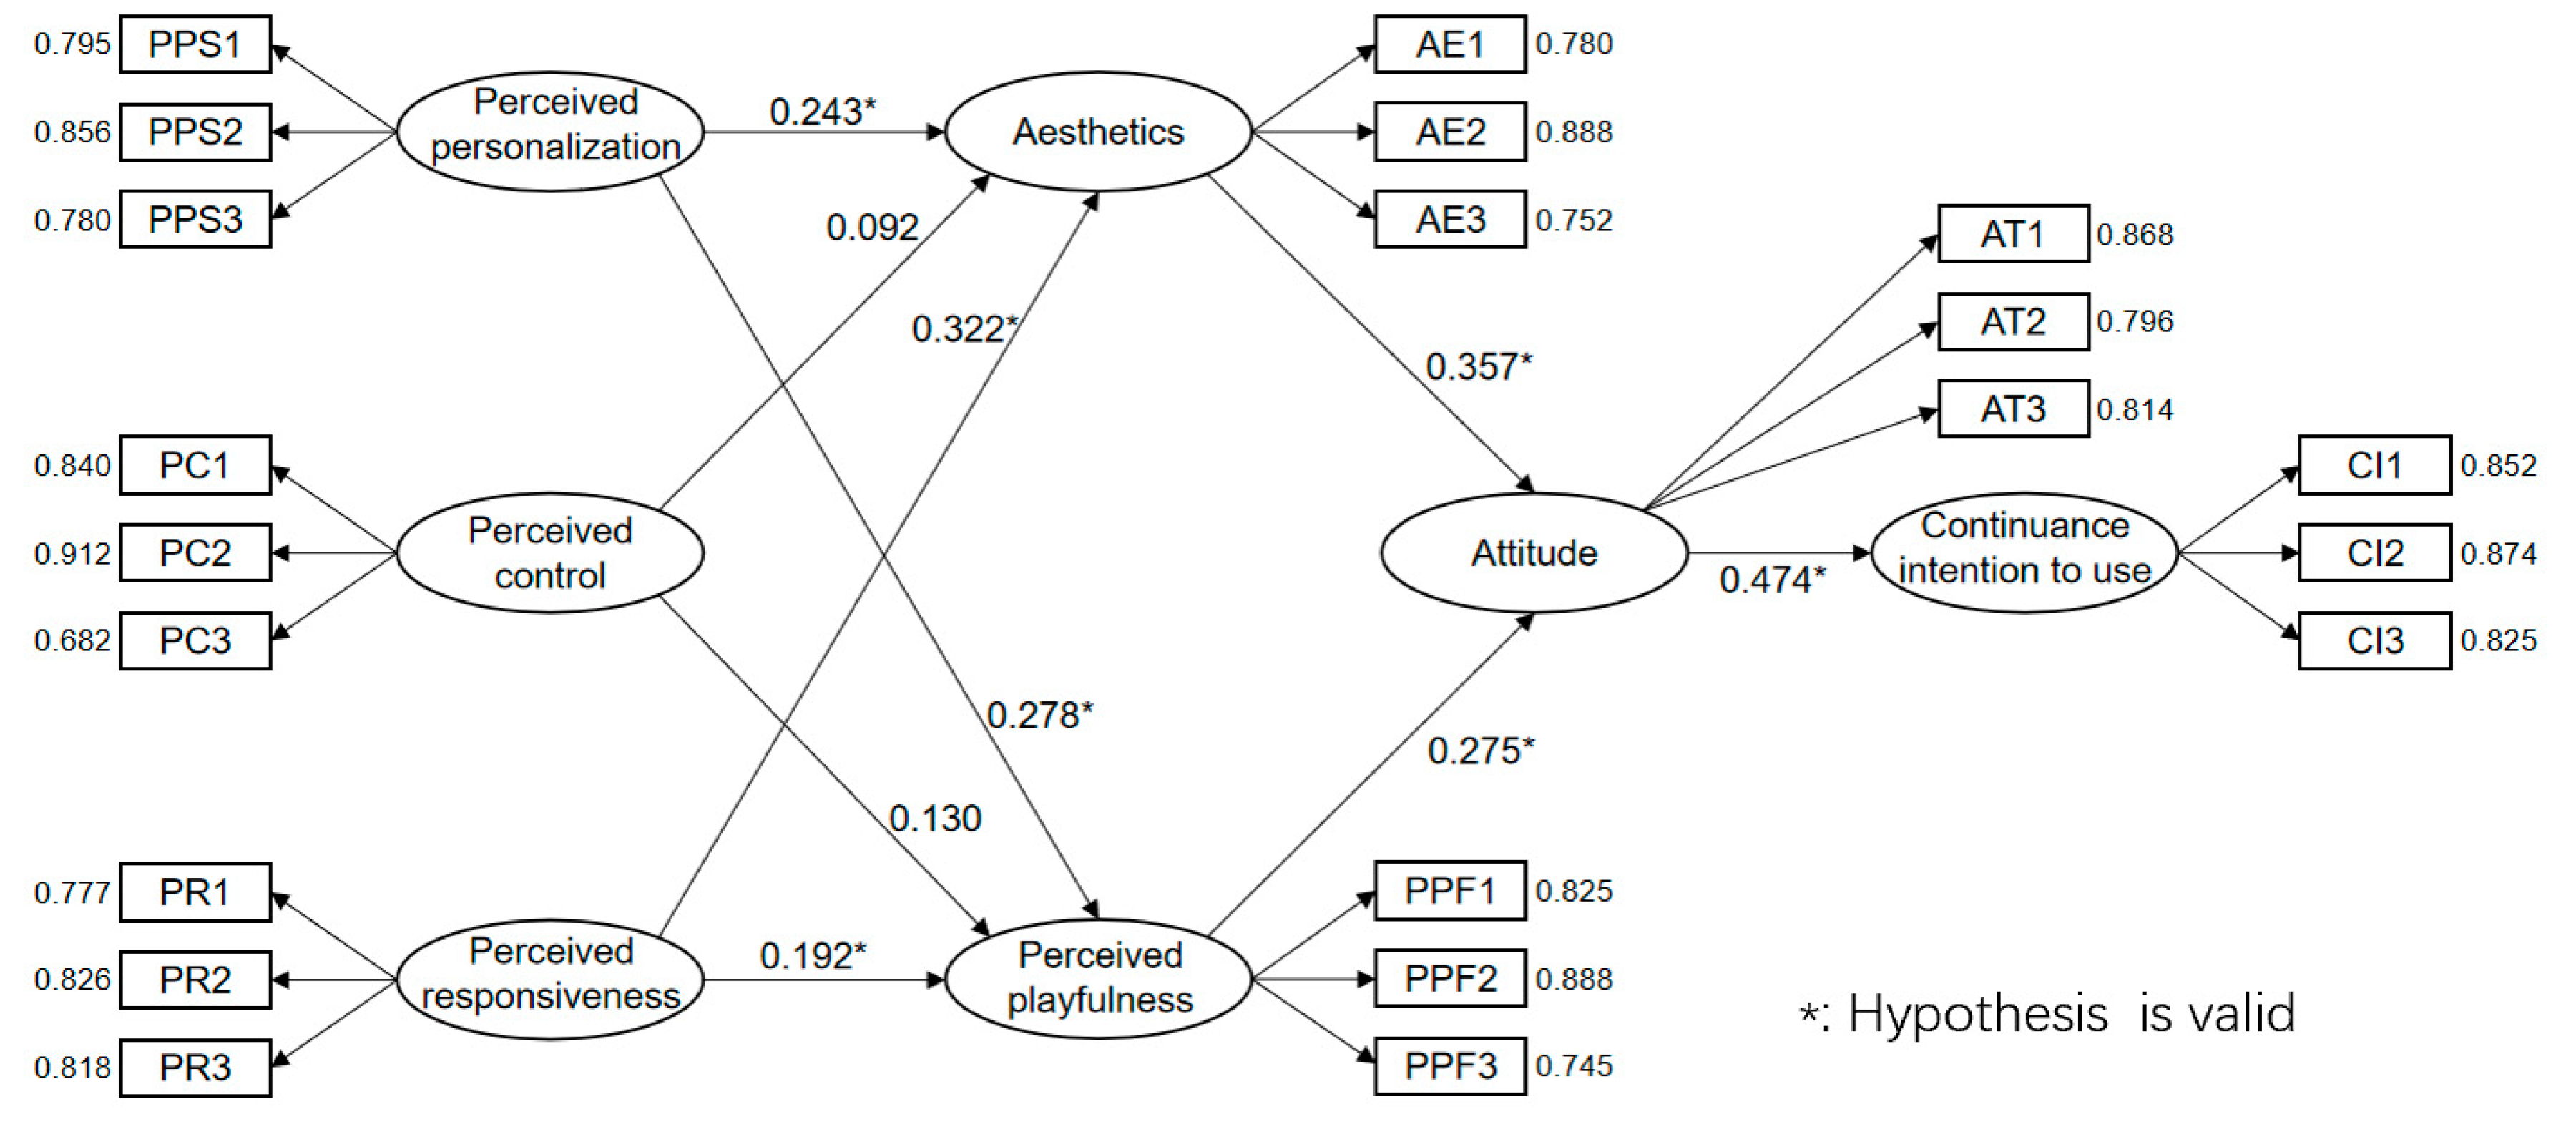
AMOS V22.0 was used to analyze the structural equation model. AMOS has been used in several studies, which has proven to be reliable structural equation modeling software. According to Anderson and Gerbing, data analysis was divided into two stages [71]. The first stage is the Measurement Model, which employs the maximum likelihood estimation method and estimates the following parameters: factor load, reliability, convergence validity, and discriminant validity. This is done according to studies of convergence validity by Hair et al. [72], Nunnally and Bernstein [73] and Fornell and Larcker [74], and studies of standardized factor loading by Chin [75] and Hooper et al. [76], as shown in Table 5 below. The standardized factor load in this study is higher than 0.6, the reliability of the research construct composition is higher than 0.7, and the average variance extraction (AVE) is higher than 0.5, thus indicating that this construct has good convergence validity [72].
Fornell and Larcker [74] are adopted for discriminant validity. If the square root of the AVE of each construct is greater than the correlation coefficient between the constructs, the model is discriminant valid. According to the results, all diagonals in this study have greater values than those outside the diagonals, indicating that each of the constructs in this study has good discriminant validity (as shown in Table 6).

4.4. Model Test

A selection of indexes (MLχ2, DF, χ2/DF, RMSEA, SRMR, TLI, CFI, NFI, IFI) has been used as a parameterized measure for evaluating the fitting degree of the structural model based on studies performed by Jackson et al. [77], Kline [78], Schumacker [79], and Hu and Bentler [80]. As shown in Table 7, the study construct was measured based on the study hypothesis and model. In addition, all the standard model fit degree evaluation indicators met the independent level and combination rule of the recommended fit, which proved that the structural model had a good fit degree, and the theoretical framework of the study hypothesis made sense in light of the survey data.
This study tested the effect of the path in the model. Table 8 and Figure 3 below show that, except for the two paths from PC to AE and PPF, all the other paths presented significant significance, illustrating the model constructed in this study. It explains some of the factors influencing consumers’ continuance intention to use AR virtual shoe-try-on function.

5. Discussions

Several key findings are derived from the validation of the structural equation model and various verification results, which are discussed in the following paragraphs:
H1 is valid, indicating that consumers’ attitudes towards AR virtual shoe-try-on function have a positive impact on their intention for continued usage, and the path coefficient is the highest. In other words, attitude is the most important factor in determining whether consumers continue to use the AR virtual shoe trying function. Numerous studies confirm the influence of attitude on intentions [81,82,83]. In addition, it emphasizes that in order to make consumers have a stronger intention of continuous use, it is necessary to change their attitude in a positive direction. According to the findings of this study, such internal transformation is presupposed to be perceived interactivity and internal factors, which will be discussed in detail below.
H2 is valid, indicating that consumers’ perception of beauty in AR virtual shoe trying has a positive impact on their attitude. The path coefficient is second only to H1, which indicates that consumers are very concerned about aesthetics. H3 is valid, indicating that consumers’ perceived playfulness would positively affect their attitude towards AR virtual shoe-try-on functions. In product design and marketing, aesthetics play an important role [84], as evidenced by the APP product interface [57], the process experience, visual aesthetics [85], colors, etc. It is likely that consumers will perceive a higher degree of aesthetics if the above aspects are more prominent, reflecting that they will have a positive attitude and intent. From the perspective of AR virtual shoe-try-on function with prominent interactive attributes, aesthetics tend to have a hedonic value [86]. According to our discussion in Chapter 2, the enjoyment value perceived by consumers is primarily based on “perceived playfulness” [61], which is influenced by a consumer’s curiosity, interaction and perception of AR virtual shoe-try-on function [87]. Studies have shown that the level of perceived playfulness will directly affect consumers’ participation [88] and happiness [89]. From the perspective of intrinsic value comprised of intuitive feeling and inner sense of perceived playfulness derived from aesthetics, this explains the critical factor that affects consumers’ attitudes and intentions towards AR virtual shoe-try-on function.
H6 is valid, indicating that consumers’ perceived personalization will positively influence their attitudes toward the perceived aesthetics of AR virtual shoe trying. H9 is valid, indicating that the perceived personalization of consumers in AR virtual shoe-try-on function will positively influence their attitudes toward the perceived playfulness. Furthermore, the validity of H6 and H9 means that the perceived personalization of consumers has a positive impact on consumers’ perceptions of the intrinsic value of the AR virtual shoe-try-on function. Consistent with our hypothesis, the AR virtual shoe-try-on function enables consumers to visualize products in relevant scenes [90] and enhance their perceived personalization in real-life settings [91]. In the meantime, perceived personalization more significant greater impact on consumers’ perceived playfulness. Both of these characteristics tend to be perceived attributes of personal preferences and it has been found that the more personalized settings and processes there are, the more playfulness consumers will experience. Perceived playfulness, of course, is not the only factor that is affected by perceived personalization, which also has a significant impact on the process of using and interface loading of the entire AR virtual shoe-try-on function. Customers’ individual APP usage habits and the degree of optimization also influence their experience, which, in turn, affects their attitudes and intentions.
As H4 is invalid, it indicates that consumers’ perceived control over the AR virtual shoe-try-on function would not affect their perception of its aesthetics. H7 is invalid, indicating that consumers’ perceived control will not affect their perceived playfulness of AR virtual shoe-try-on function. As can be seen, consumers’ perceived control over AR virtual shoe-try-on function does not affect the two sub-factors of intrinsic value, so it is not capable of affecting subsequent attitudes or intentions. The reason why consumers’ perceived control has no influence may be due to the single function of AR virtual shoe-try-on function, the linear nature of the overall process, and the absence of multiple control methods. Consequently, it limits the consumers’ perception of subjective control, which means that it cannot be considered an indicator in this research model or topic.
H5 is valid, indicating that the perceived responsiveness of consumers in AR virtual shoe-try-on function will positively influence their attitudes toward the perceived aesthetics. H8 is valid, indicating that the perceived responsiveness of consumers in AR virtual shoe-try-on function will positively influence their attitudes toward the perceived playfulness. The validity of H5 and H8 means that the perceived responsiveness of consumers has a positive impact on consumers’ perceptions of the intrinsic value of the AR virtual shoe-try-on function. The perceived responsiveness of consumers reflects the human-computer communication response speed of the AR virtual shoe-try-on function [92], which directly impacts their experience. As opposed to perceived personalization, perceived responsiveness has a higher impact on aesthetics, indicating that there is a stronger connection between consumers’ personal aesthetics and perceived responsiveness. In the case of the AR virtual shoe-try-on interface, user experience and color fusion, the higher the level of software design, the more it can affect consumers’ aesthetic and influence them to have a positive attitude, preference and even use intention towards it. Customers may, among these attributes, pay greater attention to the response speed of the AR virtual shoe-try-on function. Through rapid feedback on the AR virtual shoe-try-on function and optimization of the user experience, a coherent interactive experience can be achieved, which is also an important aspect of aesthetics [93].

6. Conclusions and Suggestions

6.1. Theoretical Implications

Among the contributions of this study is suggesting how perceived interactivity (divided into perceived personalization, perceived control and perceived responsiveness) and intrinsic value (divided into aesthetics and perceived playfulness) affect consumers’ willingness to continue using the AR virtual shoe-try-on function when they use the AR APP (the case of this study is the POZION APP). This study discusses the possibility of intuition and lays a foundation for further investigation. Based on the data analysis, both perceived interactivity and intrinsic value have an impact on consumers’ attitude and their continuance intention to use the AR virtual shoe-try-on function. Perceived interactivity will influence consumers’ attitudes and intentions through the intrinsic value. It is noteworthy that in the context of this study topic and model perceived control has no influence, while perceived personalization and perceived responsiveness have more influence on perceived playfulness and aesthetics, respectively.

6.2. Practical Implications

The findings of this study can be helpful to businesses or practitioners interested in improving the AR capabilities of existing apps to offer better services and experiences in line with the internal perceptions of consumers. Therefore, based on the conclusions of this study, the following recommendations are provided for reference:
  • While aesthetics and perceived playfulness are both components of pleasure, the factors that influence them and their influences are different. In addition, we illustrate the importance of aesthetics and perceived playfulness in this study. It is recommended that relevant enterprises and practitioners take into account consumers’ inner perception of aesthetics and playfulness in the initial design of mobile applications. For instance, these two factors can be combined with the three factors of perceived interactivity to improve the design of AR applications, which will result in a more enjoyable experience for consumers.
  • Due to the fact that perceived control does not significantly influence perception in this study, the relevant enterprises and practitioners can improve and develop new functionalities and technologies of AR, so that consumers can have greater freedom and controllability when using AR and obtain the corresponding perception.
  • Based on the second point, when the new functions and technologies of AR (such as the popularization of 5G) are fully developed, real-time interactions and connectedness within perceived interactivity will gradually become apparent and should be studied accordingly.

6.3. Limitations and Future Research

The following limitations of this study may indicate future research directions:
  • The research objects of this study are college students. Future advances in AR or shoe culture will expand the potential group of virtual shoe-try-on, and it should be possible to carry out in-depth research on a broader range of consumers
  • The study of consumers’ attitudes is focused on modeling and researching their inner perceptions, but other aspects, such as the authenticity of devices, augmented reality, or new discoveries can be utilized as well. The study focuses primarily on the modeling and research of consumers’ inner perception, but can also begin from other perspectives, such as the authenticity of devices and the use of AR virtual reality, etc. It may be possible to make new discoveries.
  • The current paper employs a structural equation model as the research and analysis method. Qualitative studies can be added in the future to supplement deeper implications that cannot be expressed by quantitative data.

Author Contributions

Conceptualization, Q.J. and C.G.; methodology, Q.J. and C.G.; validation, C.Y., Q.J. and J.S.; formal analysis, Q.J.; investigation, J.S.; data curation, Q.J.; writing—original draft preparation, Q.J.; writing—review and editing, C.Y.; visualization, Q.J.; supervision, C.G.; project administration, Q.J. All authors have read and agreed to the published version of the manuscript.

Funding

This research received no external funding.

Institutional Review Board Statement

Not applicable.

Informed Consent Statement

Not applicable.

Data Availability Statement

Not applicable.

Conflicts of Interest

The author declares no conflict of interest.

References

  1. Braun, J.; Zolfagharian, M.; Belk, R.W. How does a product gain the status of a necessity? An analysis of necessitation narratives. Psychol. Mark. 2016, 33, 209–222. [Google Scholar] [CrossRef]
  2. Nikhashemi, S.; Knight, H.H.; Nusair, K.; Liat, C.B. Augmented reality in smart retailing: A (n)(a) symmetric approach to continuous intention to use retail brands’ mobile ar apps. J. Retail. Consum. Serv. 2021, 60, 102464. [Google Scholar] [CrossRef]
  3. Park, M.; Yoo, J. Effects of perceived interactivity of augmented reality on consumer responses: A mental imagery perspective. J. Retail. Consum. Serv. 2020, 52, 101912. [Google Scholar] [CrossRef]
  4. Luo, D.-T.; Wang, B.-S. Analysis of manufacturers’ selection on offline retailers under ar/vr experience. J. Univ. South China (Soc. Sci. Ed.) 2019, 20, 67–74. [Google Scholar]
  5. Chen, D.-X.; Zhu, W.-L. Exploration and design of “new retail +” e-commerce model. China Econ. 2020, 5, 223–224. [Google Scholar]
  6. World Health, O. Coronavirus Disease 2019 (COVID-19): Situation Report, 72; World Health Organization: Geneva, Switzerland, 2020. [Google Scholar]
  7. Craig, A.B. Understanding Augmented Reality: Concepts and Applications; Newnes: Burlington, MA, USA, 2013. [Google Scholar]
  8. Jessen, A.; Hilken, T.; Chylinski, M.; Mahr, D.; Heller, J.; Keeling, D.I.; de Ruyter, K. The playground effect: How augmented reality drives creative customer engagement. J. Bus. Res. 2020, 116, 85–98. [Google Scholar] [CrossRef]
  9. Poushneh, A. Augmented reality in retail: A trade-off between user’s control of access to personal information and augmentation quality. J. Retail. Consum. Serv. 2018, 41, 169–176. [Google Scholar] [CrossRef]
  10. Beck, M.; Crié, D. I virtually try it … i want it! Virtual fitting room: A tool to increase on-line and off-line exploratory behavior, patronage and purchase intentions. J. Retail. Consum. Serv. 2018, 40, 279–286. [Google Scholar] [CrossRef]
  11. Dacko, S.G. Enabling smart retail settings via mobile augmented reality shopping apps. Technol. Forecast. Soc. Change 2017, 124, 243–256. [Google Scholar] [CrossRef] [Green Version]
  12. Flavián, C.; Ibáñez-Sánchez, S.; Orús, C. The influence of scent on virtual reality experiences: The role of aroma-content congruence. J. Bus. Res. 2021, 123, 289–301. [Google Scholar] [CrossRef]
  13. Gallino, S.; Moreno, A. The value of fit information in online retail: Evidence from a randomized field experiment. Manuf. Serv. Oper. Manag. 2018, 20, 767–787. [Google Scholar] [CrossRef] [Green Version]
  14. Cranmer, E.E.; Dieck, M.C.T.; Fountoulaki, P. Exploring the value of augmented reality for tourism. Tour. Manag. Perspect. 2020, 35, 100672. [Google Scholar] [CrossRef]
  15. Do, H.-N.; Shih, W.; Ha, Q.-A. Effects of mobile augmented reality apps on impulse buying behavior: An investigation in the tourism field. Heliyon 2020, 6, e04667. [Google Scholar] [CrossRef] [PubMed]
  16. De Sá, M.; Churchill, E.F. Mobile augmented reality: A design perspective. In Human Factors in Augmented Reality Environments; Springer: Berlin/Heidelberg, Germany, 2013; pp. 139–164. [Google Scholar]
  17. Yavuz, M.; Çorbacıoğlu, E.; Başoğlu, A.N.; Daim, T.U.; Shaygan, A. Augmented reality technology adoption: Case of a mobile application in turkey. Technol. Soc. 2021, 66, 101598. [Google Scholar] [CrossRef]
  18. McLean, G.; Wilson, A. Shopping in the digital world: Examining customer engagement through augmented reality mobile applications. Comput. Hum. Behav. 2019, 101, 210–224. [Google Scholar] [CrossRef]
  19. Qin, H.; Peak, D.A.; Prybutok, V. A virtual market in your pocket: How does mobile augmented reality (mar) influence consumer decision making? J. Retail. Consum. Serv. 2021, 58, 102337. [Google Scholar] [CrossRef]
  20. Lo, F.-Y.; Yu, T.H.-K.; Chen, H.-H. Purchasing intention and behavior in the sharing economy: Mediating effects of app assessments. J. Bus. Res. 2020, 121, 93–102. [Google Scholar] [CrossRef]
  21. Tsai, J.C.-A.; Hung, S.-Y. Examination of community identification and interpersonal trust on continuous use intention: Evidence from experienced online community members. Inf. Manag. 2019, 56, 552–569. [Google Scholar] [CrossRef]
  22. Hung, S.-W.; Chang, C.-W.; Ma, Y.-C. A new reality: Exploring continuance intention to use mobile augmented reality for entertainment purposes. Technol. Soc. 2021, 67, 101757. [Google Scholar] [CrossRef]
  23. Brito, P.Q.; Stoyanova, J. Marker versus markerless augmented reality. Which has more impact on users? Int. J. Hum. Comput. Interact. 2018, 34, 819–833. [Google Scholar] [CrossRef]
  24. Paulo, M.M.; Rita, P.; Oliveira, T.; Moro, S. Understanding mobile augmented reality adoption in a consumer context. J. Hosp. Tour. Technol. 2018, 9, 142–157. [Google Scholar] [CrossRef] [Green Version]
  25. Kourouthanassis, P.; Boletsis, C.; Bardaki, C.; Chasanidou, D. Tourists responses to mobile augmented reality travel guides: The role of emotions on adoption behavior. Pervasive Mob. Comput. 2015, 18, 71–87. [Google Scholar] [CrossRef]
  26. Richards, G. Creativity and tourism: The state of the art. Ann. Tour. Res. 2011, 38, 1225–1253. [Google Scholar] [CrossRef]
  27. Wang, D.; Park, S.; Fesenmaier, D.R. The role of smartphones in mediating the touristic experience. J. Travel Res. 2011, 51, 371–387. [Google Scholar] [CrossRef] [Green Version]
  28. Smink, A.R.; Frowijn, S.; van Reijmersdal, E.A.; van Noort, G.; Neijens, P.C. Try online before you buy: How does shopping with augmented reality affect brand responses and personal data disclosure. Electron. Commer. Res. Appl. 2019, 35, 100854. [Google Scholar] [CrossRef]
  29. Montazemi, A.R.; Qahri-Saremi, H. Factors affecting adoption of online banking: A meta-analytic structural equation modeling study. Inf. Manag. 2015, 52, 210–226. [Google Scholar] [CrossRef]
  30. Teo, T.S.H.; Srivastava, S.C.; Jiang, L. Trust and electronic government success: An empirical study. J. Manag. Inf. Syst. 2008, 25, 99–132. [Google Scholar] [CrossRef]
  31. Bhattacherjee, A. Understanding information systems continuance: An expectation-confirmation model. MIS Q. 2001, 25, 351–370. [Google Scholar] [CrossRef]
  32. Fishbein, M.; Ajzen, I. Understanding Attitudes and Predicting Social Behavior; Prentice-Hall: Englewood Cliffs, NJ, USA, 1980; p. 278. [Google Scholar]
  33. Fishbein, M.; Ajzen, I. Belief, Attitude, Intention, and Behavior: An Introduction to Theory and Research. 1977. Available online: https://philarchive.org/archive/FISBAI (accessed on 7 November 2021).
  34. Ajzen, I. From intentions to actions: A theory of planned behavior. In Action Control; Springer: Berlin/Heidelberg, Germany, 1985; pp. 11–39. [Google Scholar]
  35. Davis, F.D.; Bagozzi, R.P.; Warshaw, P.R. User acceptance of computer technology: A comparison of two theoretical models. Manag. Sci. 1989, 35, 982–1003. [Google Scholar] [CrossRef] [Green Version]
  36. Rauschnabel, P.A.; Rossmann, A.; tom Dieck, M.C. An adoption framework for mobile augmented reality games: The case of pokémon go. Comput. Hum. Behav. 2017, 76, 276–286. [Google Scholar] [CrossRef] [Green Version]
  37. Carey, J. Interactive media. Int. Encycl. Commun. 1989, 2. Available online: https://scholar.google.com/citations?view_op=view_citation&hl=en&user=RUqo1B0AAAAJ&alert_preview_top_rm=2&citation_for_view=RUqo1B0AAAAJ:u_35RYKgDlwC (accessed on 7 November 2021).
  38. Lee, E.-J.; Shin, S.Y. Are they talking to me? Cognitive and affective effects of interactivity in politicians’ twitter communication. Cyberpsychology Behav. Soc. Netw. 2012, 15, 515–520. [Google Scholar] [CrossRef] [PubMed]
  39. Stromer-Galley, J. Interactivity-as-product and interactivity-as-process. Inf. Soc. 2004, 20, 391–394. [Google Scholar] [CrossRef]
  40. McMillan, S.J.; Hwang, J.-S. Measures of perceived interactivity: An exploration of the role of direction of communication, user control, and time in shaping perceptions of interactivity. J. Advert. 2002, 31, 29–42. [Google Scholar] [CrossRef]
  41. Thorson, K.S.; Rodgers, S. Relationships between blogs as ewom and interactivity, perceived interactivity, and parasocial interaction. J. Interact. Advert. 2006, 6, 5–44. [Google Scholar] [CrossRef]
  42. Dholakia, R.R.; Zhao, M.; Dholakia, N.; Fortin, D.R. Interactivity and revisits to websites: A theoretical framework. Retrieved June 2000, 17, 2002. [Google Scholar]
  43. Lee, T. The impact of perceptions of interactivity on customer trust and transaction intentions in mobile commerce. J. Electron. Commer. Res. 2005, 6, 165. [Google Scholar]
  44. Wu, G. The mediating role of perceived interactivity in the effect of actual interactivity on attitude toward the website. J. Interact. Advert. 2005, 5, 29–39. [Google Scholar] [CrossRef]
  45. Zhao, L.; Lu, Y. Enhancing perceived interactivity through network externalities: An empirical study on micro-blogging service satisfaction and continuance intention. Decis. Support Syst. 2012, 53, 825–834. [Google Scholar] [CrossRef]
  46. Cyr, D.; Head, M.; Ivanov, A. Perceived interactivity leading to e-loyalty: Development of a model for cognitive–affective user responses. Int. J. Hum.-Comput. Stud. 2009, 67, 850–869. [Google Scholar] [CrossRef] [Green Version]
  47. Kang, H.J.; Shin, J.-h.; Ponto, K. How 3d virtual reality stores can shape consumer purchase decisions: The roles of informativeness and playfulness. J. Interact. Mark. 2020, 49, 70–85. [Google Scholar] [CrossRef]
  48. Ha, L.; James, E.L. Interactivity reexamined: A baseline analysis of early business web sites. J. Broadcasting Electron. Media 1998, 42, 457–474. [Google Scholar] [CrossRef]
  49. Mathwick, C.; Malhotra, N.; Rigdon, E. Experiential value: Conceptualization, measurement and application in the catalog and internet shopping environment. J. Retail. 2001, 77, 39–56. [Google Scholar] [CrossRef]
  50. Babin, B.J.; Darden, W.R. Consumer self-regulation in a retail environment. J. Retail. 1995, 71, 47–70. [Google Scholar] [CrossRef]
  51. Batra, R.; Ahtola, O.T. Measuring the hedonic and utilitarian sources of consumer attitudes. Mark. Lett. 1991, 2, 159–170. [Google Scholar] [CrossRef]
  52. Zeithaml, V.A. Consumer perceptions of price, quality, and value: A means-end model and synthesis of evidence. J. Mark. 1988, 52, 2–22. [Google Scholar] [CrossRef]
  53. Holbrook, M.B. The nature of customer value: An axiology of services in the consumption experience. Serv. Qual. New Dir. Theory Pract. 1994, 21, 21–71. [Google Scholar]
  54. Fang, J.; Zhao, Z.; Wen, C.; Wang, R. Design and performance attributes driving mobile travel application engagement. Int. J. Inf. Manag. 2017, 37, 269–283. [Google Scholar] [CrossRef]
  55. Tarute, A.; Nikou, S.; Gatautis, R. Mobile application driven consumer engagement. Telemat. Inform. 2017, 34, 145–156. [Google Scholar] [CrossRef]
  56. Kim, S.; Baek, T.H. Examining the antecedents and consequences of mobile app engagement. Telemat. Inform. 2018, 35, 148–158. [Google Scholar] [CrossRef]
  57. Kumar, S.; Jain, A.; Hsieh, J.-K. Impact of apps aesthetics on revisit intentions of food delivery apps: The mediating role of pleasure and arousal. J. Retail. Consum. Serv. 2021, 63, 102686. [Google Scholar] [CrossRef]
  58. Cheng, F.-F.; Wu, C.-S.; Leiner, B. The influence of user interface design on consumer perceptions: A cross-cultural comparison. Comput. Hum. Behav. 2019, 101, 394–401. [Google Scholar] [CrossRef]
  59. Chang, S.-H.; Chih, W.-H.; Liou, D.-K.; Hwang, L.-R. The influence of web aesthetics on customers’ pad. Comput. Hum. Behav. 2014, 36, 168–178. [Google Scholar] [CrossRef]
  60. Hassenzahl, M.; Monk, A. The inference of perceived usability from beauty. Hum.–Comput. Interact. 2010, 25, 235–260. [Google Scholar] [CrossRef]
  61. Hung, S.-Y.; Tsai, J.C.-A.; Chou, S.-T. Decomposing perceived playfulness: A contextual examination of two social networking sites. Inf. Manag. 2016, 53, 698–716. [Google Scholar] [CrossRef]
  62. Sledgianowski, D.; Kulviwat, S. Using social network sites: The effects of playfulness, critical mass and trust in a hedonic context. J. Comput. Inf. Syst. 2009, 49, 74–83. [Google Scholar]
  63. Johnson, G.; Bruner, G.; Kumar, A. Interactivity and its facets revisited: Theory and empirical test. J. Advert. 2006, 35, 35–52. [Google Scholar] [CrossRef]
  64. Ji-Hong, P. The effects of personalization on user continuance in social networking sites. Inf. Processing Manag. 2014, 50, 462–475. [Google Scholar]
  65. Venkatesh, V.; Morris, M.G.; Davis, G.B.; Davis, F.D. User acceptance of information technology: Toward a unified view. MIS Q. 2003, 27, 425–478. [Google Scholar] [CrossRef] [Green Version]
  66. Jackson, D.L. Revisiting sample size and number of parameter estimates: Some support for the n:Q hypothesis. Struct. Equ. Model. A Multidiscip. J. 2003, 10, 128–141. [Google Scholar] [CrossRef]
  67. Norusis, M.J. Spss for Windows: Base System User’s Guide, Release 5.0; SPSS Incorporated: Chicago, IL, USA, 1992. [Google Scholar]
  68. Kaiser, H.F. An index of factorial simplicity. Psychometrika 1974, 39, 31–36. [Google Scholar] [CrossRef]
  69. Harman, H. Modern Factor Analysis; University of Chicago Press: Chicago, IL, USA, 1960. [Google Scholar]
  70. Kohli, A.K.; Shervani, T.A.; Challagalla, G.N. Learning and performance orientation of salespeople: The role of supervisors. J. Mark. Res. 1998, 35, 263–274. [Google Scholar] [CrossRef] [Green Version]
  71. Anderson, J.C.; Gerbing, D.W. Structural equation modeling in practice: A review and recommended two-step approach. Psychol. Bull. 1988, 103, 411–423. [Google Scholar] [CrossRef]
  72. Hair, J.F.; Black, W.C.; Babin, B.J.; Anderson, R.E.; Tatham, R.L. Multivariate Data Analysis; Prentice Hall: Upper Saddle River, NJ, USA, 1998; Volume 5. [Google Scholar]
  73. Nunnally, J.; Jum, N.; Bernstein, I.H.; Bernstein, I. Psychometric Theory; McGraw-Hill Companies, Incorporated: New York, NY, USA, 1994. [Google Scholar]
  74. Fornell, C.; Larcker, D.F. Evaluating structural equation models with unobservable variables and measurement error. J. Mark. Res. 2018, 18, 39–50. [Google Scholar] [CrossRef]
  75. Chin, W.W. Commentary: Issues and opinion on structural equation modeling. Commentary 1998, 22, 7–16. [Google Scholar]
  76. Hooper, D.; Coughlan, J.; Mullen, M.R. Structural equation modelling: Guidelines for determining model fit. Electron. J. Bus. Res. Methods 2008, 6, 53–60. [Google Scholar]
  77. Jackson, D.L.; Gillaspy Jr, J.A.; Purc-Stephenson, R. Reporting practices in confirmatory factor analysis: An overview and some recommendations. Psychol. Methods 2009, 14, 6. [Google Scholar] [CrossRef]
  78. Kline, R.B. Principles and Practice of Structural Equation Modeling., 4th ed.; Guilford Publications: New York, NY, USA, 2015. [Google Scholar]
  79. Whittaker, T.A. A Beginner’s Guide to Structural Equation Modeling; Taylor & Francis: Oxfordshire, UK, 2011. [Google Scholar]
  80. Hu, L.t.; Bentler, P.M. Cutoff criteria for fit indexes in covariance structure analysis: Conventional criteria versus new alternatives. Struct. Equ. Model. A Multidiscip. J. 1999, 6, 1–55. [Google Scholar] [CrossRef]
  81. Ajzen, I. Consumer attitudes and behavior: The theory of planned behavior applied to food consumption decisions. Riv. Di Econ. Agrar. 2015, 70, 121–138. [Google Scholar]
  82. Medina-Molina, C.; Rey-Moreno, M.; Periáñez-Cristóbal, R. Analysis of the moderating effect of front-of-pack labelling on the relation between brand attitude and purchasing intention. J. Bus. Res. 2021, 122, 304–310. [Google Scholar] [CrossRef]
  83. Woo, E.; Kim, Y.G. Consumer attitudes and buying behavior for green food products. Br. Food J. 2019, 121, 320–332. [Google Scholar] [CrossRef]
  84. Law, D.; Cheung, M.C.; Yip, J.; Yick, K.L.; Wong, C. Scoliosis brace design: Influence of visual aesthetics on user acceptance and compliance. Ergonomics 2017, 60, 876–886. [Google Scholar] [CrossRef] [PubMed]
  85. Guo, F.; Li, M.; Hu, M.; Li, F.; Lin, B. Distinguishing and quantifying the visual aesthetics of a product: An integrated approach of eye-tracking and eeg. Int. J. Ind. Ergon. 2019, 71, 47–56. [Google Scholar] [CrossRef]
  86. Wang, Y.J.; Cruthirds, K.W.; Axinn, C.N.; Guo, C. In search of aesthetics in consumer marketing: An examination of aesthetic stimuli from the philosophy of art and the psychology of art. Acad. Mark. Stud. J. 2013, 17, 37. [Google Scholar]
  87. Moon, J.-W.; Kim, Y.-G. Extending the tam for a world-wide-web context. Inf. Manag. 2001, 38, 217–230. [Google Scholar] [CrossRef]
  88. McShane, L.; Pancer, E.; Poole, M.; Deng, Q. Emoji, playfulness, and brand engagement on twitter. J. Interact. Mark. 2021, 53, 96–110. [Google Scholar] [CrossRef]
  89. Abbasi, A.Z.; Shamim, A.; Ting, D.H.; Hlavacs, H.; Rehman, U. Playful-consumption experiences and subjective well-being: Children’s smartphone usage. Entertain. Comput. 2021, 36, 100390. [Google Scholar] [CrossRef]
  90. Hilken, T.; de Ruyter, K.; Chylinski, M.; Mahr, D.; Keeling, D.I. Augmenting the eye of the beholder: Exploring the strategic potential of augmented reality to enhance online service experiences. J. Acad. Mark. Sci. 2017, 45, 884–905. [Google Scholar] [CrossRef]
  91. Tam, K.Y.; Ho, S.Y. Understanding the impact of web personalization on user information processing and decision outcomes. MIS Q. 2006, 30, 865–890. [Google Scholar] [CrossRef]
  92. McMillan, S. The researchers and the concept: Moving beyond a blind examination of interactivity. J. Interact. Advert. 2005, 5, 1–4. [Google Scholar] [CrossRef]
  93. Pengnate, S.; Sarathy, R.; Lee, J. The engagement of website initial aesthetic impressions: An experimental investigation. Int. J. Hum. Comput. Interact. 2019, 35, 1517–1531. [Google Scholar] [CrossRef]
Figure 1. Research structure.
Systems 10 00003 g001
Figure 2. The procedure of using POIZON APP virtual shoe-try-on function.
Systems 10 00003 g002
Figure 3. The influence between variables in the structural model.
Systems 10 00003 g003
Table 1. Measurement scale.
Latent VariableCodingItemSource
Perceived
control
PC1I can virtually try on the shoes I wish to purchase.[43,44,46]
PC2I am able to easily locate the shoes I am looking for and try them on.
PC3I can choose to ignore the shoes I am not interested in when using the virtual shoe-try-on function.
Perceived responsivenessPR1I receive immediate feedback when interacting with the virtual shoe-try-on function.[46,63]
PR2The feedback I got when interacting with the virtual shoe-try-on function met my expectations.
PR3When using the virtual shoe-try-on function to interact, I received helpful feedback.
Perceived personalizationPPS1The virtual shoe-try-on function is to a certain extent personalized.[64]
PPS2The virtual shoe-try-on function can be used in any way I like.
PPS3The virtual shoe-try-on function meets my individual needs.
AestheticsAE1An attractive presentation is provided by the virtual shoe-try-on function interface.[49]
AE2The virtual shoe-try-on functional interface is quite aesthetic in its design.
AE3I like the design of this functional interface.
Perceived playfulnessPPF1I am curious about the virtual shoe-try-on function.[49]
PPF2The virtual shoe-try-on function is very interesting to me.
PPF3While using the virtual shoe-try-on function, I did not feel the passing of time.
AttitudeAT1Having used the virtual shoe-try-on function, I have a positive opinion of it.[65]
AT2The virtual shoe-try-on function provides valuable services.
AT3It is a pleasant experience to use the virtual shoe-try-on function.
Continuance intention to useCI1Rather than abandoning the virtual shoe-try-on function, I intend to use it continuously.[36]
CI2I intend to use the virtual shoe-try-on function more frequently.
CI3If I purchase shoes again, I plan on using the virtual shoe-try-on function.
Table 2. Basic data of the respondents.
SampleCategoryNumberPercentage
GenderMale11841.26
Female16858.74
Grade in CollegeFreshman6422.38
Sophomore5719.93
Junior6322.03
Senior4616.08
Master’s degree or above5619.58
Table 3. Reliability analysis.
ConstructItemCorrected Item-to-Total CorrelationCronbach’s α after DeletionCronbach α
Perceived controlPC10.7390.7650.847
PC20.7860.716
PC30.6260.870
Perceived responsivenessPR10.6890.8120.848
PR20.7390.766
PR30.7210.783
Perceived personalizationPPS10.7070.8010.849
PPS20.7480.765
PPS30.7090.805
AestheticsAE10.6910.8100.847
AE20.7710.730
AE20.6860.815
Perceived playfulnessPPF10.7330.7980.857
PPF20.7790.755
PPF30.6840.847
AttitudeAT10.7820.7860.869
AT20.7270.836
AT30.7430.823
Table 4. The results of exploratory factor analysis.
ConstructKMOBartlett Sphere TestItemCommonalityFactor LoadingEigenvalueTotal
Perceived control0.6890.000PC10.7960.8922.30376.781%
PC20.8400.916
PC30.6680.817
Perceived responsiveness0.7270.000PR10.7390.8602.30176.713%
PR20.7900.889
PR30.7730.879
Perceived personalization0.7290.000PPS10.7580.8712.31577.152%
PPS20.7980.893
PPS30.7580.871
Perceived playfulness0.7180.000PPF10.7850.8862.34078.009%
PPF20.8270.909
PPF30.7280.853
Aesthetics0.7110.000AE10.7430.8622.30076.654%
AE20.8220.906
AE20.7350.857
Attitude0.7340.000AT10.8240.9082.37979.312%
AT20.7700.878
AT30.7850.886
Continuance intention to use0.7460.000CI10.8170.9042.44881.614%
CI20.8320.912
CI30.7990.894
Table 5. The results of the Measurement Model.
ConstructItemStd.p-ValueAVECR
Perceived controlPC10.839 0.6670.855
PC20.9140.000
PC30.6810.000
Perceived responsivenessPR10.776 0.6530.849
PR20.8230.000
PR30.8230.000
Perceived personalizationPPS10.789 0.6540.850
PPS20.8570.000
PPS30.7870.000
Perceived playfulnessPPF10.824 0.6710.859
PPF20.8860.000
PPF30.7510.000
AestheticsAE10.781 0.6580.852
AE20.8850.000
AE20.7580.000
AttitudeAT10.874 0.6930.871
AT20.8030.000
AT30.8170.000
Continuance intention to useCI10.864 0.7230.886
CI20.8670.000
CI30.8220.000
Table 6. Discriminant validity for the measurement model.
PCPRPPSPPFAEATCI
Perceived control0.817
Perceived responsiveness0.3320.808
Perceived personalization0.3440.3310.809
Perceived playfulness0.2830.2850.3430.819
Aesthetics0.2960.3600.3340.3690.811
Attitude0.1980.3210.3650.3220.3810.832
Continuance intention to use0.2100.2980.3370.4250.3190.4010.850
Note: The items on the diagonal on bold represent the square roots of the AVE.
Table 7. Model fit indices.
Common Indicesχ2/dfRMSEACFINFINNFI
Judgment criteria<3<0.10>0.9>0.9>0.9
Value1.9620.0580.9480.9010.939
Common IndicesTLIIFISRMR
Judgment criteria>0.9>0.9<0.1
Value0.9390.9490.09
Table 8. Regression coefficient.
DVIVUnstdS.E.Unstd./S.E.p-ValueStd.R2
AEPC0.0830.0621.3290.1840.0920.272
PPS0.2290.0693.3170.0010.243
PR0.2930.0674.3500.0000.322
PPFPR0.1960.0752.6330.0080.1920.220
PC0.1310.0721.8340.0670.130
PPS0.2940.0793.7190.0000.278
ATAE0.4360.0815.3890.0000.3570.250
PPF0.2990.074.2720.0000.275
CIAT0.4460.0627.2500.0000.4740.225
Note: ← represents the path relationship.
Publisher’s Note: MDPI stays neutral with regard to jurisdictional claims in published maps and institutional affiliations.

