1. Introduction
Belt and Road Initiative (BRI) is a transcontinental long-term policy and investment program which aims at infrastructure development and acceleration of the economic integration of countries along the route of the historic Silk Road. The initiative was unveiled in 2013 by China‘s President Xi Jinping.
At present, China has entered the “New Normal” development stage of the economy, and the BRI is being implemented in depth. In March 2015, China issued an action plan which described the main objectives of the BRI. The BRI-participating economies represent more than one-third of global GDP and over half of the world’s population. In September 2016, General Secretary Jinping Xi pointed out in the keynote speech at the opening ceremony of the B20 Summit (a major support group for the G20 from industrial and commercial circles): “China’s development benefits from the international community and is willing to provide more public goods to the international community. China has proposed the ‘One Belt and One Road Initiative’, which aims to share China’s development opportunities and achieve common prosperity with countries along the routes.” China is actively promoting the economic development of BRI-related nations, supporting and driving domestic superior and surplus production capacity to countries/regions that have fewer comparative advantages. Finally, to construct a fair and reasonable international order, China will offer both value ideas and institutional design ideas that reflect Chinese wisdom and China’s plans.
BRI is based on the concept of mutually beneficial cooperation [
1]. It plays an important role in foreign direct investment, infrastructure, international cooperation, and economic growth in countries along the route [
2,
3,
4,
5,
6]. According to the report “Building the Belt and Road Initiative: Progress, Contribution and Prospects” released by the Ministry of Commerce in April 2019, the BRI has gained the support of 125 countries and 29 international organizations for its construction. According to the data published by the World Bank, the combined GDP of the countries along the BRI in the five years after its introduction (2013–2017) was 141 trillion dollars, which is 39.6% higher than that in the five years before the initiative (2008–2012). In addition, the World Bank Group’s 2019 release “The Belt and Road Economy: Opportunities and Risks of Transport Corridors” quantifies the impact of the Belt and Road. According to the article, the Belt and Road can expand trade, increase foreign investment, and reduce poverty by reducing trade costs. Full implementation of the Belt and Road Initiative could increase world trade by 1.7% to 6.2% and global real income by 0.7% to 2.9%.
Rapidly promoting China’s position and competitiveness on the Global Value Chain (GVC) and shaping new comparative advantages in the context of BRI is either the important guarantee for the continuous and in-depth development of Global Cooperation on Production Capacity strategy or the realistic requirement for China’s industrial restructuring and factor allocation optimization at this stage. BRI aims to build an open, inclusive, and balanced regional economic cooperation architecture for the 21st century, strengthen the weak points of globalization, and transform partial globalization into an inclusive one. Under this context, there is an urgent need to rationally distribute international productivities to enhance the competitive advantages of both China and BRI-related nations. Therefore, how to realize the positive interaction between China’s industrial structure and foreign trade upgrade in the process of international economic integration and BRI, and how to fully utilize the institutional dividend brought by such a cooperative strategy to build a new regional trade system, will definitely be the key research direction at the national strategic level for a long period in the future.
Based on a mature industrial system, the high-cost performance of equipment capacity, mighty construction abilities, enhancement on the international capacity cooperation with nations along the route, are feasible ways for China to achieve mutual benefits and the win-win goal. Nevertheless, the paradox is that international public opinion has many doubts and even dissatisfaction with China’s BRI. Some countries believe that the BRI is China’s economic plunder of countries along the route, and it is a Chinese version of the Marshall Plan. It has become an important driving factor for the threat inflation phenomenon of some Western countries’ perception of China. In recent years, some countries have implemented a series of measures to weaken China’s role and status on the GVC. The U.S. plans to start investing in 5 to 10 major infrastructure projects around the world in 2022 as part of the Group of Seven (G7) Build Back Better World (B3W) program to counter China’s BRI. The EU and the UK have launched similar programs to invest in global infrastructure. The Global Gateway Initiative and the Clean Green Initiative have been proposed so that less developed countries will opt out of the streamlined and unconditional BRI. These approaches are equivalent to treating international trade as a zero-sum game, thus failing to achieve a win-win goal. Of course, under the perspective of systems science, it is impractical and will inevitably lead to negative impacts flowing along the GVC and ultimately leading to a decline in the global competitiveness of the industrial sectors within many countries. Accordingly, our econophysics framework will be adopted to simulate the international trade process under different policy backgrounds and development scenarios. We hope the network-based measurements proposed in this paper can be used as the evaluation criteria to deeply understand the policymaking of international trade and its long-term consequences.
As the result of globally economic integration, various countries and regions in the world have gradually formed a global economic system through increasingly deepened trade exchanges with each other. As the subsystems of this system, countries in the world have also evolved their internal
Industrial Value Chains (IVCs) as an organic whole, and they play a specific role on a global scale. Therefore, economists began to systematically and comprehensively study global macroeconomic issues from the perspective of system theory. The GVC network reflects the topological structure of the global economic system, depicts the vertical division of labor and complex input–output relationships in global industrial sectors, and provides a theoretical framework and application basis for analyzing global economic issues. The popularization and promotion of the
Inter–Country Input–Output (ICIO) database provides scientific and accurate data for studying the important role of various industries and economies on the GVC network. The IO table can be directly or slightly modified as an adjacency matrix to establish a network model [
7], and measure the importance of industrial sectors through network characteristic indicators.
Input–Output Analysis (IOA) can be performed on issues such as the impact of consumption shocks [
8] on the economic system and the balance of supply and demand [
9] in a free market economy. Sectoral production characteristics, such as the degree of industrial sector participation in vertical specialization trade [
10], the number of stages required for production on the GVC and the stage between production and final consumption [
11], are measured. In recent years, Wang, et al. proposed a series of indicators such as average production length and relative upstream degree [
12] to measure the production structure of each economy. Xu et al. combined the input–output model with the social network analysis method to measure the economic structure in the global economic system [
13]. Yang et al. established a community detection optimization algorithm based on biogeography to find the community structure in the network [
14]. Piccardi et al. evaluated the importance of communities in the world input–output network based on the random walk Markov chain method [
15]. Guan et al. established a global industrial resource competition network model based on the bibliographic coupling method to analyze the competitive relationship between industrial sectors [
16]. Xing et al. used the Markov process to measure the degree of globalization [
17] and industrial influence [
18] of the industrial sectors and based on the Revised Floyd–Warshall Algorithm (RFWA), proposed the Strongest Relevance Path Length (SRPL) algorithm to measure the pivotability degree [
19] of the input–output relationship between sectors and connectivity and tightness [
20] of the value chain network. At the same time, the competition and cooperation relations [
21] between industrial sectors are also described through the citation network, but the relationship generated in the citation network lacks precise similarity.
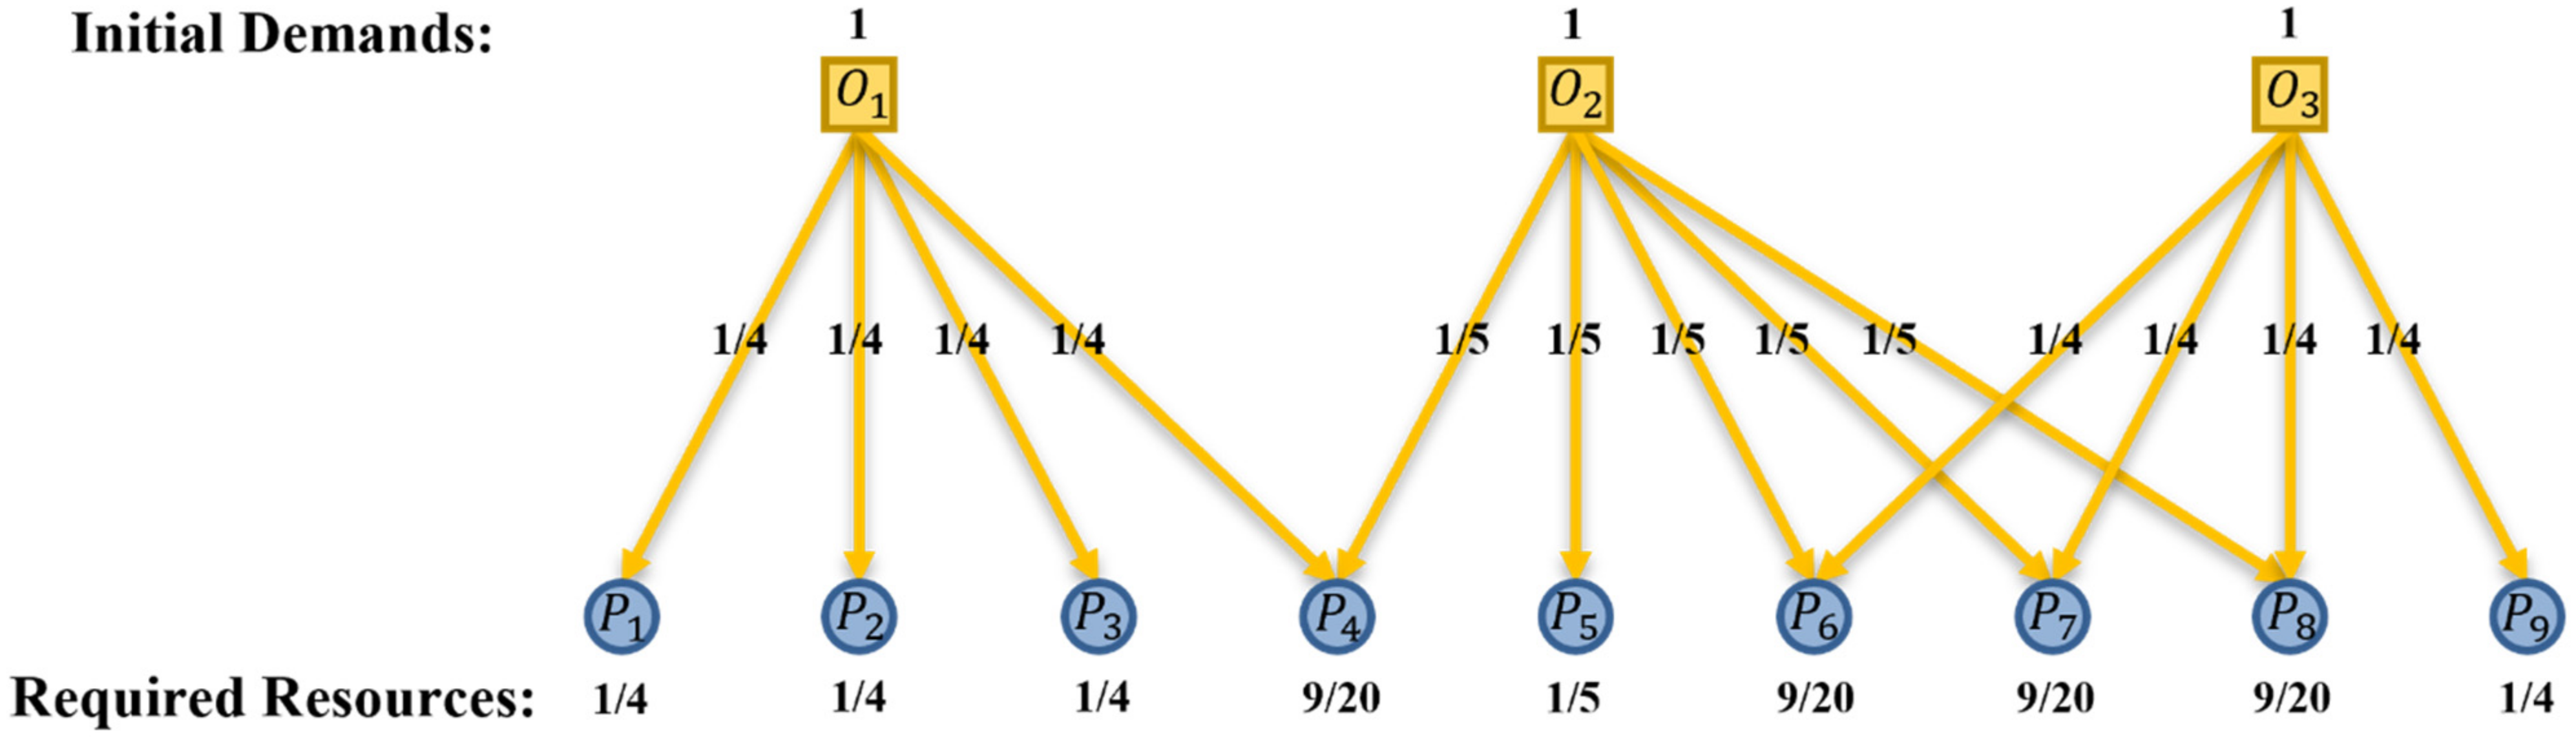
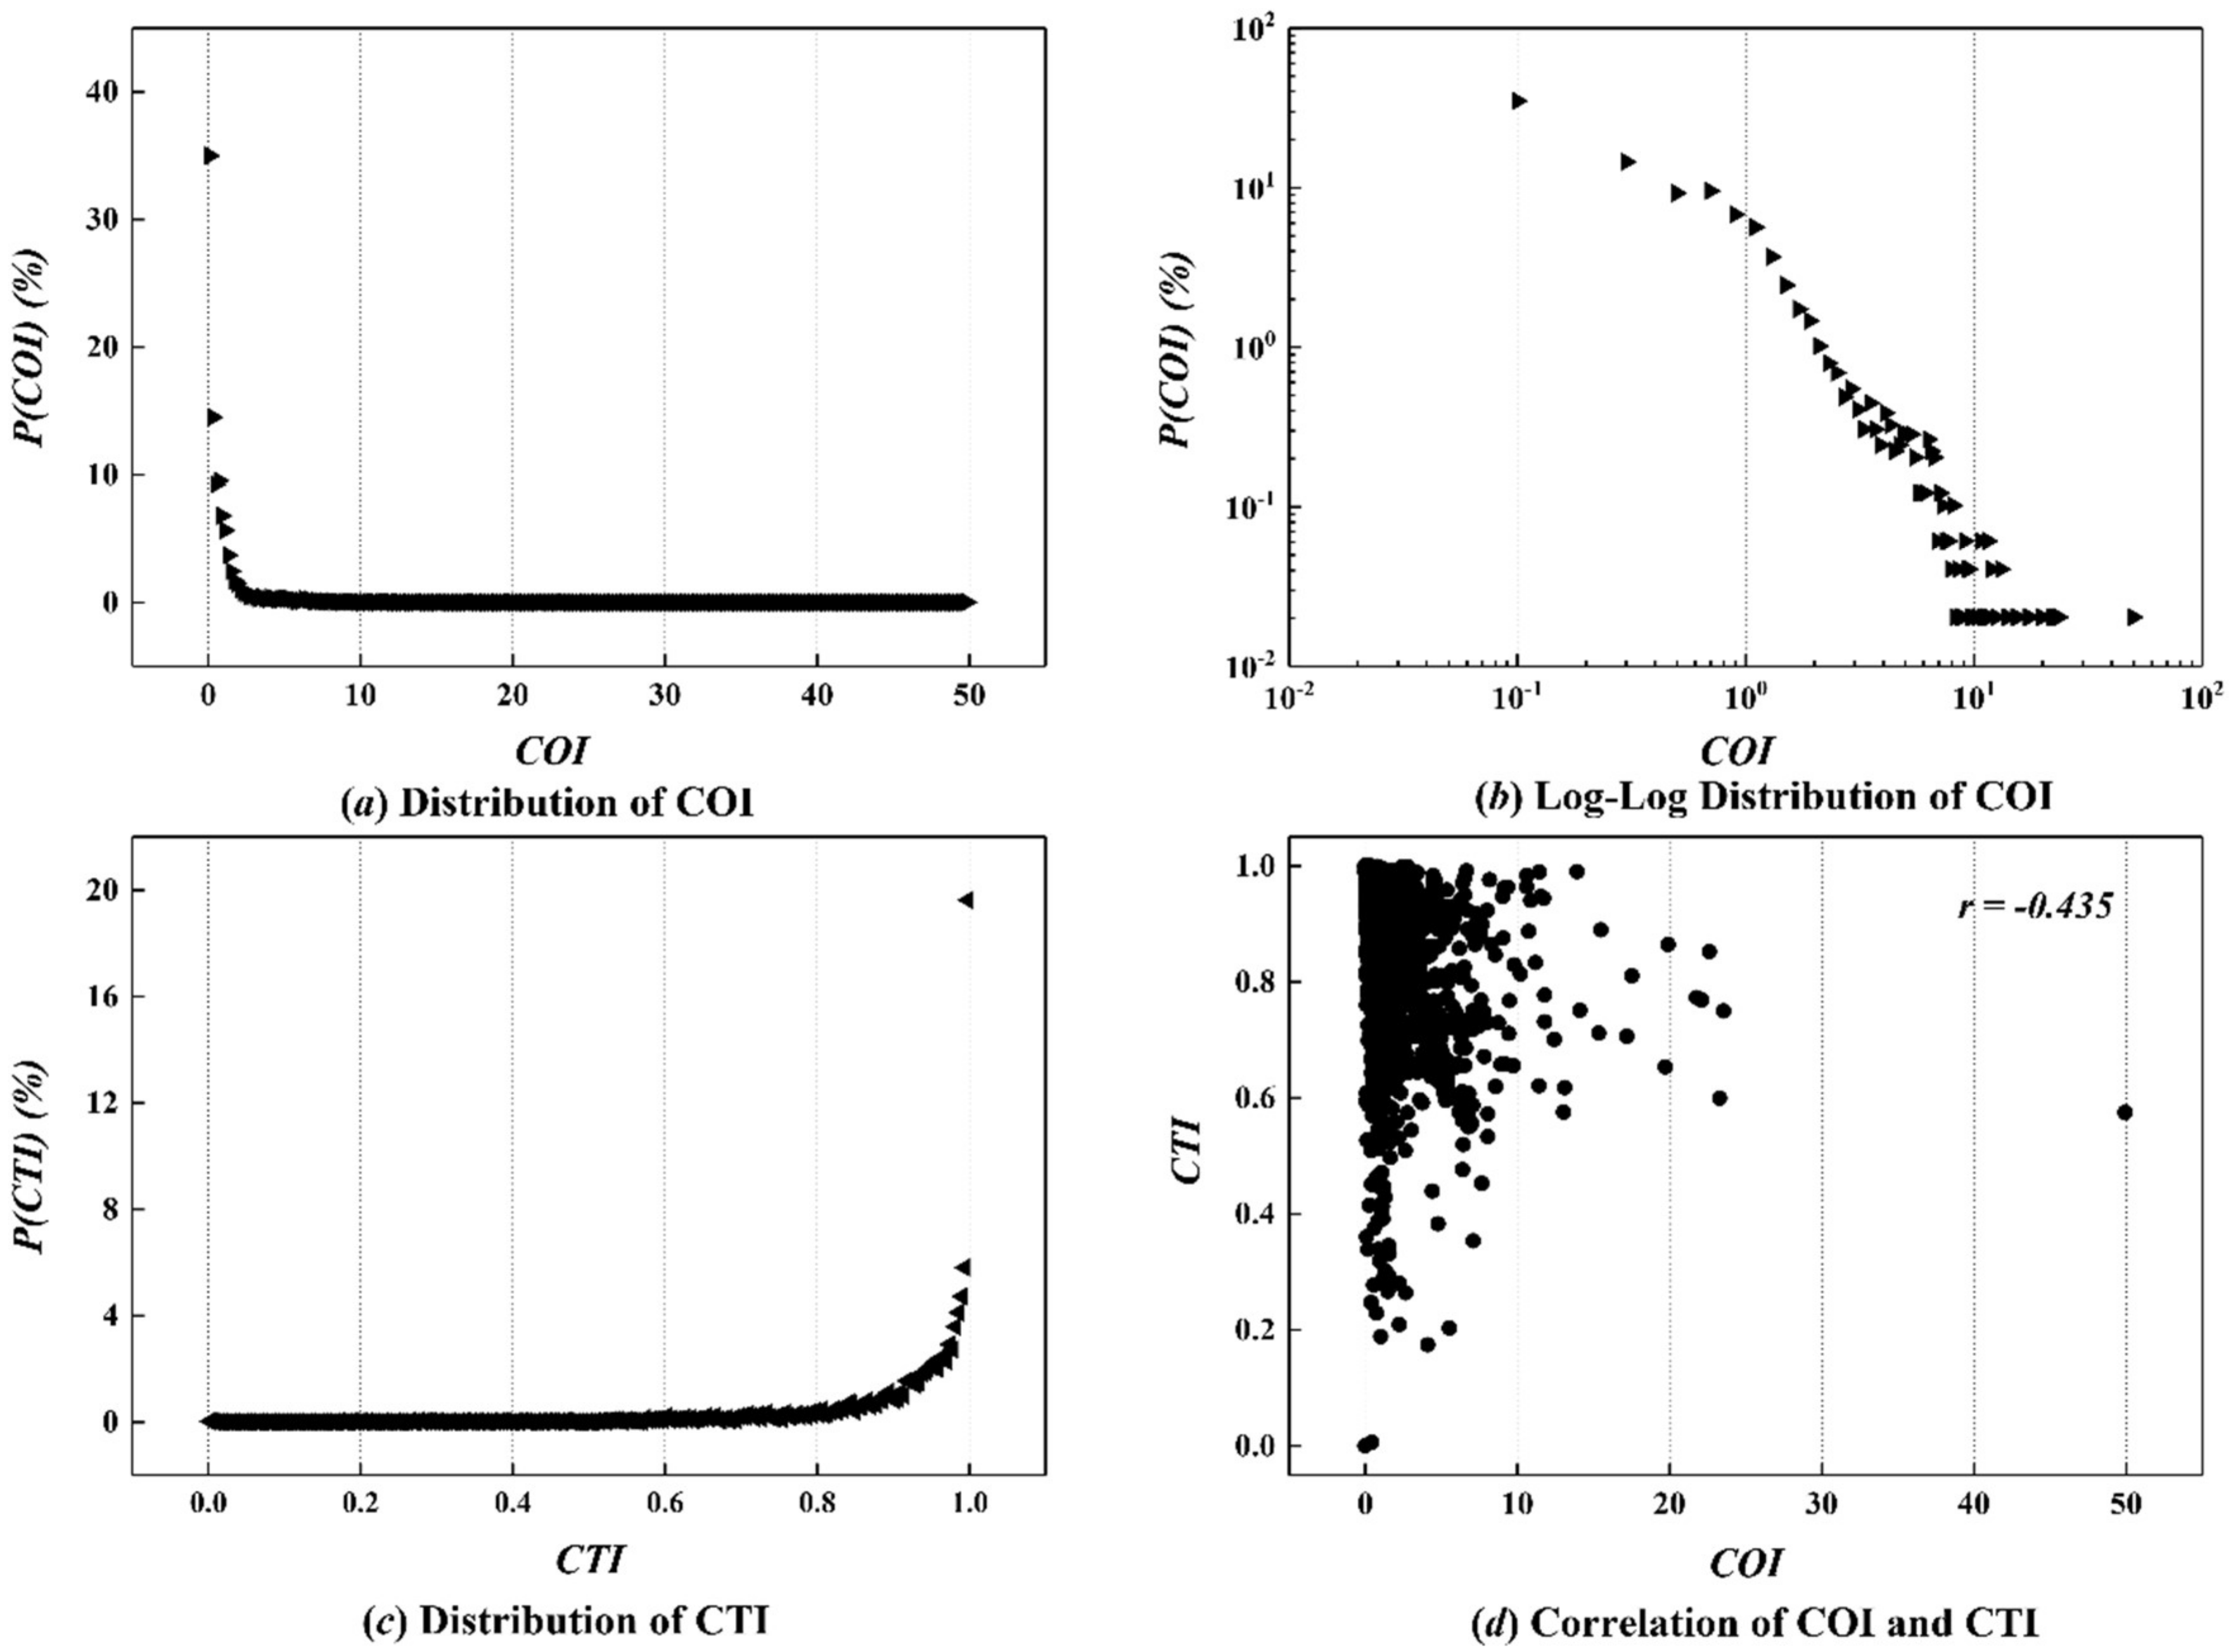
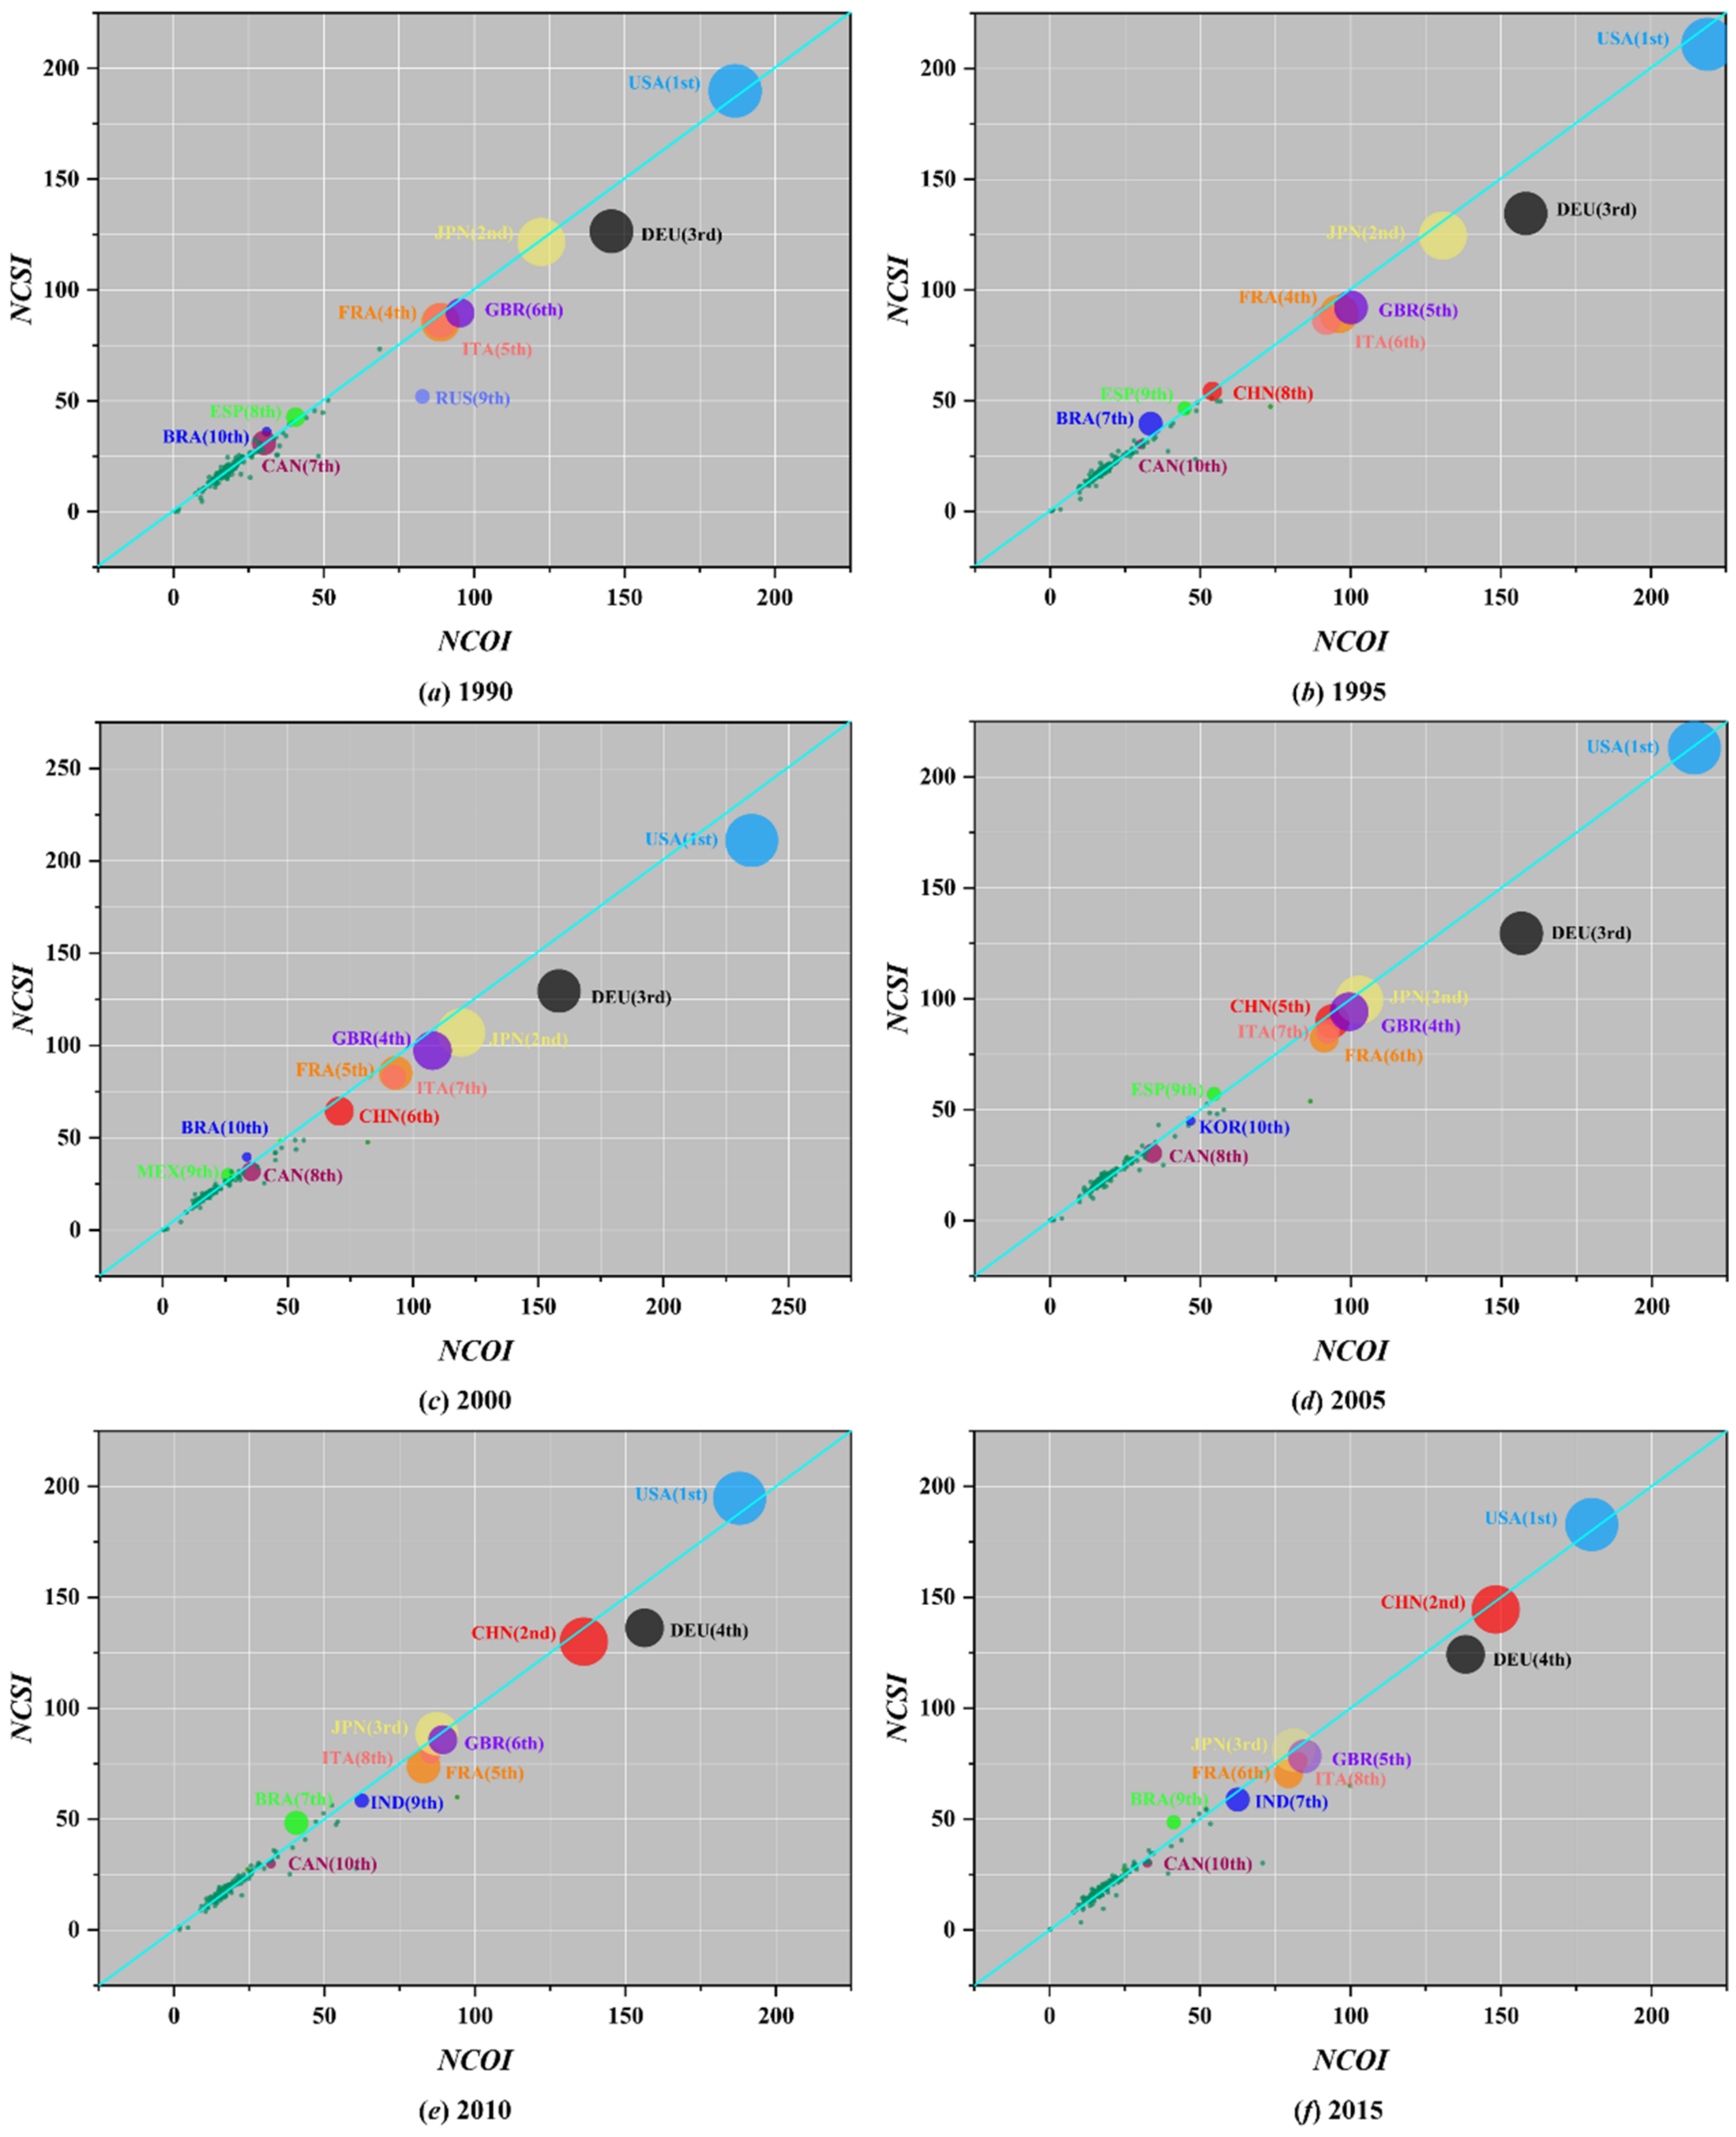
In the first section of the paper, the development status of the BRI and the research on the input–output relationship between various industrial sectors on the GVC are presented. In the second section, the Global Production Capacity Collaboration Network (GPCCN) model is formulated. The model is based on the bipartite graph theory, on the resource allocation process and on the selection of research data. In the third section are introduced two indicators: the Collaborative Opportunity Index (COI) and the Collaborative Threat Index (CTI) from the national and sectoral levels based on the GPCCN model. The indicators measure the state of cooperation between countries and sectors, and at the same time, measure the correlation between COI and Competitive Strength Index (CSI) at the national level. In the fourth section, scenario simulations are carried out in order to forecast the potential and trends of international capacity cooperation within Asian, European, and African nations related to the Belt and Road Initiative. In the fifth section, the laws and reasons for the differences in cooperation among BRI-related nations are explained. In the last section, the main contributions of the paper are summarized and some new directions for the research are indicated.
4. Simulations
Three sets of scenario simulations have been designed to observe the effects on national collaborative opportunities of both China and main BRI-related nations under international trade fluctuation in GIVCN and GPCCN models. If the new trade policy was signed or the original trade one was withdrawn between two countries, there will be three possibilities for the volume of import and export trade between them as tariffs may change [
30]:
Scenario I: increases or decreases its export to while its counterpart remains stable.
Scenario II: increases or decreases its export to while its counterpart remains stable.
Scenario III: Both parties increase or decrease its export to the counterpart simultaneously (there is no need to distinguish X and Y under this scenario).
Considering that the meaning of BRI is to promote interconnection and trade prosperity for all interested parties, we choose Scenario III as the only possibility. Then, simulations are carried out by increasing the volume of bilateral trade between two given nations from 0% (disruption of both import and export trades) of the initial value to 100% (gross value of trade in the ICIO table), and further up to 200% (both import and export trades doubled) in the specific GIVCN–BRI model, with every 10% as intervals. In the meanwhile, calculations on their NCOIs will be repeated in the corresponding GPCCN–BRI model, and simulation curves are acquired in this way for both parties of and .
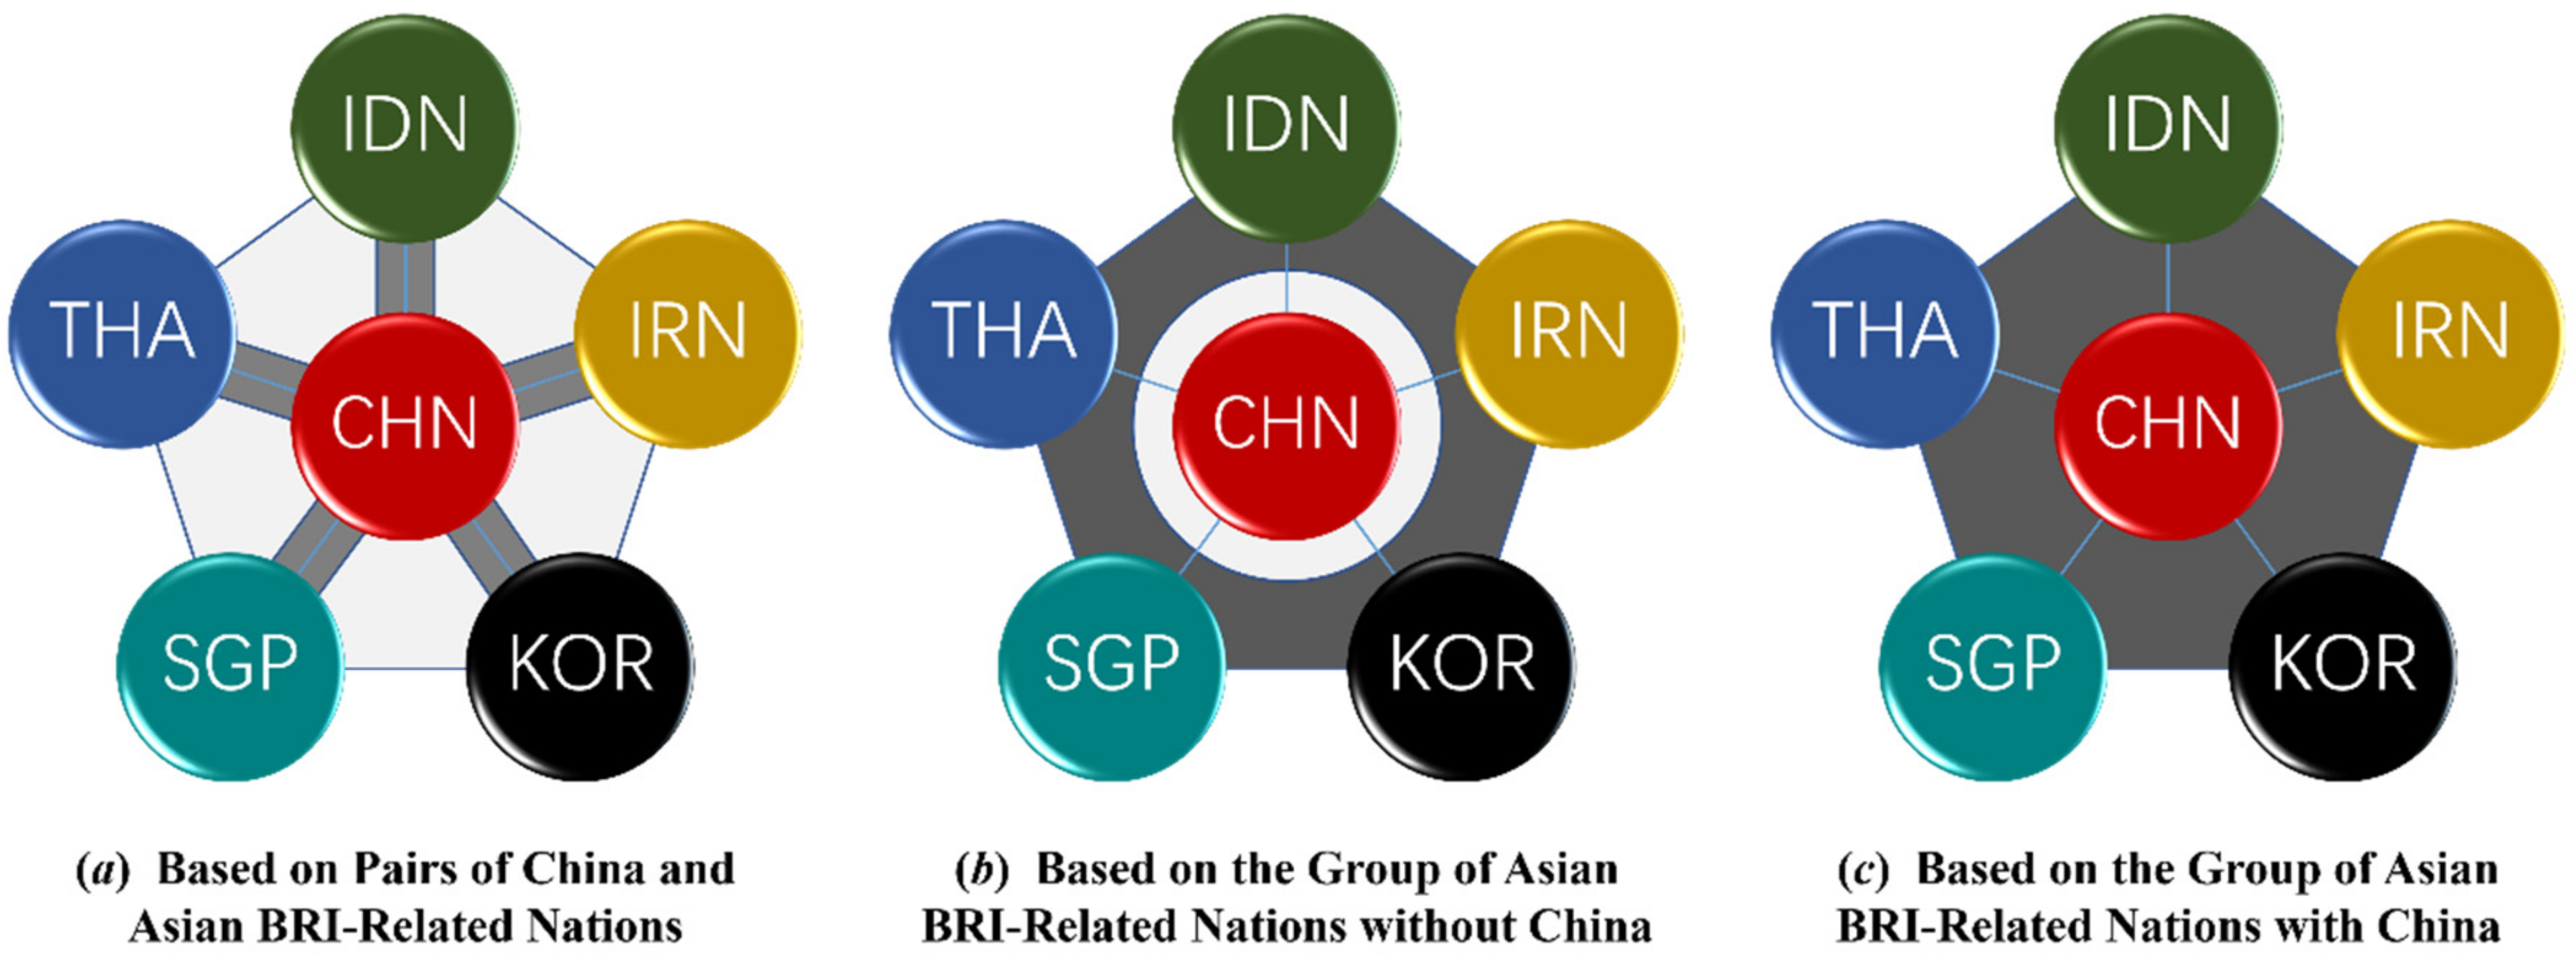
Despite trade volumes, we also need to consider the possible trade agreements, which have a more significant influence on international trade itself. We set three kinds of cases to observe how the collaborative status of China and BRI-related nations will change as shown in
Figure 10.
Case A: China strengthens its trade collaboration with the others, respectively—As in the initial stage of BRI, China needs to establish mutually beneficial and collaborative relations with one country after another, in order to promote its transfer of excess production capacity.
Case B: Other nations bypass China to form an economic community—This is an undesirable situation for China since its economic development driven by foreign trade will be hindered, just like the TPP initiated by the United States.
Case C: All the nations strengthen the trade collaboration in between under a unified trade agreement—The newly formed RCV will be more beneficial to some nations than in other cases.
Based on these cases under Scenario III, this section lists the
NCOI trends of the major economies (China and the top five countries in
NCOI) in the GPCCN–BRI–2015 models with China as the core. As shown in
Figure 11,
Figure 12,
Figure 13,
Figure 14,
Figure 15,
Figure 16,
Figure 17,
Figure 18 and
Figure 19, the slope of the simulation result curve represents the elasticity of industrial collaborative ability to changes in trade volume. We try to find a better solution for both China and BRI-related nations in consideration of a win-win outcome.
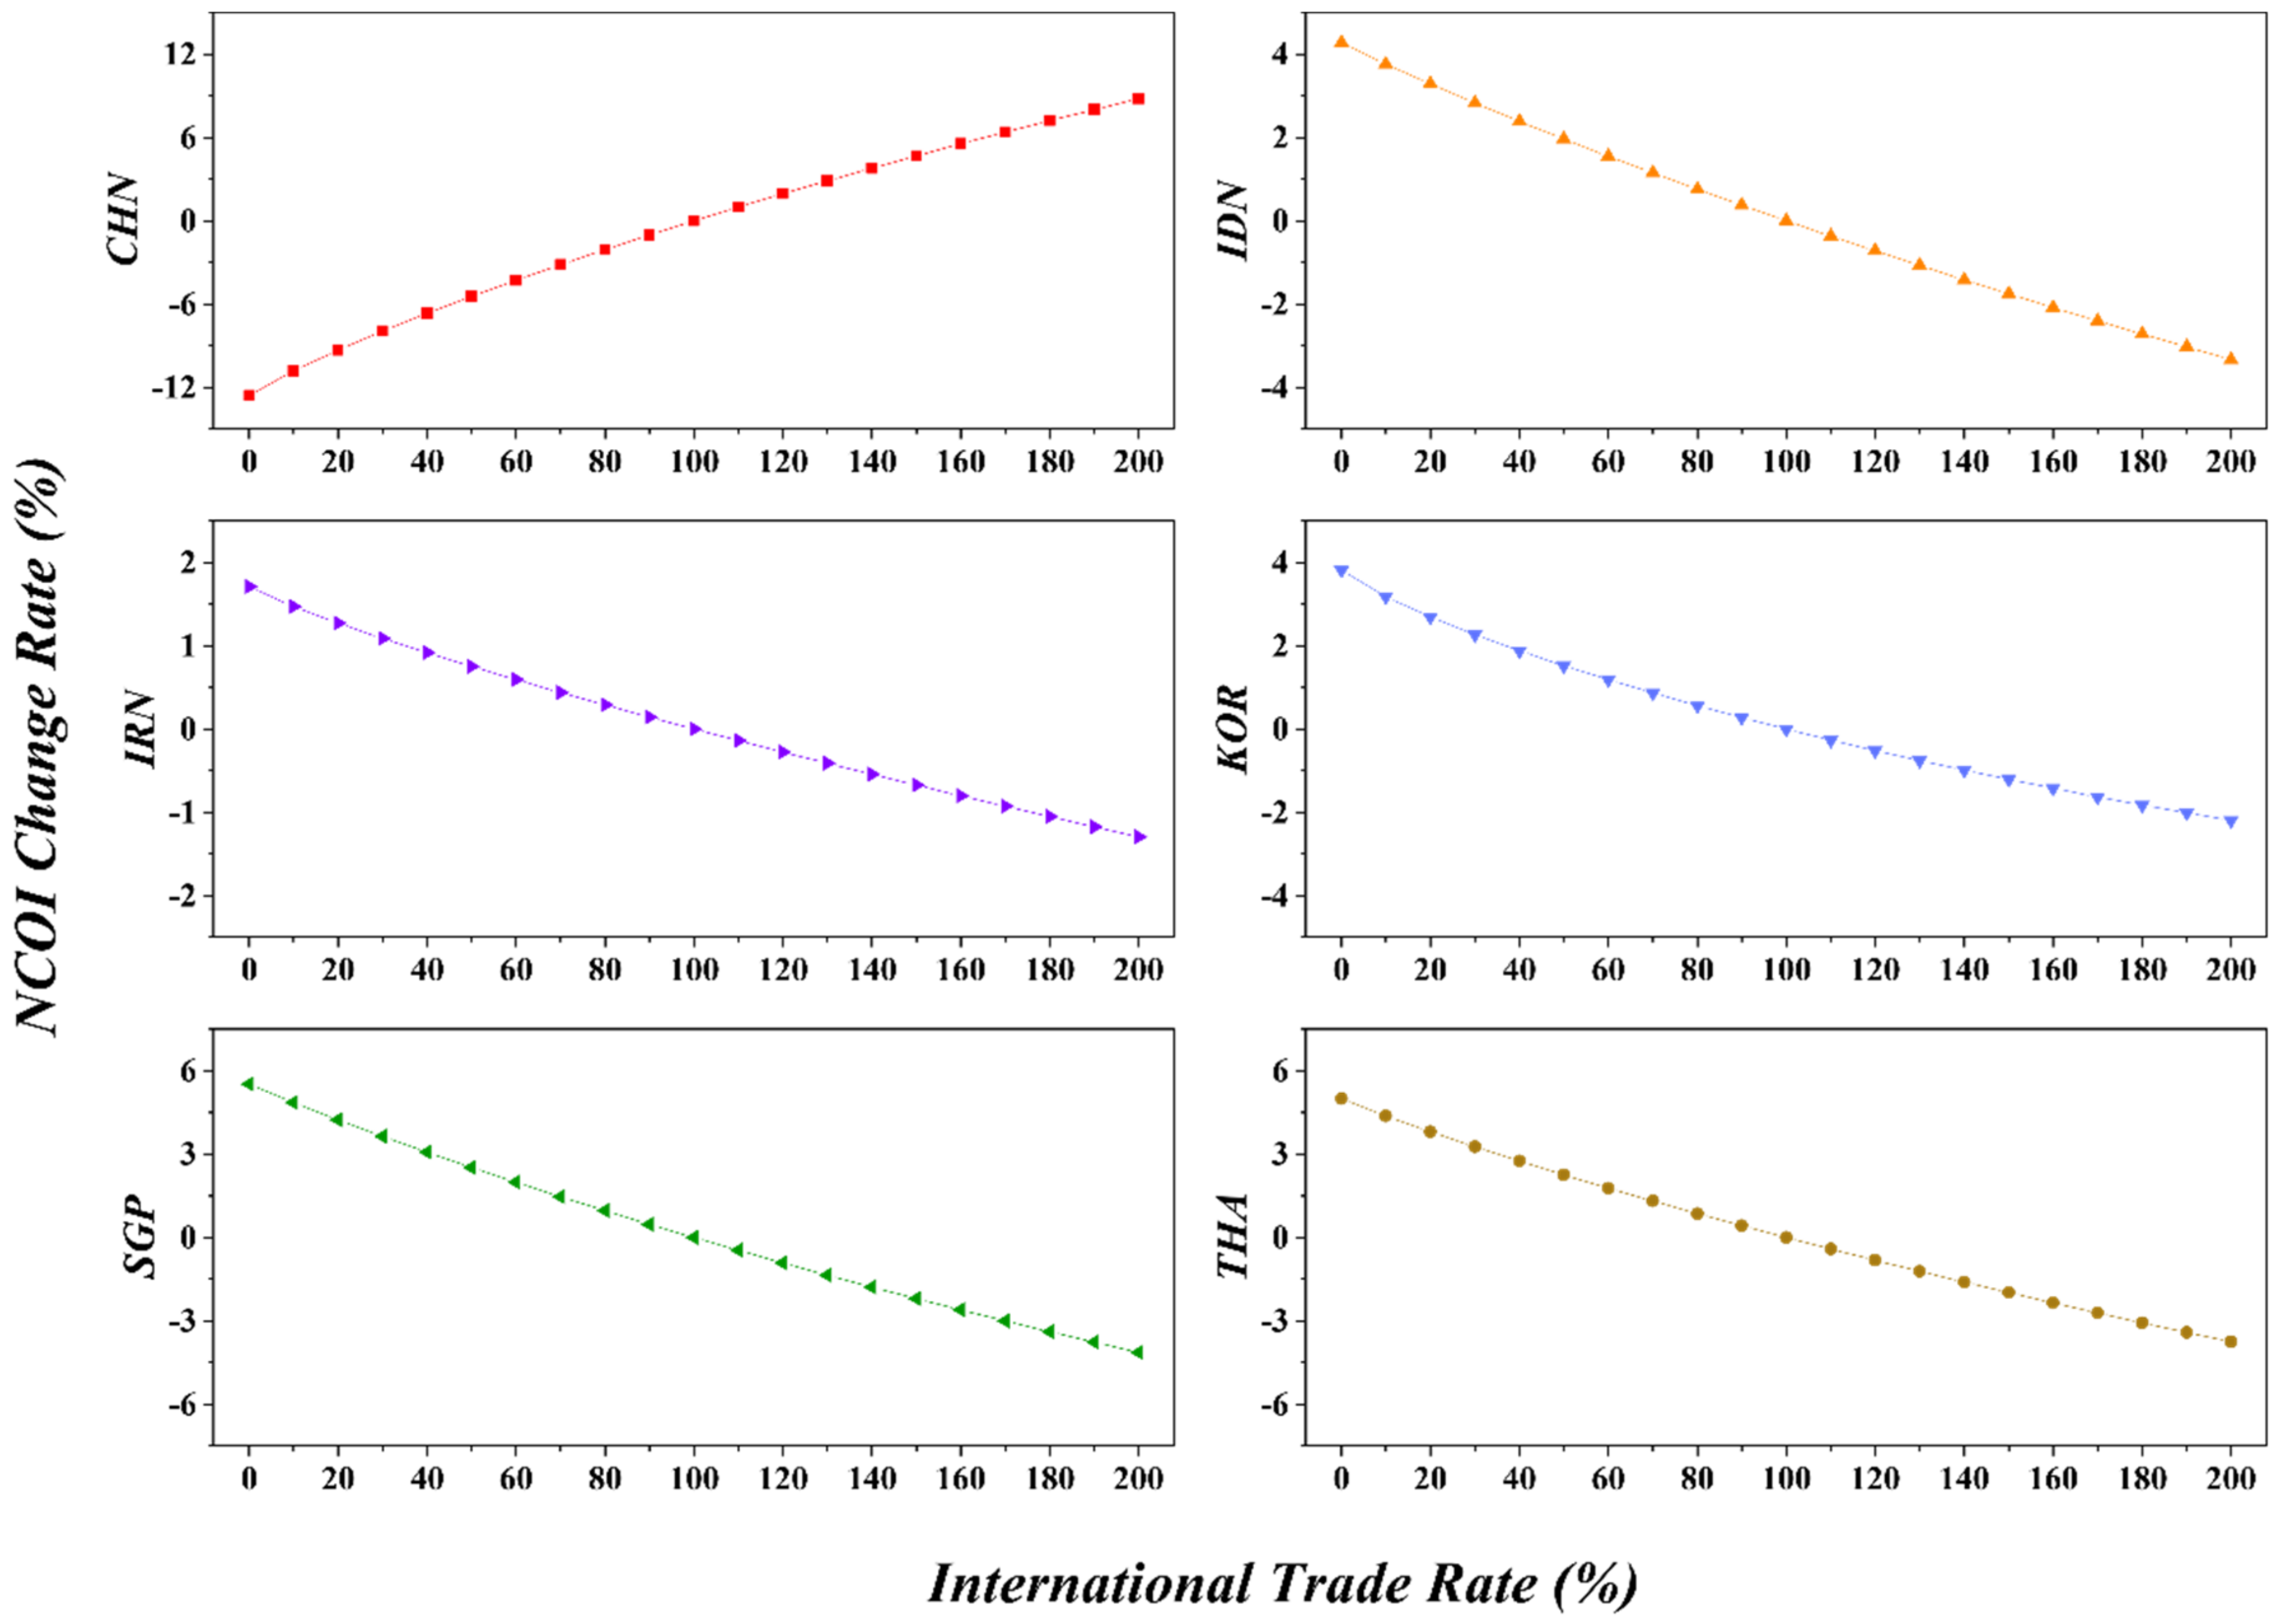
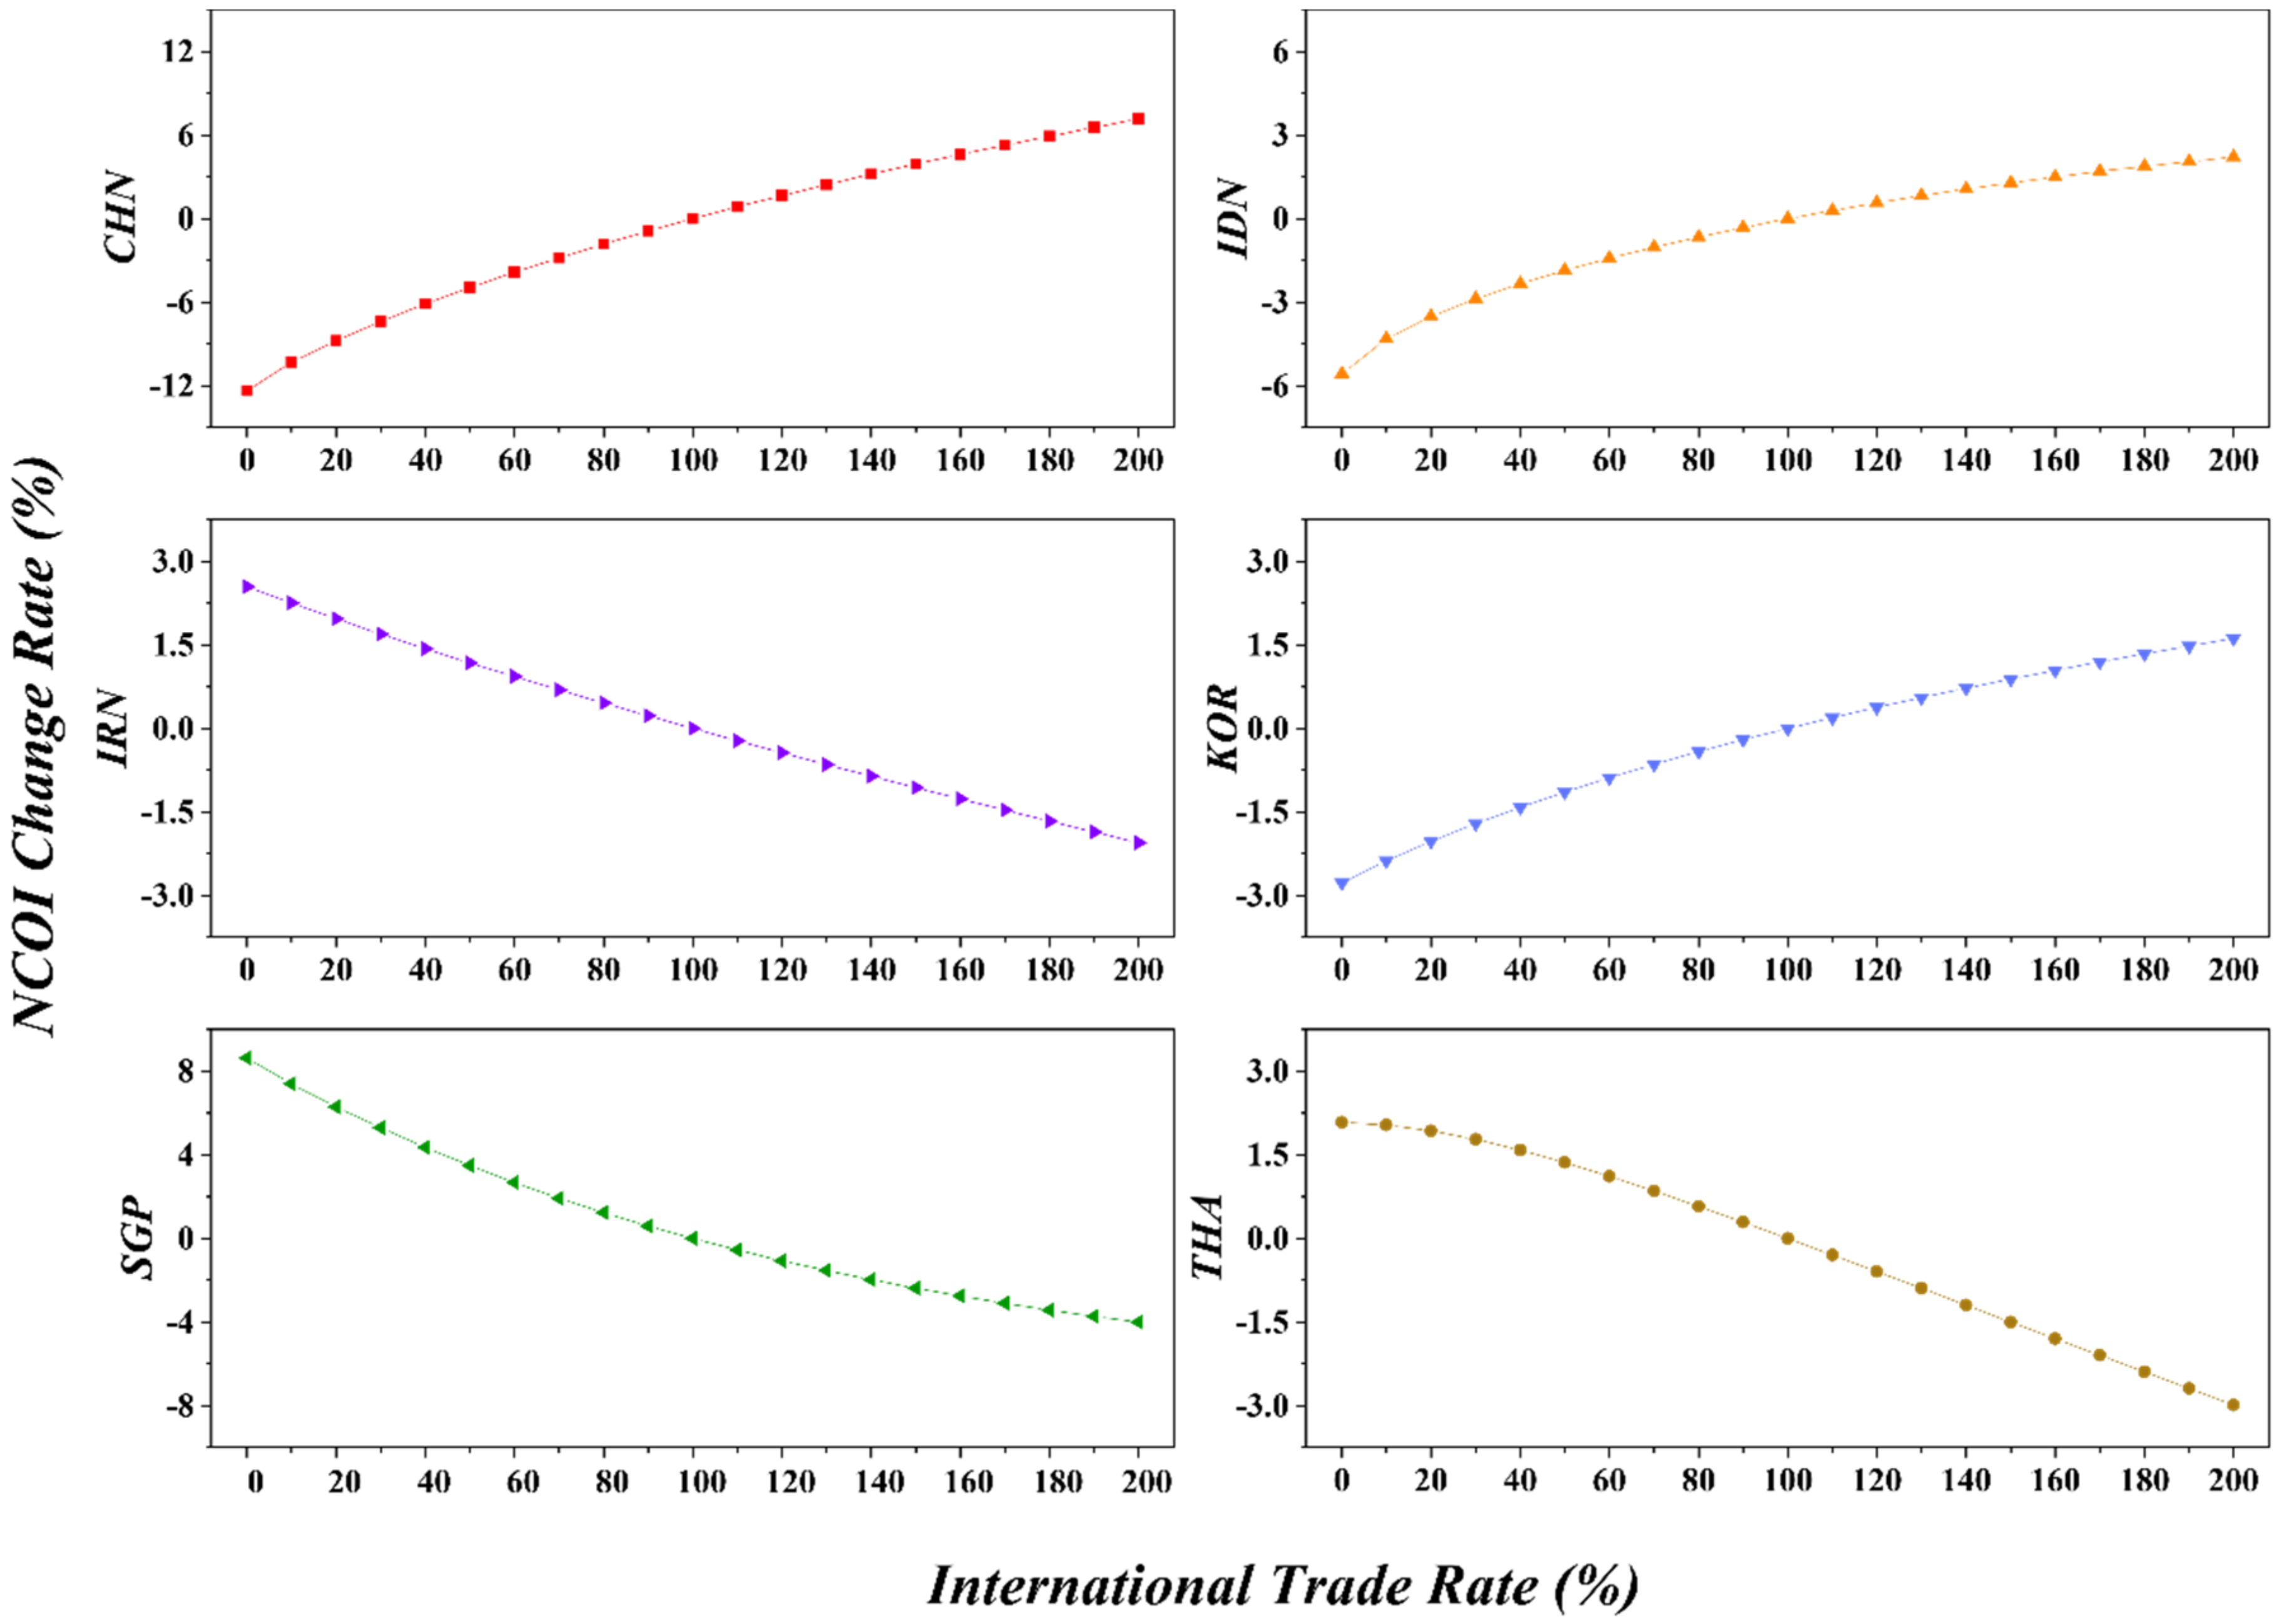
4.1. Simulation on Asian Nations
According to the simulation results in
Figure 11,
Figure 12 and
Figure 13, we find that: (1) In Case A, China’s
NCOI sharply increases as the volume of international trade goes up, while other countries decrease to varying degrees; (2) In Case B,
NCOIs of China, Iran (slightly), and Singapore decrease, while Indonesia (sharply), Korea (sharply) and Thailand (slightly after the trade rate is positive) increase; (3) In Case C,
NCOIs of China (sharply), Indonesia (sharply), and Korea increase, while Iran, Singapore (sharply), and Thailand decrease.
Figure 11.
Influence on China and main Asian nations in Case A.
Figure 11.
Influence on China and main Asian nations in Case A.
Figure 12.
Influence on China and main Asian nations in Case B.
Figure 12.
Influence on China and main Asian nations in Case B.
Figure 13.
Influence on China and main Asian nations in Case C.
Figure 13.
Influence on China and main Asian nations in Case C.
Next, we will specifically analyze the production capacity cooperation potential between China and major Asian countries.
Though hit by the financial crisis in 2008, Indonesia’s economy managed to maintain a relatively fast growth rate, being the largest and fastest growing in Southeast Asia. Yet in recent years, its economic growth has slowed due to the shrunk volume of imports and exports significantly affected by global demand and prices. As a large agricultural country, Indonesia is the third largest producer of rice and the second largest producer and exporter of palm oil in the world. In the industrial sector, it is dominated by mining, oil and gas, textile, and light industry. China and Indonesia are highly complementary in various fields of industrialization and enjoy a wide scope for cooperation. Not only does Indonesia have a strong willingness to cooperate with China in production capacity, but Chinese companies are also quite attracted to the potential market and fastest growing economy in the southeast region. Chinese investment in Indonesia has mainly taken advantage of its infrastructure needs and labor force, focusing on infrastructure construction, energy development, palm oil plantation industry, and labor-intensive manufacturing industries such as textiles and cell phone assembly.
As one of the major economies in Asia, Iran’s economic strength is second only to Saudi Arabia in the Middle East area, and its total population second only to Egypt, making it a pivotal regional power. The industrial structure of Iran is relatively simple, with the oil industry dominating the national economy. However, suffering from the long-lasting economic sanctions from Europe and the United States, its crude oil exports have been greatly restricted. The Iranian government has been increasing trade with other countries in recent years to revive the export trade volume, so as to free its economy from dependence on oil exports by increasing the income from non-oil products. China has been Iran’s top trading partner for eleven consecutive years, and there is great room for economic cooperation between the two countries. In the energy sector, with its abundant oil and gas reserves, Iran has prioritized the attraction of foreign investment and technology in the oil and gas sector, and meanwhile, China boasts advanced technology and rich experience in energy exploration, exploitation, and equipment export. In the field of infrastructure construction, the current focus of economic and trade cooperation between China and Iran is closely based on interconnection and international production capacity cooperation, carrying out the construction of infrastructure, steel, electricity, railroads, and other projects. In the field of trade, Iran has been able to play the role of a trade hub in Eurasia thanks to its advantages as a transportation hub and a major re-exporting country, and the established free trade zones and special economic zones in Iran have provided convenient conditions and platforms for Chinese enterprises to make a direct investment. In the manufacturing sector, China is promoting the participation of China-invested enterprises with world-leading technologies in the construction of Iran’s high-tech industries, such as high-speed rail, satellite, communications, and nuclear power, to meet the huge demand for manufacturing products in Iran’s domestic market. Overall, the economies of China and Iran are highly complementary. As the BRI progresses, cooperation between the two countries in energy, infrastructure, transportation, communications, machinery manufacturing, and agriculture will be further deepened.
Korea witnessed an economic boom since the 1970s, and then was hit by the Asian financial crisis in 1997, dragging its economy into a stage of medium-rate growth. Due to the limited natural resources, its industrial structure is dominated by manufacturing and services industries. Its manufacturing industry is mainly technology- and knowledge-intensive, and has strong international competitiveness in shipbuilding, automobiles, electronics, and steel, yet the industrial materials of which are all dependent on imports. With China being Korea’s top trading partner, the two countries enjoy broad prospects for cooperation in the manufacturing sector. As China’s industrial structure gradually upgrades, China and Korea are mainly trading on high value-added electromechanical products, and the trading structures of the two countries are highly similar. The establishment of China–Korea FTA will further deepen the trade and investment between the two countries, form strong synergy in manufacturing industries, and become a new growth engine for multilateral cooperation in the Asian region, regional trade markets, and regional industrial development. China and Korea can cooperate more extensively in the future in emerging industries such as the Internet, and also in energy development, finance, and power grid construction in the Asian region.
With its well-developed services sector, Singapore is the fourth largest international financial center and the third largest foreign exchange trading center in the world. The three sectors account for less than 1%, 30%, and 70% of GDP, respectively. Singapore’s unique geographical location has contributed to its status as a world powerhouse in the marine industry; high-quality logistics infrastructure wins it a reputation for reliability and speed of delivery; world-class port and airfreight facilities, excellent warehousing and delivery channels, and unparalleled regional and global connectivity gain it a firm foothold in global sourcing and integrated manufacturing. In terms of existing Sino–Singaporean economic and trade cooperation, Chinese investment in Singapore has seen a surge in recent years, mainly in contract labor, transportation, construction, energy, and other areas. Combined with Singapore’s economic situation and the fruits of Sino–Singaporean economic and trade exchanges, Singapore has a limited role in absorbing and converting China’s excess capacity in industries owing to its high stage of industrialization and services-dominated industrial structure. However, the two countries have potentials for cooperation in capital-intensive manufacturing and services industries. Chinese enterprises can invest in high-end enterprises in Singapore’s manufacturing industry chain to learn from its advanced management experience and technology; additionally, they can take advantage of Singapore’s convenient transportation conditions and its status as an international financial center to develop trade and financial services, etc.
Located in the center of Southeast Asia, Thailand stands at the natural intersection of the ASEAN market and will become a booster rocket for the 21st Century Maritime Silk Road thanks to its relatively sound infrastructure. Thailand’s economy is highly export-dependent, with exports accounting for about 2/3 of its GDP. Agriculture is the country’s traditional economic sector, with agricultural products being one of the main sources of foreign exchange earnings. Thailand is the only net exporter of food in Asia, living up to its reputation as the “breadbasket of Southeast Asia”. Among its top 10 export commodities, six are agricultural products, accounting for about 40% of the total export value. According to Chinese customs statistics, the total bilateral trade volume between China and Thailand accounts for 1/6 of the total bilateral trade between China and ten ASEAN countries, making Thailand China’s fourth largest trading partner among ASEAN countries. Meanwhile, China is Thailand’s largest trading partner, the largest source of imports, and the largest export destination. The trading structure between China and Thailand has been optimized in recent years, depicting a pattern featuring complementary advantages and mutual benefits. Among all the trading products, electrical and mechanical products take the largest share, and the proportion of plastics and their products is also increasing.
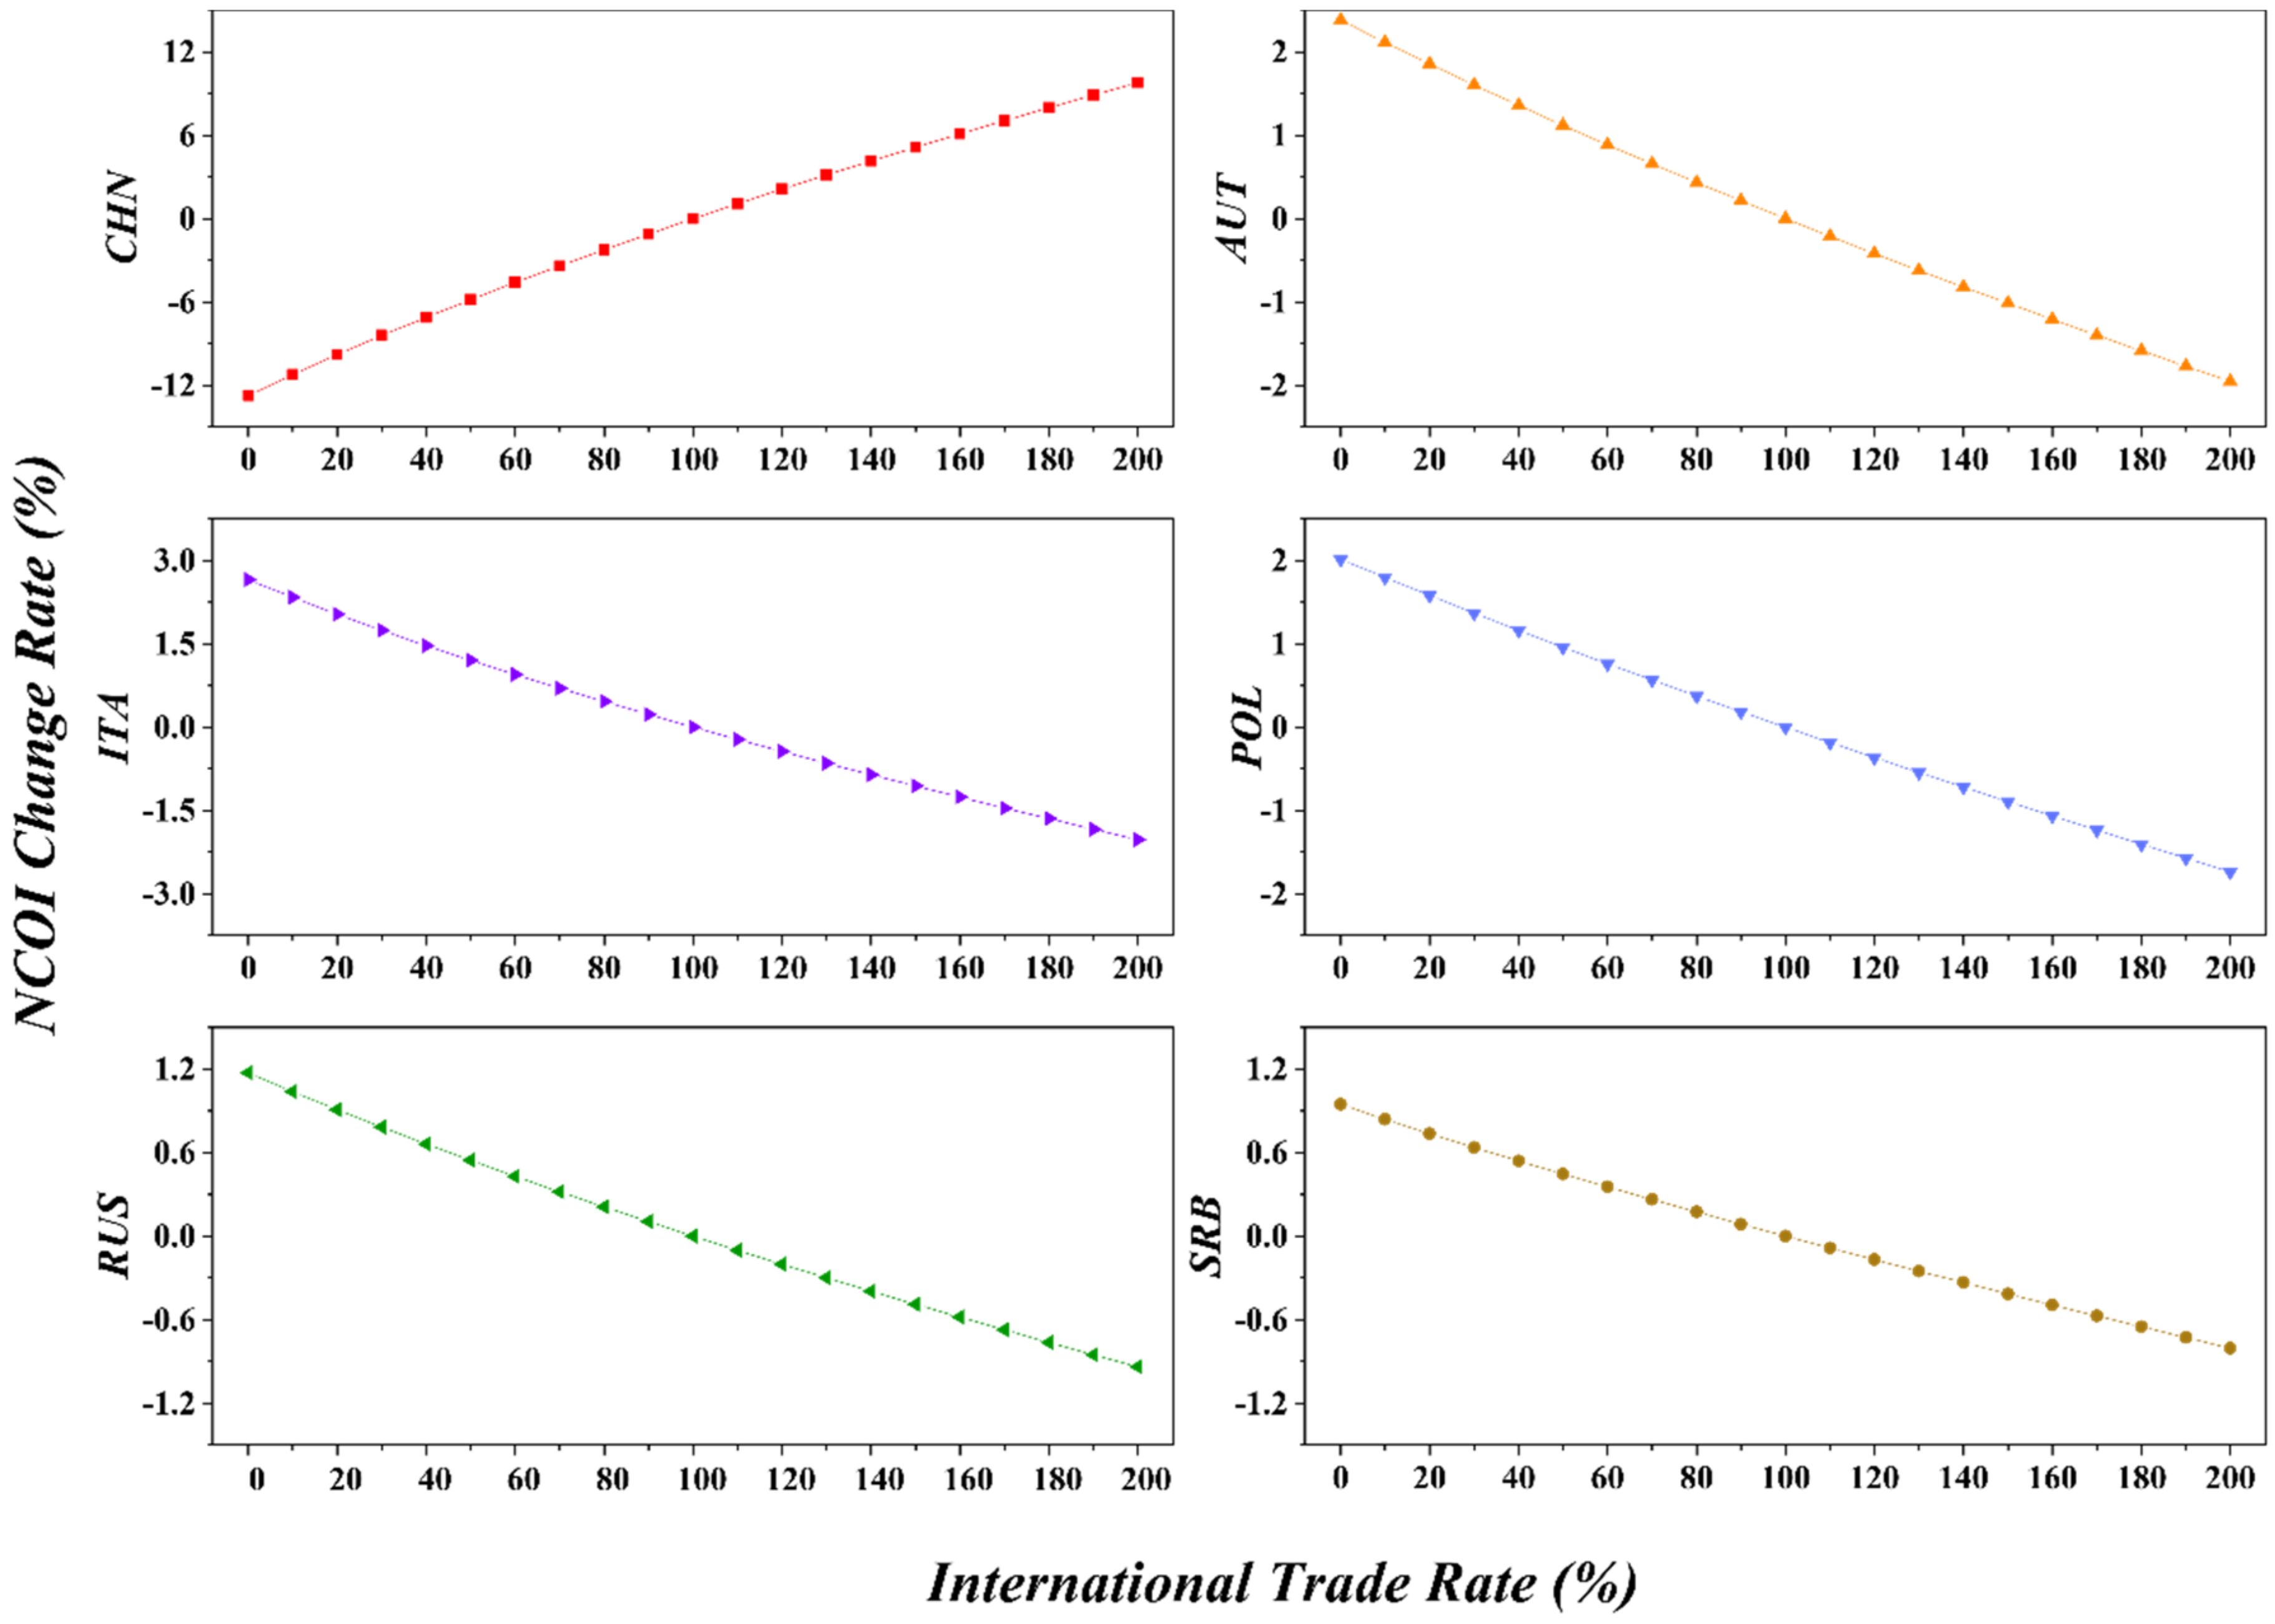
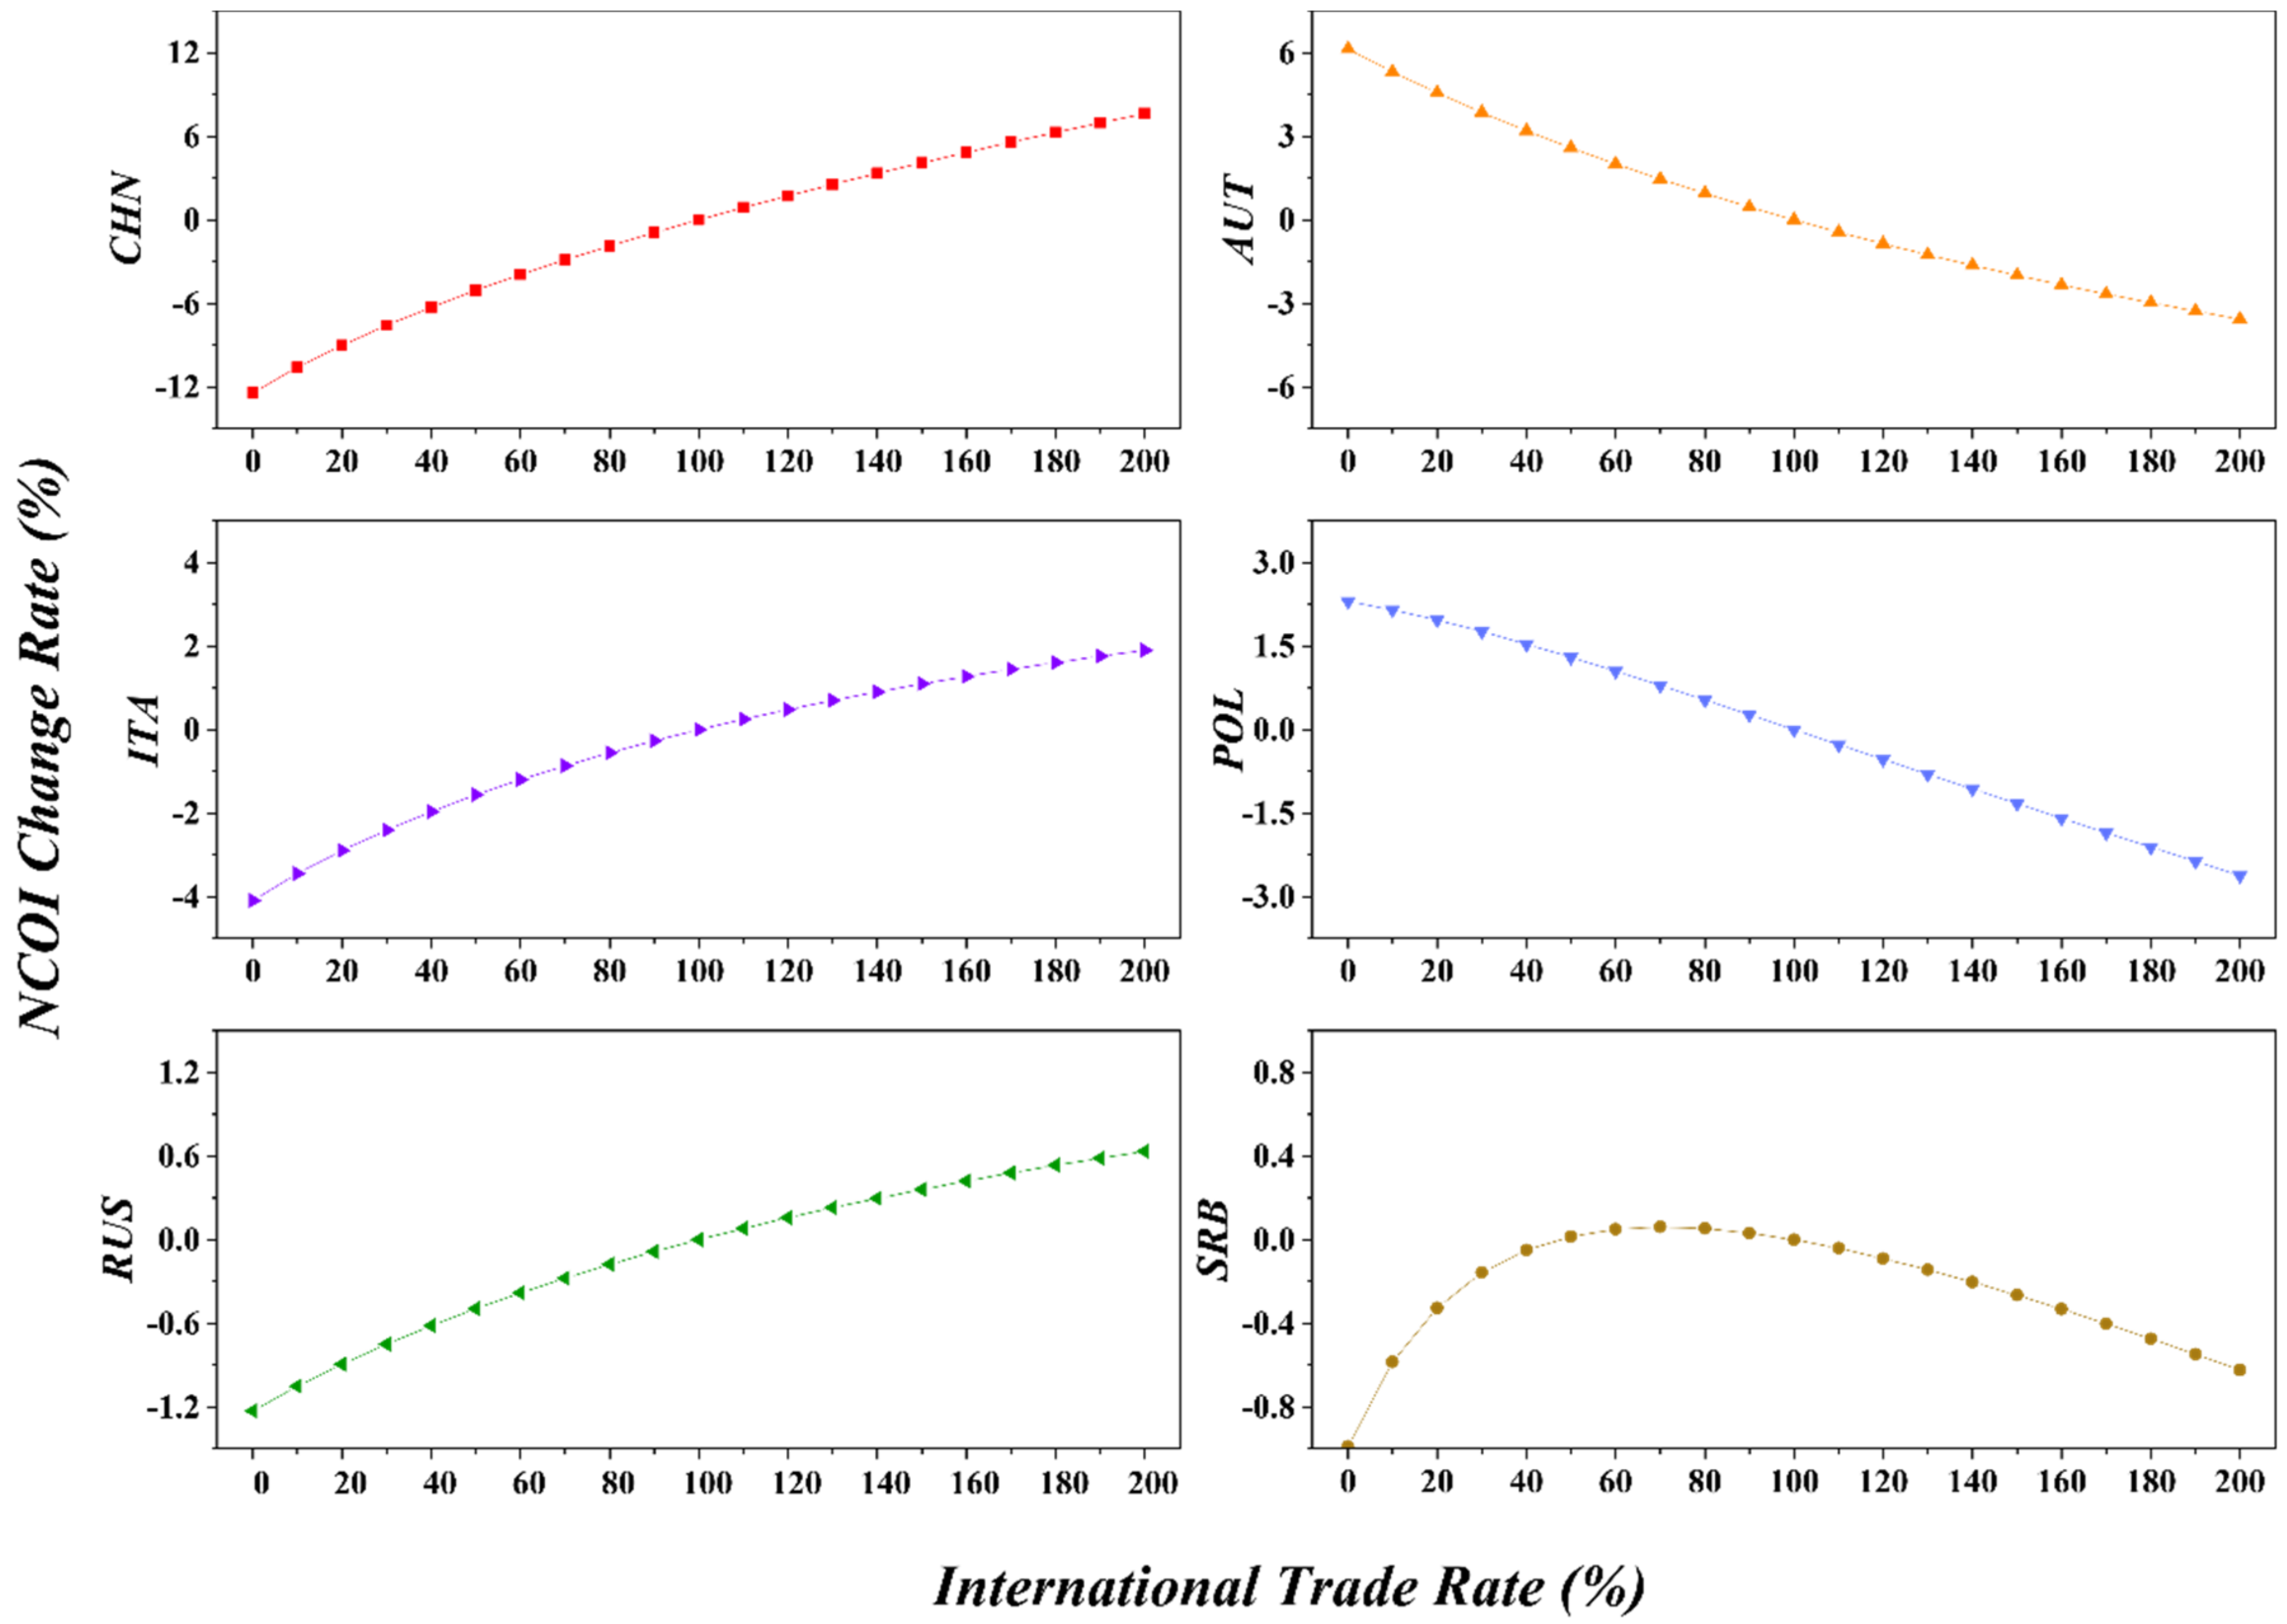
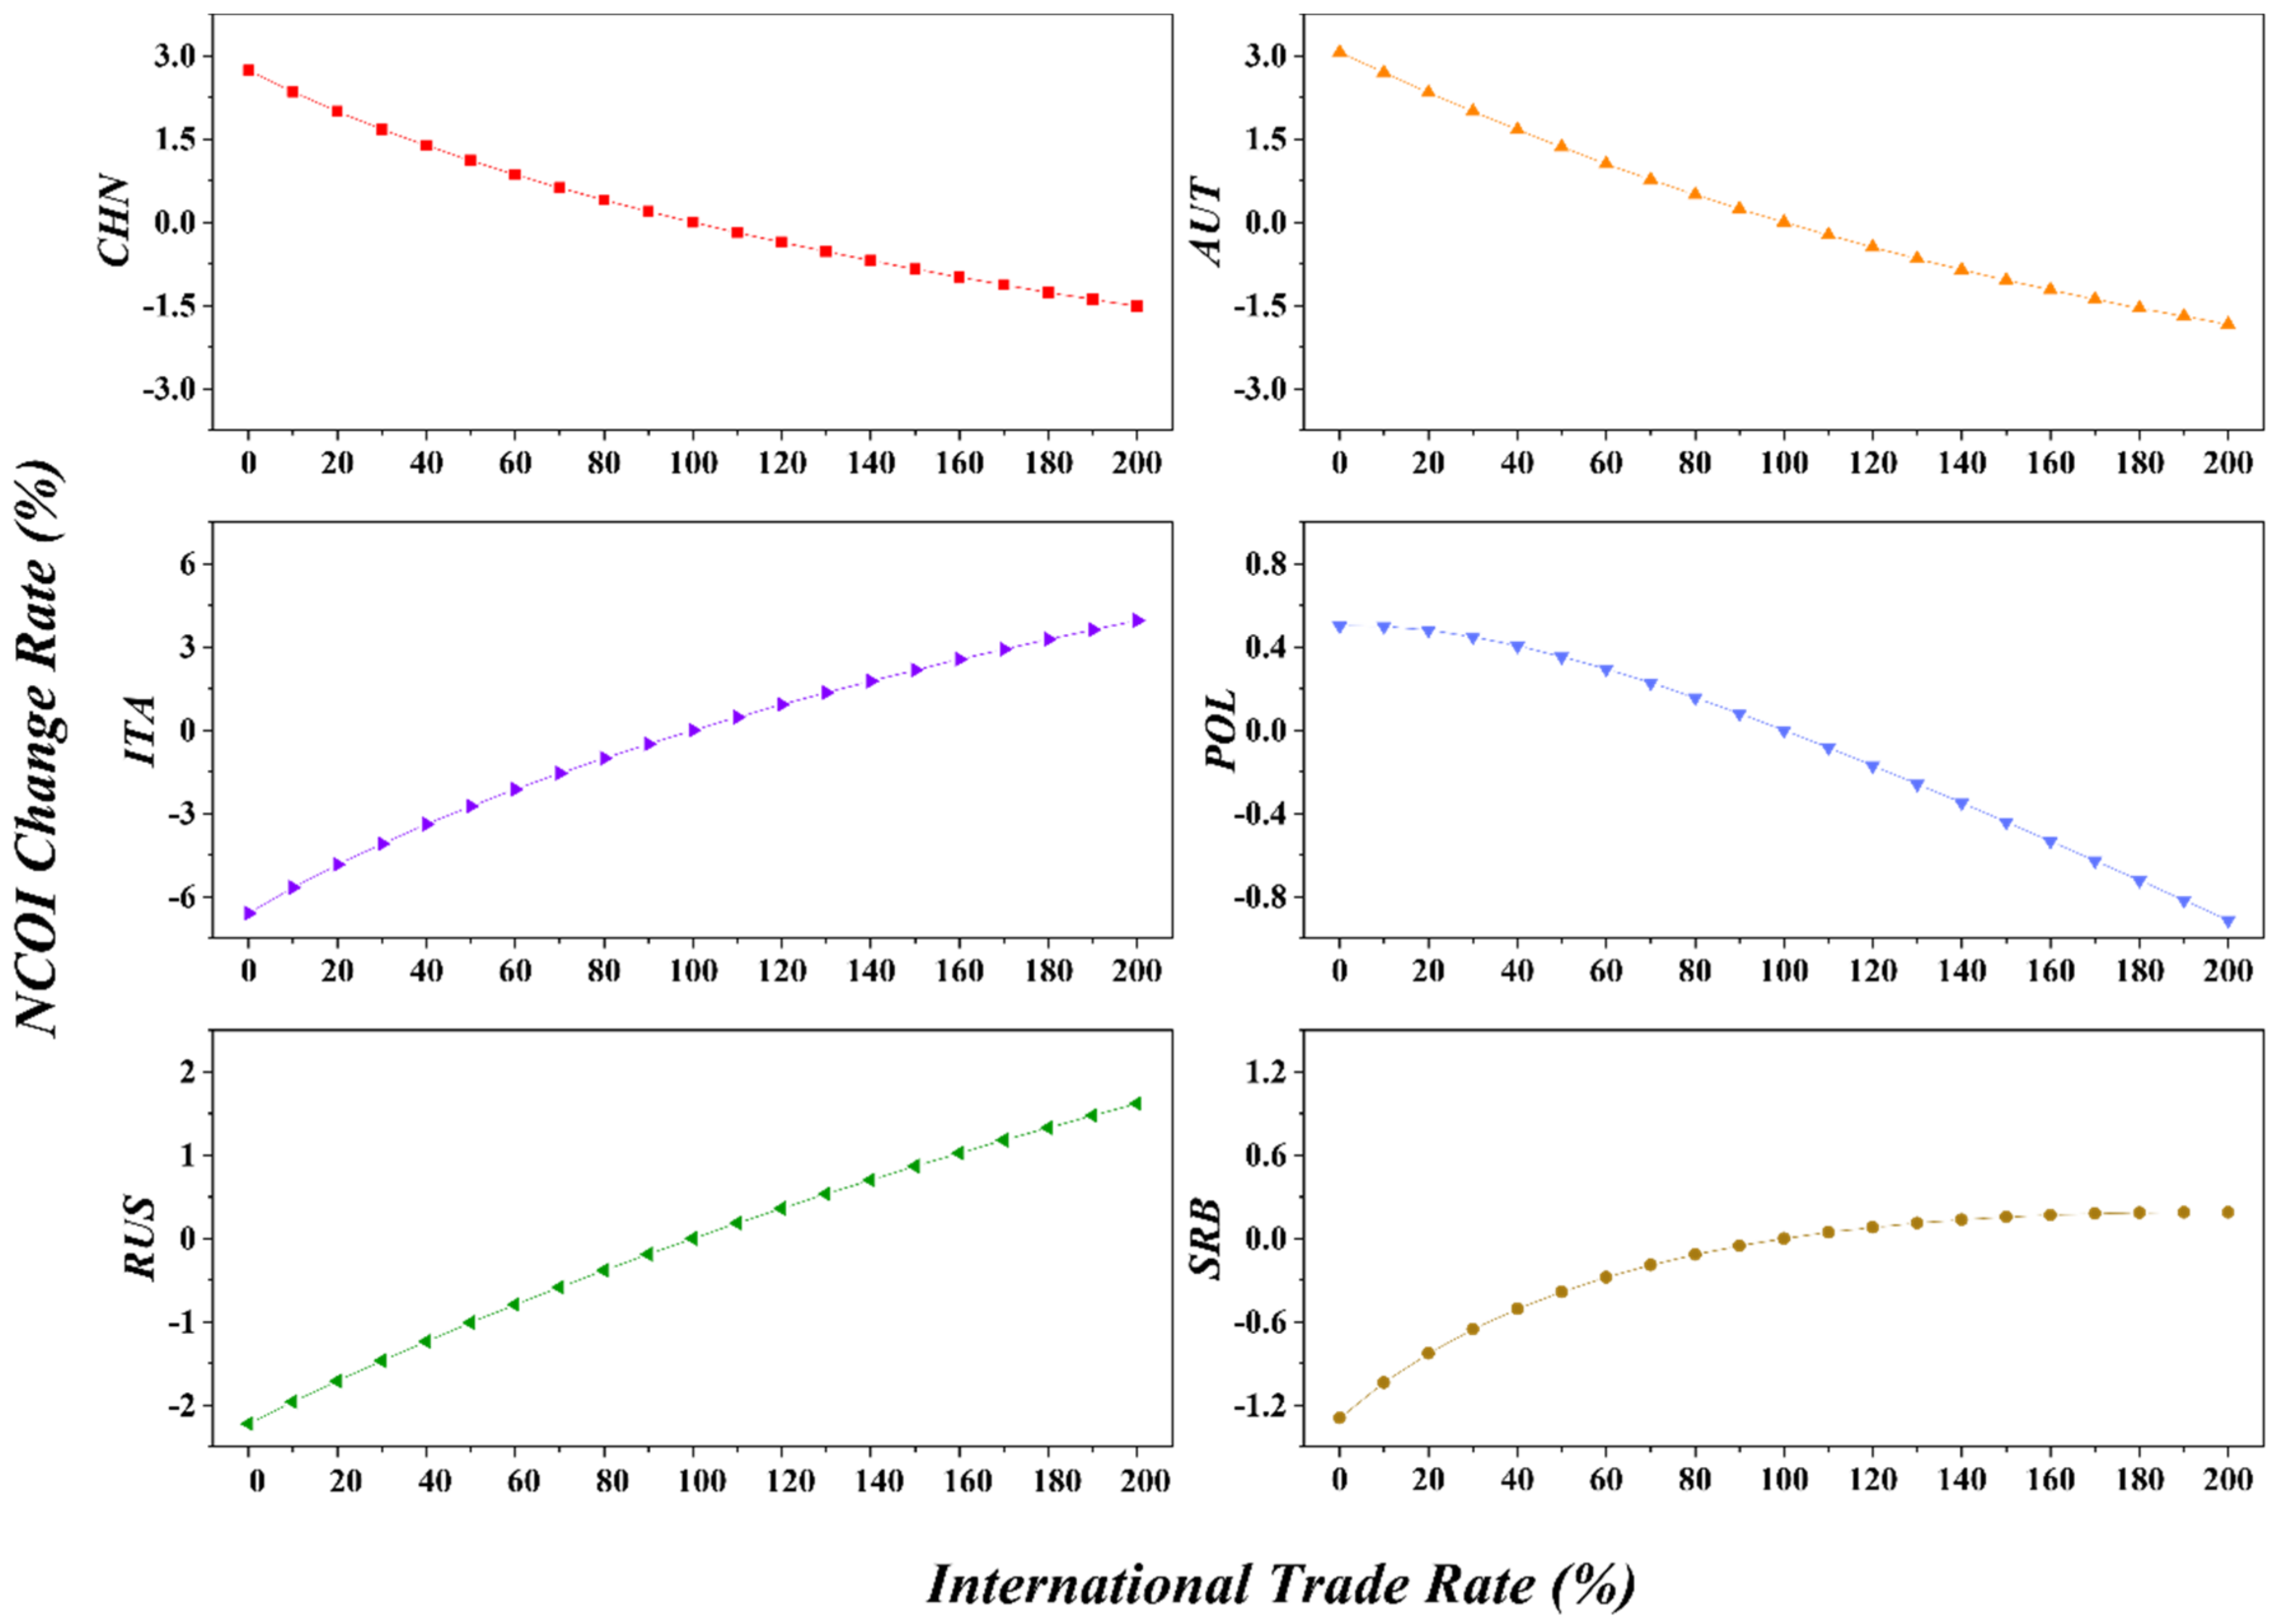
4.2. Simulation on European Nations
According to the simulation results in
Figure 14,
Figure 15 and
Figure 16, we find that: (1) In Case A, China’s
NCOI sharply increases as the volume of international trade goes up, while other countries decrease to varying degrees; (2) In Case B,
NCOIs of China, Austria, and Poland (slightly) decrease, while Italy (sharply), Russia, and Serbia (sharply before the trade rate is positive and then slightly) increase; (3) In Case C,
NCOIs of China (sharply), Italy, Russia (slightly), and Serbia (before the trade rate 60%) increase, while Austria (sharply), Poland, and Serbia (after the trade rate 60%) decrease.
Figure 14.
Influence on China and main European nations in Case A.
Figure 14.
Influence on China and main European nations in Case A.
Figure 15.
Influence on China and main European nations in Case B.
Figure 15.
Influence on China and main European nations in Case B.
Figure 16.
Influence on China and main European nations in Case C.
Figure 16.
Influence on China and main European nations in Case C.
Next, we will specifically analyze the production capacity cooperation potential between China and major European countries.
Lying at the south-end of Central Europe, Austria is an important transportation hub in Europe, with an economy growing faster than the EU average. Austria boasts an ample supply of mineral, forest, and hydraulic resources; in particular, its forest coverage accounts for nearly 50% of its total area. In recent years, as Austria’s economy has been developing at a fast pace, the machinery industry is its largest industrial sector, its agriculture and tourism industries are well-developed, and the services industry occupies an important position. China is Austria’s most important trading partner in Asia. China’s rising living standards are attracting more and more Austrian companies to make investments, encouraging Sino–Austrian bilateral trade to continuously grow. With the unique advantages in the metal industry, mechanical engineering, food, chemical, automotive, and environmental protection industries, Austria exports high-tech products to China, and thus becomes an important technology importing source for China in the EU. Besides, Austria’s position as a hub for China’s interconnectivity with the CEE region is also noteworthy. In general, given the highly complementary bilateral trade, the cooperation between Austria and China in the fields of trade, finance, infrastructure construction, and culture will unlock significant potential.
Italy is situated on the northern coast of the Mediterranean Sea in southern Europe. It is the second largest manufacturing country in the EU after Germany, the fourth largest economy in Europe and the eighth largest in the world. Known as the “Kingdom of SMEs”, the number of Italy’s small and medium-sized enterprises accounts for more than 98% of the total number of enterprises. However, in the short supply of natural resources, the country’s oil and gas production can only meet a small portion of its domestic market demand. In addition, though being highly developed, its economy is facing unbalanced development, with a widening gap between the prosperous northern region and the relatively backward southern region, divided by the capital Rome. Italy was among the first batch of European countries to develop trade relations with China. The two countries signed a communiqué on the establishment of diplomatic relations as early as 1970. After the establishment of the China–Italy comprehensive strategic partnership in 2004, the economy and trade between the two countries has grown rapidly. As of 2018, Italy has become China’s fourth largest trading partner, third largest export market, and source of imports in the European Union; likewise, China is Italy’s top trading partner in Asia. Suffice it to say that the BRI between China and Italy can help bring into play the comparative advantages of both sides. To be specific, Italian companies have comparative advantages in high-end manufacturing and services industries, design, aerospace, biomedicine, etc., but lack capital liquidity, which can be complemented by Chinese companies which are seeking to transform and upgrade their value chains with relatively sufficient funds.
Located in Central Europe and south of the Baltic Sea, Poland is the largest and most populous country in Central and Eastern Europe. Poland’s unique geographical advantage guarantees its important role in the Belt and Road. China and Poland have planned to use Poland as a hub for new logistics routes to build a logistics center in Central and Eastern Europe, thereby promoting the inflow and entry of Polish and Chinese products to the European region. As China’s BRI and interconnectivity strategy progresses, a series of China–Europe freight trains by way of Poland have been launched to expand cooperation in trade and investment between the two countries. The economies of China and Poland are highly complementary and have the potential to develop together in the fields of infrastructure and high-tech industries, despite some obstacles such as limited trade volume, insufficient mutual investment, and a small number of large-scale cooperation projects, etc.
Russia, the largest country in the world, straddles the Eurasian continent and includes both the eastern half of Europe and the western part of Asia. Russia’s industrial structure is homogeneous and its economic structure is overly dependent on energy exports. Its secondary industry is supported by heavy and chemical industries, while agriculture and services are relatively underdeveloped. China and Russia are each other’s largest neighbors, and their unique geopolitical advantages facilitate economic and trade cooperation in the border areas of both countries. For a long time, China and Russia have been each other’s important trade partners. China has been Russia’s largest trading partner for eleven consecutive years, while Russia is the tenth largest trading partner of China. The trading structure of the two countries reflects complementarity. China imports Russia minerals, wood and wooden products, and other less processed primary products, while exporting to Russia electromechanical products, textiles, and raw materials; the various products in which the two countries have significant comparative advantages basically do not overlap.
Located in southeastern Europe, Serbia is a landlocked country in the middle of the Balkans that suffered severe damage to its industrial facilities in the 1990s when it was bombed by NATO during the Kosovo War. In the 21st century, with the introduction of privatization, Serbia’s economy has gradually recovered, but the overall economic level is below the European average. The main economic obstacles are the high unemployment rate and large trade deficits. Serbia was the first country in Central and Eastern Europe to establish a strategic partnership with China, and since 2006 China has been Serbia’s top trading partner in Asia and the fifth largest trading partner in the world. At present, though developing at a relatively fast pace, its overall economy is still underdeveloped, especially when it comes to the outdated infrastructure. In the future, China and Serbia have great potential for cooperation in infrastructure construction, energy, chemical industry, mineral products, and other fields.
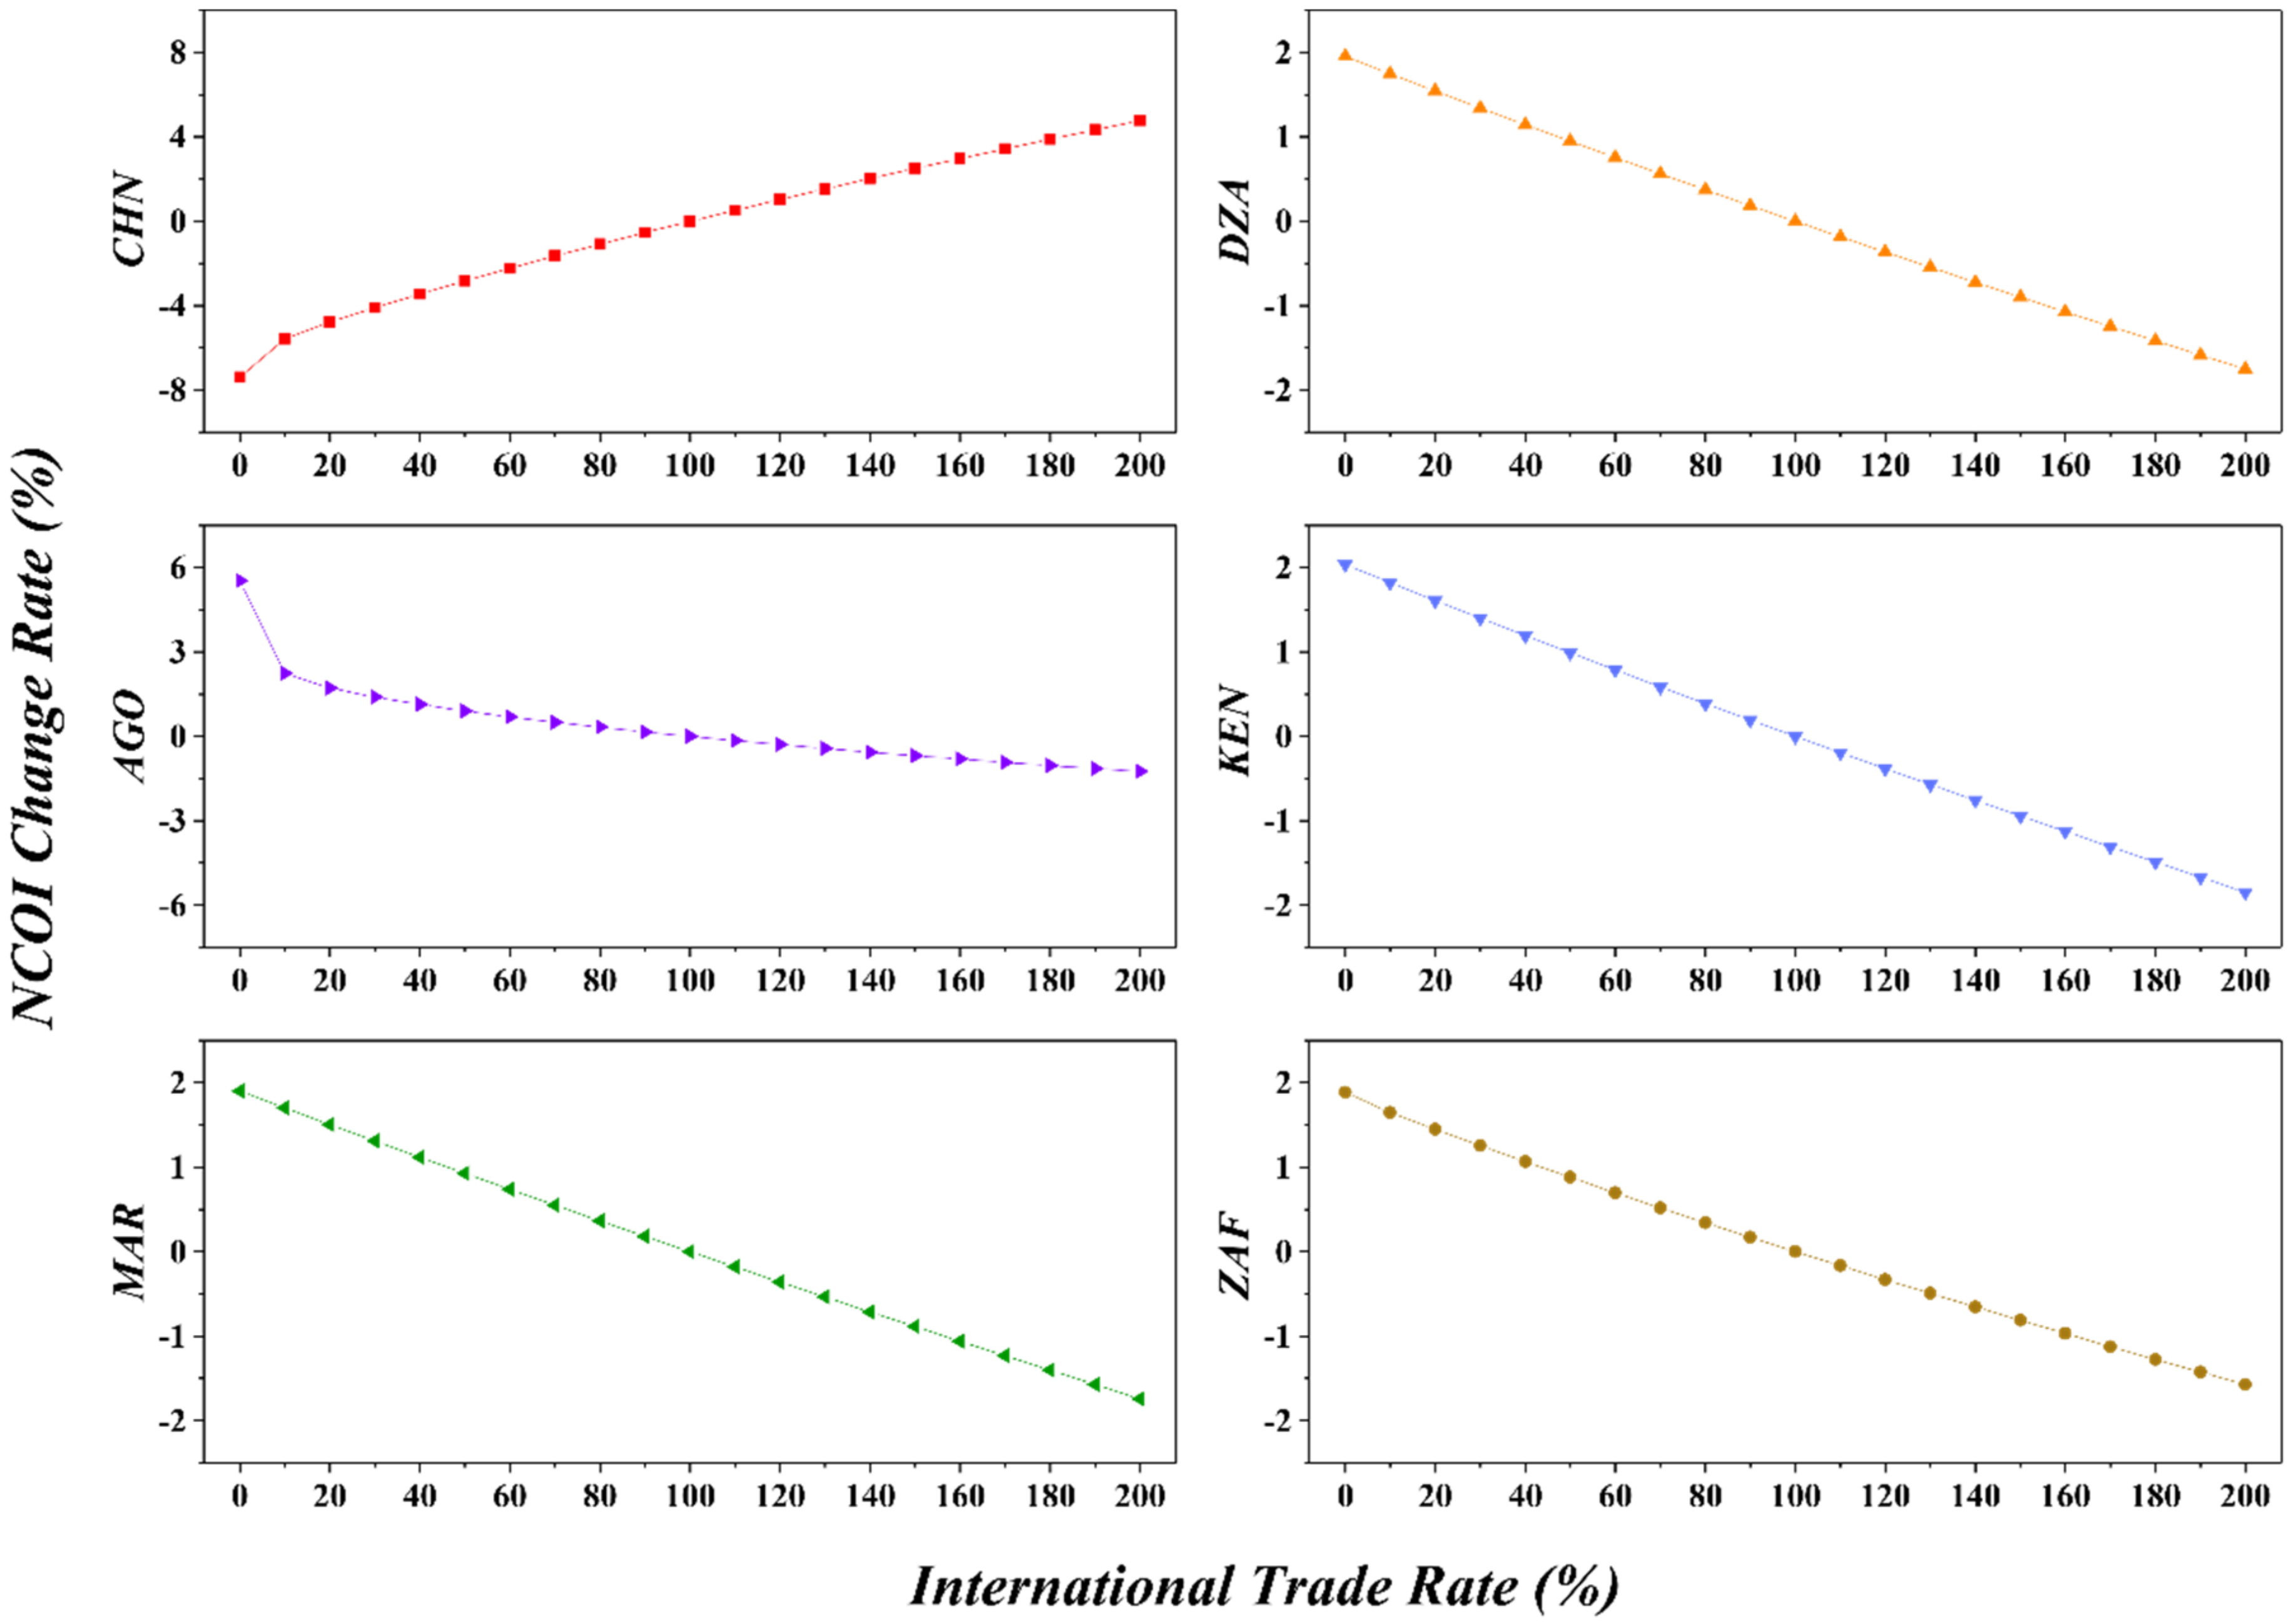
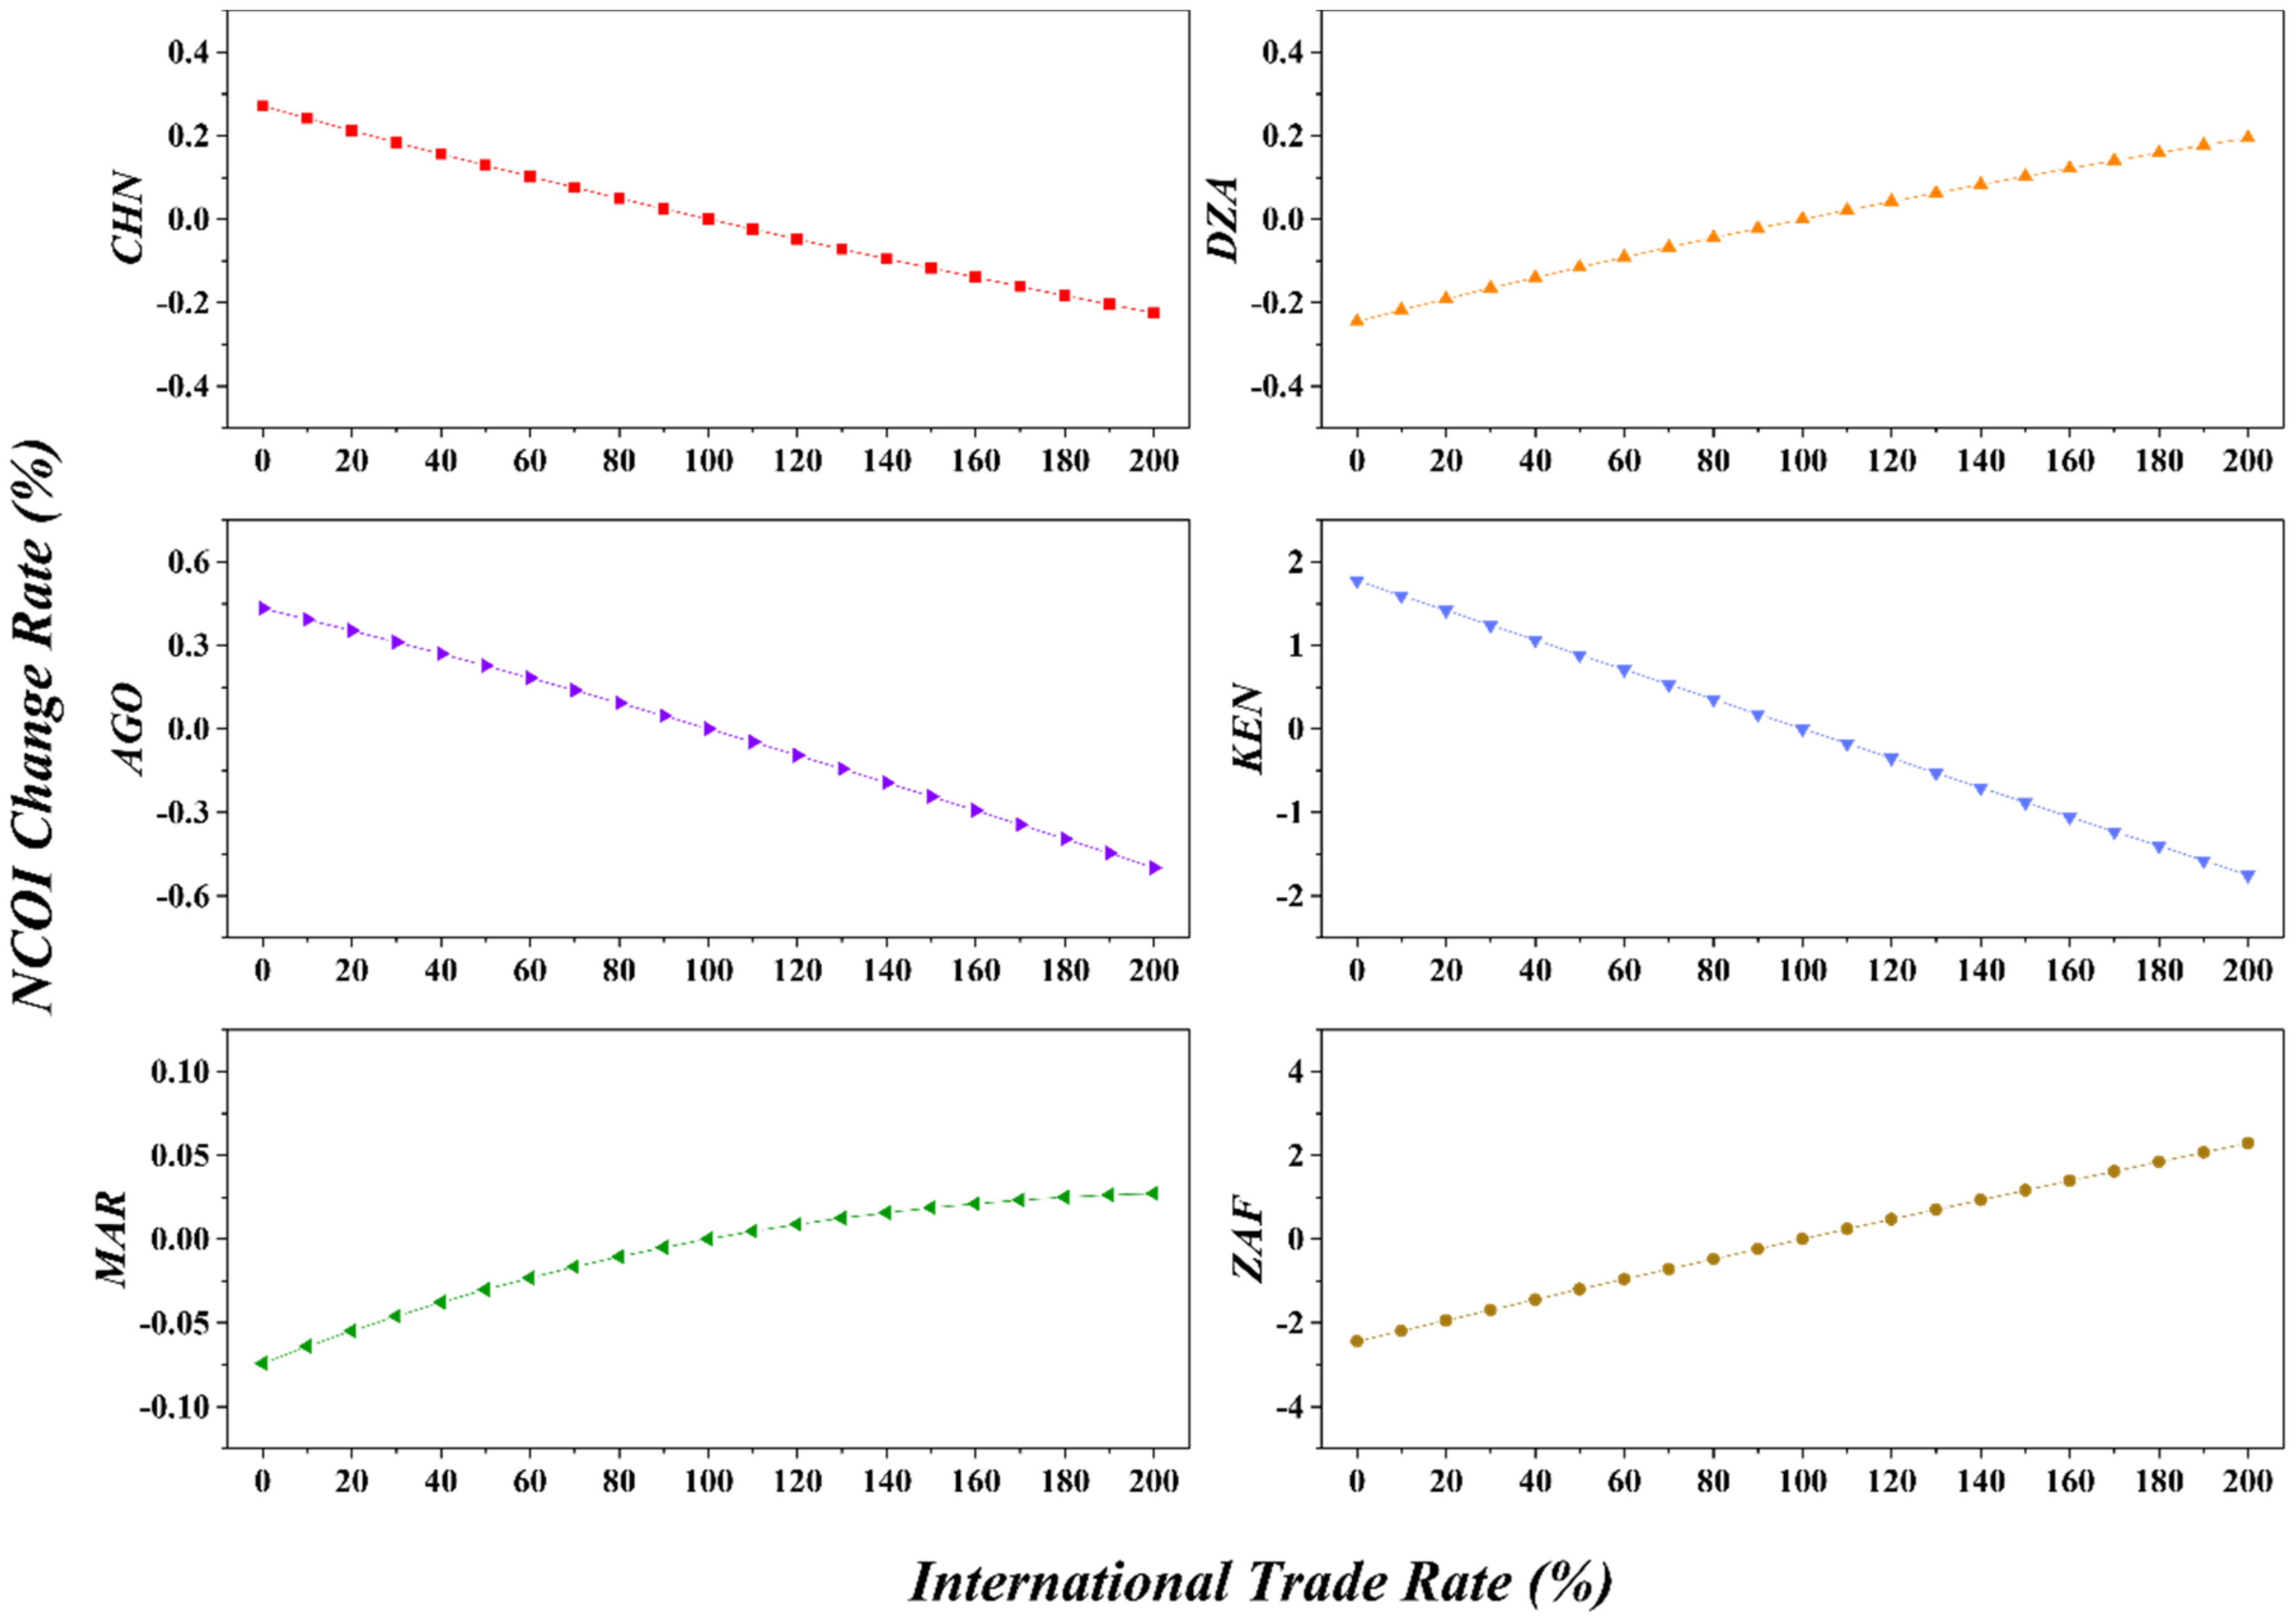
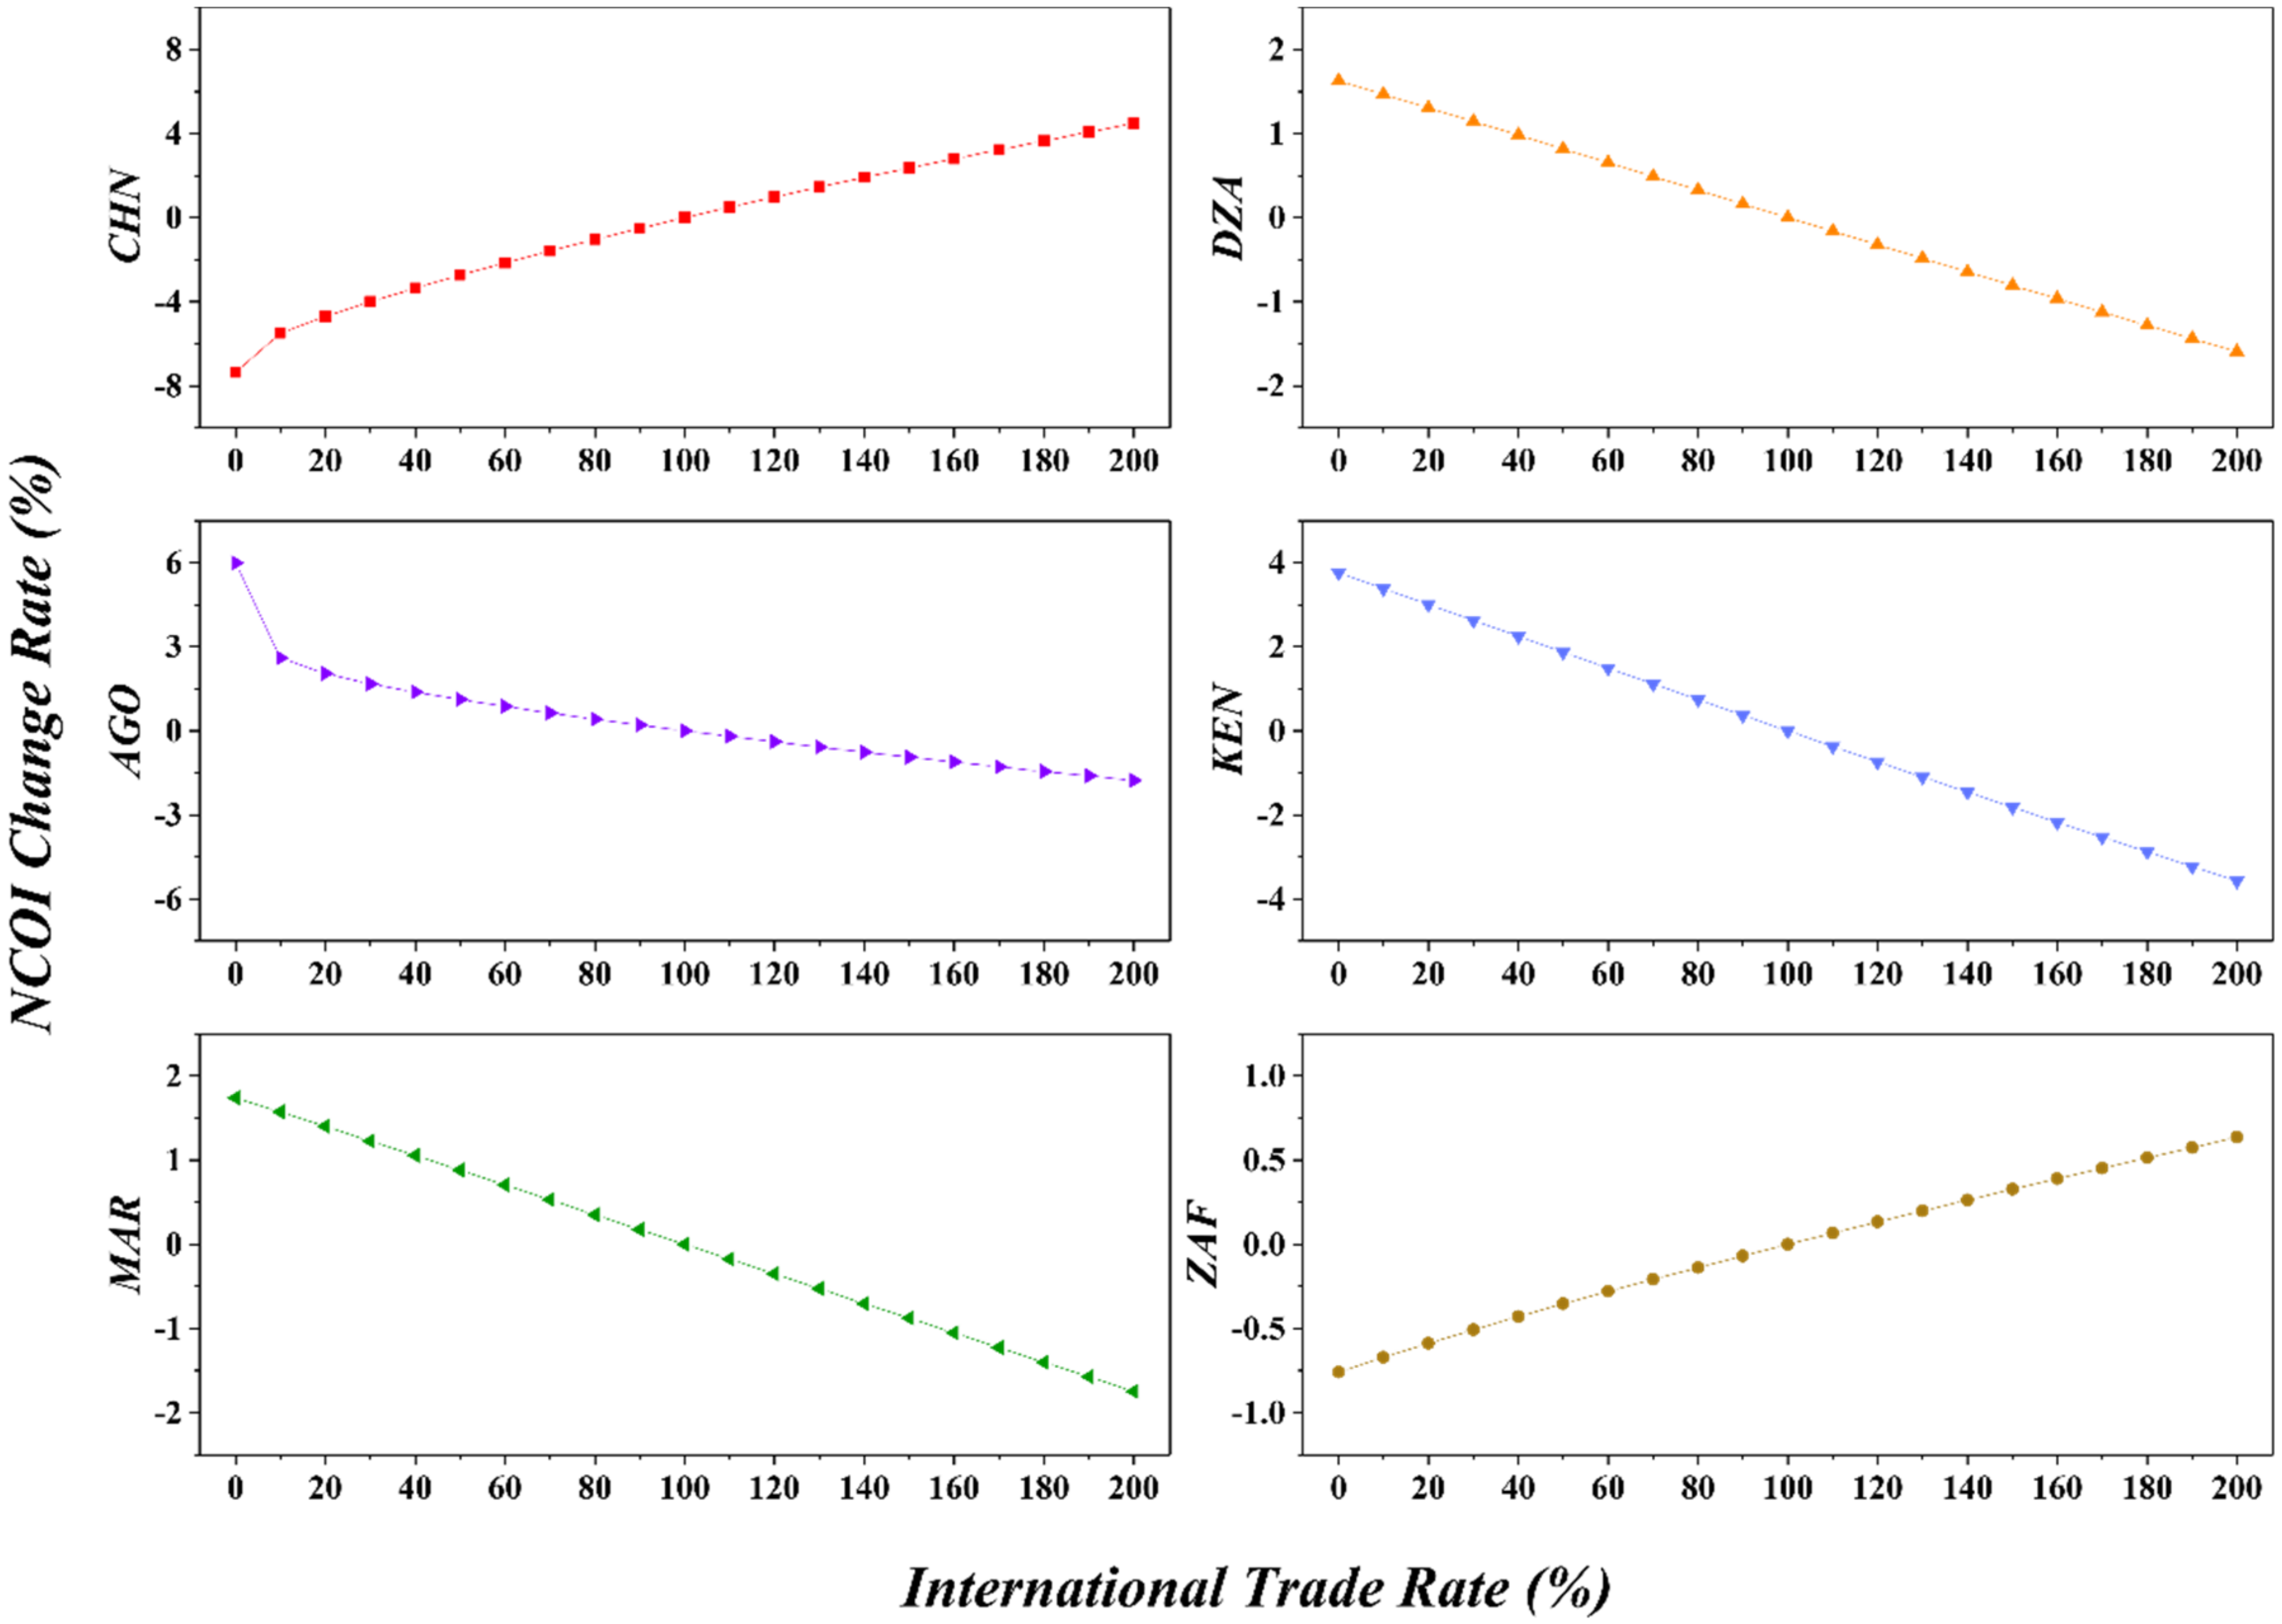
4.3. Simulation on African Nations
According to the simulation results in
Figure 17,
Figure 18 and
Figure 19, we find that: (1) In Case A, China’s
NCOI sharply increases as the volume of international trade goes up, while Algeria, Angola (sharply when the trade rate is very low and then slightly), Kenya, Morocco, and South Africa decrease; (2) In Case B,
NCOIs of China (slightly), Angola (slightly), and Kenya decrease, while Algeria (slightly), Morocco (slightly), and South Africa increase; (3) In Case C,
NCOIs of China (sharply) and South Africa (slightly) increase, while Algeria, Angola (sharply when the trade rate is very low and then slightly), Kenya, and Morocco decrease.
Figure 17.
Influence on China and main African nations in Case A.
Figure 17.
Influence on China and main African nations in Case A.
Figure 18.
Influence on China and main African nations in Case B.
Figure 18.
Influence on China and main African nations in Case B.
Figure 19.
Influence on China and main African nations in Case C.
Figure 19.
Influence on China and main African nations in Case C.
Next, we will specifically analyze the production capacity cooperation potential between China and major African countries.
Located in northwest Africa, Algeria is the largest country in terms of area and the fourth largest economy in Africa. Rich in underground oil and gas resources, Algeria is the second largest gas exporter in the world, with the fifth largest reserves, so the oil and gas industry underpins its economic development. The industrial cooperation between China and Algeria can be mutually beneficial. Firstly, as Algeria’s largest source of import, China mainly imports energy and mineral resources such as iron ore and LPG from Algeria, and invests in oil and gas, mining, aerospace, nuclear energy, and other fields. Secondly, the cooperation between China and Algeria in high-tech fields has strongly contributed to the economic growth and industrial development of both countries. Thirdly, China’s overseas infrastructure capacity, which is high-level and cost-effective, can help build infrastructure such as roads, railroads, ports, and airports in Algeria.
Situated in sub-Saharan Africa, Angola is the fourth largest economy and one of the largest capital attracting countries in Africa. It has ample oil, natural gas, and mineral resources, and also a large amount of hydroelectric power, as well as resources of agriculture, forestry, and fishery. Its hydropower generation accounts for 3/4 of the country’s total power generation. Angola’s economy is mainly based on agriculture and minerals, and oil, with oil being the mainstay industry. Although it has taken effective measures to promote economic diversification and reduce the dependence of the national economy on the oil industry, the country is still struggling with a low level of economic development and backward infrastructure. China’s imports from Angola mainly include crude oil, natural gas, and other natural resources, and Angola’s imports from China mainly include electromechanical, steel, automobile, and other products. China actively participates in investment in Angola and has obvious competitive advantages in infrastructure construction such as railroads, in addition to many other fields such as oil, construction, power grid, and telecommunication. In recent years, the two countries are making great efforts to promote capacity cooperation in areas such as electricity, ports, highways, agriculture, and manufacturing.
Kenya has the most developed and complete industrial sector in East Africa. Agriculture, services, and manufacturing are the three pillars of Kenya’s national economy, and the oil, mineral extraction, agriculture, livestock and fisheries, and tourism industries are also developing well. Its natural port Mombasa connects East and Central African countries, with good water transport conditions. Kenya boasts well-operating infrastructure in communication, transportation, resources, and energy, rich natural resources, and huge market potential. However, Kenya’s industrial sectors and regions varies greatly in terms of the level of development, so it needs to upgrade its industrialization development with reference to the success stories of other countries. China is Kenya’s largest source of imports, and also has a number of maturely developed industries and redundant production capacity. China is now more than ready to make overseas investments and expand exports while sharing its best practices. China and Kenya enjoy high economic coupling—the capital, technology, and experience of the former can be fully utilized by the latter. The cooperation between the two countries will undoubtedly bring about mutual benefit and win-win.
Morocco is a coastal Arabian country in northwestern Africa and a hub connecting Europe, the Middle East, and Africa. Morocco’s economy ranks fifth in Africa and third in North Africa. Phosphate exports, tourism, and remittances are the main pillars supporting Morocco’s economy. It has a good foundation in agriculture but is not self-sufficient in food. Its rich fishery resources generate the highest production in Africa. But its industry is underdeveloped. The Moroccan government is committed to expanding domestic demand, strengthening infrastructure construction, supporting traditional industries such as textiles and tourism, developing new industries such as information and clean energy, actively attracting foreign investment, and promoting economic growth. As one of the first Arab countries to establish diplomatic relations with China, Morocco’s superior geographical location, stable political environment, and perfect economic governance system provide conditions for further economic and trade cooperation between China and Morocco, and also serve as a bridge for Chinese enterprises to explore the African and European markets. In recent years, trade and investment between the two sides have continued to thrive, and production capacity cooperation in fisheries, infrastructure, telecommunications, automobiles, and other fields has been deepened.
As the second largest economy in Africa, South Africa is an important member of multilateral organizations such as BRICS, G20, and the United Nations. It maintains close relations with China in international organizations and multilateral mechanisms and is considered as China’s important strategic partner. South Africa has abundant natural resources, low labor costs, and relatively complete infrastructure in transportation, electricity and information and communication. Mining and manufacturing are the most important pillar industries in its national economy. The cooperation between China and South Africa in the fields of manufacturing, investment, and trade is flourishing and of great significance. First, South Africa’s manufacturing development has lagged in the past 20 years, and much of the manufacturing industry has been replaced by imports, mainly due to insufficient technology reserves, high factor costs, and insufficient economies of scale. The in-depth cooperation between South Africa and China in the manufacturing sector will enhance its own technological level and international competitiveness. Secondly, South Africa is China’s largest trading partner and the most important investment destination in Africa, and China’s investment in South Africa has promoted the development of its special economic zones. Thirdly, South Africa is now shifting from a mining and manufacturing-dependent economy to a technology- and services-oriented economy, whose domestic market can be further vitalized through its trade with China.
5. Results and Discussions
We try to explain the laws and reasons for the variation of collaboration among BRI-related nations from the following three perspectives.
Firstly, China can transfer its excess production capacity to other countries on the RCV through BRI, and then optimize its own industrial structure to move to the middle and high end of multiple IVCs, thereby enhancing its collaborative ability on the GVC, which is reflected by a substantial increase in the NCOI in Case A and Case B.
Secondly, by strengthening regional cooperation, some nations have made up for the shortcomings of their own industrial structure layout to some extent and enhanced the production transformation capacity within their NVCs. Among them: Satisfying Effect is observed when the collaborative potential of nations with a single industrial structure is satisfied, which is manifested as a decrease in NCOI; Incentive Effect is observed when the collaborative potential of nations with a diversified industrial structure is further stimulated, which is displayed as a rise in NCOI.
Thirdly, under the combined effect of satisfying effect and incentive effect, some nations (e.g., Thailand in Asia, Serbia in Europe, Angola in Africa) have more varying NCOI trends under different cooperation strategies—either rise or fall, which requires to be analyzed specifically on the causes at the sectoral level.
Regional collaboration can promote relevant economies to carry out production capacity cooperation, make full use of their comparative advantages to embed in the RVC network, and gradually achieve a rise in the GVC network. From a long-term perspective, the BRI initiated by China will help GVC restructure toward a win-win cooperation. In this chapter, our study provides a reference for how China can better implement the BRI. For example, in its cooperation with Asia, where most countries are rich in oil and gas and mineral resources, but have poor industrial systems, backward development technologies, and insufficient development capacity, China can cooperate with them in key areas such as oil and gas and mineral resources via helping them establish sound industrial, transportation, and infrastructure systems. In its cooperation with Europe, given the rapid development of the “construction” sector, China can take advantage of the rapid development cycle of European infrastructure, and use its experiences in rail–road industry to tap into the European rail transportation market. Meanwhile, China should also focus on the cooperation with European HMT sectors. In the cooperation with Africa, China should adhere to the humanitarian spirit, guide African industries to be more scientific and internationalized, and bring into play Africa’s comparative advantages in the GVC network.
In the context of drastic changes in the international environment, the traditional countermeasures to the systemic crisis of the national economy have lost efficacy; and the priority is to optimize and upgrade industrial structure. With its complete industrial chain and supply chain and the vast domestic market, China should avoid the “industrial hollowing-out” similar to Japan, the United States, and other countries. From the perspective of economic security, while continuously encourage industrial sectors to “go global”, China needs to respond to its dwindled competitiveness in the whole industrial chain and strengthen independent innovation to supplement the shortcomings. Against the backdrop of GVC reconstruction in the post-pandemic era, China shall explore a new development model, use the domestically economic circulation to drive the internationally economic circulation, take the BRI as the focus, and seize new foreign trade opportunities brought by RCEP. By doing so, it will embrace strengthened ties with other countries, and better integration into the GVC with a higher level of openness. This will be a favorable measure to promote global economic integration and counteract reverse globalization.


