
Distribution of Summer Zooplankton in the Waters off the Kuril Islands (Northwest Pacific) in Relationship with Environmental Conditions


Simple Summary
Abstract
1. Introduction
2. Materials and Methods
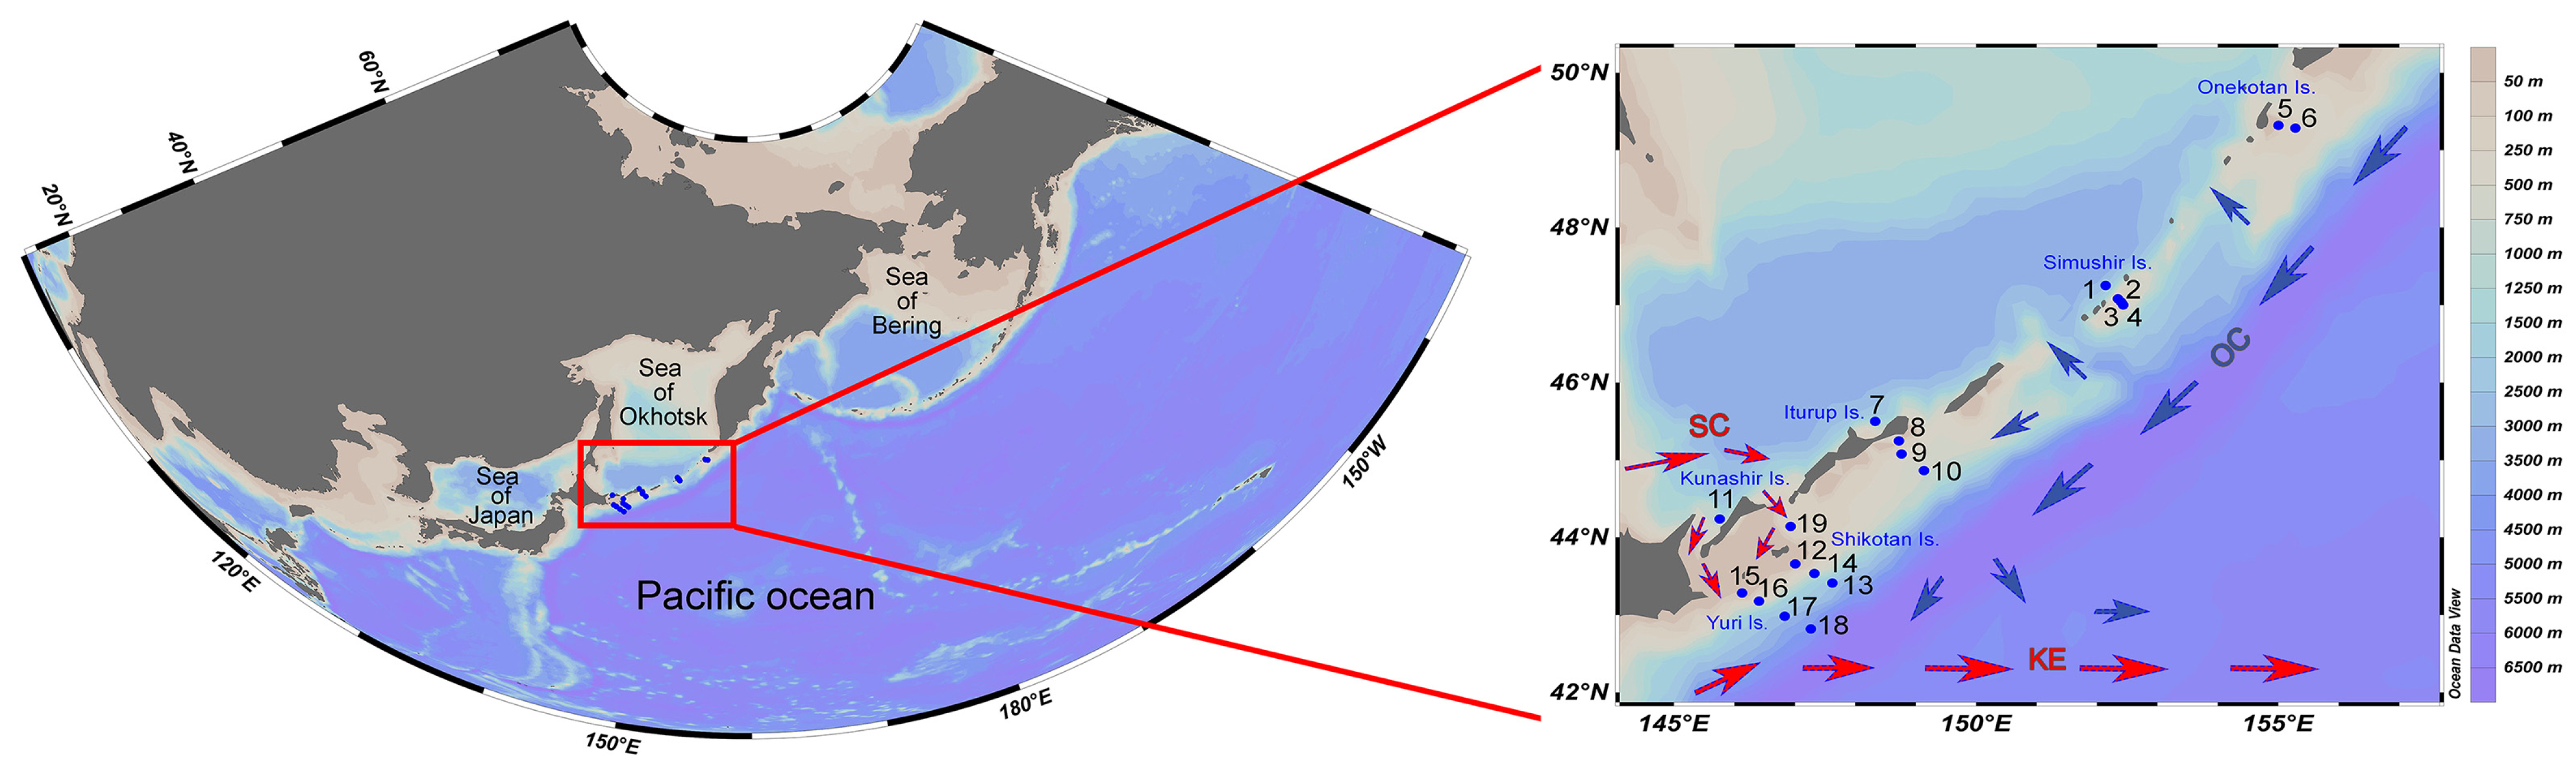
2.1. Field Observations
2.2. Sample Processing
2.3. Data Analysis
3. Results
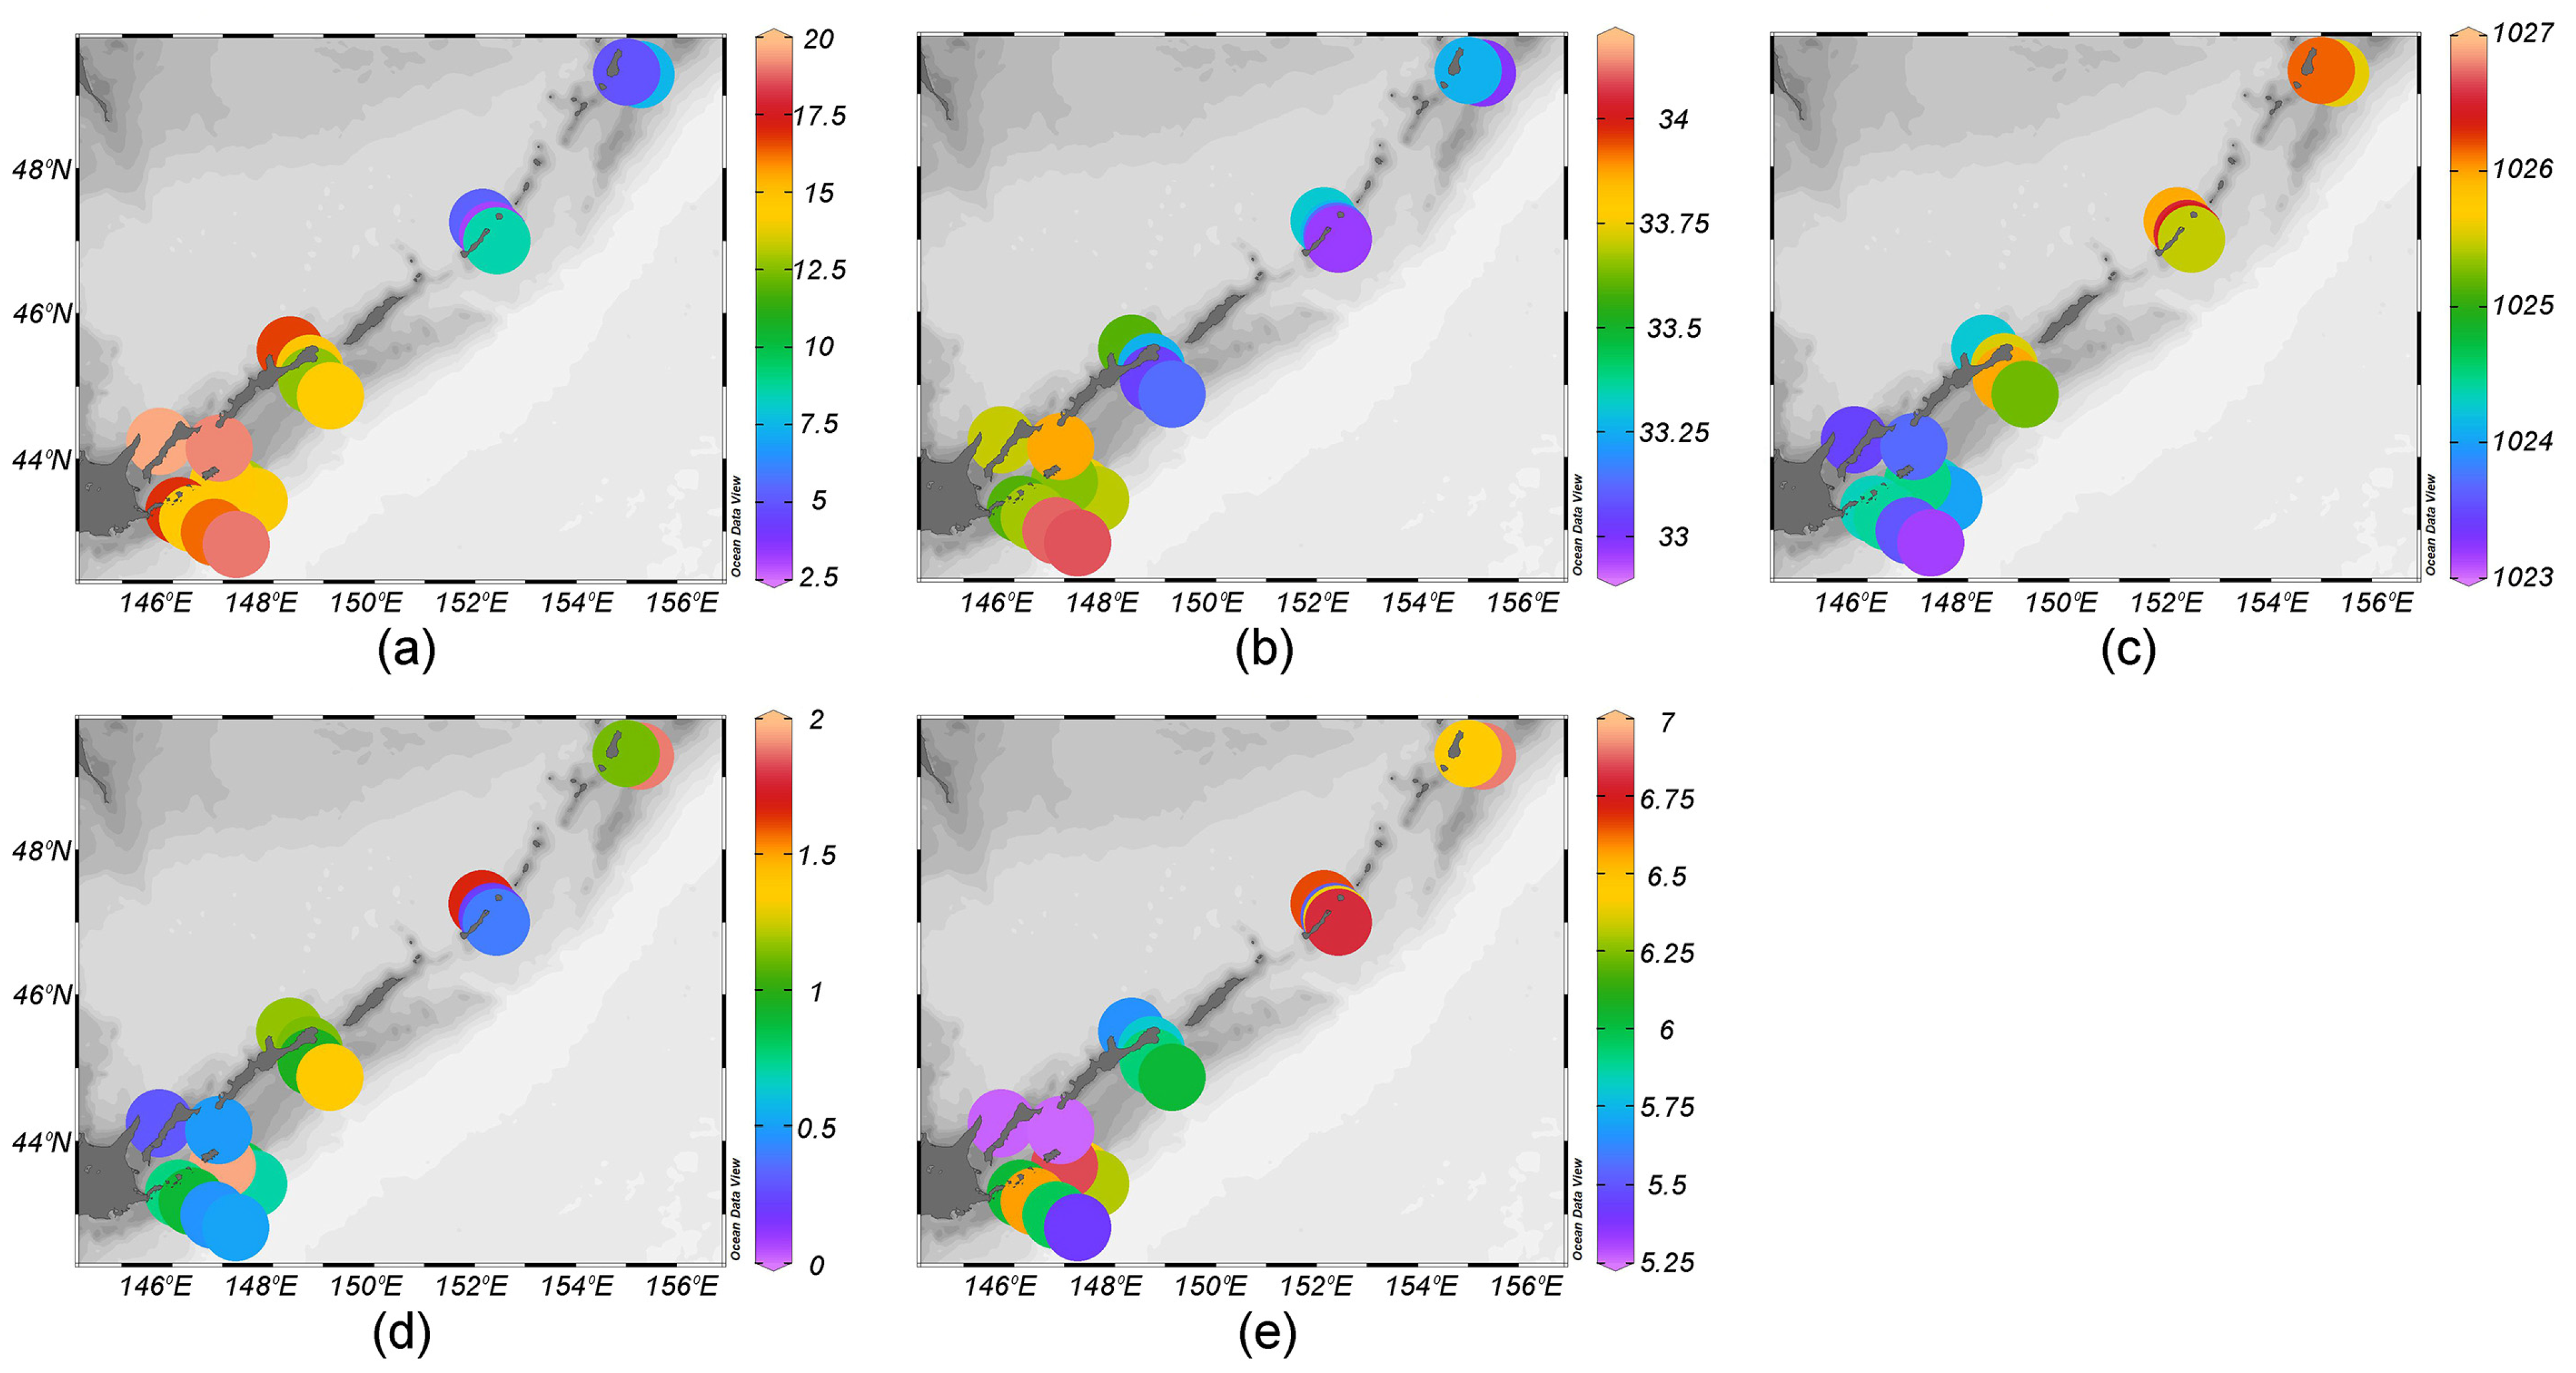
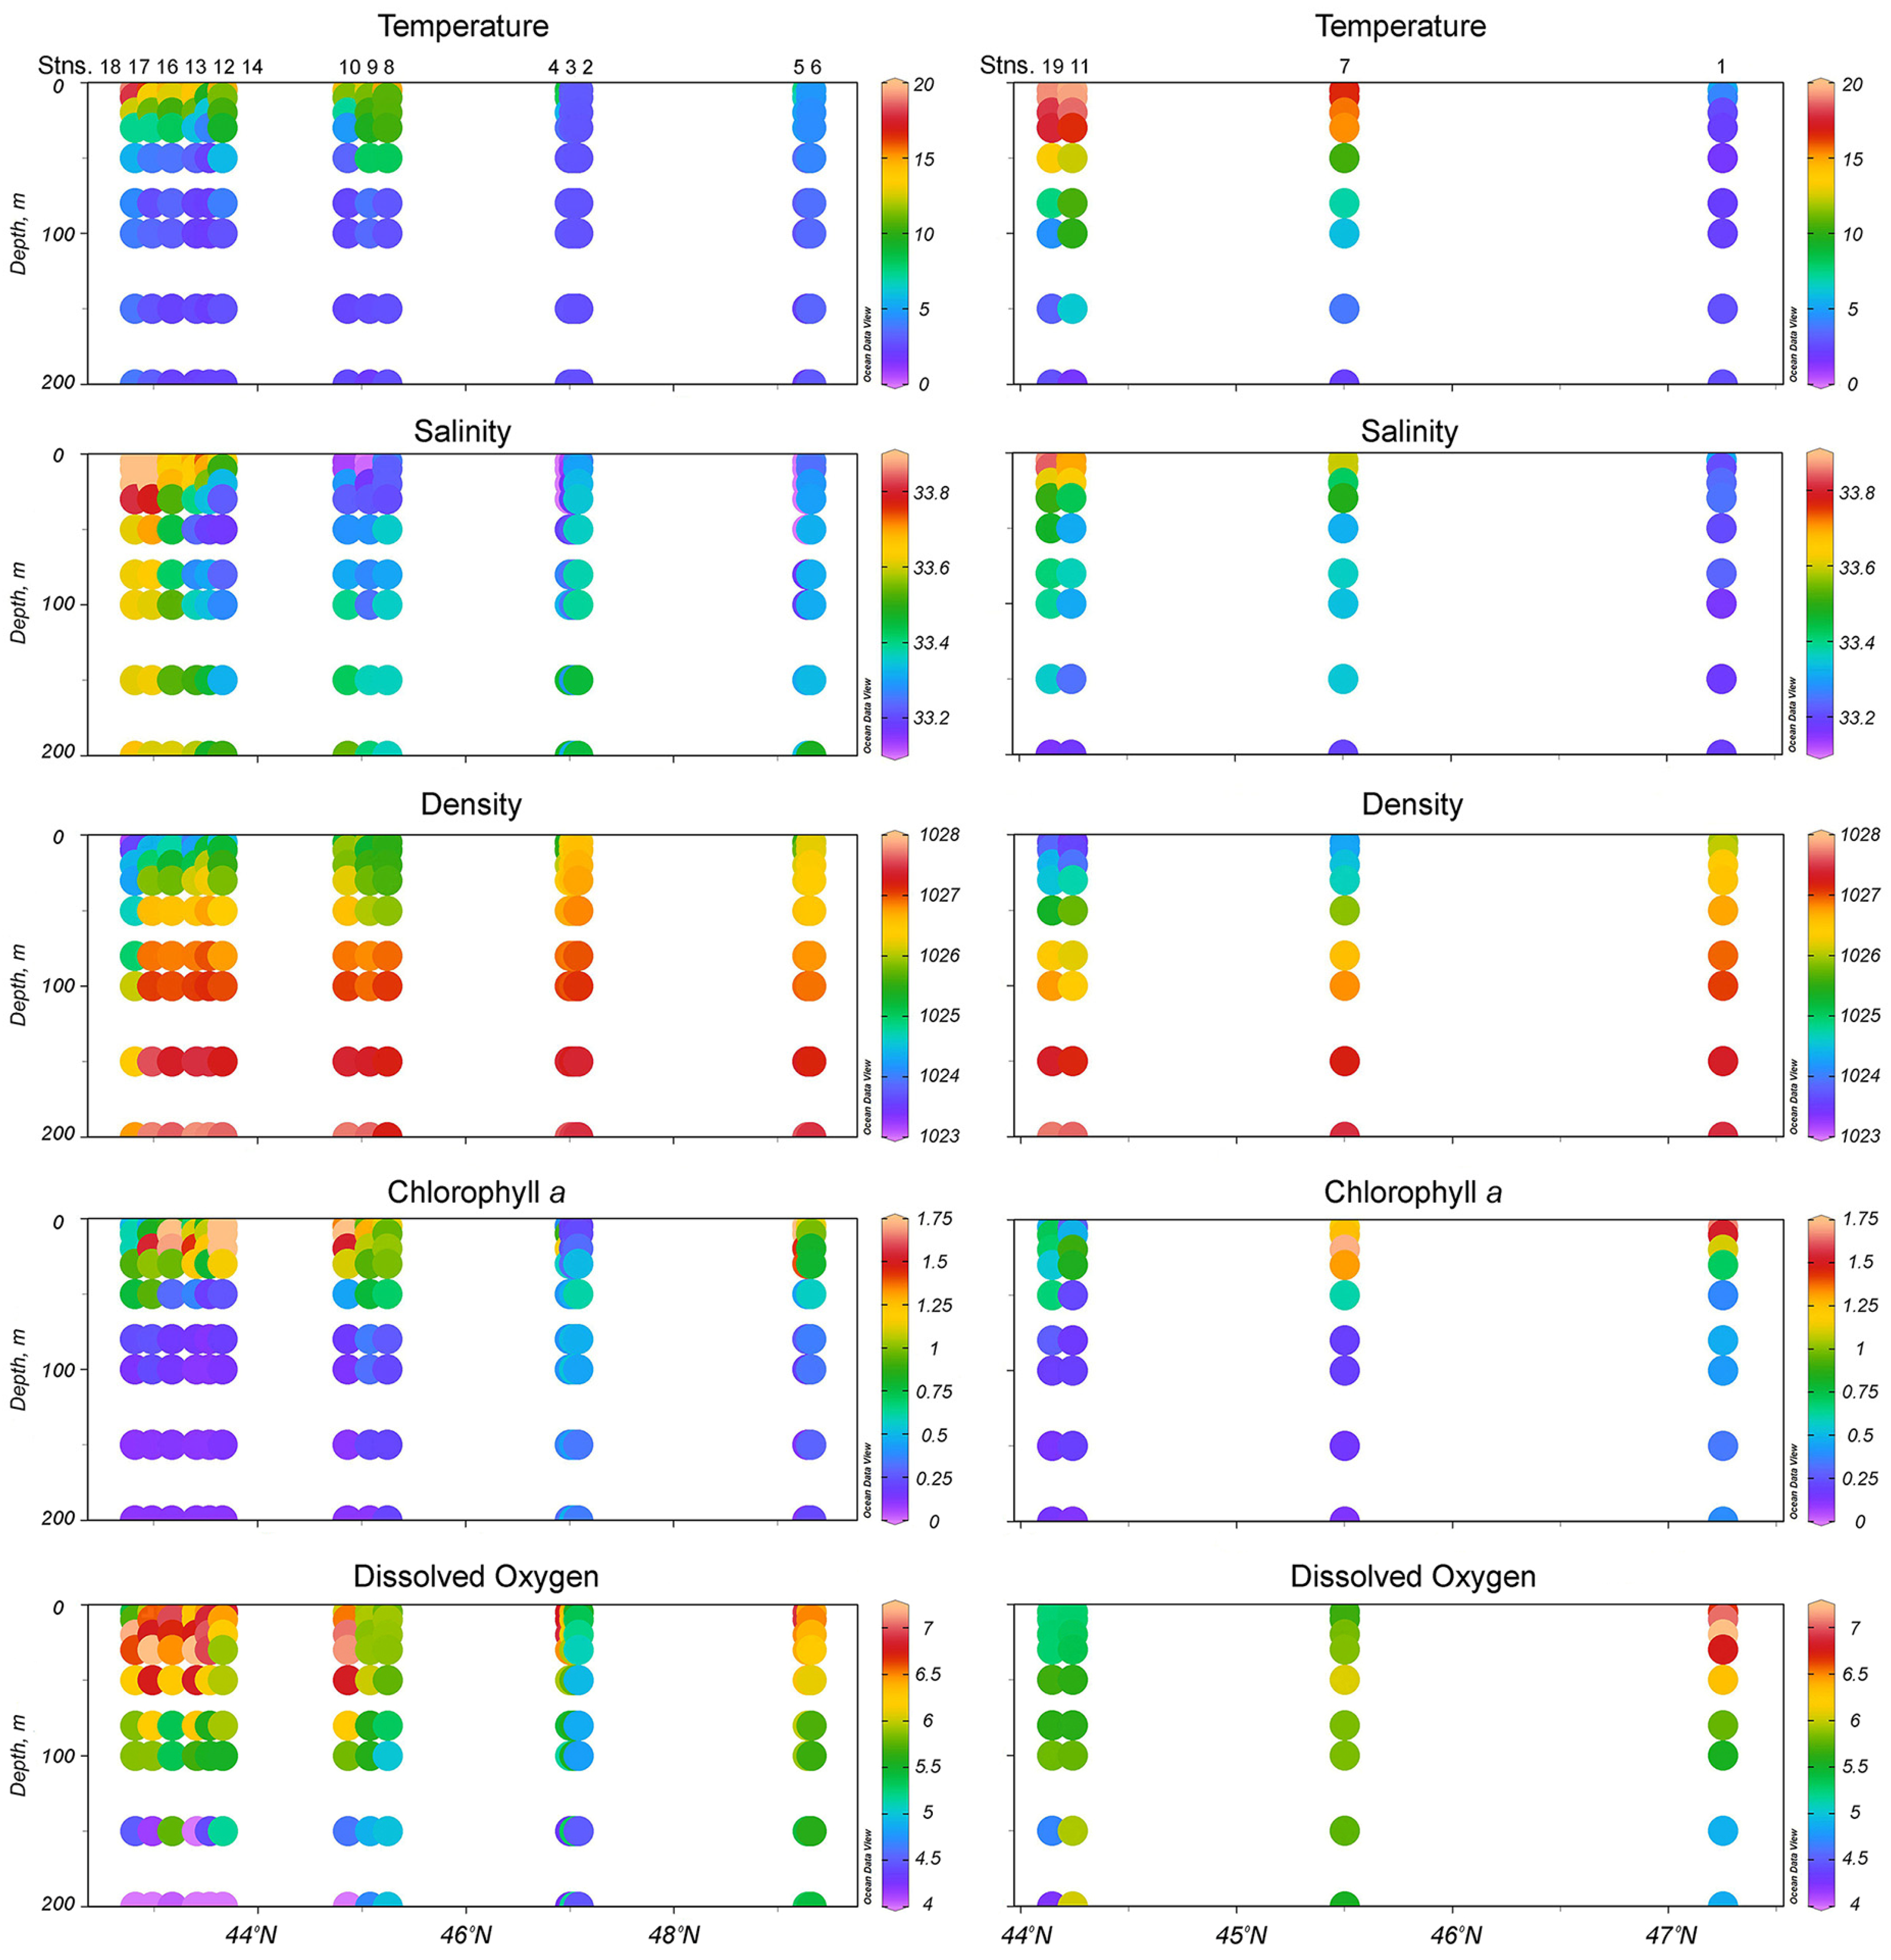
3.1. Environments
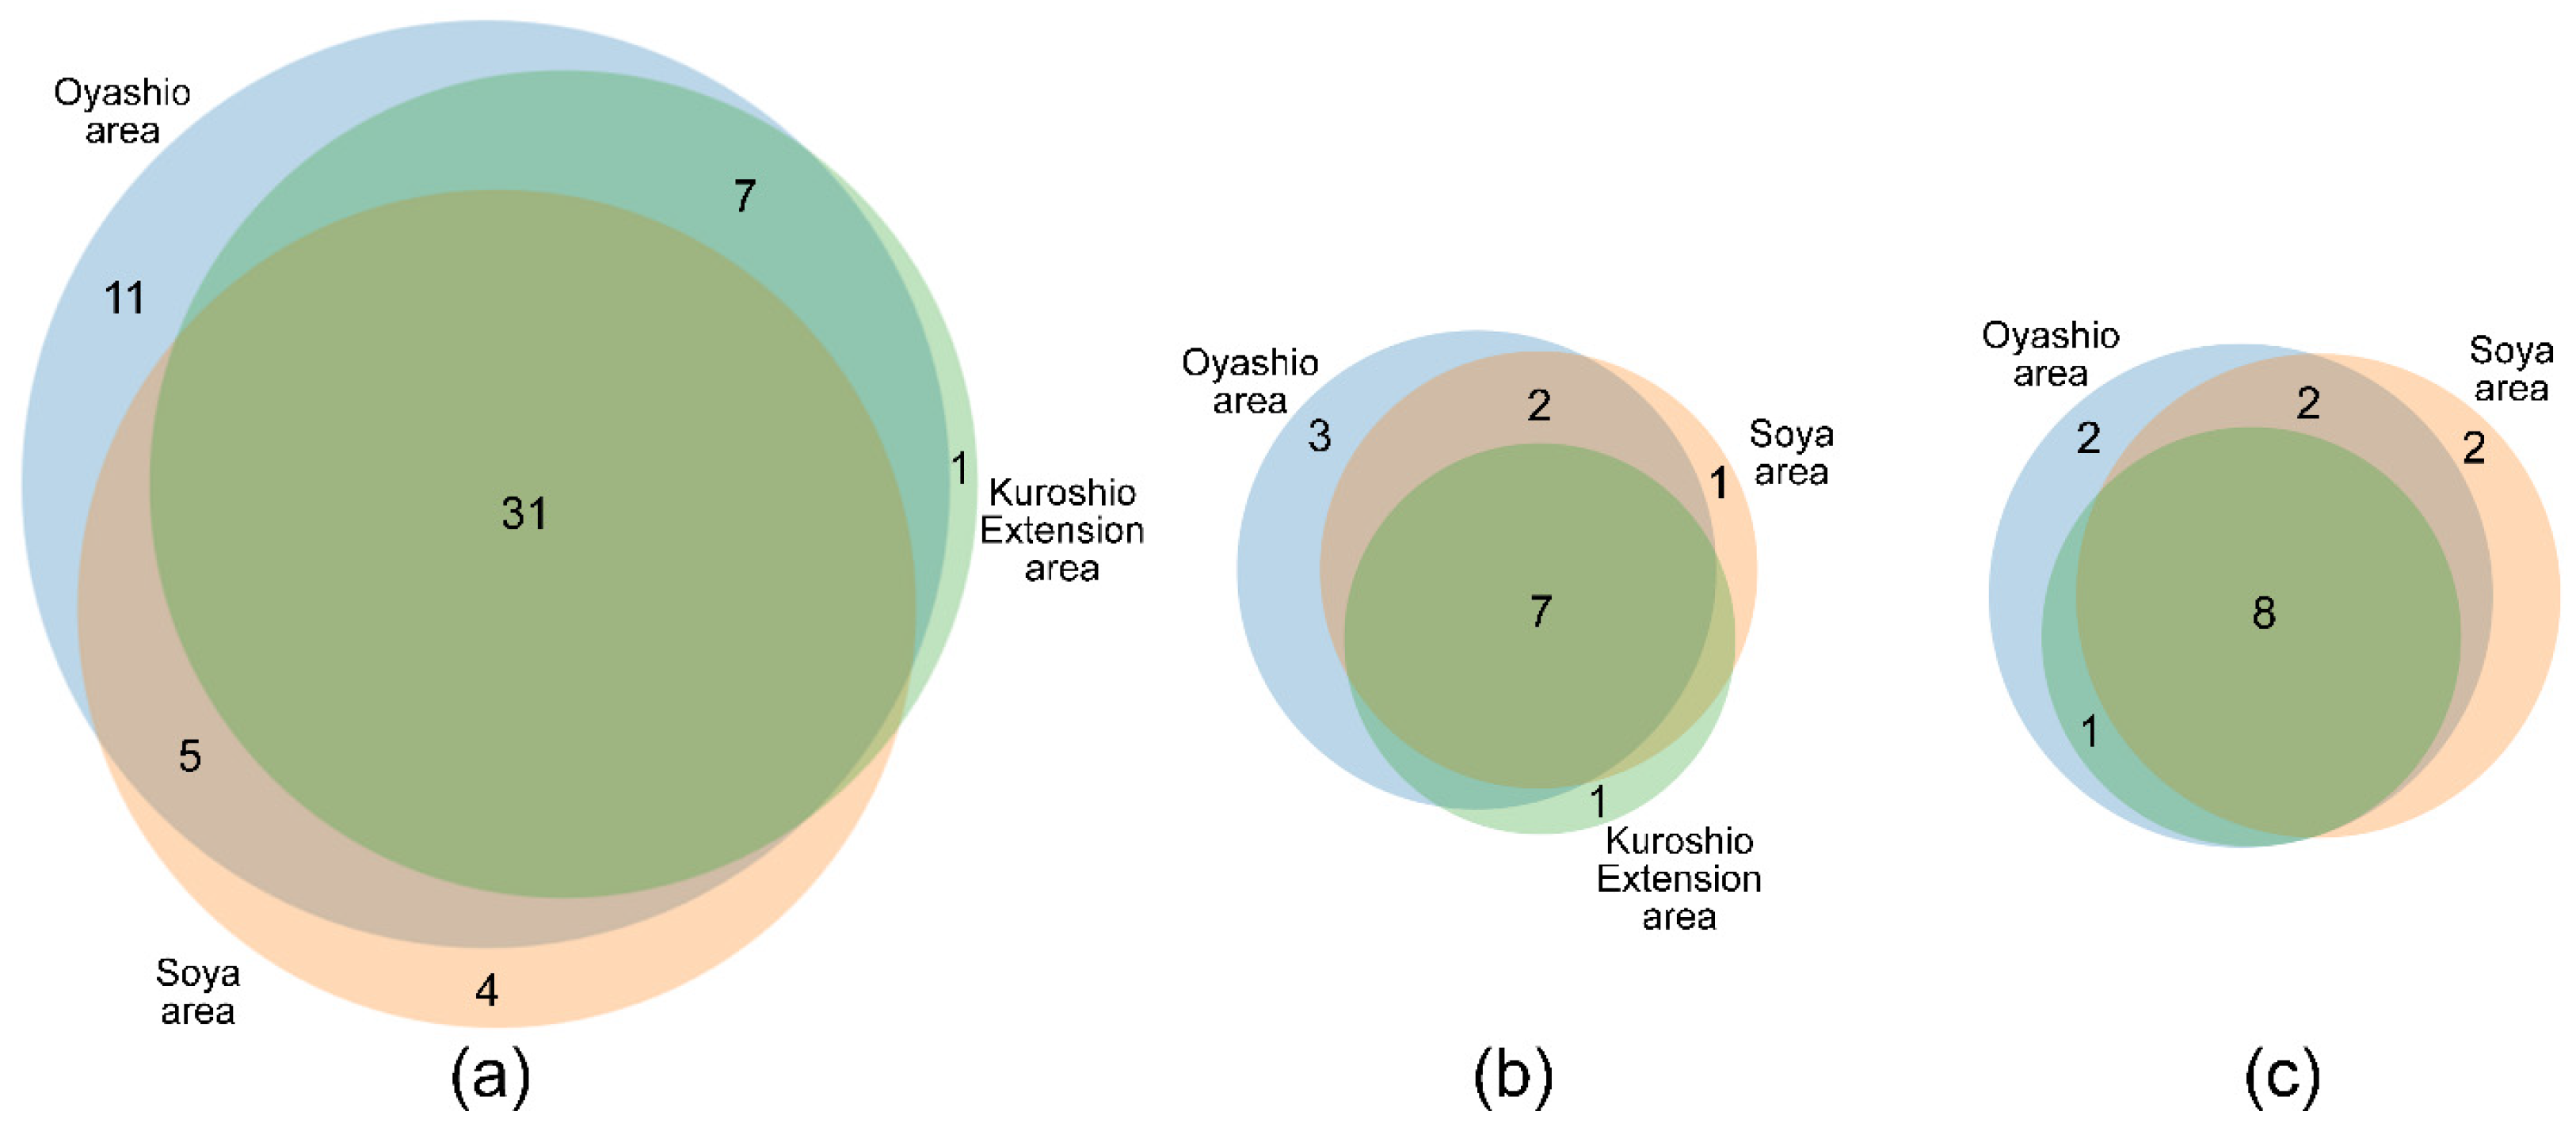
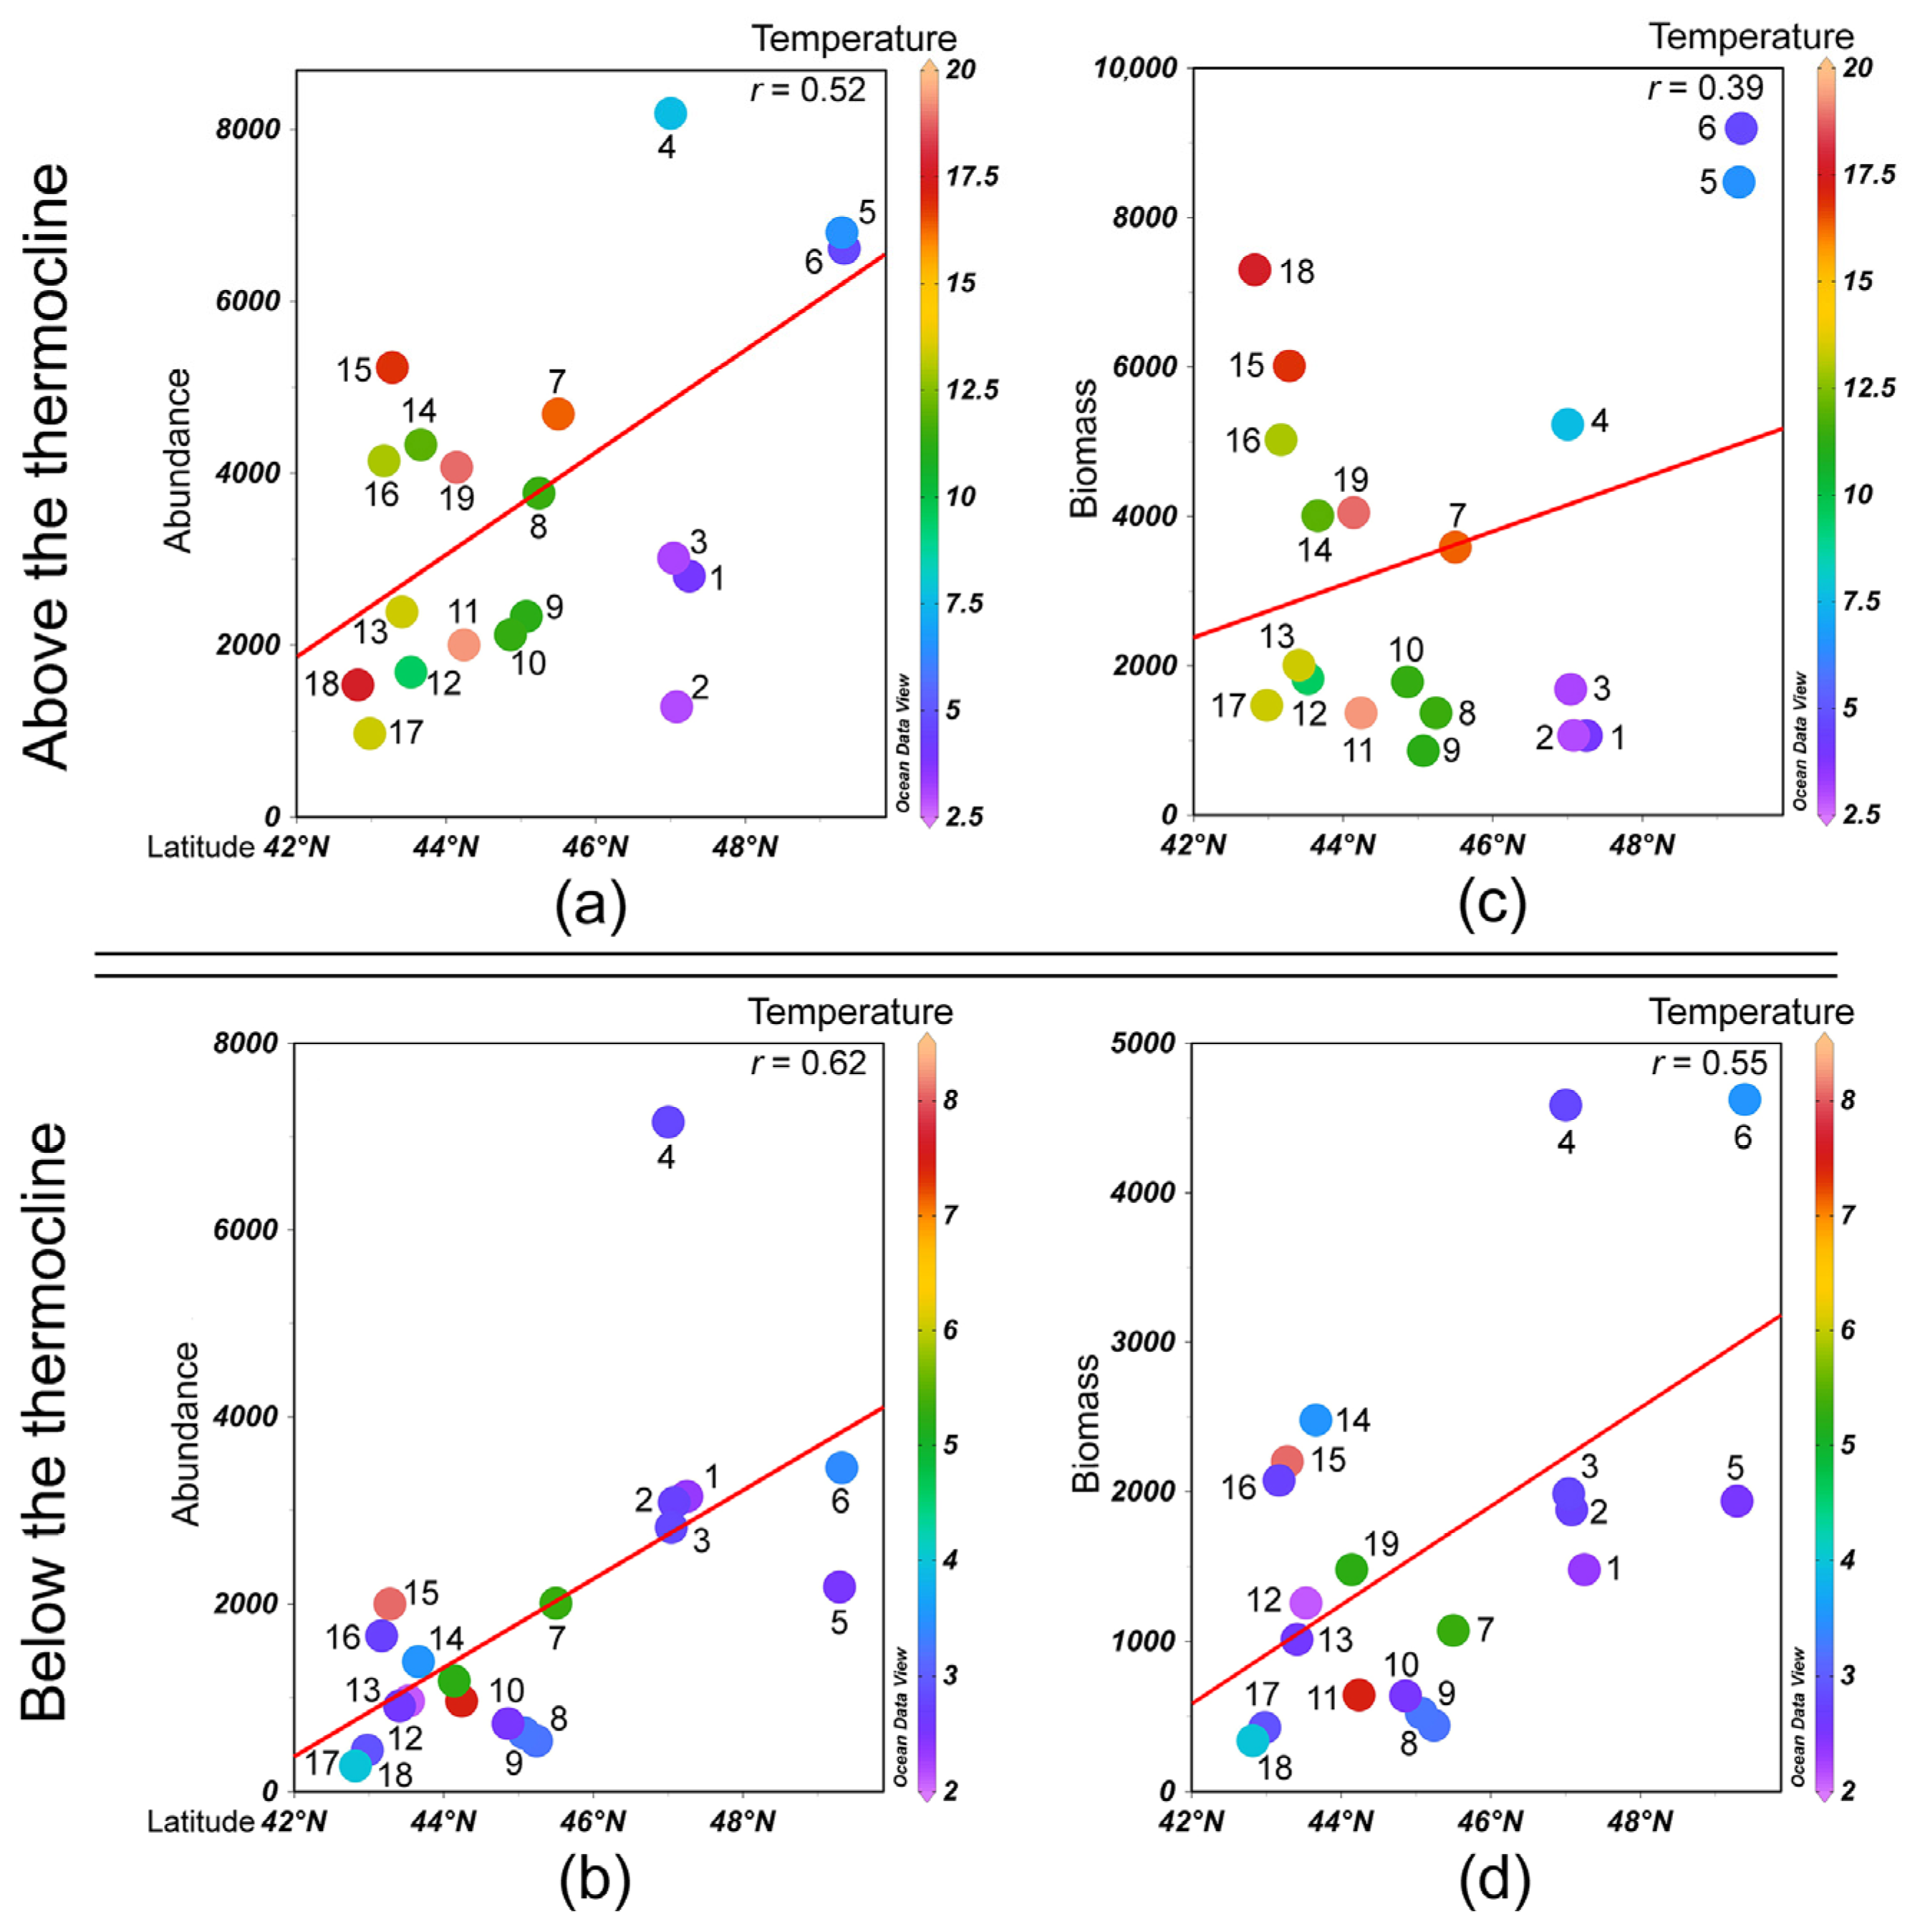
3.2. Species Composition and Distribution Patterns of Abundance and Biomass
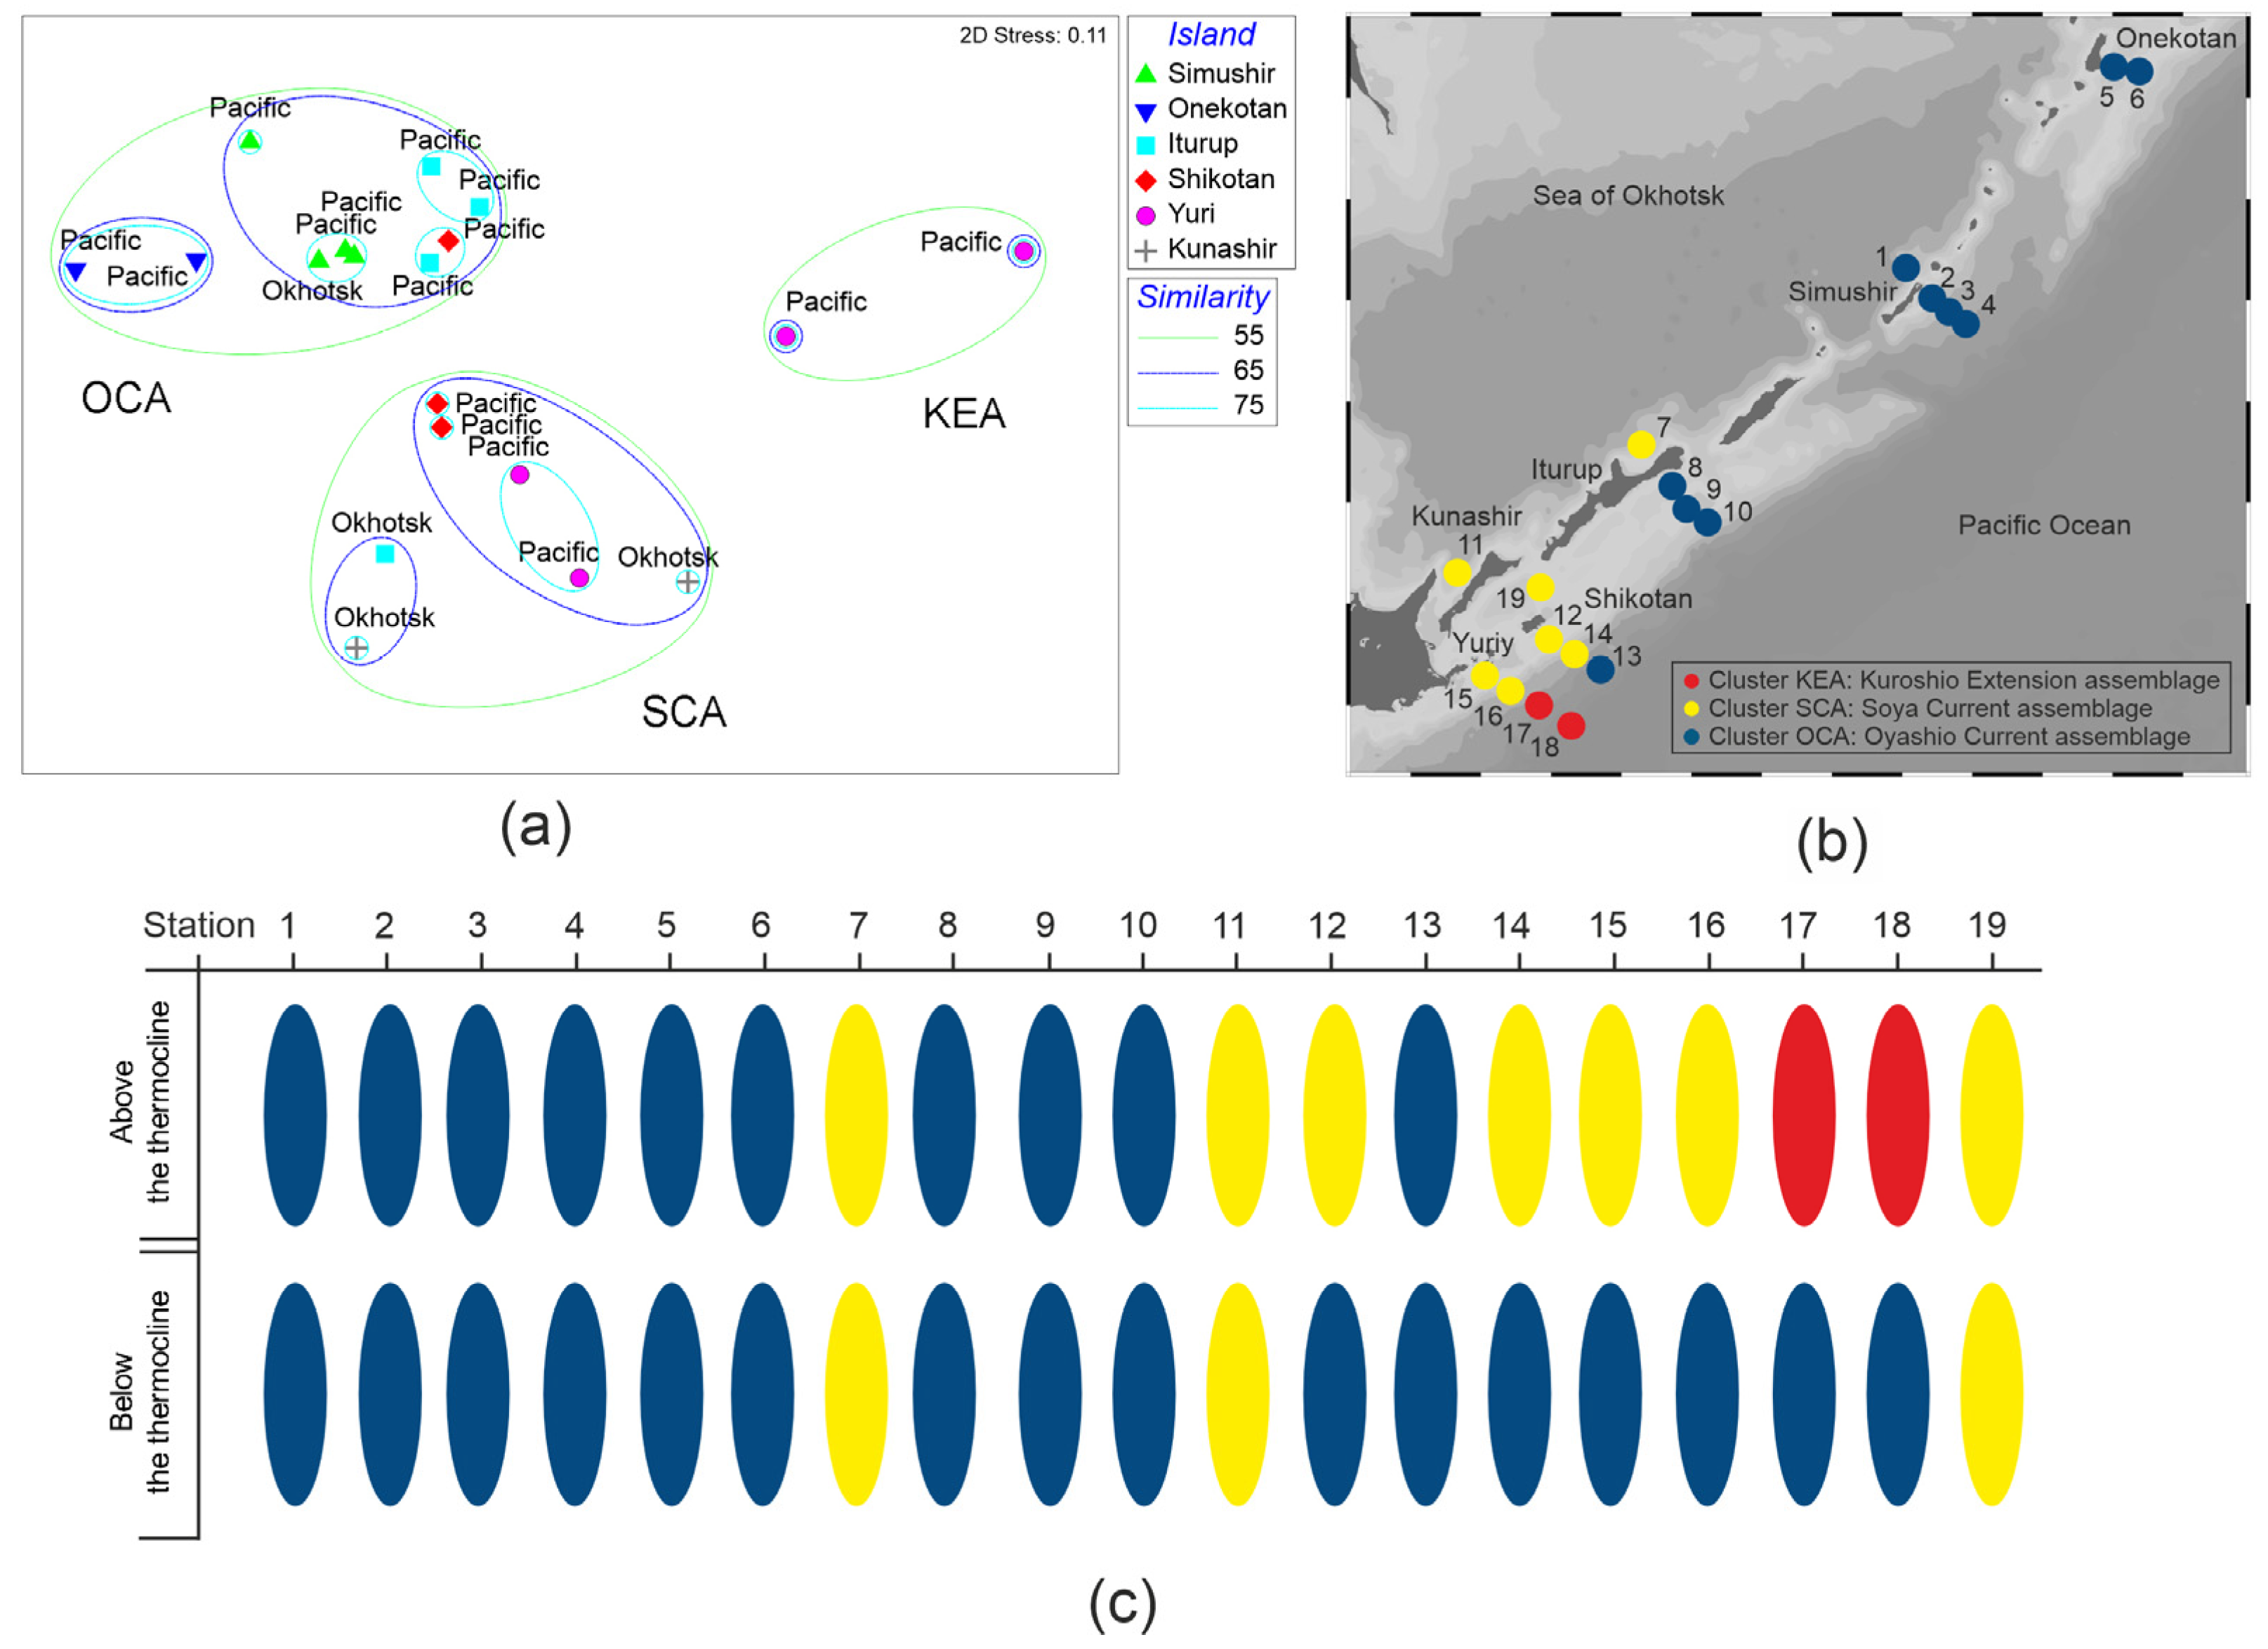
3.3. Community Analysis
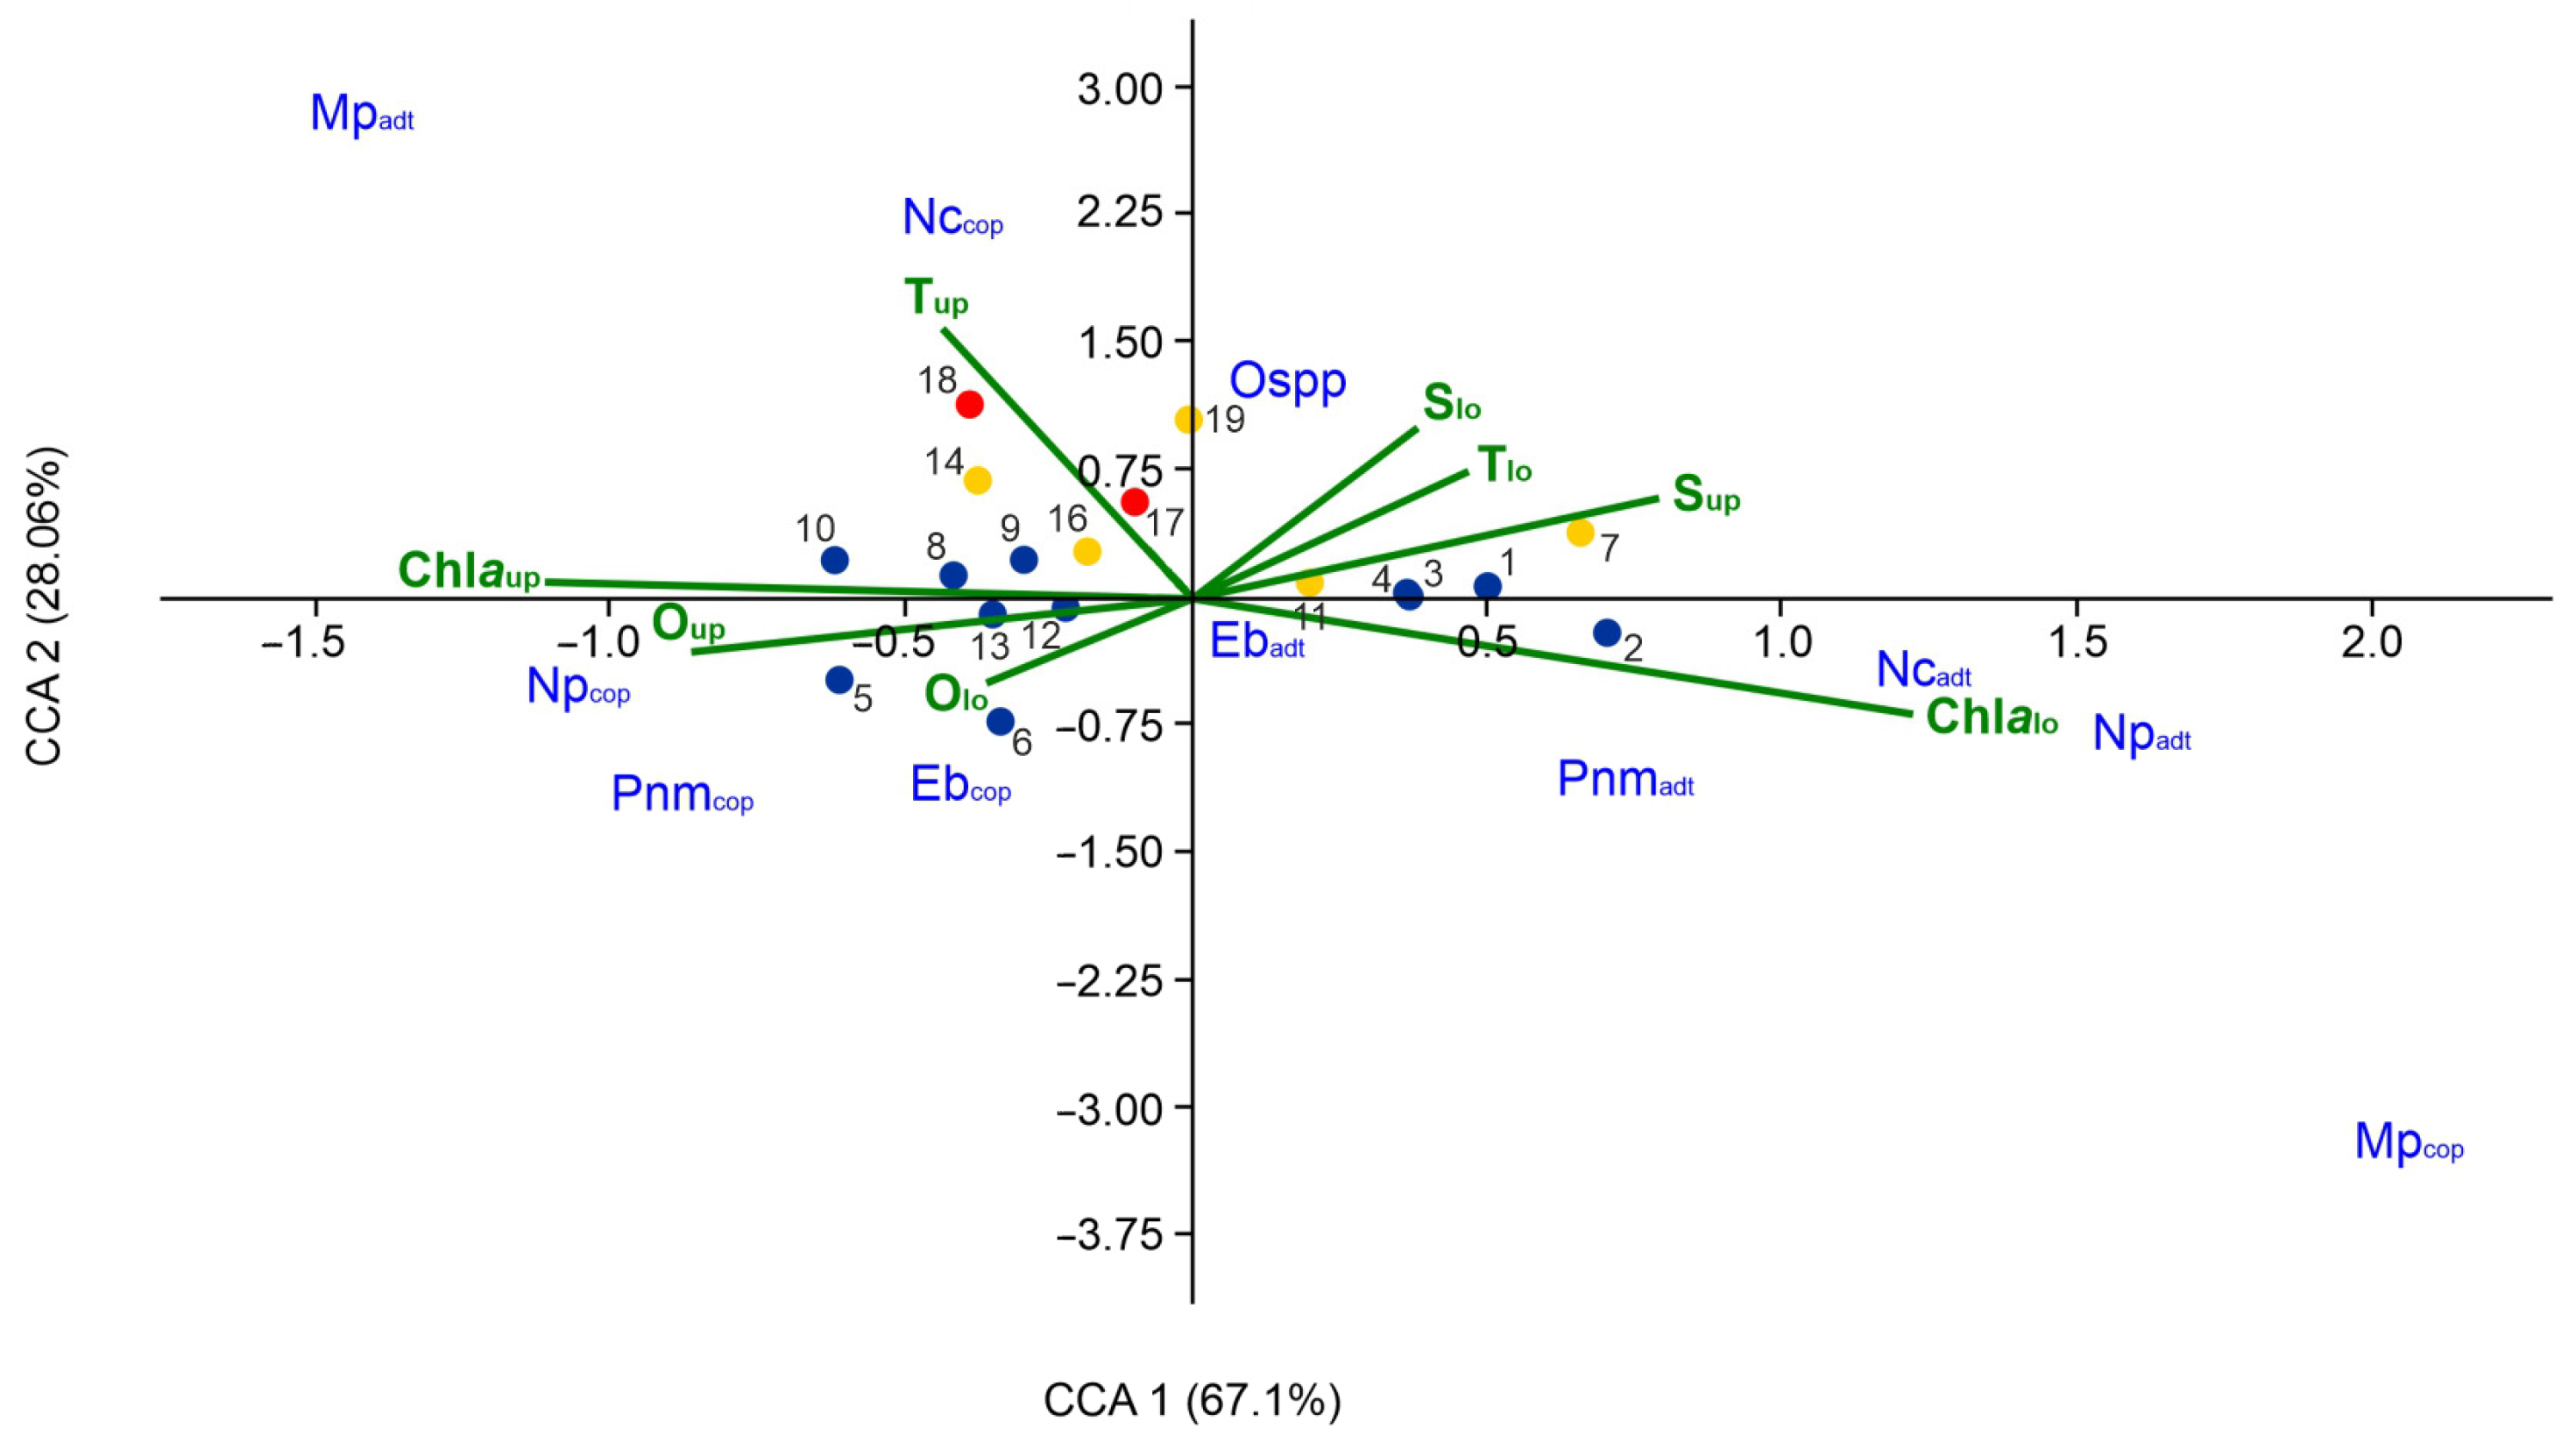
3.4. Correlation with Environmental Conditions
4. Discussion
5. Conclusions
Supplementary Materials
Funding
Institutional Review Board Statement
Informed Consent Statement
Data Availability Statement
Acknowledgments
Conflicts of Interest
References
- Badaev, O.; Boldyrev, V.; Shabelsky, D.; Solodovnikov, S. South Kuril zone: The state of resources and fishery in 2000–2020. Fisheries 2021, 5, 48–55. [Google Scholar] [CrossRef]
- Shuntov, V.P. Biology of the Far Eastern Seas of Russia; TINRO-Center Press: Vladivostok, Russia, 2016; Volume 2, pp. 5–604. ISBN 978-5-6045112-6-8. [Google Scholar]
- Ivanov, O.A.; Khoruzhiy, A.A. Interannual dynamics of the fish community’s integral characteristics in the upper epipelagic layer of Russian Pacific waters in June–September 2004–2018. J. Ichthyol. 2019, 59, 727–742. [Google Scholar] [CrossRef]
- Kuznetsova, E.N.; Belorustseva, S.A.; Polyanichko, V.I. Distribution and nutrition japanese sardine Sardinops sagas and chub mackerel Scomber japonicus in Pacific waters of Kuril Islands. Probl. Fish. 2021, 22, 27–39. Available online: https://vr.vniro.ru/jour/article/view/137 (accessed on 3 July 2025).
- Chebanova, V.V.; Frenkel, S.E.; Zelenikhina, G.S. Relation of Feeding in Juvenile Chum Salmon (Oncorhynchus keta) and Pink Salmon (O. gorbuscha) to Abundance of Zooplankton in Coastal Waters of the Prostor Bay (Iturup Island). J. Ichthyol. 2018, 58, 741–750. [Google Scholar] [CrossRef]
- Shuntov, V.P. Biology of the Far Eastern Seas of Russia; TINRO-Center Press: Vladivostok, Russia, 2001; Volume 1, pp. 8–579. ISBN 978-5-6045112-6-8. [Google Scholar]
- Rogachev, K.A.; Carmack, E.C.; Foreman, M.G.G. Bowhead whales feed on plankton concentrated by estuarine and tidal currents in Academy Bay, Sea of Okhotsk. Cont. Shelf Res. 2008, 28, 1811–1826. [Google Scholar] [CrossRef]
- Hongsheng, B.I.; Peterson, W.T.; Lamb, J.; Casillas, E. Copepods and salmon: Characterizing the spatial distribution of juvenile salmon along the Washington and Oregon coast, USA. Fish. Oceanogr. 2011, 20, 125–138. [Google Scholar] [CrossRef]
- Naidenko, S.; Khoruzhiy, A. Trophodynamics of nekton communities in the epipelagic layer of the North-West Pacific in summer and winter seasons. Izv. TINRO 2017, 188, 181–203. [Google Scholar] [CrossRef]
- Shevchenko, G.V.; Tshay, Z.R.; Chastikov, V.N. Oceanological conditions in the area of South Kuril Islands according to ship and satellite observations. Oceanol. Res. 2021, 49, 21–44. Available online: https://jor.ocean.ru/index.php/jor/article/view/678 (accessed on 3 July 2025). [CrossRef]
- Khen, G.V.; Ustinova, E.I.; Sorokin, Y.D. Long-term changes in thermal conditions on the surface of the Far-Eastern Seas and North-West Pacific and their relationship with large-scale climate processes. Izv. TINRO 2022, 202, 187–207. [Google Scholar] [CrossRef]
- Kim, S.T. The Thermal Regime of Japan (East), Okhotsk Seas, and Pacific Ocean Waters Adjacent to Sakhalin and Kuril Islands. Oceanology 2022, 62, 597–610. [Google Scholar] [CrossRef]
- Qiu, B. Kuroshio and Oyashio currents. In Encyclopedia of Ocean Sciences; Steele, J.H., Ed.; Academic Press: Hilo, HI, USA, 2001; pp. 1413–1425. [Google Scholar] [CrossRef]
- Hu, D.; Wu, L.; Cai, W.; Gupta, A.; Ganachaud, A.; Qiu, B.; Gordon, A.L.; Lin, X.; Chen, Z.; Hu, S.; et al. Pacific western boundary currents and their roles in climate. Nature 2015, 522, 299–308. [Google Scholar] [CrossRef] [PubMed]
- Novikov, Y.V.; Samko, E.V. Peculiarities of interannual variability of oceanological conditions during the saury fishery in the South Kuril region in 2002-2012. Proc. VNIRO 2016, 164, 75–85. Available online: http://www.vniro.ru/files/trydi_vniro/archive/tv_2016_t_164_article_5.pdf (accessed on 3 July 2025).
- Andreev, A.G. Study of the Soya current in the southern part of the Okhotsk Sea by satellite data. Explor. Earth Space 2022, 1, 19–29. [Google Scholar] [CrossRef]
- Zhang, C.I.; Radchenko, V.; Sugimoto, T.; Hyun, S. Interdisciplinary physical and biological processes of the Sea of Okhotsk and the Japan/East Sea. In The Global Coastal Ocean, Interdisciplinary Regional Studies and Syntheses; Robinson, A.R., Brink, K.H., Eds.; Harvard University Press: Cambridge, MA, USA, 2006; p. 815. [Google Scholar]
- Shevchenko, G.V.; Lozhkin, D.M. Seasonal variations in the surface temperature of the Sea of Okhotsk and surrounding regions from satellite data. J. Oceanol. Res. 2022, 50, 25–37. Available online: https://jor.ocean.ru/index.php/jor/article/view/757 (accessed on 3 July 2025). [CrossRef]
- Khen, G.V.; Ustinova, E.I.; Sorokin, Y.D. Principal climate indices for the North Pacific: Nature and history (a review). Izv. TINRO 2019, 197, 166–181. [Google Scholar] [CrossRef]
- Pinchuk, A.; Paul, A.J. Zooplankton of the Okhotsk Sea: A Review of Russian Studies; University of Alaska: Anchorage, AK, USA, 2000; p. 52. Available online: https://www.researchgate.net/publication/257785485 (accessed on 15 March 2025).
- Chiba, S.; Tadokoro, K.; Sugisaki, H.; Saino, T. Effects of decadal climate change on zooplankton over the last 50 years in the Western North Pacific. Glob. Change Biol. 2006, 12, 907–920. [Google Scholar] [CrossRef]
- Chiba, S.; Sugisaki, H.; Nonaka, M.; Saino, T. Geographical shift of zooplankton communities and decadal dynamics of the Kuroshio–Oyashio currents in the western North Pacific. Glob. Change Biol. 2009, 15, 1846–1858. [Google Scholar] [CrossRef]
- Chiba, S.; Di Lorenzo, E.; Davis, A.; Keister, J.E.; Taguchi, B.; Sasai, Y.; Sugisaki, H. Large-scale climate control of zooplankton transport and biogeography in the Kuroshio-Oyashio Extension region. Geophys. Res. Lett. 2013, 40, 5182–5187. [Google Scholar] [CrossRef]
- Park, N.; Choi, H.; Shin, K.; Lee, W. Distribution of siphonophores in the Northwest Pacific Ocean and links to environmental conditions. Front. Mar. Sci. 2023, 10, 1223477. [Google Scholar] [CrossRef]
- Shuntov, V.P.; Volvenko, I.V. Supplements to quantitative assessments of zooplankton in the Far Eastern Seas and adjacent waters of the North Pacific. Izv. TINRO 2017, 191, 130–146. [Google Scholar] [CrossRef]
- Zuenko, Y.; Aseeva, N.; Glebova, S.; Gostrenko, L.; Dubinina, A.; Dulepova, E.; Zolotov, A.; Loboda, S.; Lysenko, A.; Matveev, V.; et al. Recent changes in the Okhotsk Sea ecosystem (2008–2018). Izv. TINRO 2019, 197, 35–61. [Google Scholar] [CrossRef]
- Naydenko, S.; Khoruzhiy, A. The food supply for nekton in the epipelagic layer of Pacific waters at the Kuril Islands in the summer seasons of the 2000s. Russ. J. Mar. Biol. 2014, 40, 502–518. [Google Scholar] [CrossRef]
- Ashlock, L.; García-Reyes, M.; Gentemann, C.; Batten, S.; Sydeman, W. Temperature and Patterns of Occurrence and Abundance of Key Copepod Taxa in the Northeast Pacific. Front. Mar. Sci. 2021, 8, 670795. [Google Scholar] [CrossRef]
- Naidenko, S.; Shebanova, M.; Kuznetsova, N.; Radchenko, K.; Metreveli, V. Long-term dynamics of the food base for nekton in Pacific waters at the Kuril Islands and Kamchatka in summer. Izv. TINRO 2024, 204, 799–822. [Google Scholar] [CrossRef]
- Bokhan, L.; Zuenko, Y. Seasonal development of plankton in the zones of different temperature structure in the region of the southern Kurile Islands. Izv. TINRO 1995, 21, 181–188. (In Russian) [Google Scholar]
- Dulepova, E.P. Dynamics of structural characteristics of zooplankton communities of the Sakhalin-Kurile region. Russ. J. Mar. Biol. 1996, 22, 271–275. Available online: https://www.elibrary.ru/item.asp?id=13234684 (accessed on 13 March 2025).
- Naidenko, S. Composition, Biomass Dynamics, and Consumption of Zooplankton in the Epipelagic Zone of the South Kuril Region during the 1990s. Russ. J. Mar. Biol. 2002, 28, 244–251. [Google Scholar] [CrossRef]
- Kuznetsova, N.A.; Shebanova, M.A. State of plankton community in the Kuril waters under recent renewal of mass feeding northward migrations of subtropical fish. Izv. TINRO 2017, 190, 119–131. [Google Scholar] [CrossRef]
- Nadtochy, V. Seasonal Dynamics of Plankton in Zones with Different Thermal Structures of Water off the Southern Kuril Islands. Russ. J. Mar. Biol. 2004, 30, 223–230. [Google Scholar] [CrossRef]
- Ahyong, S.; Boyko, C.B.; Bernot, J.; Brandão, S.N.; Daly, M.; De Grave, S.; de Voogd, N.J.; Gofas, S.; Hernandez, F.; Hughes, L.; et al. World Register of Marine Species (WoRMS). 2025. Available online: https://www.marinespecies.org (accessed on 5 April 2025).
- Razouls, C.; Desreumaux, N.; Kouwenberg, J.; de Bovee, F. Biodiversity of Marine Planktonic Copepods (Morphology, Geographic Distribution and Biological Data). Sorbonne University, CNRS, 2005–2025. Available online: https://copepodes.obs-banyuls.fr/en/loc.php?loc=23 (accessed on 22 February 2025).
- Borisov, B.; Volkov, A.; Gorbatenko, K.; Koval, M.; Shershneva, V. Standard tables of crude weight and some energy characteristics (calories, fats, proteins, carbohydrates, mineral residue) of zooplankton of the Far Eastern seas. Izv. TINRO 2004, 138, 355–367. Available online: https://cyberleninka.ru/article/n/standartnye-tablitsy-syrogo-vesa-i-nekotoryh-energeticheskih-harakteristik-kaloriynost-zhiry-belki-uglevody-mineralnyy-ostatok (accessed on 1 March 2025).
- Clarke, K.R.; Warwick, R.M. Change in Marine Communities. An Approach to Statistical Analysis and Interpretation, 2nd ed.; PRIMER–E Ltd.: Plymouth, UK, 2001; p. 144. [Google Scholar]
- Shannon, C.E. A mathematical theory of communication. Bell Syst. Tech. J. 1948, 27, 379–423. [Google Scholar] [CrossRef]
- Clarke, K.; Ainsworth, M.A. A method of linking multivariate community structure to environmental variables. Mar. Ecol. Prog. Ser. 1993, 92, 205–219. Available online: http://www.jstor.org/stable/24832527 (accessed on 2 March 2025). [CrossRef]
- Clarke, K.R.; Gorley, R.N. PRIMER v6: User Manual/Tutorial; PRIMER–E Ltd.: Plymouth, UK, 2006; p. 192. Available online: https://scirp.org/reference/referencespapers?referenceid=1371182 (accessed on 3 July 2025).
- Hammer, O.; Harper, D.A.T.; Ryan, P.D. PAST: Paleontological statistics software package for education and data analysis. Palaeontol. Electron. 2001, 4, 9. Available online: http://palaeo-electronica.org/2001_1/past/issue1_01.htm (accessed on 18 March 2025).
- Schlitzer, R. Ocean Data View; Alfred Wegener Institute: Bremerhaven, Germany, 2012; p. 151. Available online: http://odv.awi.de (accessed on 13 February 2025).
- Nakanowatari, T.; Ohshima, K.; Mensah, V.; Mitani, Y.; Hattori, K.; Kobayashi, M.; Roquet, F.; Sakurai, Y.; Mitsudera, H.; Wakatsuchi, M. Multidecadal-scale freshening at the salinity minimum in the Western Part of North Pacific: Importance of wind-driven cross-gyre transport of subarctic water to the subtropical gyre. J. Phys. Oceanogr. 2015, 45, 988–1008. [Google Scholar] [CrossRef]
- Zhang, Y.; Zhang, Z.; Chen, D.; Qiu, B.; Wang, W. Strengthening of the Kuroshio current by intensifying tropical cyclones. Science 2020, 368, 988–993. [Google Scholar] [CrossRef]
- Gallienne, C.P.; Robins, D.B. Is Oithona the most important copepod in the world’s oceans? J. Plankton Res. 2001, 23, 1421–1432. [Google Scholar] [CrossRef]
- Miyamoto, H.; Okazaki, Y.; Itoh, H.; Hidaka, K.; Saito, H. Community structure of whole pelagic copepods along the Kuroshio: Increase in the abundance and size in the north frontal area of the Kuroshio axis near the Japanese archipelago. Deep Sea Res. Part I 2024, 211, 104346. [Google Scholar] [CrossRef]
- Dvoretsky, V.G.; Dvoretsky, A.G. Life cycle of Oithona similis (Copepoda: Cyclopoida) in Kola Bay (Barents Sea). Mar. Biol. 2009, 156, 1433–1446. [Google Scholar] [CrossRef]
- Wang, L.; Du, F.; Wang, X.; Li, Y.; Ning, J. Distribution and role of the genus Oithona (Copepoda: Cyclopoida) in the South China Sea. Oceanologia 2017, 59, 300–310. [Google Scholar] [CrossRef]
- Tadokoro, S.; Chiba, T.; Ono, T.; Midorikawa, T.; Saino, T. Interannual variation in Neocalanus biomass in the Oyashio Waters of the Western North Pacific. Fish. Oceanogr. 2005, 14, 210–222. [Google Scholar] [CrossRef]
- Ikeda, T.; Shiga, N.; Yamaguchi, A. Structure, biomass distribution and trophodynamics of the pelagic ecosystem in the Oyashio region, western subarctic Pacific. J. Oceanogr. 2008, 64, 339–354. [Google Scholar] [CrossRef]
- Itoh, H.; Nishioka, J.; Tsuda, A. Community structure of mesozooplankton in the western part of the Sea of Okhotsk in summer. Prog. Oceanogr. 2014, 126, 224–232. [Google Scholar] [CrossRef]
- Miller, C.; Frost, B.; Batchelder, H.; Clemons, M.; Conway, R. Life histories of large, grazing copepods in a subarctic ocean gyre: Neocalanus plumchrus, Neocalanus cristatus, and Eucalanus bungii in the Northeast Pacific. Prog. Oceanogr. 1984, 13, 201–243. [Google Scholar] [CrossRef]
- Miyamoto, H.; Takahashi, K.; Kuroda, H.; Watanabe, T.; Taniuchi, Y.; Kuwata, A.; Kasai, H.; Kakehi, S.; Fuji, T.; Suyama, S.; et al. Copepod community structure in the transition region of the North Pacific Ocean: Water mixing as a key driver of secondary production enhancement in subarctic and subtropical waters. Prog. Oceanogr. 2022, 207, 102865. [Google Scholar] [CrossRef]
- Kang, Y.S.; Jung, S.; Zuenko, Y.; Choi, I.; Dolganova, N. Regional differences in response of mesozooplankton to long-term oceanographic changes (regime shifts) in the northeastern Asian marginal seas. Prog. Oceanogr. 2012, 97–100, 120–134. [Google Scholar] [CrossRef]
- Yatsu, A.; Chiba, S.; Yamanaka, Y.; Ito, S.; Shimizu, Y.; Kaeriyama, M.; Watanabe, Y. Climate forcing and the Kuroshio/Oyashio ecosystem. ICES J. Mar. Sci. 2013, 70, 922–933. [Google Scholar] [CrossRef]
- Kuroda, H.; Mitsudera, H.; Sugimoto, S.; Suga, T.; Kakehi, S.; Kasai, H.; Sasano, D.; Ono, T.; Kaeriyama, H.; Taniuchi, Y.; et al. PICES Region 18: Marine Ecosystems of the North Pacific Ocean (2009–2016); North Pacific Marine Science Organization: Sidney, BC, Canada, 2021; p. 47. Available online: https://meetings.pices.int/publications/special-publications/NPESR/2021/PICES_NPESR3_Region18_Report.pdf (accessed on 3 July 2025).
- Pasternak, A.F.; Arashkevich, E.G.; Grote, U.; Nikishina, A.B.; Solovyev, K.A. How increasing water temperature affects egg production in Calanus finmarchicus and Calanus glacialis. Oceanology 2013, 53, 618–625. [Google Scholar] [CrossRef]
- Ershova, E.A.; Kosobokova, K.N.; Vorobieva, O.V. Changes in the egg production rate of two copepod species of the genus Pseudocalanus in relation to temperature in the White Sea. Oceanology 2016, 56, 540–545. [Google Scholar] [CrossRef]
- Kobari, T.; Ikeda, T. Ontogenetic migration and life cycle of Neocalanus plumchrus (Crustacea: Copepoda) in the Oyashio region, with notes on its regional variations in body size. J. Plankton Res. 2001, 23, 287–302. [Google Scholar] [CrossRef]
- Kooka, K.; Hamatsu, T.; Yamamura, O. Transported zooplankton from the Okhotsk Sea facilitate feeding and growth of juvenile walleye pollock on a continental shelf along the Oyashio Current, western subarctic Pacific. Mar. Biol. 2018, 165, 100. [Google Scholar] [CrossRef]
- Kobari, T.; Moku, M.; Takahashi, K. Seasonal appearance of expatriated boreal copepods in the Oyashio–Kuroshio mixed region. ICES J. Mar. Sci. 2008, 65, 469–476. [Google Scholar] [CrossRef]
- Yamaguchi, A.; Watanabe, Y.; Ishida, H.; Harimoto, T.; Furusawa, K.; Suzuki, S.; Yamaguchi, A.; Watanabe, Y.; Ishida, H.; Harimoto, T.; et al. Community and trophic structures of pelagic copepods down to greater depths in the western subarctic Pacific (WEST-COSMIC). Deep Sea Res. Part I 2002, 49, 1007–1025. [Google Scholar] [CrossRef]
- Yamaguchi, A. Inter-oceanic comparison of planktonic copepod ecology (vertical distribution, abundance, community structure, population structure and body size) between the Okhotsk Sea and Oyashio region. J. Nat. Hist. 2015, 49, 2743–2757. [Google Scholar] [CrossRef]

| Taxa | KEA | SCA | OCA | KEA vs. SCA | KEA vs. OCA | OCA vs. SCA | ||||||
|---|---|---|---|---|---|---|---|---|---|---|---|---|
| Sim/SD | Contr, % | Sim/SD | Contr, % | Sim/SD | Contr, % | Diss/SD | Contr, % | Diss/SD | Contr, % | Diss/SD | Contr, % | |
| Oithona spp. | 1.3 | 17.7 | 2.1 | 36.5 | 2.4 | 49.6 | 1.6 | 22.5 | 1.9 | 34.7 | 1.1 | 20.5 |
| Pseudocalanus newmani | 2.1 | 22.0 | 0.1 | 17.0 | 1.6 | 11.6 | ||||||
| Pseudocalanus minutus | 0.8 | 6.7 | 0.8 | 9.8 | 0.9 | 7.9 | 0.7 | 13.1 | 0.9 | 14.3 | ||
| Paracalanus parvus | 0.6 | 6.5 | 2.1 | 42.2 | 2.1 | 33.1 | 1.8 | 30.3 | ||||
| Metridia pacifica | 2.2 | 26.0 | 0.8 | 6.7 | 1.9 | 6.3 | 1.5 | 5.1 | ||||
| Eucalanus bungii | 1.7 | 3.7 | ||||||||||
| Salpida | 0.4 | 26.6 | 1.1 | 14.0 | 1.0 | 14.9 | ||||||
| Taxa | Tup | Tlo | Sup | Slo | Chlaup | Chlalo | Oup | Olo | Dup | Dlo |
|---|---|---|---|---|---|---|---|---|---|---|
| Amphipoda | −0.38 | −0.14 | −0.23 | −0.52 | 0.07 | 0.16 | 0.19 | −0.08 | 0.22 | 0.14 |
| Chaetognatha | −0.28 | −0.62 | −0.41 | −0.52 | 0.11 | −0.14 | 0.39 | −0.39 | 0.55 | 0.53 |
| Ls-BCop | −0.60 | −0.22 | −0.55 | −0.51 | 0.22 | 0.29 | 0.44 | −0.05 | 0.59 | 0.23 |
| Ls-SubCop | 0.76 | 0.14 | 0.61 | −0.06 | 0.23 | −0.68 | 0.03 | 0.06 | −0.72 | −0.14 |
| Euphausiidae, larvae | −0.62 | −0.11 | −0.01 | −0.38 | −0.31 | 0.78 | −0.01 | 0.06 | 0.59 | −0.01 |
| Salpidae | 0.42 | 0.31 | −0.32 | −0.33 | 0.02 | 0.02 | 0.41 | 0.39 | −0.57 | −0.48 |
| Ss-BCop | −0.42 | −0.27 | −0.56 | −0.38 | 0.34 | 0.28 | 0.42 | 0.19 | 0.44 | 0.15 |
| Ss-SubCop | 0.76 | 0.47 | 0.53 | 0.33 | 0.11 | −0.47 | −0.29 | 0.24 | −0.73 | −0.57 |
| Meroplankton | −0.43 | −0.03 | 0.12 | −0.46 | −0.03 | 0.59 | −0.29 | 0.12 | 0.48 | 0.30 |
| Number of Variables | Correlation Coefficient | Selections |
|---|---|---|
| 2 | 0.594 | Tlo, Slo |
| 3 | 0.566 | Tlo, Tup, Slo |
| 4 | 0.565 | Tlo, Tup, Sup, Slo |
| 3 | 0.543 | Tlo, Sup, Slo |
Disclaimer/Publisher’s Note: The statements, opinions and data contained in all publications are solely those of the individual author(s) and contributor(s) and not of MDPI and/or the editor(s). MDPI and/or the editor(s) disclaim responsibility for any injury to people or property resulting from any ideas, methods, instructions or products referred to in the content. |
© 2025 by the author. Licensee MDPI, Basel, Switzerland. This article is an open access article distributed under the terms and conditions of the Creative Commons Attribution (CC BY) license (https://creativecommons.org/licenses/by/4.0/).
Share and Cite
Kasyan, V. Distribution of Summer Zooplankton in the Waters off the Kuril Islands (Northwest Pacific) in Relationship with Environmental Conditions. Biology 2025, 14, 827. https://doi.org/10.3390/biology14070827
Kasyan V. Distribution of Summer Zooplankton in the Waters off the Kuril Islands (Northwest Pacific) in Relationship with Environmental Conditions. Biology. 2025; 14(7):827. https://doi.org/10.3390/biology14070827
Chicago/Turabian StyleKasyan, Valentina. 2025. "Distribution of Summer Zooplankton in the Waters off the Kuril Islands (Northwest Pacific) in Relationship with Environmental Conditions" Biology 14, no. 7: 827. https://doi.org/10.3390/biology14070827
APA StyleKasyan, V. (2025). Distribution of Summer Zooplankton in the Waters off the Kuril Islands (Northwest Pacific) in Relationship with Environmental Conditions. Biology, 14(7), 827. https://doi.org/10.3390/biology14070827