Article

Complete Mitochondrial Genome of Chlorogomphus papilio (Odonata: Anisoptera: Chlorogomphidae) and Phylogenetic Analyses

1
School of Life Sciences, Anhui University, Hefei 230601, China
2
Technology Center of Hangzhou Customs District, Hangzhou 310016, China
3
School of Resources and Environmental Engineering, Anhui University, Hefei 230601, China
*
Author to whom correspondence should be addressed.
Biology 2025, 14(5), 493; https://doi.org/10.3390/biology14050493
Submission received: 24 March 2025 / Revised: 28 April 2025 / Accepted: 29 April 2025 / Published: 1 May 2025

Simple Summary

In this study, we sequenced and analyzed the mitochondrial genome of Chlorogomphus papilio (Ris, 1927). The genome was 15,251 bp in length and contained 13 protein-coding genes, 22 tRNA genes, two rRNA genes, and one non-coding region. The mitochondrial phylogenetic tree of Chlorogomphidae, constructed based on 16S rRNA and cox1 genes, indicated that C. magnificus and C. papilio are sister species. Divergence time analyses indicated that Chlorogomphidae originated around 111.04 Ma, with C. papilio diverging from the common ancestor shared with C. magnificus approximately 58.51 Ma, likely influenced by the Paleocene–Eocene Thermal Maximum and the tectonic uplift of the Himalayas. The data obtained from our study could serve as a valuable resource for future research on the evolution and conservation of C. papilio.

Abstract

This study aimed to elucidate the mitochondrial genome organization of Chlorogomphus papilio and the phylogenetic relationships of Chlorogomphidae. We used the Illumina MiSeq sequencing platform to sequence the mitochondrial genome of C. papilio, which was subsequently assembled, annotated, and analyzed. Bayesian inference, maximum likelihood, and maximum parsimony methods were employed to construct the mitochondrial phylogenetic tree of 25 species of Chlorogomphidae based on 16S rRNA and cox1 genes. We observed that the mitochondrial genome of C. papilio is 15,251 bp in length and includes 13 protein-coding genes (PCGs), 22 tRNA genes, 2 rRNA genes, and a non-coding control region. All PCGs start with a typical ATN codon. While cox1, cox2, cox3, and nad5 end with an incomplete termination codon (T), the remaining PCGs terminate with TAG. The secondary structure of the 22 tRNAs showed that only the trnS1 gene lacked the dihydrouracil arm (DHU arm), whereas the rest formed a typical cloverleaf structure. Additionally, 32 G-U mismatches were observed in the secondary structure. Phylogenetic analyses indicated that C. papilio and C. magnificus are sister species. Divergence time analyses indicated that Chlorogomphidae originated around 111.04 Ma, with C. papilio diverging from the common ancestor shared with C. magnificus approximately 58.51 Ma. This divergence is likely linked to the Paleocene–Eocene Thermal Maximum (PETM) and the tectonic uplift of the Himalayas, which created warm, humid habitats and contributed to geographic isolation. This study contributes to a better understanding of the mitochondrial genome and phylogeny of C. papilio, providing valuable molecular markers for further genetic studies.

1. Introduction

Chlorogomphus papilio is an ancient species with incomplete metamorphosis, belonging to the family Chlorogomphidae within the order Odonata [1]. It was first discovered in Guangdong, China, by Ris in 1927 [2]. C. papilio exhibits a wingspan exceeding 150 mm in females, representing the largest wingspan recorded among dragonflies in China, and is capable of sustained long-distance flight. Males are known to patrol extensive areas, sometimes flying several kilometers through valleys, which makes them one of the most wide-ranging species within Chlorogomphidae. Species of Chlorogomphus are highly sensitive to environmental conditions, with their presence closely tied to water quality and riparian vegetation. As a result, they serve as effective bioindicators, reflecting the quality of headwater streams during the larval stage and the condition of forest vegetation during adulthood [3,4,5].
The classification and phylogenetic relationships of Chlorogomphidae remain controversial. Originally, Carle Frank Louis proposed that Chlorogomphidae was closely related to a branch of Libellulidae [6], while Ishida supported its classification as a subfamily of Cordulegastridae [7]. Subsequent molecular studies have revealed that Chlorogomphidae is a sister group of Cordulegastridae, which is a part of Cordulegasteroidae [8,9]. On this basis, phylogenetic relationships within the family Chlorogomphidae were further explored. Chlorogomphus was initially placed within Cordulegastridae [10] but was later classified under Chlorogomphidae [6]. Today, Chlorogomphidae is a small family consisting of three widely recognized genera: Chlorogomphus (47 species), Chloropetalia (4 species), and Watanabeopetalia (4 species) [1]. Although C. papilio has been studied by Karube Haruki, it has not been placed in any subgenus [11], and its phylogenetic relationship remains unresolved.
Mitochondria are important organelles in eukaryotic cells [12]. As semi-autonomous organelles, mitochondria retain their genetic material—the mitochondrial genome [13,14]. Unlike single mitochondrial genes, the complete mitochondrial genome provides more comprehensive genetic data, making it widely used in molecular evolution and phylogeny studies [15]. Mitochondrial DNA is typically maternally inherited, with distinct strategies employed across species to ensure this mode of transmission [16,17]. The mitochondrial genome is characterized by rapid evolution, maternal inheritance, small size, conserved gene content, and relatively easy acquisition, making it crucial for evolutionary research [18,19].
With the advent of high-throughput sequencing technology, it has become increasingly convenient to obtain data on the mitochondrial genome sequence [20]. As a result, the number of studies on the mitochondrial genomes in various insect groups has steadily increased [21]. The insect mitochondrial genome is approximately 16 kb in length and contains 37 genes: 13 genes encoding energy metabolism-related proteins, 22 transfer RNA (tRNA) genes, and 2 ribosomal RNA (rRNA) genes. The spacing between genes is minimal, and gene lengths are relatively conserved [22]. In addition, non-coding regions, also known as control regions or AT-enriched regions [23], are critical regulatory regions for the replication and transcription of the mitochondrial genome [24]. The length of these regions varies significantly among insect species: Drosophila melanogaster has an AT-rich region of 4601 bp [25], Blattella bisignata has 1705 bp [26], Tetrix japonica has 531 bp [27], and Ruspolia dubia has only 70 bp [28].
There are three genera and fifty-five species of Chlorogomphidae known worldwide [1,29]; however, as of April 7, 2025, only one complete mitochondrial genome (Chlorogomphus shanicus, GenBank: OP572413.1) has been available from NCBI. No other complete mitochondrial genome of Chlorogomphidae has been reported. In this study, we used Illumina and Sanger sequencing techniques to study the mitochondrial genome of C. papilio, collected from the Huangshan Scenic Area in Anhui Province. We report the complete mitochondrial genome sequence of C. papilio and analyze the evolutionary relationships among selected Chlorogomphidae species.

2. Materials and Methods

2.1. Test Materials

The two C. papilio specimens used in this experiment were collected by the author from the Huangshan Scenic Area, Anhui Province, China (30°09′12″ N, 118°14′32″ E) on 2 July 2022. The specimens were preserved in absolute ethanol at −20 °C for later use.

2.2. Genomic DNA Extraction and High-Throughput Sequencing

A single C. papilio individual was rinsed twice in ultrapure water, and the total DNA was extracted from the thoracic muscle tissue using the E.Z.N.A.® Tissue DNA Kit (OMEGA, Beijing, China) according to the manufacturer’s instructions [30]. DNA concentration and purity were assessed using a Qubit 3.0 Fluorometer and 1% agarose gel electrophoresis. Subsequently, 1 μg of qualified DNA (purity: OD260/280 = 1.8–2.0; total amount ≥ 10 μg; concentration ≥ 50 ng/μL) was fragmented to 300–500 bp. The whole-genome library was prepared using the Illumina TruSeq™ Nano DNA Kit (Illumina, San Diego, CA, USA), which involved end repair, A-tailing, and adapter ligation, followed by 8-cycle PCR amplification in a 50 μL reaction volume (30–40 μL DNA fragments, 5 μL primer mix, 25 μL 2× master mix, and nuclease-free water to adjust the final volume to 50 μL). PCR conditions were as follows: initial denaturation at 98 °C for 30 s; 8 cycles of denaturation at 98 °C for 10 s, annealing at 60 °C for 30 s, and extension at 72 °C for 30 s; followed by a final extension at 72 °C for 5 min.
PCR products were size-selected (300–500 bp) by 2% agarose gel electrophoresis, purified, and subjected to paired-end sequencing (2×150 bp) with a sequencing depth of 22× on an Illumina NovaSeq 6000 platform at Beijing Qingke Biotechnology Co., Ltd. (Beijing, China).

2.3. Mitochondrial Genome Assembly and Annotation

Raw reads were processed with Trimmomatic v0.39 (http://www.usadellab.org/cms/index.php?page=trimmomatic accessed on 4 May 2024) [31] under default parameters for quality control. This included removal of adapter contamination, elimination of non-AGCT bases at the 5′ end, trimming of low-quality bases (Q < 20) at read ends, discarding reads with >10% N content, and exclusion of fragments < 75 bp post-trimming. The resulting dataset consisted of high-quality reads suitable for downstream analyses. The PacBio Sequel II platform sequencing data in BAM format were converted to FASTQ format through a rigorous quality control pipeline. This process involved the following: (1) initial length-based filtration to remove polymerase reads shorter than 200 bp, (2) quality filtering to eliminate reads with quality scores below 0.80, (3) extraction of subreads followed by adapter trimming, and (4) a final length-based filtration step to exclude any remaining subreads shorter than 200 bp. This multi-stage preprocessing protocol produced high-fidelity PacBio third-generation sequencing data, suitable for downstream genomic analyses.
The Illumina sequencing data were assembled using GetOrganelle v1.7.5 (https://github.com/Kinggerm/GetOrganelle accessed on 6 May 2024) [32]. BWA v0.7.17 [33] was used to align the second-generation assembly sequence with the third-generation data of PacBio [34], and the third-generation data of C. papilio were extracted. The extracted third-generation data were mixed with second-generation data using SPAdes v3.14.1 [35], and a sequence with sufficient coverage depth and long assembly length was selected as the candidate sequence. The mitochondrial scaffold sequence was confirmed by comparison with the NT library [36], and the sequences were connected according to the overlaps. Clean reads were aligned to the mitochondrial genome sequence, and the bases were corrected using Pilon v1.23 [37]. Finally, the starting position and direction of the mitochondrial assembly sequence were determined based on the reference genome, and the final mitochondrial genome sequence was obtained. The complete mitochondrial genome sequence was uploaded to the MITOS Web Server (http://mitos.bioinf.uni-leipzig.de/index.py accessed on 6 May 2024) [38] for gene function annotation to obtain initial annotation results of the mitochondrial genome. Redundancy in the initial gene predicted by MITOS was removed, and the start and stop codon positions of the gene were manually corrected to obtain a highly accurate conserved gene set. CGView software (http://stothard.afns.ualberta.ca/cgview_server/ accessed on 6 May 2024) [39] was used to display the C. papilio genome. Annotation of predicted genes was conducted via BLAST [40] analysis against the nucleotide database of NCBI (nt library) using BLAST 2.2.30+ (e-value < 1 × 10⁻⁵) based on the sequencing depth of the assembled genome. The annotated sequences were uploaded to the NCBI GenBank database to obtain the accession number (GenBank: PV287725).

2.4. Analysis of Mitochondrial Genome Characteristics

This study systematically analyzed the characteristics of the mitochondrial genome of C. papilio, including base composition, codon usage, and amino acid usage. MEGA v11.0 was used to calculate the nucleotide base composition, including the A + T content, AT-skew, and GC-skew. The skew values were computed using the following formulas: AT-skew = (A − T)/(A + T) and GC-skew = (G − C)/(G + C) [41]. Amino acid usage and relative synonymous codon usage (RSCU) of PGCs were analyzed using the codonW v1.4.4 software (http://codonW.sourceforge.net accessed on 7 May 2024) [42]. The secondary structure of the tRNA genes in the mitochondrial genome of C. papilio was predicted using the MITOS Web Server (http://rna.urmc.rochester.edu/RNAstructureWeb/ accessed on 7 May 2024) [38], and the secondary structure was visualized using RNAplot from the ViennaRNA package (v2.5.1) [43].

2.5. Phylogenetic Analyses

In this study, we conducted comprehensive phylogenetic analyses using 24 species from Chlorogomphidae and newly obtained species C. papilio, with six species from Cordulegastridae used as outgroups to construct a phylogenetic tree (Table 1). Nucleotide sequences of their mitochondrial 16S rRNA and cox1 genes (from the NCBI database) were used to construct the dataset. Subsequently, we used MEGA v11.0 [44] in conjunction with MUSCLE v3.8 [45] with default parameters to align the nucleotide sequences of the 16S rRNA and cox1 genes from 31 mitochondrial genomes, followed by manual trimming and alignment. PhyloSuite software was used to connect the two gene sequences after comparison. ModelFinder [46] was used to evaluate the optimal model of gene sequence.
Bayesian inference (BI) was performed using MrBayes v3.2 [47], with the GTR + I + G model selected based on ModelFinder [46]. The analysis was run for 10 million generations, with 25% [48] of the initial samples discarded as burn-in, and a phylogenetic tree was constructed. Maximum likelihood (ML) and maximum parsimony (MP) analyses were conducted using MEGA v11.0 [44] under the same model, with 1000 bootstrap replicates to assess branch support [49].
Table 1. Mitochondrial genomic information used in phylogenetic analyses of Chlorogomphidae in this study.
SpeciesGenBank Sequence NumberReference
16S rRNAcox1
Chlorogomphus aritaiLC366454.1LC366751.1Futahashi, 2014 [50]
Chlorogomphus arooniLC366488.1LC366785.1Futahashi, 2014 [50]
Chlorogomphus auratusLC366510.1LC366807.1Futahashi, 2014 [50]
Chlorogomphus brevistigmaLC200915.1LC200926.1Futahashi, 2014 [50]
Chlorogomphus brunneusLC366602.1LC366899.1Futahashi, 2014 [50]
Chlorogomphus calopteraLC366445.1LC366742.1Futahashi, 2014 [50]
Chlorogomphus hitenLC366512.1LC366809.1Futahashi, 2014 [50]
Chlorogomphus iriomotensisLC200916.1LC200927.1Futahashi, 2014 [50]
Chlorogomphus kitawakiiLC366444.1LC366741.1Futahashi, 2014 [50]
Chlorogomphus magnificusLC366469.1LC366766.1Futahashi, 2014 [50]
Chlorogomphus miyashitaiLC366385.1LC366682.1Futahashi, 2014 [50]
Chlorogomphus nakamuraiLC366441.1LC366738.1Futahashi, 2014 [50]
Chlorogomphus nasutusLC366459.1LC366756.1Futahashi, 2014 [50]
Chlorogomphus okinawensisLC200917.1LC200928.1Futahashi, 2014 [50]
Chlorogomphus piaoacensisLC366386.1LC366683.1Futahashi, 2014 [50]
Chlorogomphus risiLC200919.1LC200930.1Futahashi, 2014 [50]
Chlorogomphus shanicusLC366451.1LC366748.1Futahashi, 2014 [50]
Chlorogomphus suzukiiLC366344.1LC366641.1Futahashi, 2014 [50]
Chlorogomphus tuntiLC366453.1LC366750.1Futahashi, 2014 [50]
Chlorogomphus vietnamensisLC366468.1LC366765.1Futahashi, 2014 [50]
Chlorogomphus yokoiiLC200921.1LC200932.1Futahashi, 2014 [50]
Chloropetalia owadaiLC366460.1LC366757.1Futahashi, 2014 [50]
Watanabeopetalia uenoiLC366456.1LC366753.1Futahashi, 2014 [50]
Watanabeopetalia usignataLC366458.1LC366755.1Futahashi, 2014 [50]
Anotogaster klossiAB707862.1AB708806.1Futahashi, 2011 [51]
Anotogaster kuchenbeiseriAB707879.1AB708823.1Futahashi, 2011 [51]
Anotogaster chaoiAB707859.1AB708803.1Futahashi, 2011 [51]
Anotogaster gregoryiLC366511.1LC366808.1Futahashi, 2014 [50]
Anotogaster sakaiiLC366345.1LC366642.1Futahashi, 2014 [50]
Neallogaster pekinensisAB707904.1AB708848.1Futahashi, 2011 [51]

2.6. Divergence Time Estimation

We estimated divergence time using BEAST v2.6.2 [52], with the mitochondrial cox1 gene as the molecular marker, employing both fossil calibration and molecular clock approaches. For the molecular clock method, we implemented an uncorrelated relaxed clock model [53], with a fixed evolutionary rate of 2.14% substitutions per site per million years (D/m.y.) for cox1 [54]. For fossil calibration, we used the common ancestor of Cordulegastridae (sister group to Chlorogomphidae), constrained to 148.5 ± 3.6 Ma under a normal distribution prior [8]. We selected the normal distribution and uncorrelated relaxed clock model as the prior distributions. The analysis was conducted with the following settings: data partitioning and substitution models were selected based on ModelFinder results; the MCMC chain ran for 50 million generations, with samples taken every 1000 generations [54]. Convergence was assessed in Tracer v1.7 [55], ensuring that effective sample sizes (ESS) exceeded 200 for all parameters. Finally, TreeAnnotator v1.8.3 [56] (BEAST v2.6.2) was used to discard the top 10% of trees (Burn-in = 10%), select the Maximum Clade Credibility Tree, and calculate node heights using the average height values.

3. Results

3.1. Mitochondrial Genome Structure of C. papilio

The complete mitochondrial genome of C. papilio is 15,251 bp in length. It is a typical circular double-stranded DNA molecule containing 37 genes, including 13 PCGs, 22 tRNA genes, 2 rRNA genes (12S rRNA and 16S rRNA), and 1 A + T-rich region. Of these, nine (nad2, cox1, cox2, atp8, atp6, cox3, nad3, nad6, cob), fourteen tRNA genes (trnI, trnM, trnW, trnL, trnK, trnD, trnG, trnA, trnR, trnN, trnS1, trnE, trnT, trnS2), and the control region are encoded on the majority (heavy, H) strand, also known as the J strand. Eight tRNA genes (trnQ, trnC, trnY, trnF, trnH, trnP, trnL1, trnV), four PCGs (nad1, nad5, nad4, nad4L), and two rRNA genes are encoded on the minority (light, L) strand, also referred to as the N strand (Figure 1; Table 2). As shown in Figure 1, the thickening of the inner circle indicates that the direction of gene transcription is from right to left, and the thickening of the outer circle indicates that the direction of gene transcription is from left to right.

3.2. Mitochondrial Genome Nucleotide Composition

The A + T content of the whole genome was 70.14% (A 38.95%, T 31.18%, G 11.82%, and C 18.04%). Transfer RNA genes had an A + T content of 71.28%, while ribosomal RNA genes showed 72.87%. The control region was particularly A + T-rich at 85.54%. Among PCGs, A + T content varied from 62% in cox1 to 75.17% in nad4l.
The skew statistics of the entire nucleotide chain of C. papilio (AT-skew = −0.115, GC-skew = 0.04713) revealed a significant AT-skew and a moderate C-skew. Except for nad5 (GC-skew = 0.313), nad4 (GC-skew = 0.323), nad4l (GC-skew = 0.425), and nad1 (GC-skew = 0.260), the GC-skew of the remaining nine PCGs was negative (−0.480 to −0.069). Except for cox2 (AT-skew = 0.106), atp8 (AT-skew = 0.046), atp6 (AT-skew = 0), cox3 (AT-skew = 0), nad3 (AT-skew = 0.017), and nad6 (AT-skew = 0.008), the AT-skew of the other seven genes was also negative (−0.403 to −0.025), indicating that the percentage of T and C contained in the 13 PCGs (54.79%) was higher than that of A and G (45.21%) (Table 3).

3.3. PCGs and Codon Usage
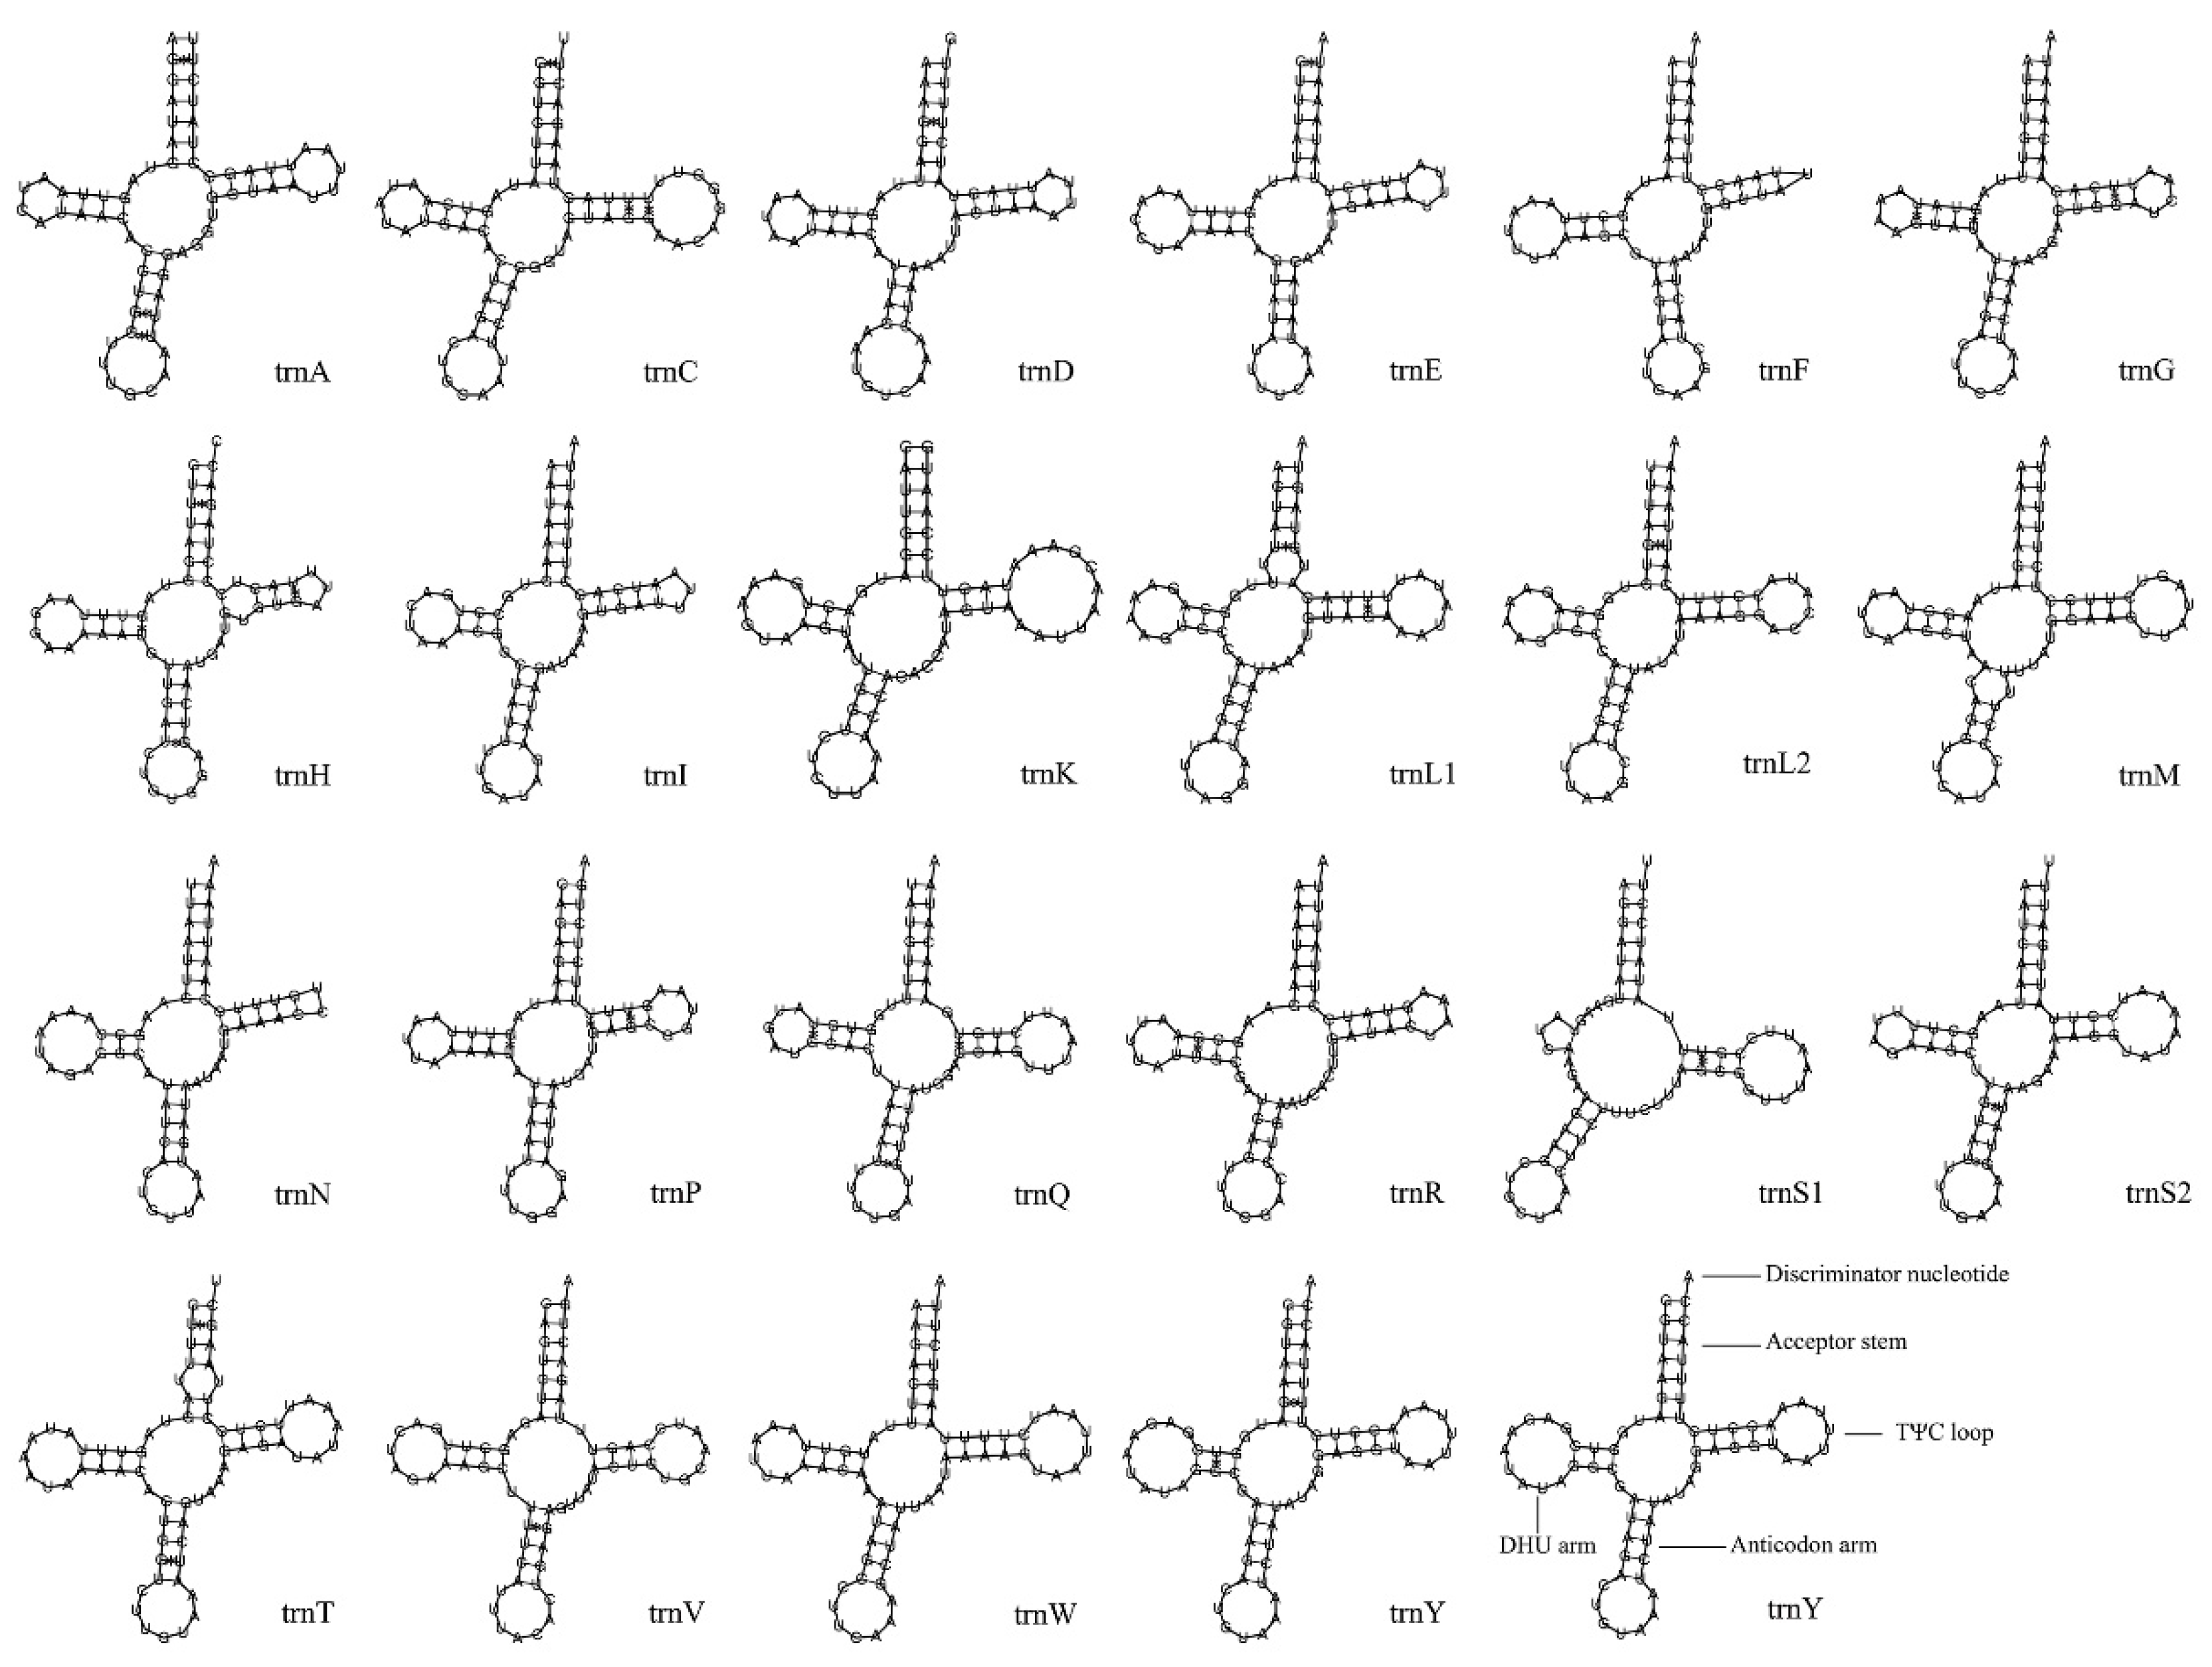
Among the 13 PCGs in the C. papilio mitochondrial genome, four genes were encoded on the minority strand (N), and the remaining nine genes are encoded on the majority strand (J) (Figure 1). All 13 PCGs used typical ATN start codons: ATA (3 genes), ATT (3), ATG (5), and ATC (2). Nine PCGs terminated with complete stop codons—TAA (seven genes) or TAG (2)—whereas cox1, cox2, cox3, and nad5 used an incomplete stop codon (T) (Table 2).
The RSCU is a reference value for evaluating the frequency of codons encoding the same amino acid. The highest RSCU was UUA (F = 7.34%, RSCU = 3.081), and the lowest were AGG (F = 0.06%, RSCU = 0.046), CUG (F = 0.36%, RSCU = 0.151), and GGC (F = 0.30%, RSCU = 0.184). The top five codons with the highest frequency are AUU, UUA, UUU, AUA, and UAU, all of which are composed of A and U. The most frequently encoded amino acid in proteins was leucine (Leu), accounting for about 14.30%, followed by serine (Ser), isoleucine (Ile), phenylalanine (Phe), and methionine (Met) (Figure 2).

3.4. tRNA and rRNA

The mitochondrial genome of C. papilio contains 22 tRNA genes with a total length of 1490 bp. The longest genes are trnW, trnC, trnY, and trnV (71 bp), while the shortest genes were trnI, trnG, trnA, trnF, and trnP (65 bp). Among the 22 tRNA genes, 8 are encoded on the minority strand (N), and 14 are encoded on the majority strand (J) (Table 2, Figure 1). Except for three genes—trnS1, which lacks the DHU arm; trnF, which has an abnormal T-loop motif; and trnN, which lacks the TφC loop—all tRNA genes exhibit a typical cloverleaf secondary structure. In these structures, the amino acid acceptor arm generally forms 7 bp, except in trnL1 and trnT, which have 6 bp. The anticodon arm forms 4 or 5 bp (4 bp in trnD, trnK, trnM, trnR), and the anticodon loop is consistently 7 bp. The TΨC arm ranges from 4 to 6 bp, and its loop varies from 1 to 11 bp. The DHU arm ranges from 3 to 4 bp, with a DHU loop length of 3 to 9 bp. The amino acid acceptor arms of trnL1 and trnT each have an independent nucleotide, as does the TΨC arm of trnH. A total of 32 G–U base mismatches were identified in the tRNA secondary structures. These mismatches occurred in the DHU arms of trnG (2), trnH, trnP, trnQ, trnR, and trnY (7 total); in the amino acid acceptor arms of trnA, trnC, trnD, trnE, trnH, trnL1, trnT, and trnY (8 total); in the anticodon arms of trnA (2), trnH, trnQ, trnS2 (2), trnT, and trnV (8 total); and in the TΨC arms of trnC (2), trnG, trnH, trnL1, trnP (2), trnQ, and trnS1 (9 total) (Figure 3). These mismatched bases can be restored to normal pairing by post-transcriptional editing [43].
Two rRNA genes are ribosome large subunit (rrnL) and ribosome small subunit (rrnS). The length of rrnL gene sequence is 1316 bp, with an A + T content of 74.39%. The length of rrnS gene sequence is 774 bp, with an A + T content of 70.29%, showing an obvious AT bias (Table 2 and Table 3).

3.5. Control Region, Non-Coding, and Overlapping Areas

The length of the control region of the mitochondrial genome of C. papilio is 477 bp, located between rrnS and trnI. The content of the A, T, C, and G bases is 30.8%, 38.81%, 14.48%, and 11.82%, respectively, and the A + T content is 69.61%, showing an obvious AT base bias (Table 2 and Table 3). The mitochondrial genome of C. papilio consists of 10 non-coding regions (also called intergenic spacer regions) with lengths ranging from 1 to 43 bp, the longest of which is 43 bp, located between trnY and cox1. Moreover, 13 gene overlaps were observed, ranging from 1 to 23 bp, the longest (23 bp) occurring between rrnL and trnV (Figure 1; Table 2).

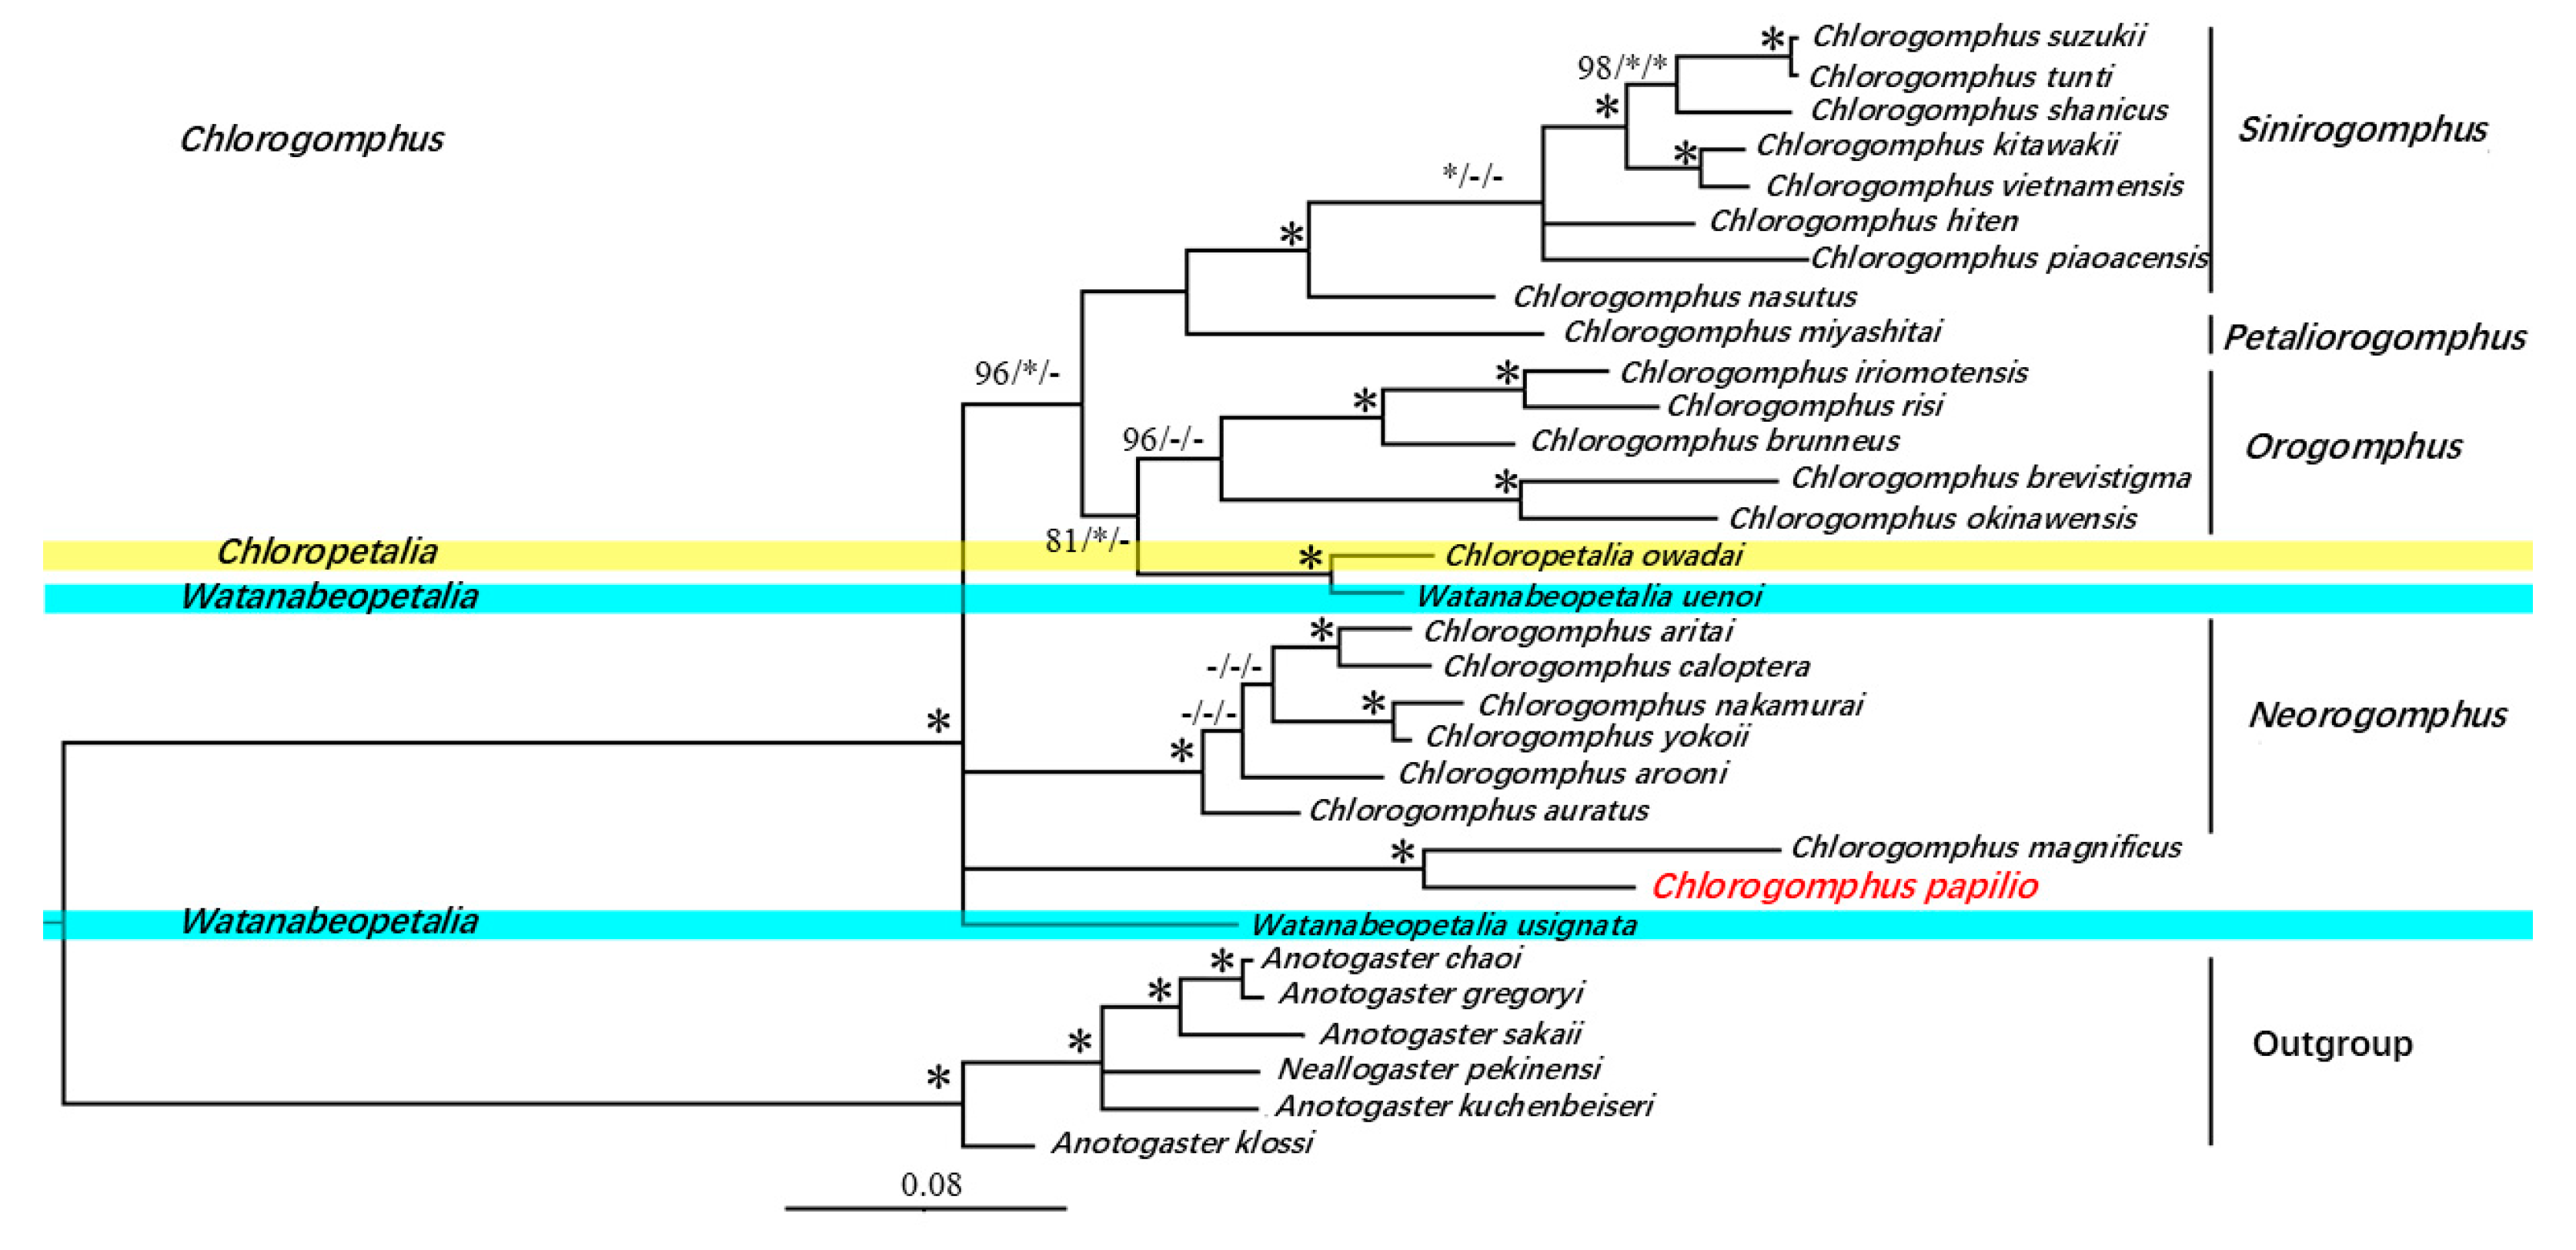
3.6. Phylogenetic Relationships

We constructed the phylogenetic tree of C. papilio using three independent methods (Bayesian inference, maximum likelihood, and maximum parsimony), all of which produced identical tree topologies. The topology selected was based on the Bayesian method. C. papilio and C. magnificus were clustered into a separate branch, and these were sister groups (BPP = 100%, ML = 100%, MPBP = 100%). In addition, Chloropetalia owadai and Watanabeopetalia uenoi clustered together with strong support (BPP = 100%, ML = 100%, MPBP = 100%). These groups were sister groups to six species of Orogomphus (BPP = 81%, ML = 100%).
At the subgenus level, Chlorogomphus includes four subgenera: Sinirogomphus, Petaliorogomphus, Orogomphus, and Neorogomphus. Within this framework, Chlorogomphus miyashitai (Petaliorogomphus) and eight species of Sinirogomphus clustered together as sister groups (BPP = 98%, MPBP = 100%). Sinirogomphus and Orogomphus then formed a sister group relationship (BPP = 96%, ML = 100%), and Neorogomphus and (Sinirogomphus + Orogomphus) were sister groups (BPP = 100%, ML = 100%, MPBP = 100%) (Figure 4).

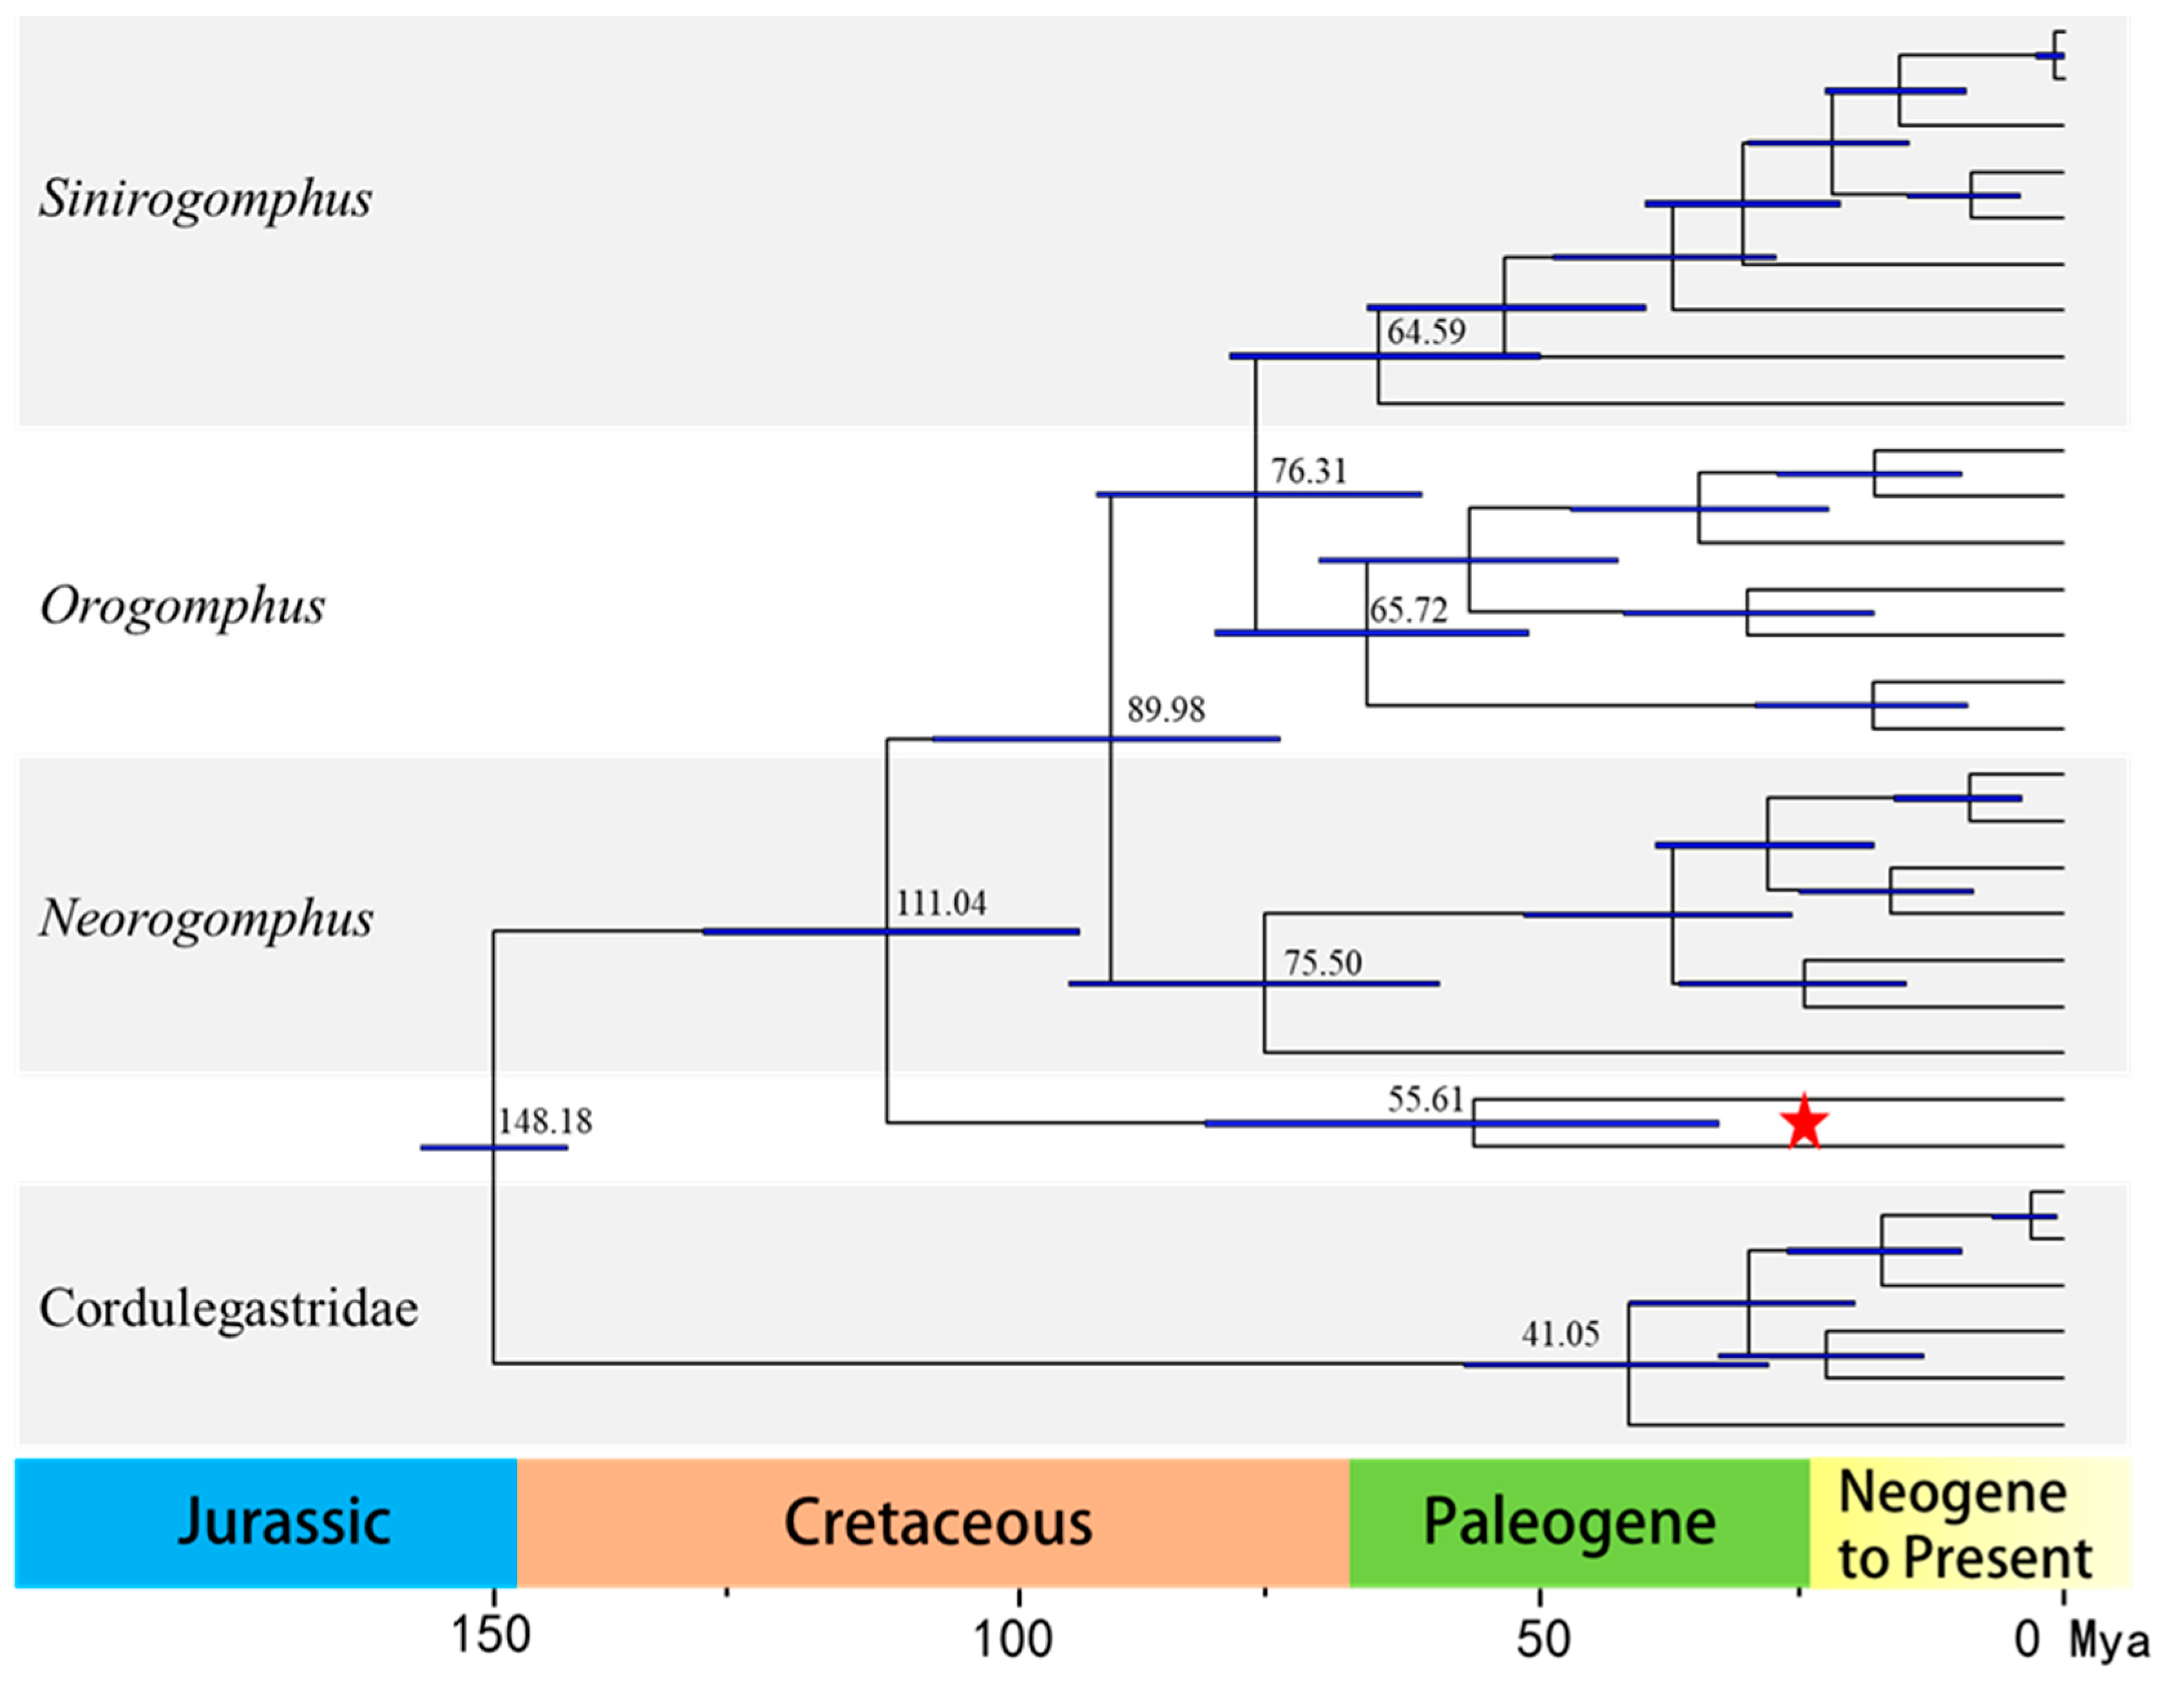
3.7. Divergence-Time Estimation Analysis

The estimated divergence time (Figure 5) suggests that the present-day Chlorogomphidae originated in the Early Cretaceous, approximately 111.04 Ma (95% confidence interval (CI): 92.91–128.47), slightly later than the divergence time of Aeschnidae (158–168 Ma). The common ancestor of Sinorogomphus diverged approximately 64.59 Ma (95% CI: 39.54–65.82), making it the earliest diverged subgenus of Chlorogomphidae (excluding the special case of Watanabeopetalia). C. papilio and C. magnificus diverged approximately 58.51 Ma (95% CI: 32.55–81.15 Ma). From Figure 5, it is evident that the subgenus differentiation in Chlorogomphidae occurred in the Late Cretaceous, while the family Chlorogomphidae itself emerged during the Paleogene.

4. Discussion

The mitochondrial genome of C. papilio is 15,251 bp in length, with the order and orientation of its 37 genes being consistent with those found in most insects [57,58,59]. No rearrangements were observed when compared to other published Chlorogomphidae mitochondrial genomes [60]. Additionally, the genome exhibits a distinct AT bias, a common feature among metazoans [57,61], with UUA showing the highest relative codon usage frequency. All 13 PCGs use standard ATN start codons, and four of them (cox1, cox2, cox3, nad5) terminate with an incomplete stop codon “T”, a common feature among arthropod mitochondrial genomes [62]. A similar situation occurs in other species of the Anax family. For example, cox1, cox2, and nad5 of Anax parthenope end with T [58]. These incomplete stop codons are typically completed post-transcriptionally through polyadenylation, where the addition of a poly(A) tail generates functional stop codons [63,64,65]. Additionally, the analysis revealed a significant variation in codon usage, with a marked preference for codons containing A and U, particularly at the third position. This pattern is consistent with the strong AT bias commonly observed in mitochondrial genomes. A similar pattern has been widely reported in other arthropods [57], suggesting that this may be a conserved feature of mitochondrial genome evolution in this group. Leucine (Leu) was the most frequently encoded amino acid, followed by serine (Ser), isoleucine (Ile), phenylalanine (Phe), and methionine (Met), all of which also exhibit an AT composition. Among the 22 tRNA genes, most adopt the standard cloverleaf secondary structure, except trnS1, which lacks a DHU arm. A total of 32 G-U mismatches were detected in the secondary structures, a feature commonly found in arthropod tRNA [66]. A study on the mitochondrial tRNAs of spiders (Araneida) found that mismatched bases can be restored to normal pairing through post-transcriptional editing. The deletion of the DHU arm or T arm of the mitochondrial tRNA gene has little effect on normal function [67]. The two rRNA genes, separated by trnV, are located on the light strand and share the same characteristics as C. shanicus in the family Chlorogomphidae [60].
The results of the phylogenetic analyses showed that the topological structure of the phylogenetic tree constructed using the three methods was identical, which is consistent with traditional morphological classification [29]. In all analyses, C. papilio and C. magnificus formed a strongly supported sister group, representing a distinct and early-diverging lineage within Chlorogomphidae. These findings suggest that both species are among the most ancient lineages within the family. Although three genera of Chlorogomphidae were represented in the tree, the expected clear genetic divergence among them was not observed. Watanabeopetalia usignata, another species within Watanabeopetalia [68], appeared distantly related to both W. uenoi and C. owadai, indicating that additional data may be required to resolve the phylogenetic placement and genus-level classification of these three species. However, at the genus level, C. owadai was not separated from Chlorogomphus, and W. uenoi did not cluster with W. usignata. Due to limited genetic data for these genera, more extensive sampling is required to resolve their taxonomic positions.
Divergence time estimation analyses indicate that Chlorogomphidae originated in the Early Cretaceous, approximately 111.04 Ma, with subgenus differentiation occurring within the family during the Late Cretaceous. Fleck Ghunter proposed that the Libellulidae, a group closely related to Chlorogomphidae, can be traced back to the Late Cretaceous [69]. In accordance with this, Nel André suggested that Araripechlorogomphus muratai, the oldest known member of the family Chlorogomphidae, also dates back to the Late Cretaceous [70]. The family Chlorogomphidae emerged during the Paleogene, a period characterized by significant climatic shifts that likely influenced biodiversity. The rapid spread of flowering plants and grasses, along with the diversification of small insect prey such as Lepidoptera, Hymenoptera, and Diptera, provided essential ecological opportunities that facilitated the diversification and success of Chlorogomphidae. Among these, C. papilio gradually flourished during the Paleogene. C. papilio diverged approximately 58.51 Ma, a divergence likely associated with the Paleocene–Eocene Thermal Maximum (PETM), a period marked by rapid global warming as warm equatorial ocean currents mixed with cold Antarctic waters [71]. Simultaneously, tectonic activity—such as the separation of the Indian subcontinent from Africa and its subsequent collision with Asia—led to the uplift of the Himalayas [72]. These climatic and geological events created a warm, humid, and forested environment [73], which was ideal for insect diversification [74]. Coupled with geographic isolation resulting from the rising Himalayas, these environmental changes led to reproductive isolation in ancestral populations of C. papilio, driving its evolution into the distinct species we observe today. Due to the limited mitochondrial genome data available for Chlorogomphidae, the phylogenetic analyses in this study included only 25 Chlorogomphidae species and 6 Cordulegastridae species as outgroups. The sample size and species coverage were limited, which might not fully reflect the phylogenetic relationships of this family. Due to the current lack of complete mitochondrial genome data for many Chlorogomphidae species in public databases—with most species only represented by partial sequences such as 16S rRNA and cox1 genes—future studies should aim to expand the sampling scope by including a broader range of Chlorogomphidae species, especially those without full mitochondrial genome information, in order to provide a more comprehensive and accurate understanding of their phylogenetic relationships.

5. Conclusions

In this study, the complete mitochondrial genome of C. papilio was sequenced, assembled, and annotated for the first time. This represents the first report of the complete mitochondrial genome sequence for C. papilio and the second comprehensive mitochondrial genome analysis within the family Chlorogomphidae. A phylogenetic tree of 25 Chlorogomphidae species was constructed to provide a new perspective on the phylogenetic status and evolution of C. papilio. However, further phylogenetic studies incorporating additional genera and species within this family are needed to fully elucidate the molecular evolution and taxonomic relationships of Chlorogomphidae. Mitochondrial genome sequences are important resources for further molecular and phylogenetic analyses of Chlorogomphidae.

Author Contributions

Conceptualization, J.F. and X.J.; methodology, X.L.; software, S.W.; validation, J.F. and X.L.; formal analysis, X.L.; investigation, X.J.; resources, X.L.; data curation, S.W.; writing—original draft preparation, X.J.; writing—review and editing, J.F. and X.L.; visualization, X.L.; supervision, J.F.; project administration, J.F.; funding acquisition, J.F. All authors have read and agreed to the published version of the manuscript.

Funding

This research was funded by Investigation and Assessment of Insect Resources in Huangshan Scenic Area (No. K160138087).

Institutional Review Board Statement

Not applicable.

Informed Consent Statement

Not applicable.

Data Availability Statement

The data presented in this study are available in NCBI GenBank (Accession number: PV287725).

Conflicts of Interest

The authors declare no conflicts of interest.

Abbreviations

The following abbreviations are used in this manuscript:
DOAJDirectory of open access journals
TLAThree letter acronym
LDLinear dichroism

References

  1. Novelo-Gutiérrez, R.; Sites, R.W. The Dragonfly Nymphs of Thailand (Odonata: Anisoptera); Springer: New York, NY, USA, 2024; pp. 239–247. [Google Scholar]
  2. Ris, F. Ein neuer Chlorogomphus aus China (Odonata). Entomol. Mitteilungen 1927, 16, 103–105. [Google Scholar]
  3. Crampton-Platt, A.; Yu, D.W.; Zhou, X.; Vogler, A.P. Mitochondrial metagenomics: Letting the genes out of the bottle. GigaScience 2016, 5, 15. [Google Scholar] [CrossRef]
  4. Song, F.; Li, H.; Jiang, P.; Zhou, X.; Liu, J.; Sun, C.; Vogler, A.P.; Cai, W. Capturing the phylogeny of Holometabola with mitochondrial genome data and Bayesian site-heterogeneous mixture models. Genome Biol. Evol. 2016, 8, 1411–1426. [Google Scholar] [CrossRef]
  5. Sakai, M.; Suda, S.I.; Okeda, T.; Nomura, R.; Washitani, I. The importance of riparian subtropical lucidophyllous forest to odonate conservation. Aquat. Conserv. Mar. Freshw. Ecosyst. 2019, 29, 682–692. [Google Scholar] [CrossRef]
  6. Carle, F.L. Evolution, taxonomy and biogeography of ancient Gondwanian libelluloides, with comments on anisopteroid evolution and phylogenetic systematics (Anisoptera: Libelluloidea). Odonatologica 1995, 24, 383–424. [Google Scholar]
  7. Ishida, K. A new species of the genus Chlorogomphus from Hainan lsland of China. Jpn. J. Syst. Entomol. 1996, 2, 51–55. [Google Scholar]
  8. Carle, F.L.; Karl, M.; Kjer, K.M.; May, M.L. A molecular phylogeny and classification of Anisoptera (Odonata). Arthropod Syst. Phylogeny 2015, 73, 281–301. [Google Scholar] [CrossRef]
  9. Bybee, S.M.; Ogden, T.H.; Branham, M.A.; Whiting, M.F. Molecules, morphology and fossils: A comprehensive approach to odonate phylogeny and the evolution of the odonate wing. Cladistics 2008, 24, 477–514. [Google Scholar] [CrossRef] [PubMed]
  10. Chen, C.-W. A revision of the genus Chlorogomphus Selys of eastern China (Odonata: Cordulegastridae). Q. J. Taiwan Mus. 1950, 3, 137–150. [Google Scholar]
  11. Karube, H.; Phan, Q.T. Discovery of Chlorogomphus papilio Ris, 1927 from northern Vietnam. Tombo Fukui 2016, 58, 49–51. [Google Scholar]
  12. Curole, J.P.; Kocher, T.D. Mitogenomics: Digging deeper with complete mitochondrial genomes. Trends Ecol. Evol. 1999, 14, 394–398. [Google Scholar] [CrossRef] [PubMed]
  13. Nass, S.; Nass, M.M. Intramitochondrial fibers with DNA characteristics: II. Enzymatic and other hydrolytic treatments. J. Cell Biol. 1963, 19, 613–629. [Google Scholar] [CrossRef] [PubMed]
  14. Keeling, P.J.; Archibald, J.M. Organelle evolution: What’s in a name? Curr. Bology 2008, 18, 345–347. [Google Scholar] [CrossRef]
  15. Gong, L.; Jiang, H.; Zhu, K.; Lu, X.; Liu, L.; Liu, B.; Jiang, L.; Ye, Y.; Lü, Z. Large-scale mitochondrial gene rearrangements in the hermit crab Pagurus nigrofascia and phylogenetic analysis of the Anomura. Gene 2019, 695, 75–83. [Google Scholar] [CrossRef]
  16. Birky Jr, C.W. The inheritance of genes in mitochondria and chloroplasts: Laws, mechanisms, and models. Annu. Rev. Genet. 2001, 35, 125–148. [Google Scholar] [CrossRef]
  17. Sato, M.; Sato, K. Maternal inheritance of mitochondrial DNA by diverse mechanisms to eliminate paternal mitochondrial DNA. Biochim. Et Biophys. Acta (BBA)-Mol. Cell Res. 2013, 1833, 1979–1984. [Google Scholar] [CrossRef] [PubMed]
  18. Wu, Q.L.; Li, Q.; Gu, Y.; Shi, B.C.; van Achterberg, C.; Wei, S.J.; Chen, X.X. The complete mitochondrial genome of Taeniogonalos taihorina (Bischoff) (Hymenoptera: Trigonalyidae) reveals a novel gene rearrangement pattern in the Hymenoptera. Gene 2014, 543, 76–84. [Google Scholar] [CrossRef]
  19. Broughton, R.E.; Milam, J.E.; Roe, B.A. The complete sequence of the Zebrafish (Danio rerio) mitochondrial genome and evolutionary patterns in vertebrate mitochondrial DNA. Genome Res. 2001, 11, 1958–1967. [Google Scholar] [CrossRef]
  20. Yang, J.; Huang, Y. Strategy of high-throughput sequencing technology in the mitochondrial genome sequencing (in Chinese). Chin. Bull. Life Sci. 2016, 28, 112–117. [Google Scholar]
  21. Mccormack, J.E.; Hird, S.M.; Zellmer, A.J.; Carstens, B.C.; Brumfield, R.T. Applications of next-generation sequencing to phylogeography and phylogenetics. Mol. Phylogenetics Evol. 2013, 66, 526–538. [Google Scholar] [CrossRef]
  22. Gissi, C.; Iannelli, F.; Pesole, G. Evolution of the mitochondrial genome of Metazoa as exemplified by comparison of congeneric species. Heredity 2008, 101, 301–320. [Google Scholar] [CrossRef] [PubMed]
  23. Ballard, J.W.; Whitlock, M.C. The incomplete natural history of mitochondria. Mol. Ecol. 2004, 13, 729–744. [Google Scholar] [CrossRef] [PubMed]
  24. Taanman, J.W. The mitochondrial genome: Structure, transcription, translation and replication. Biochim. Et Biophys. Acta (BBA) Bioenerg. 1999, 1410, 103–123. [Google Scholar] [CrossRef]
  25. Garesse, R. Drosophila melanogaster mitochondrial DNA: Gene organization and evolutionary considerations. Genetics 1988, 118, 649–663. [Google Scholar] [CrossRef]
  26. Chen, A.H. Complete mitochondrial genome of the double-striped cockroach Blattella bisignata (Insecta: Blattaria: Blaberoidea). Mitochondrial DNA 2013, 24, 14–16. [Google Scholar] [CrossRef]
  27. Xiao, B.; Feng, X.; Miao, W.J.; Jiang, G.F. The complete mitochondrial genome of grouse locust Tetrix japonica (Insecta: Orthoptera: Tetrigoidea). Mitochondrial DNA 2012, 23, 288–289. [Google Scholar] [CrossRef] [PubMed]
  28. Zhou, Z.; Huang, Y.; Shi, F. The mitochondrial genome of Ruspolia dubia (Orthoptera: Conocephalidae) contains a short A+ T-rich region of 70 bp in length. Genome 2007, 50, 855–866. [Google Scholar] [CrossRef]
  29. Dijkstra, K.D.B.; Bechly, G.; Bybee, S.M.; Dow, R.A.; Dumont, H.J.; Fleck, G.; Garrison, R.W.; Hämäläinen, M.; Kalkman, V.J.; Karube, H.; et al. The classification and diversity of dragonflies and damselflies (Odonata). Zootaxa 2013, 3703, 36–45. [Google Scholar]
  30. Martincová, I.; Aghová, T. Comparison of 12 DNA extraction kits for vertebrate samples. Anim. Biodivers. Conserv. 2020, 43, 67. [Google Scholar] [CrossRef]
  31. Bolger, A.M.; Lohse, M.; Usadel, B. Trimmomatic: A flexible trimmer for Illumina sequence data. Bioinformatics 2014, 30, 2114–2120. [Google Scholar] [CrossRef]
  32. Jin, J.J.; Yu, W.B.; Yang, J.B.; Song, Y.; dePamphilis, C.W.; Yi, T.S.; Li, D.Z. GetOrganelle: A fast and versatile toolkit for accurate de novo assembly of organelle genomes. Genome Biol. 2020, 21, 241. [Google Scholar] [CrossRef] [PubMed]
  33. Li, H. and Durbin, R. Fast and accurate long-read alignment with Burrows-Wheeler transform. Bioinformatics 2010, 26, 589–595. [Google Scholar] [CrossRef]
  34. Rhoads, A.; Au, K.F. PacBio sequencing and its applications. Genom. Proteom. Bioinform. 2015, 13, 278–289. [Google Scholar] [CrossRef]
  35. Prjibelski, A.; Antipov, D.; Meleshko, D.; Lapidus, A.; Korobeynikov, A. Using SPAdes de novo assembler. Curr. Protoc. Bioinform. 2020, 70, e102. [Google Scholar] [CrossRef] [PubMed]
  36. Bankevich, A.; Nurk, S.; Antipov, D.; Gurevich, A.A.; Dvorkin, M.; Kulikov, A.S.; Lesin, V.M.; Nikolenko, S.I.; Pham, S.; Prjibelski, A.D. SPAdes: A new genome assembly algorithm and its applications to single-cell sequencing. J. Comput. Biol. 2012, 19, 455–477. [Google Scholar] [CrossRef]
  37. Walker, B.J.; Abeel, T.; Shea, T.; Priest, M.; Abouelliel, A.; Sakthikumar, S.; Cuomo, C.A.; Zeng, Q.D.; Wortman, J.; Young, S.K.; et al. Pilon: An integrated tool for comprehensive microbial variant detection and genome assembly improvement. PLoS ONE 2014, 9, e112963. [Google Scholar] [CrossRef] [PubMed]
  38. Bernt, M.; Donath, A.; Jühling, F.; Externbrink, F.; Florentz, C.; Fritzsch, G.; Pütz, J.; Middendorf, M.; Stadler, P.F. MITOS: Improved de novo metazoan mitochondrial genome annotation. Mol. Phylogenet. Evol. 2013, 69, 313–319. [Google Scholar] [CrossRef]
  39. Grant, J.R.; Stothard, P. The CGView Server: A comparative genomics tool for circular genomes. Nucleic Acids Res. 2008, 36, 181–184. [Google Scholar] [CrossRef]
  40. Altschul, S.F.; Madden, T.L.; Schäffer, A.A.; Zhang, J.; Zhang, Z.; Miller, W.; Lipman, D.J. Gapped BLAST and PSI-BLAST: A new generation of protein database search programs. Nucleic Acids Res. 1997, 25, 3389–3402. [Google Scholar] [CrossRef]
  41. Perna, N.T.; Kocher, T.D. Patterns of nucleotide composition at fourfold degenerate sites of animal mitochondrial genomes. J. Mol. Evol. 1995, 41, 353–358. [Google Scholar] [CrossRef]
  42. Peden, J.F. Analysis of Codon Usage; University of Nottingham: Nottingham, UK, 1999. [Google Scholar]
  43. Lorenz, R.; Bernhart, S.H.; Honer Zu Siederdissen, C.; Tafer, H.; Flamm, C.; Stadler, P.F.; Hofacker, I.L. ViennaRNA Package 2.0. Algorithms Mol. Biol. 2011, 6, 26. [Google Scholar] [CrossRef]
  44. Koichiro, T.; Glen, S.; Sudhir, K. Mega11: Molecular evolutionary genetics analysis version 11. Mol. Biol. Evol. 2021, 7, 7. [Google Scholar]
  45. Edgar, R.C. MUSCLE: Multiple sequence alignment with high accuracy and high throughput. Nucleic Acids Res. 2004, 32, 1792–1797. [Google Scholar] [CrossRef] [PubMed]
  46. Kalyaanamoorthy, S.; Minh, B.Q.; Wong, T.K.F.; von Haeseler, A.; Jermiin, L.S. ModelFinder: Fast model selection for accurate phylogenetic estimates. Nat. Methods 2017, 14, 587–589. [Google Scholar] [CrossRef] [PubMed]
  47. Huelsenbeck, J.P. MrBayes 3.2: Efficient Bayesian phylogenetic inference and model choice across a large model space. Syst. Biol. 2012, 61, 539–542. [Google Scholar]
  48. Ronquist, F.; Huelsenbeck, J.; Teslenko, M. MrBayes Version 3.2 Manual: Tutorials and Model Summaries. 2011. Available online: https://gensoft.pasteur.fr/docs/mrbayes/3.2.7/Manual_MrBayes_v3.2.pdf (accessed on 19 October 2024).
  49. Nguyen, L.T.; Schmidt, H.A.; Von Haeseler, A.; Minh, B.Q. IQ-TREE: A fast and effective stochastic algorithm for estimating maximum-likelihood phylogenies. Mol. Biol. Evol. 2015, 32, 268–274. [Google Scholar] [CrossRef]
  50. Futahashi, R. A revisional study of Japanese dragonflies based on DNA analysis (2). Tombo 2014, 56, 57–59. [Google Scholar]
  51. Futahashi, R. A revisional study of Japanese dragonflies based on DNA analysis (1). Tombo 2011, 53, 67–74. [Google Scholar]
  52. Bouckaert, R.; Vaughan, T.G.; Barido-Sottani, J.; Duchêne, S.; Fourment, M.; Gavryushkina, A.; Heled, J.; Jones, G.; Kühnert, D.; De, M.N.; et al. BEAST 2.5: An advanced software platform for Bayesian evolutionary analysis. PLoS Comput. Biol. 2019, 15, e1006650. [Google Scholar] [CrossRef]
  53. Osozawa, S.; Wakabayashi, J. Odonata timetree; exponentially increased base substitution rate toward the recent and within the Carboniferous. Available online: https://www.researchsquare.com/article/rs-116942/v1 (accessed on 19 October 2024).
  54. Osozawa, S.; Su, Z.H.; Oba, Y.; Yagi, T.; Watanabe, Y.; Wakabayashi, J. Vicariant speciation due to 1.55 Ma isolation of the Ryukyu islands, Japan, based on geological and Gen Bank data. Entomol. Sci. 2013, 16, 267–277. [Google Scholar] [CrossRef]
  55. Rambaut, A.; Drummond, A.J.; Xie, D.; Baele, G.; Suchard, M.A. Posterior summarization in Bayesian phylogenetics using Tracer 1.7. Syst. Biol. 2018, 67, 901–904. [Google Scholar] [CrossRef]
  56. O’Reilly, J.E.; Dos Reis, M.; Donoghue, P.C. Dating tips for divergence-time estimation. Trends Genet. 2015, 31, 637–650. [Google Scholar] [CrossRef] [PubMed]
  57. Wang, Z.; Zheng, Y.; Zhao, X.; Xu, X.; Xu, Z.; Cui, C. Molecular phylogeny and evolution of the Tuerkayana (Decapoda: Brachyura: Gecarcinidae) genus based on whole mitochondrial genome sequences. Biology 2023, 12, 974. [Google Scholar] [CrossRef]
  58. Wang, Y.; Du, Y.; Song, X.; Huang, A. Complete mitochondrial genome sequence of Anax parthenope (Odonata: Anisoptera: Aeshnidae) and phylogenetic analysis. Mitochondrial DNA Part B 2021, 6, 122–123. [Google Scholar] [CrossRef] [PubMed]
  59. Tang, P.; Zhu, J.C.; Zheng, B.Y.; Wei, S.J.; Sharkey, M.; Chen, X.X.; Vogler, A.P. Mitochondrial phylogenomics of the Hymenoptera. Mol. Phylogenetics Evol. 2019, 131, 8–18. [Google Scholar] [CrossRef]
  60. Wang, H.; Wang, L.; Liao, J.; Han, B.P. The complete mitochondrial genome of Chlorogomphus shanicus Wilson, 2002 (Anisoptera: Chlorogomphidae), an endemic species in South China. Mitochondrial DNA Part B 2023, 8, 1192–1195. [Google Scholar] [CrossRef]
  61. Liu, J.; Yang, Y.; Yan, Z.; Wang, H.; Bai, M.; Shi, C.; Li, J. Analysis of the mitogenomes of two helotid species provides new insights into the phylogenetic relationship of the Basal Cucujoidea (Insecta: Coleoptera). Biology 2023, 12, 135. [Google Scholar] [CrossRef] [PubMed]
  62. Wei, S.J.; Chen, X.X. Progress in research on the comparative mitogenomics of insects. Chin. J. Appl. Entomol. 2011, 48, 1573–1585. [Google Scholar]
  63. Yokobori, S.I.; Paabo, S. Polyadenylation creates the discriminator nucleotide of chicken mitochondrial tRNA Tyr. J. Mol. Biol. 1997, 265, 95–99. [Google Scholar] [CrossRef]
  64. Passmore, L.A.; Coller, J. Roles of mRNA poly (A) tails in regulation of eukaryotic gene expression. Nat. Rev. Mol. Cell Biol. 2022, 23, 93–106. [Google Scholar] [CrossRef]
  65. Attardi, G. Animal Mitochondrial DNA: An extreme example of genetic economy. Int. Rev. Cytol. 1985, 93, 93–145. [Google Scholar] [PubMed]
  66. Varani, G.; McClain, W.H. The G· U wobble base pair. Eur. Mol. Biol. Organ. Rep. 2000, 1, 18–23. [Google Scholar] [CrossRef]
  67. Masta, S.E.; Boore, J.L. Parallel evolution of truncated transfer RNA genes in arachnid mitochondrial genomes. Mol. Biol. Evol. 2008, 25, 949–959. [Google Scholar] [CrossRef] [PubMed]
  68. Zhang, H.M.; Tong, X.L. Chlorogomphid dragonflies of Guizhou Province, China with first descriptions of Chlorogomphus tunti and Watanabeopetalia usignata larvae (Anisoptera: Cordulegastridae). Odonatologica 2010, 39, 341–352. [Google Scholar]
  69. Fleck, G.N.A.; MartínezDelclòs, X. The oldest record of the Libellulidae from the Upper Cretaceous of Kazakhstan (Odonata, Anisoptera). Cretac. Res. 1999, 20, 655–658. [Google Scholar] [CrossRef]
  70. Nel, A.; Ribeiro, G.C. New fossil wings shed light on Lower Cretaceous Araripechlorogomphidae and minimum age of the Chlorogomphoidea (Odonata: Anisoptera): Crato formation, Araripe Basin, NE Brazil. Cretac. Res. 2024, 156. [Google Scholar] [CrossRef]
  71. Gupta, S.; Kumar, K. Precursors of the Paleocene–Eocene Thermal Maximum (PETM) in the Subathu Group, NW sub-Himalaya, India. J. Asian Earth Sci. 2019, 169, 21–46. [Google Scholar] [CrossRef]
  72. Zhao, Z.; Li, S. Extinction vs. rapid radiation: The juxtaposed evolutionary histories of coelotine spiders support the Eocene–Oligocene orogenesis of the Tibetan Plateau. Syst. Biol. 2017, 66, 988–1006. [Google Scholar] [CrossRef]
  73. Hofmann, C.C.; Zhao, W.Y. Unravelling the palaeobiogeographical history of the living fossil genus Rehderodendron (Styracaceae) with fossil and extant pollen and fruit data. BMC Ecol. Evol. 2022, 22, 145. [Google Scholar] [CrossRef]
  74. Currano, E.D.; Wilf, P.; Wing, S.L.; Labandeira, C.C.; Lovelock, E.C.; Royer, D.L. Sharply increased insect herbivory during the Paleocene–Eocene Thermal Maximum. Proc. Natl. Acad. Sci. USA 2008, 105, 1960–1964. [Google Scholar] [CrossRef]
Figure 1. Mitochondrial genome structure of Chlorogomphus papilio. PCGs are represented by blue arrows, tRNA genes are depicted with brown arrows, and rRNA genes are shown using lavender arrows. tRNAs are labeled with single-letter amino acid codes, followed by their corresponding anticodons. Peaks on the black circular plot indicate the GC content, where outward and inward directions represent GC content above or below the average level, respectively. The purple and green circular plots illustrate the GC skew, with skew values between 0 and 1 shown in purple, and values between −1 and 0 shown in green. The ticks within the inner circle represent the sequence length.
Biology 14 00493 g001
Figure 2. Relative synonymous codon usage (RSCU) of the mitogenomes of Chlorogomphus papilio.
Biology 14 00493 g002
Figure 3. The secondary structure predictions of tRNA genes of Chlorogomphus papilio. The standard base pairing bonds of A and T, and C and G were represented by “-”, and the pairing bonds between G and U were indicated by “*”.
Biology 14 00493 g003
Figure 4. BI tree based on 16S rRNA and cox1 bigene data. All analysis support rates are marked near the node in BI tree/ML tree/MP tree order. The support rate within the range of 99–100% is represented by “*”, and the support rate of all results is 99–100% is represented by a larger “*”. The corresponding analysis does not support the use of “-” for this node, which is used to indicate low support values.
Biology 14 00493 g004
Figure 5. The divergence time estimations of family Chlorogomphidae. Blue bars indicate 95% mean confidence intervals of each node. A geological timescale is shown at the bottom. The red star indicates the specimen of Chlorogomphus papilio.
Biology 14 00493 g005
Table 2. The 37 genes of the mitochondrial genome of Chlorogomphus papilio.
GeneStrandStart PositionStop
Position
Gene Length
(bp)
Intergenic Nucleotide
(bp)
Overlapping Nucleotide
(bp)
Start CodonStop Codon
trnIH16565----
trnQL6313068-3--
trnMH13019869-1--
nad2H19912001002--ATTTAA
trnWH1199126971-2--
trnCL1262133271-8--
trnYL1333140371----
cox1H14472983153743-ATAT
trnLH2984305067----
cox2H30513738688--ATGT
trnKH3739380971----
trnDH3810387566----
atp8H38764034159--ATCTAA
atp6H40314705675-4ATATAA
cox3H47055491787-1ATGT
trnGH5492555665----
nad3H556659103459-ATATAG
trnAH5909597365-2--
trnRH5974604168----
trnNH6042610766----
trnS1H6108617568----
trnEH61776244681---
trnFL6243630765-2--
nad5L630880361729--ATTT
trnHL8037810266----
nad4L810294331332-1ATTTAG
nad4lL943997322945-ATGTAA
trnTH97359803692---
trnPL981498786510---
nad6H988010,3985191-ATCTAA
cobH10,39811,5311134-1ATGTAA
trnS2H11,53011,59667-2--
nad1L11,61412,56495117-ATGTAA
trnL1L12,56712,634682---
rrnLL12,63413,9491316-1--
trnVL13,92713,99771-23--
rrnSL14,00114,7747743---
Table 3. Nucleotide composition of mitochondrial genome of Chlorogomphus papilio.
RegionsT (%)C (%)A (%)G (%)A + T (%)AT SkewGC Skew
Complete sequence31.1818.0438.9511.8270.140.111−0.208
tRNAs35.0312.3536.2416.3871.280.0170.14
rRNAs39.4310.133.4417.0372.87−0.0820.256
Control region44.037.7641.516.7185.54−0.029−0.073
atp634.672034.6710.6769.340−0.304
atp832.723.2735.858.1868.550.046−0.48
cob34.3919.7531.4814.3765.87−0.044−0.158
cox132.0820.9529.9317.0562.01−0.035−0.103
cox229.3619.4836.3414.8365.70.106−0.136
cox332.5318.6832.5316.2665.060−0.069
nad148.0510.9422.418.6170.45−0.3640.26
nad237.2316.2735.4311.0872.66−0.025−0.19
nad333.6219.4234.7812.1768.40.017−0.23
nad448.59.6822.918.9271.4−0.3590.323
nad4l52.727.1422.4517.6975.17−0.4030.425
nad546.739.7224.9918.5771.72−0.3030.313
nad636.6116.7637.199.4473.80.008−0.279
rrnL39.599.3534.816.2674.39−0.0640.27
rrnS39.1511.3731.1418.3570.29−0.1140.235
First position38.513.8331.4216.2569.92−0.1010.08
Second position38.1517.0328.316.5266.45−0.148−0.015
Third position40.9715.928.9714.1569.94−0.172−0.058
Disclaimer/Publisher’s Note: The statements, opinions and data contained in all publications are solely those of the individual author(s) and contributor(s) and not of MDPI and/or the editor(s). MDPI and/or the editor(s) disclaim responsibility for any injury to people or property resulting from any ideas, methods, instructions or products referred to in the content.

