Article

Physiological Changes and Time-Course Transcriptomic Analysis of Salt Stress in Chenopodium quinoa

College of Life Science and Bioengineering, Jining University, Qufu 273100, China
*
Author to whom correspondence should be addressed.
Biology 2025, 14(4), 416; https://doi.org/10.3390/biology14040416
Submission received: 9 March 2025 / Revised: 1 April 2025 / Accepted: 9 April 2025 / Published: 13 April 2025
(This article belongs to the Special Issue Research Progress on Salt Stress in Plants)

Simple Summary

In this study, we observed growth and physiological changes in quinoa (Chenopodium quinoa Willd.) seedlings under salt stress. We found that quinoa reduced ROS imbalance and cell membrane damage caused by salt stress mainly by enhancing antioxidant capacity, which was, in general, consistency with the results of time-course RNA-sequencing. In addition, we also identified transcription factors and key genes in various pathways, such as “photosynthesis”, “glutathione metabolism”, “phenylpropanoid biosynthesis” and “starch and sucrose metabolism”, by transcriptomic data. This study provides an important theoretical basis for the subsequent genetic improvement of this species, as well as a potential candidate for the remediation of saline-alkali soils.

Abstract

Quinoa, a halophytic pseudocereal crop, is highly resistant to harsh growing environments and is considered a suitable crop for cultivation in marginal areas. The germination period plays a decisive role in the formation of the crop population and the growth and development of quinoa, but our understanding of the regulatory mechanism of salt stress remains limited. In this study, we investigated the physiological changes and mechanisms of tolerance response to salt stress in quinoa seedlings. The results showed that salt stress severely reduced the growth of quinoa seedlings. Moreover, salt stress increased the H2O2 level in the seedlings, thereby aggravating lipid peroxidation of the cell membrane and consequently increasing MDA content. Meanwhile, the antioxidant enzyme activities such as POD, SOD, GR and GPX of seedlings were enhanced in response to salt stress, which was consistent with the results of the RNA-sequencing. These results suggest that the increase in antioxidant enzyme activities in quinoa seedlings attenuates the ORS imbalance caused by salt stress. In addition, we identified 69, 40, 120 and 47 key genes in the “photosynthesis”, “glutathione metabolism”, “phenylpropanoid biosynthesis” and “starch and sucrose metabolism” pathways, respectively. Moreover, the predicted 235 transcription factors involved in the salt stress response have various hormone cis-elements in their promoter regions, which also indicates that multiple hormones are involved in the salt stress response process in quinoa. Therefore, we hope that these genes and mechanisms will provide some basis for understanding salt tolerance in quinoa.

1. Introduction

Salinization is one of the most serious abiotic threats to global agricultural productivity and ecosystems, with approximately half of the world’s irrigated land threatened by salinity [1,2]. A series of metabolic disorders caused by soil salinization, such as ionic toxicity, drought stress and oxidative stress, significantly reduce the yield and quality of crops [3]. Environmental change and population growth have further exacerbated the extent and size of soil salinization, forcing agricultural production to expand to marginal areas [4]. Hence, improving the salinity tolerance of crops and rehabilitating saline land represent agricultural production problems that must be urgently solved. Long-term amelioration practices reshaping the soil suggest that saline agriculture can make use of saline soil and brackish water resources to directly plant halophytic or salinity-tolerant crop varieties on saline-alkali land, which can both promote the improvement of saline-alkali land and additionally increase agricultural ecological diversity and agricultural production [5,6]. However, most traditional crops and forages are glycophytes, which are highly sensitive to salt stress [7]. Therefore, the use of halophytic crops with high salinity tolerance is a viable option [8].
Chenopodium quinoa Willd., a crop in the family Amaranthaceae, is an ancient crop native to South America. Because quinoa is highly resistant to multiple abiotic stresses and its seed has better nutritional value than other major cereals, quinoa has attracted worldwide attention [9,10]. Quinoa is a halophytic pseudocereal with a high salt tolerance and can cope with high salt stress (conductivity 40 dS·m−1) [11]. Na+ segregation in vesicles, K+ retention [12], xylem Na+ loading [13], higher ROS tolerance and effective regulation of stomatal development and size [14] are key to the adaptation and survival of quinoa in saline-alkali environments. In addition, the accumulation of compatible solutes, such as proline, total phenolics, Betalains, choline and polyamines, is associated with salt tolerance in quinoa [15]. Despite a large number of studies on the mechanisms of salt response and tolerance in quinoa, there remain relatively few studies at the transcriptional level during the germination period. Compared with glycophyte plants, some halophytes are also relatively sensitive to salt during the germination and seedling periods, whereas quinoa has higher resistance to high salt stress during germination [16]. Hariadi et al. found that NaCl concentrations higher than 400 mM have a significant inhibitory effect on seed germination and concluded that seed germination and viability depend on the ability to excrete toxic Na+ from developing embryos, thereby avoiding ionic toxicity [12]. However, Burrieza et al. suggested that the high tolerance of quinoa germination is due to the significant gradient distribution of toxic ions (Na+ and Cl) and necessary ions (K+, Mg2+, Ca2+, etc.) in the seed coat [17]. Moreover, sufficient evidence has demonstrated that salt stress can lead to the excessive production of ROS in quinoa, such as hydrogen peroxide (H2O2) and superoxide radicals (O2−). These ROS can cause serious damage to proteins, DNA, lipids and chlorophyll in plant cells. However, the higher antioxidant enzyme activity can eliminate excess ROS in quinoa. Hassan et al. showed a strong positive correlation between antioxidant enzymes and inorganic ions, and that elevated antioxidant enzyme activity has the potential to mitigate salt stress injuries by promoting the absorption of inorganic solutes for osmoregulation in quinoa plants [18]. Thus, the molecular basis of the germination period, as a key process in quinoa life history and the formation of crop field populations, is worth further exploration.
Recently, the completion of the quinoa genome and the development of high-throughput sequencing have provided new approaches to address complex salt stress-related pathways [19,20]. Schmöckel et al. integrated RNA-sequencing and SNP analysis to identify 219 candidate genes associated with salt stress, predicting the transmembrane structure of these genes as well as demonstrating specificity or overexpression in quinoa compared with other Amaranthaceae [21]. In addition, a comparison of epidermal salt bladder and leaf lamina cells in quinoa revealed that quinoa stress resistance was related to ion and nutrient transport, ABA homeostasis and signaling, enhanced basal-level ABA responses, and other pathways [8]. To this end, Qingli No. 4 (approved by Qinghai, China, 2019001) was used as the material to analyze the changes in the transcription level of seedlings under 300 mM NaCl treatment to understand the salt tolerance mechanism. Differentially expressed genes (DEGs) at different treatment times were obtained using RNA-seq. Potential positive and negative regulatory factors under salt stress conditions were screened by KEGG enrichment analysis and TF prediction. Therefore, the results of this study could enhance the knowledge of salt stress regulation in quinoa, with a view to providing a resource of target gene data for performing multiomics cooperation.

2. Materials and Methods

2.1. Plant Material

Qingli No. 4, an alpine ecotype variety that is approved by Qinghai Province (accession number: 2019001), were propagated and preserved by the Qinghai Provincial Key Laboratory of Crop Molecular Breeding. Approximately 300 seeds were presterilized in 70% (v/v) ethanol/water for 5 min and then subjected to several rinses in ddH2O. Fifty seeds per box were placed in a seed germination box with two layers of filter paper. Twelve milliliters of distilled water (control) and 100, 200, 300, 400 and 500 mM NaCl were added to each box and placed in a 12 h (25 °C) light/12 h (20 °C) dark artificial climate incubator for germination. The germination rate was calculated by three replicates of each treatment. Those with 1 mm long rootlets were recognized as germinated seeds.
After 1 d of seed germination under normal conditions, seedlings in good and uniform growth status were selected for 300 mM NaCl stress treatment, and whole plants were sampled at 0, 24, 48 and 72 h, frozen rapidly in liquid nitrogen and stored at −80 °C for subsequent RNA-seq.

2.2. Measurement of Malondialdehyde Levels

The malondialdehyde (MDA) content of the quinoa experimental group and control group was measured using thiobarbituric acid (TBA, purchased from Sangon Biotech, Shanghai, China), as previously reported. Samples (0.5 g) were ground in 2.5 mL of reagent (0.25% (w/v) TBA in 10% (w/v) trichloroacetic acid) and boiled at 100 °C for 20 min. The MDA content was determined by subtracting the nonspecific absorption at 600 nm from the absorbance of the sample supernatant at 532 nm.

2.3. Measurement of H2O2 Levels and Antioxidant Enzyme Activities

The extraction procedures for antioxidant enzymes and H2O2 were performed at 4 °C. Samples of quinoa seedings (0.5 g) were crushed and mixed in 2 mL of extraction buffer (0.1 M potassium phosphate buffer with 0.1 mM EDTA (purchased from Sangon Biotech, Shanghai, China), pH 7.0) and centrifuged at 15,000× g in a refrigerated centrifuge for 20 min. H2O2 content was determined according to the method described by Jena and Choudhuri [22]. A 3 mL sample of supernatant was mixed with 1 mL of 0.1% TiCl4 in 20% H2SO4 (v/v), and the mixture was then centrifuged at 6000× g for 15 min at room temperature. The optical absorption of the supernatant was measured spectrophotometrically at 410 nm to determine the H2O2 content. The activities of SOD, POD, GR and GPX were measured according to the NBT photochemical reduction method [23], Guaiacol method [24], UV-absorption method [25] and DTNB method [22], respectively, and the assays were carried out with an assay kit (purchased from Comin, Suzhou, China). The procedures were performed as described by the Suzhou Comin Biotechnology Research Institute.

2.4. RNA-Seq and Data Processing

Total RNA from each sample was extracted using TRIzol reagent (Gibco, Grand Island, NY, USA) according to the manufacturer’s instructions. DNA was removed using RNase-free DNase I (Takara, Dalian, China). The purity, concentration and integrity of each total RNA sample were carefully measured by a NanoDrop spectrophotometer (Thermo Scientific-1000, Thermo Fisher Scientific, Wilmington, DE, USA), and only RNA integrity numbers higher than 8.0 were used for downstream sequencing library construction. First-strand cDNA was synthesized using M-MLV reverse transcriptase (Sangon, Shanghai, China). RNA-seq was then performed on the Illumina (HiSeq TM) platform at Sangon, Shanghai, China. Data quality control of raw reads was performed using Trimmomatic to obtain clean reads. Clean reads were compared to the quinoa reference genome (https://plants.ensembl.org/Chenopodium_quinoa/Info/Index accessed on 6 January 2025) using HISAT2 (v2.2.1) software [26]. To estimate the gene expression levels, the transcripts per million fragments mapped (TPM) value of each gene was calculated. DEseq2 (v1.36.0) [27] was used to screen for DEGs. The threshold was p < 0.05 and fold change |(FC)| > 2.

2.5. K-Means Clustering and KEGG Enrichment Analysis of DEGs

We performed k-means clustering analysis of all DEGs using the k-means function in R (v3.2.2). Heatmaps were drawn using the Pheatmap package in R and were clustered using Pearson correlation distance. The KEGG enrichment analysis of the DEGs was implemented using KOBAS (v3.0) software [28]. Pathways with correlated p values less than 0.05 were assigned as significantly enriched items.

2.6. Identification of Transcription Factors from DEGs and Discovery of Cis-Regulatory Elements in the Promoter Regions

TFs were identified using the online forecasting tool Plant Transcription Factor Database v4.0 (http://planttfdb.cbi.pku.edu.cn accessed on 20 January 2025) [29]. With default parameters for TF family assignment and thresholds, the TFs were identified out of DEGs. Afterward, the promoter sequences (approximately 2.0 kbps upstream of the transcription start site) of identified TFs were downloaded from the quinoa reference genome database (https://plants.ensembl.org/Chenopodium_quinoa/Info/Index accessed on 6 January 2025). Cis-element prediction was performed using the online forecasting tool Plant CARE (http://bioinformatics.psb.ugent.be/webtools/plantcare/html/ accessed on 16 February 2025) [30]. The promoter region was enriched by the online forecasting tool MEME (https://meme-suite.org/meme/ accessed on 16 February 2025), and the identified DNA motifs were aligned with the motif database to obtain the best matched known regulatory motifs in Arabidopsis by TOMTOM [31].

2.7. Real-Time Quantitative Reverse Transcription-Polymerase Chain Reaction (RT–qPCR)

Total RNA was extracted from the control and salt-treated samples collected at 24, 48 and 72 h and used to quantify gene expression in each group. Actin (ACT-1) was used as the reference gene to normalize and estimate up- or down-regulation of the target genes. Transcript levels are shown as the mean normalized expression (MNE). All primers are listed in the Supplementary Materials (Table S1 and Figure S1). Three biological replicates were performed per group.

2.8. Statistical Analysis

Statistical analysis was performed using SPSS (v25.0) software. Variances in germination rates under varying salt concentrations were analyzed using a one-way ANOVA followed by an LSD test. Physiological traits under varying salt time points were analyzed using an independent sample t-test. Significance levels were set at p < 0.05.

3. Results

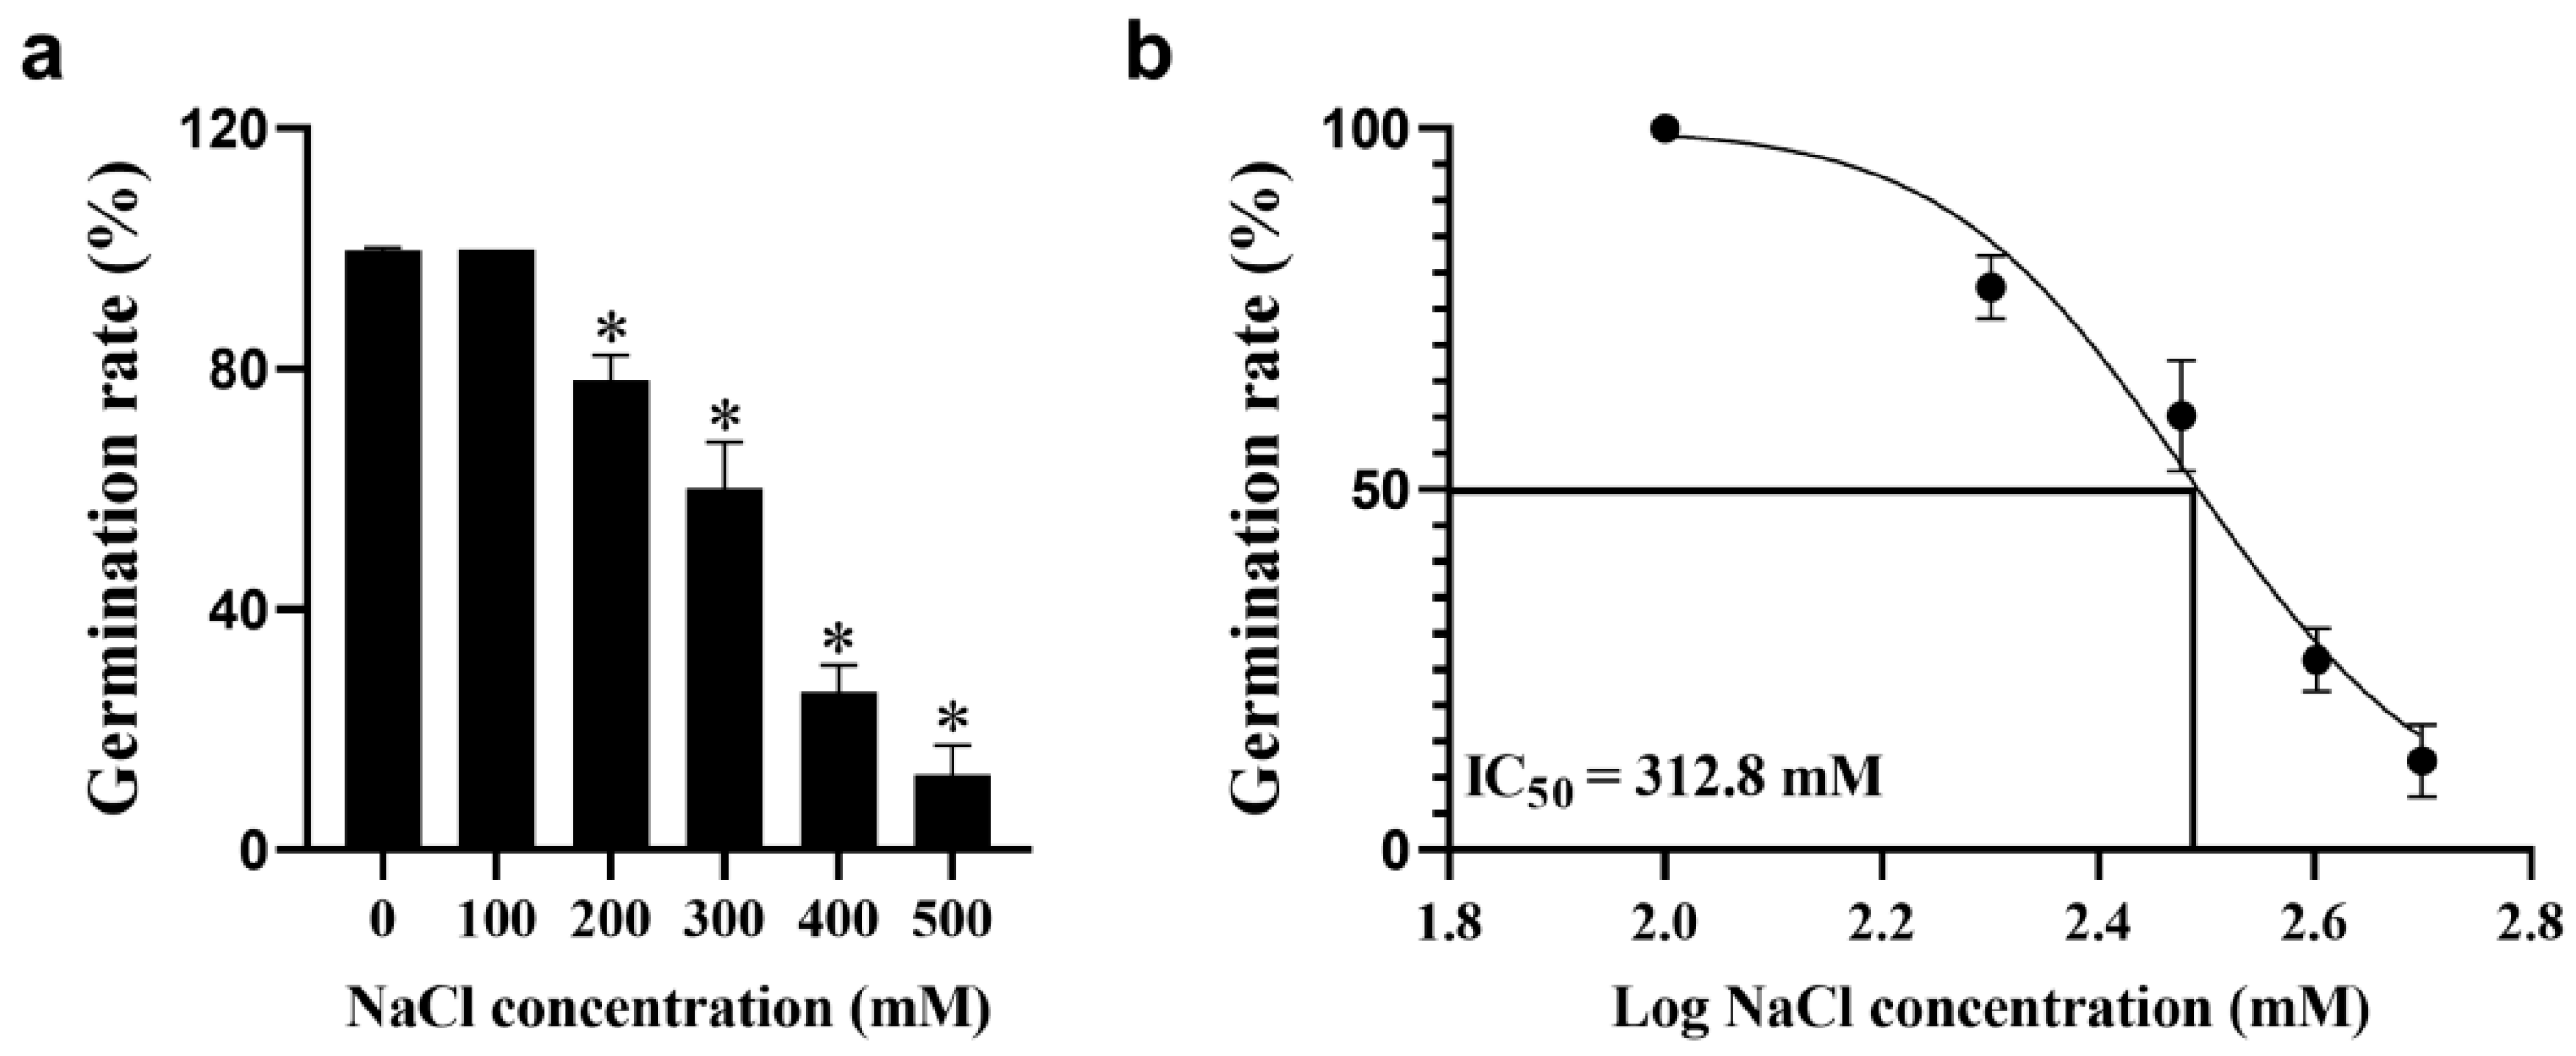
3.1. Seed Germination Assay

To test the tolerance of quinoa seeds to salt stress, the germination rates of seeds treated with distilled water (CK) and 100, 200, 300, 400 and 500 mM NaCl were calculated. The results indicated that 100 mM NaCl had no significant effect on seed germination, but the germination rate of quinoa seeds gradually decreased with increasing salt concentration (Figure 1a), and salinity significantly inhibited the growth of radicles and germ cells (Figure S2). In addition, the half maximal inhibitory concentration (IC50) of NaCl on quinoa seed germination was 312.8 mM (Figure 1b). Therefore, it is speculated that quinoa also has a high tolerance to salt stress during the germination period.

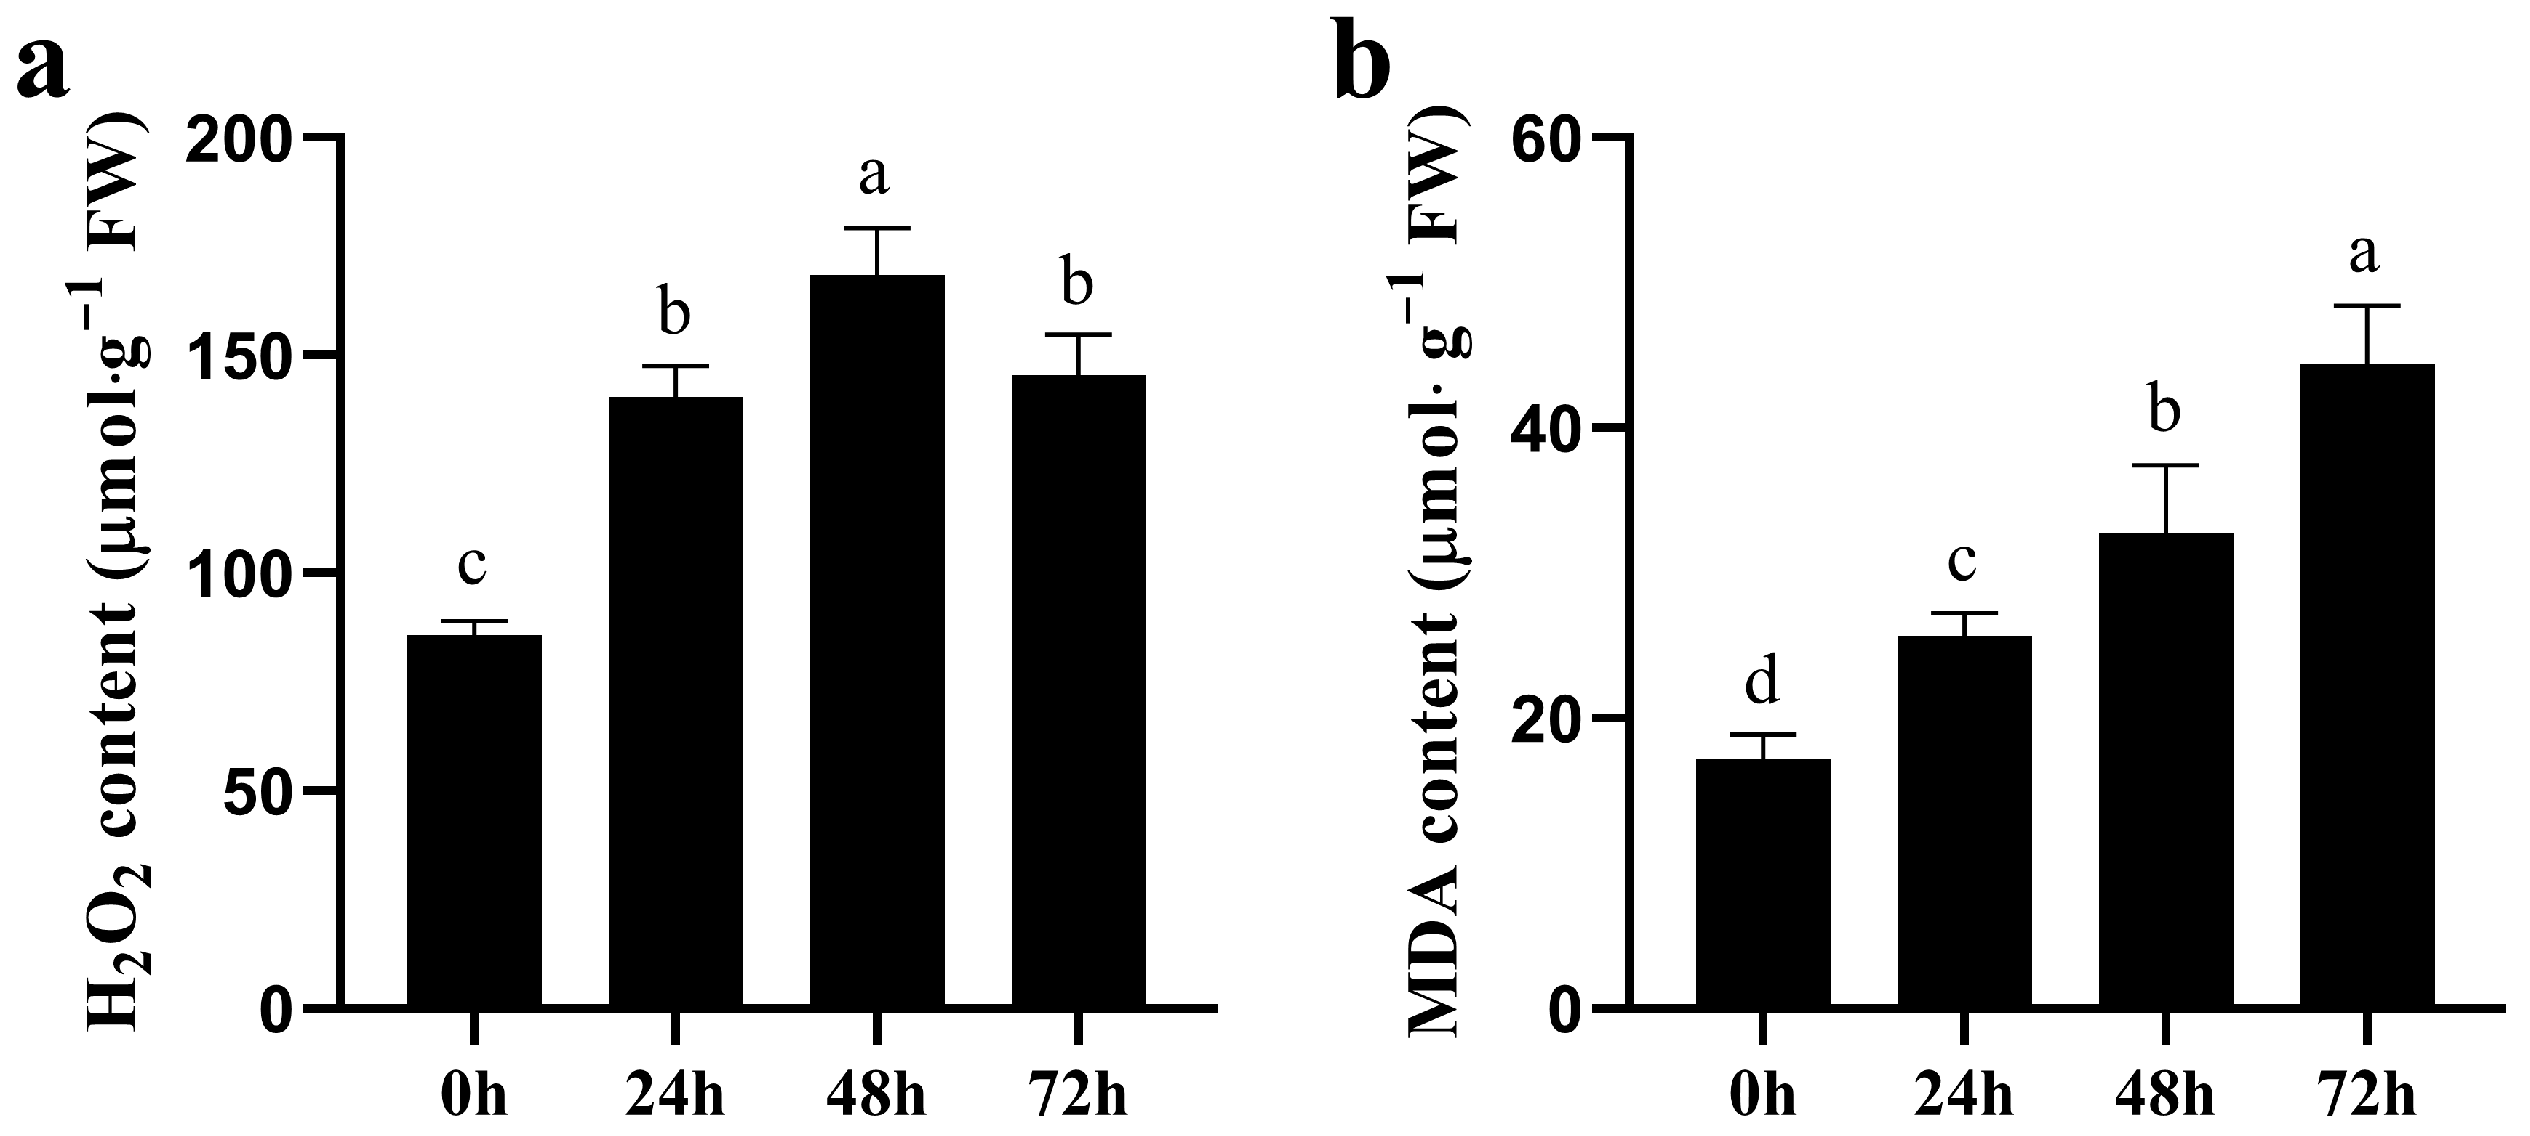
3.2. Cell Membrane Damage and H2O2 Production Under CK and NaCl Stress

Generally, salt stress leads to an imbalance in ROS content in plant cells, causing damage to the cell membrane. Therefore, we measured the MDA and H2O2 content of quinoa seedings. In quinoa seedlings, as the duration of salt stress increased, the H2O2 content increased and then decreased (Figure 2a), whereas the MDA content increased (Figure 2b). This relationship demonstrates that salt stress disrupts normal physiological processes and causes damage to the membrane system in quinoa.

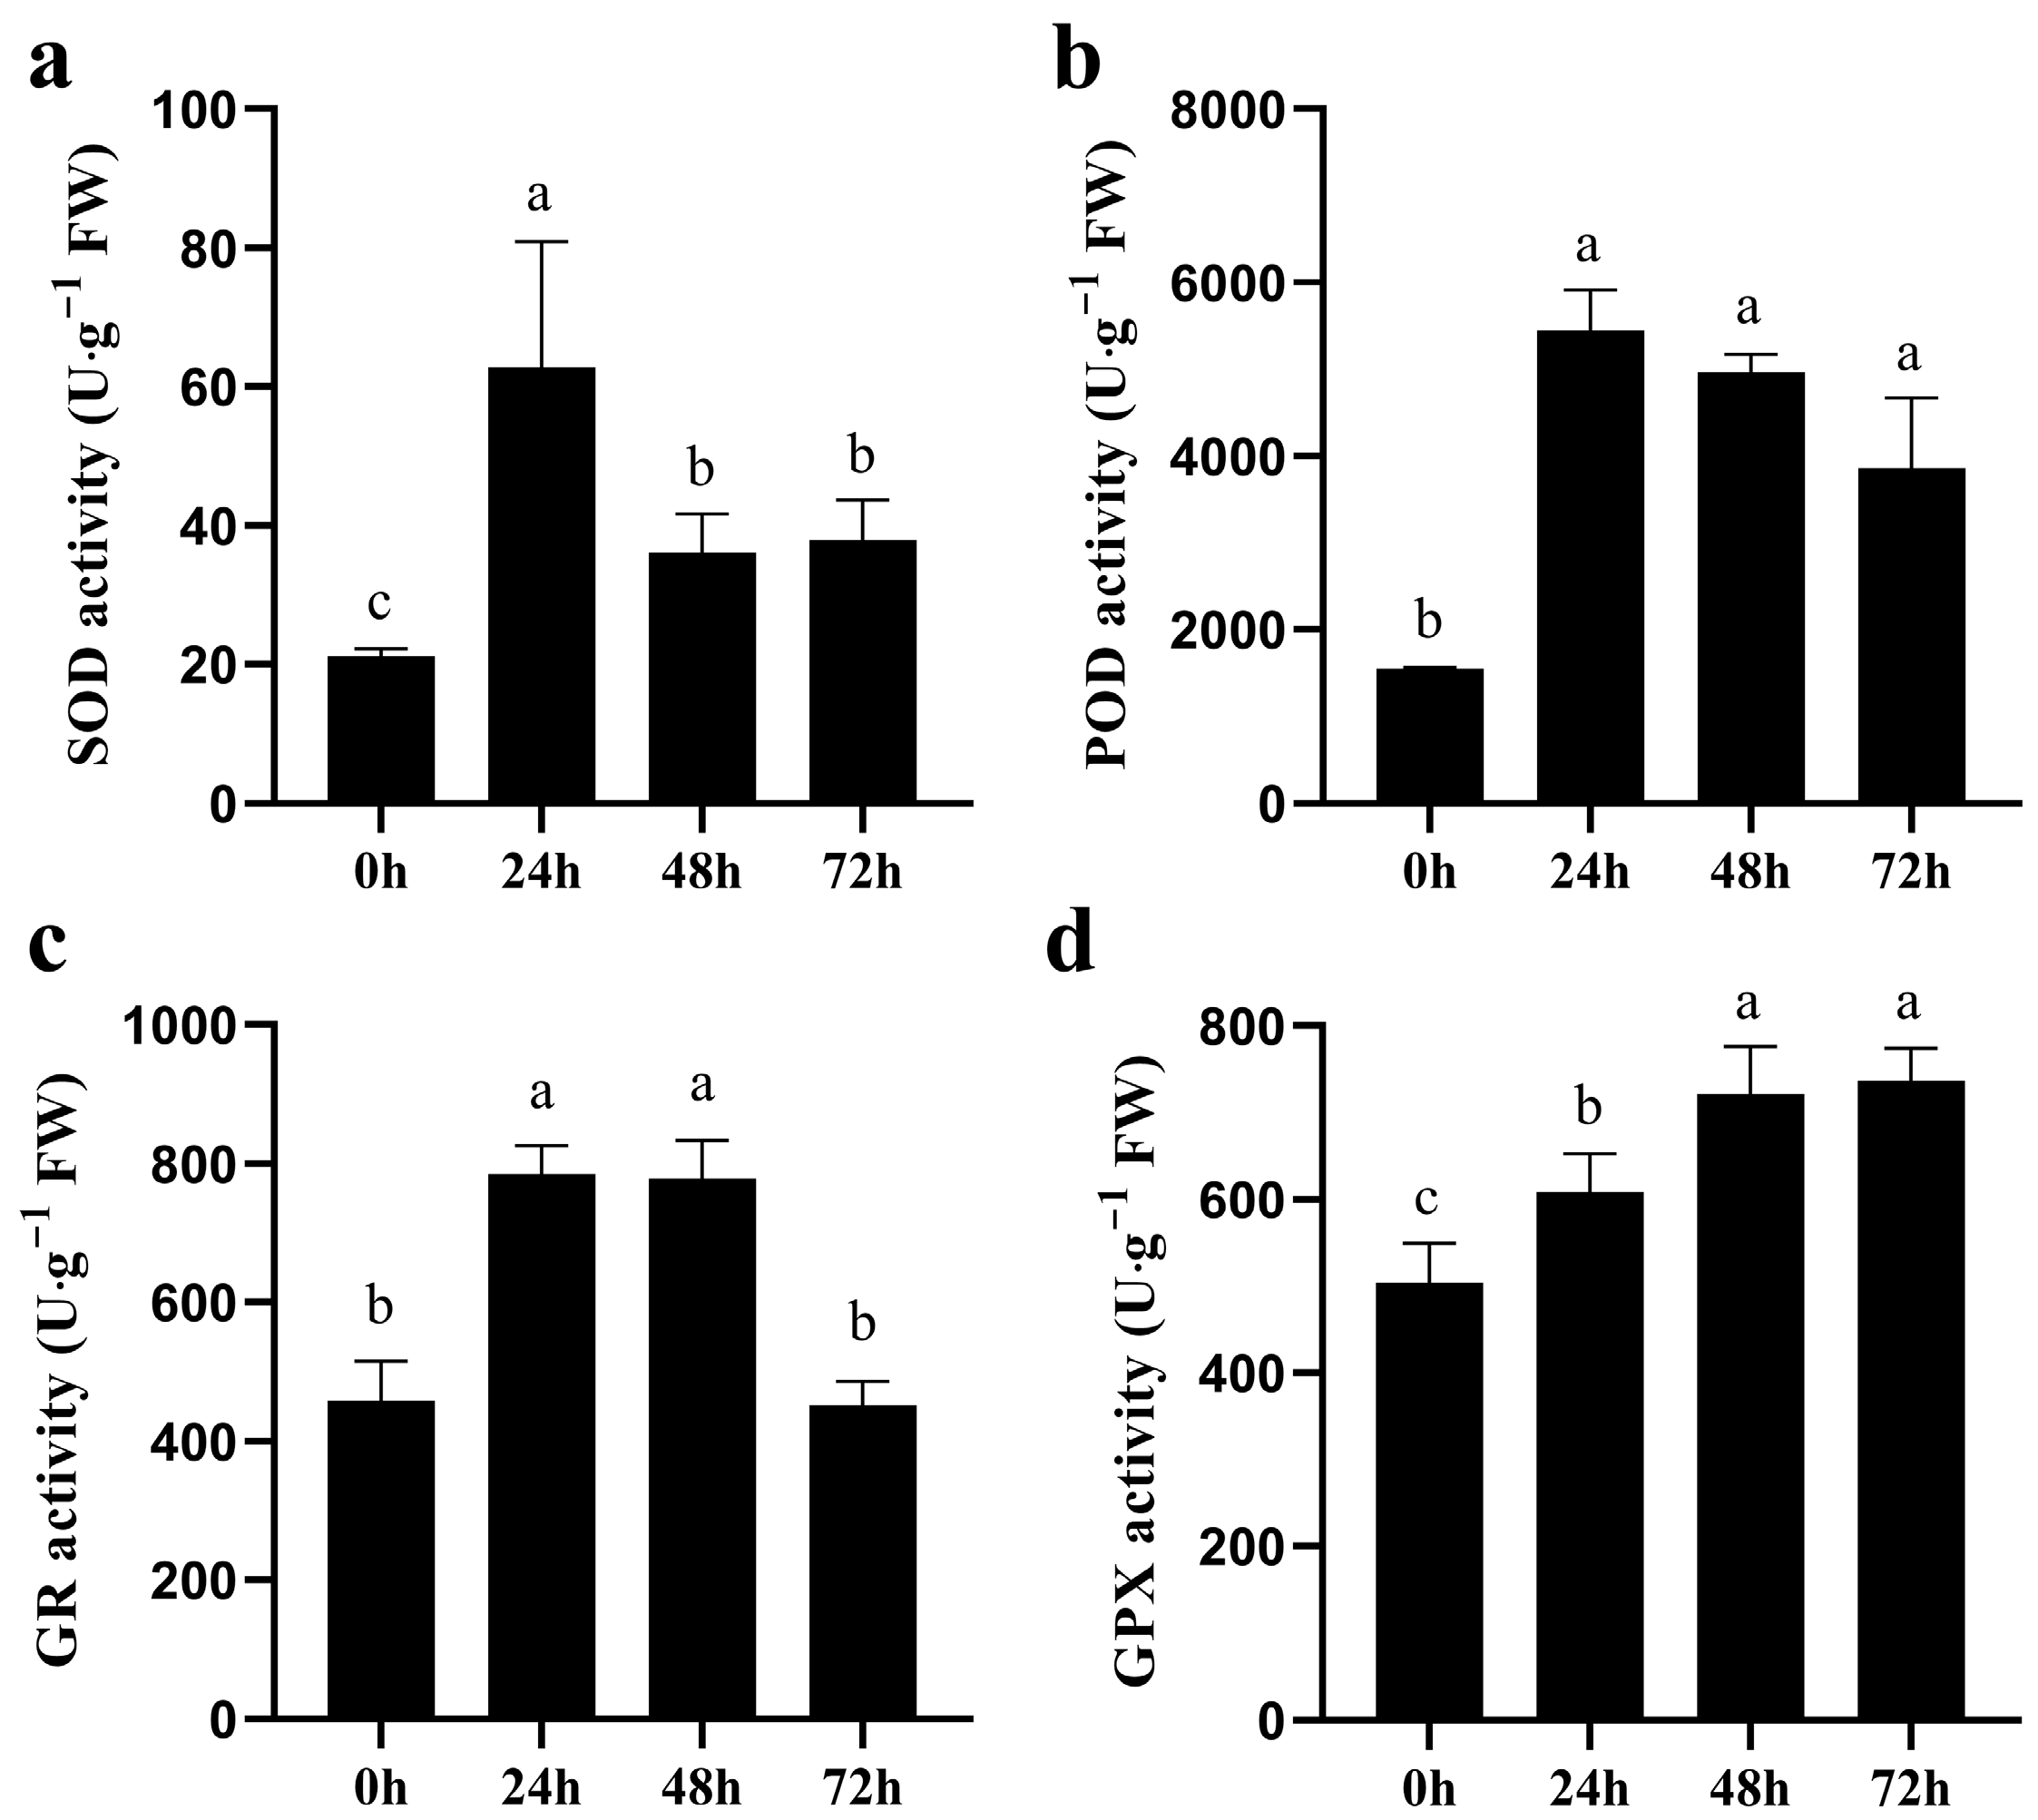
3.3. Activities of Antioxidant Enzymes in Quinoa Under CK and NaCl Stress

Normally, when ROS are imbalanced in plants, the activity of antioxidant enzymes is altered accordingly. In quinoa seedlings, as the duration of salt stress increased, the SOD, POD and GR activities increased and then decreased, whereas the GPX activity increased (Figure 3). This result suggests that excess ROS caused by salt stress can be eliminated by increasing the activity of antioxidant enzymes during quinoa germination.

3.4. Time-Course Transcriptional Profiles of Seedlings in Quinoa

To explore response genes at the seedling stage under salt stress, quinoa seedlings were treated with 300 mM NaCl (~IC50) 1 day after germination as the stress treatment and then sampled at 0, 24, 48 and 72 h for RNA-seq analysis. The 12 RNA-seq samples generated approximately 69~102 hundred million bases, and more than 90% of the input reads could be compared to the quinoa reference genome (Table 1). A threshold of the mean TPM > one of genes in the three replicates was used to identify the expressed genes. We found that the number of expressed genes at 24 h (24,251), 48 h (24,075) and 72 h (24,292) after salt stress was altered compared to that at 0 h (24,350) (Table 2). According to the gene expression level, group clustering found that the 0 and 24 h samples were clustered as adjacent clades, distant from the 48 and 72 h clades, indicating that the expression patterns of many genes changed with increasing stress time (Figure 4a). In addition, the PCA of the different sample transcript profiles could be divided into three groups: 0 h, 24 h, and 48 and 72 h (Figure 4b), which is consistent with the results of cluster analysis. The Venn diagram indicated that 22,689 genes were commonly expressed in all samples, with 478, 149, 176 and 313 genes specifically expressed at 0, 24, 48 and 72 h, respectively (Figure 4c). This result suggests that salt stress represses the expression of a large number of genes, but as the duration of salt stress increases, some genes involved in the regulatory mechanisms of salt stress are activated. It is inferred from the results of PCA and cluster analysis that the early (24 h) involvement of pathways or genes in salt stress regulation may be different from the later stage (48 and 72 h).

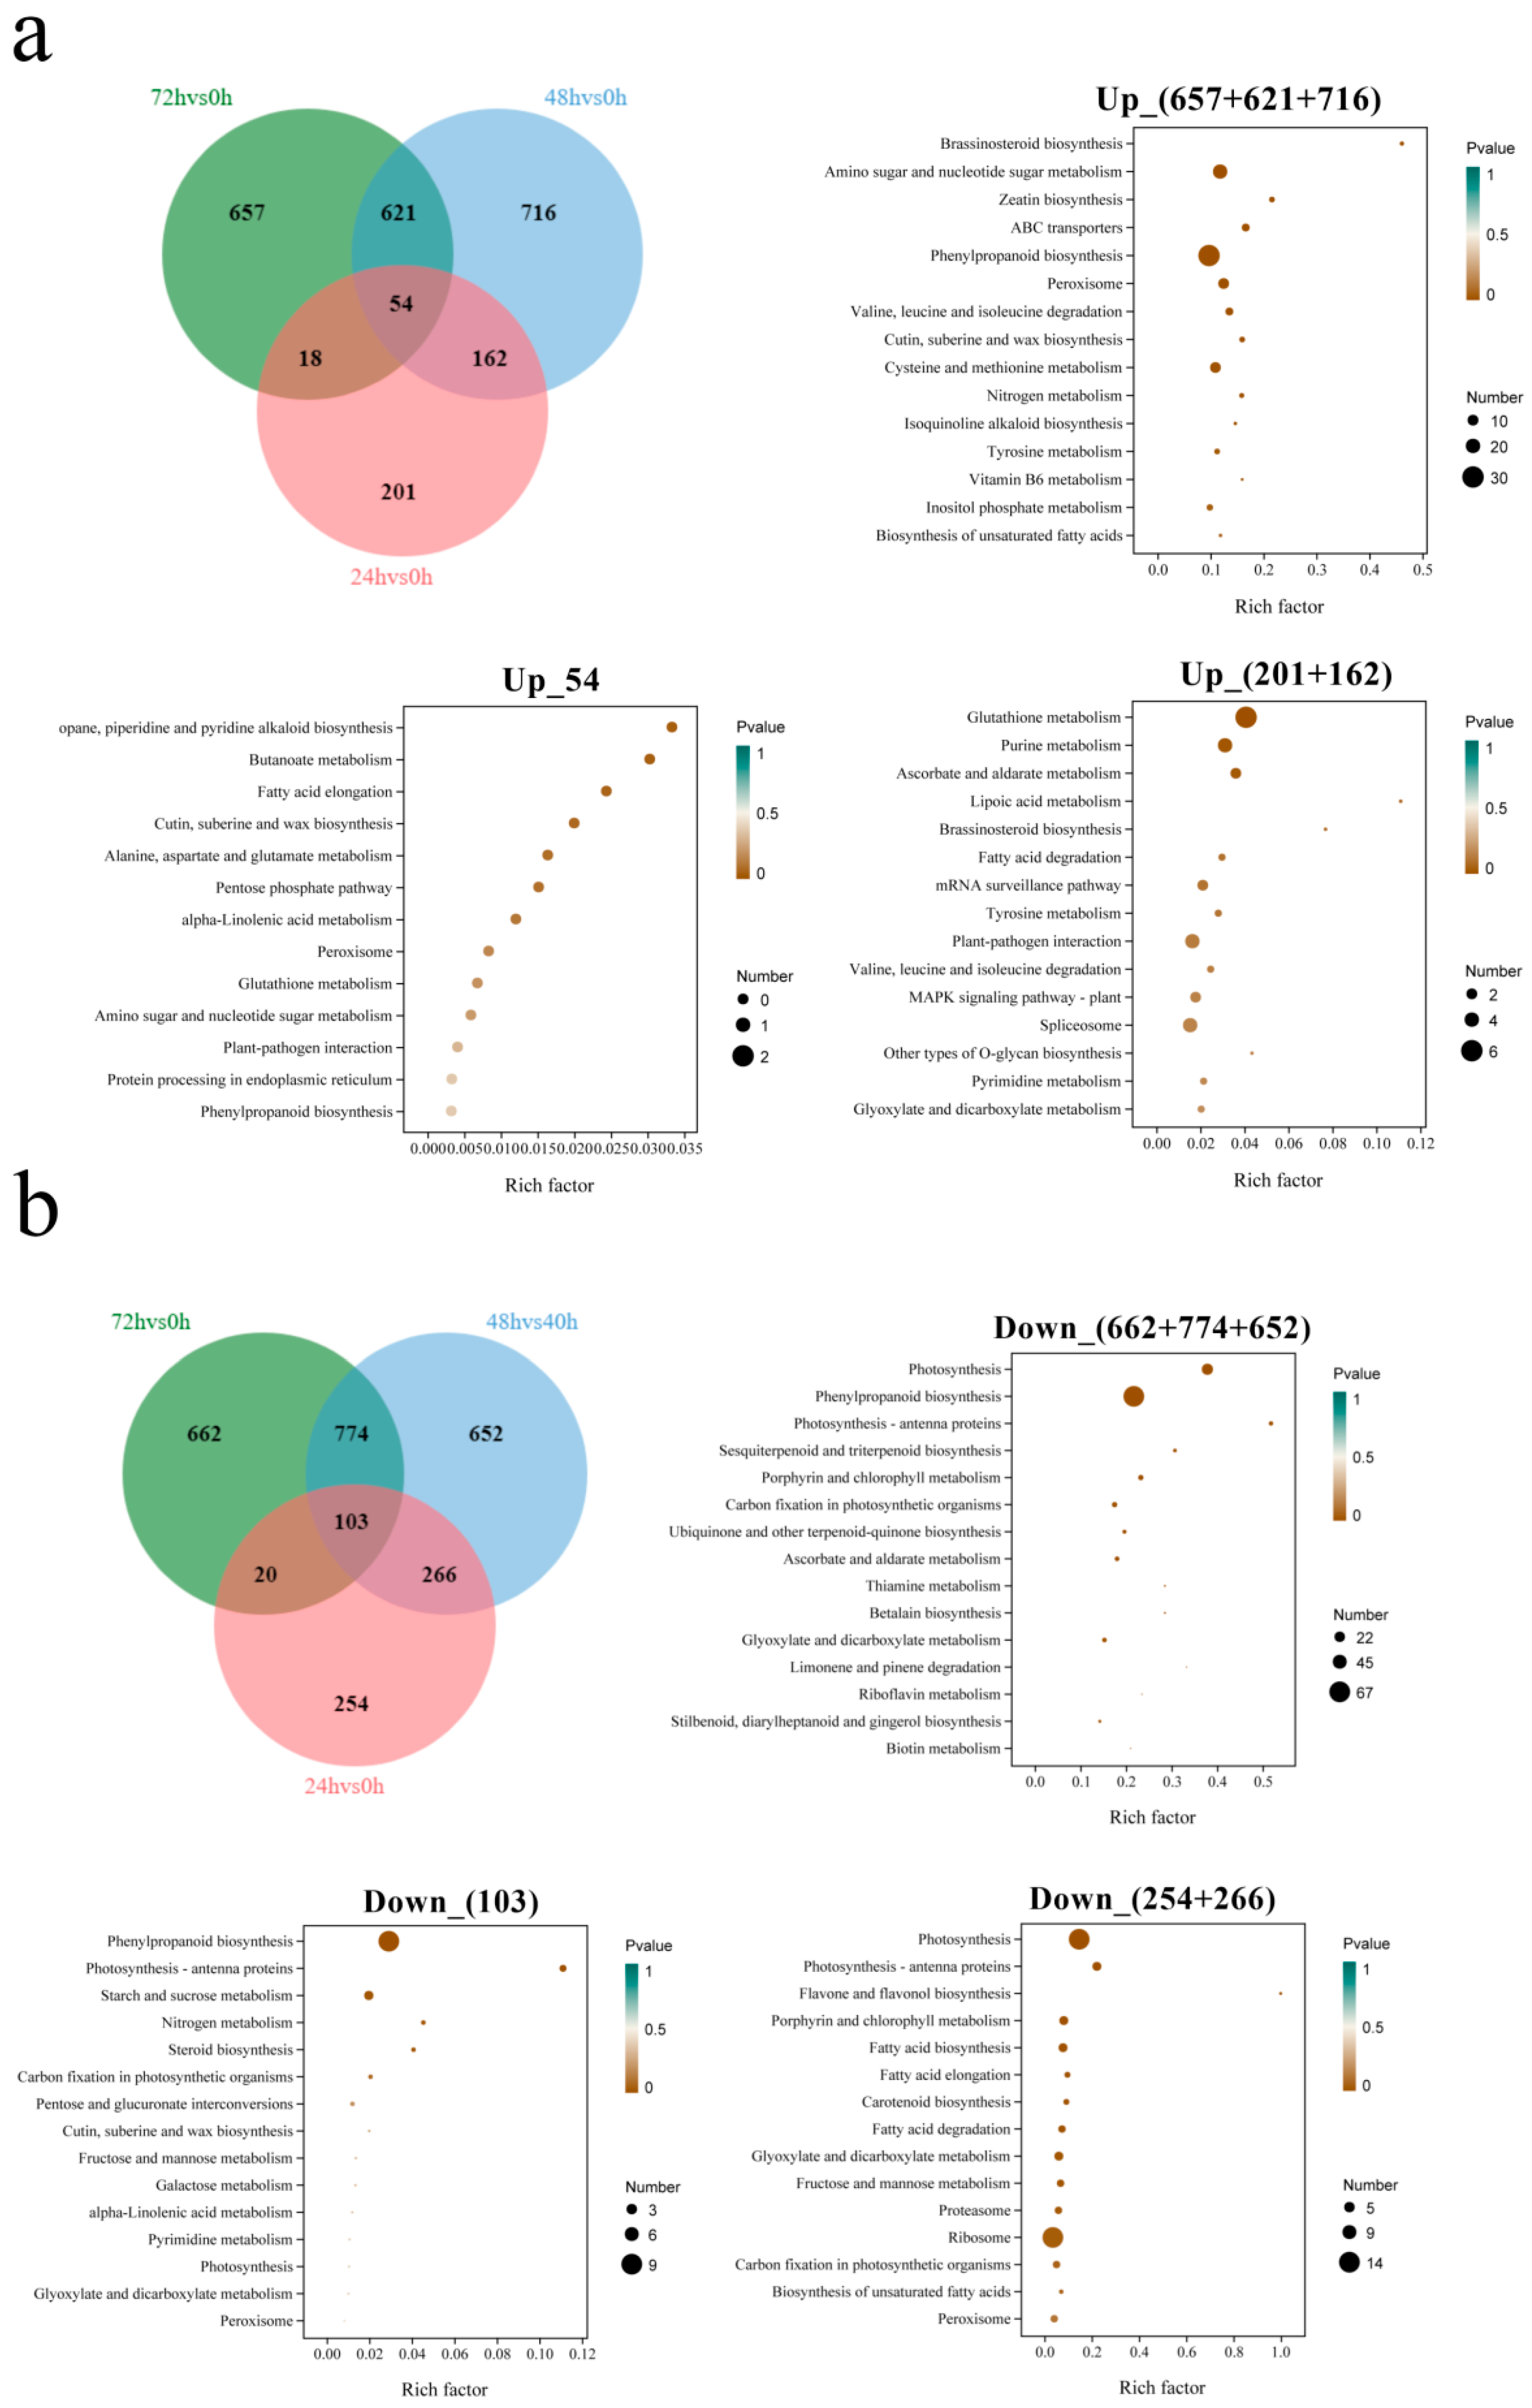
3.5. KEGG Enrichment Analysis Between Groups

A total of 5486 DEGs with p values < 0.05 and fold change |(FC)| > 2 were screened by comparison between groups (Table 3). There were 1078 DEGs at 24 h under salt stress, which was much less than the number of DEGs at 48 (3145) and 72 h (3112), but only 76 DEGs were consistent between 48 and 72 h, which further indicated that there were differences in the regulatory mechanism of quinoa in the early and late stages of the salt stress response. KEGG enrichment analysis revealed that DEGs at 24 h under salt stress were highly enriched in “phenylpropanoid biosynthesis” (Figure 5a). The 48 h samples were primarily enriched in “photosynthesis”, “phenylpropanoid biosynthesis” and “starch and sucrose metabolism” (Figure 5b), whilst the 72 h samples were primarily enriched in “photosynthesis”, “phenylpropanoid biosynthesis” and “ribosome” (Figure 5d). KEGG enrichment analysis of DEGs at 48 h vs. 24 h, 72 h vs. 24 h and 72 h vs. 48 h indicated that 48 and 72 h vs. 24 h were primarily enriched in “photosynthesis” and “photosynthesis-antenna proteins” (Figure 5c,e). The comparison of 72 h vs. 48 h identified enrichment primarily in “glyoxylate and dicarboxylate metabolism” and “pentose and glucuronate interconversions” (Figure 5f). Thus, there are not only differences in the number of DEGs in the early (24 h) and late (48 and 72 h) stages of salt stress, but also in the regulatory mechanisms involved.

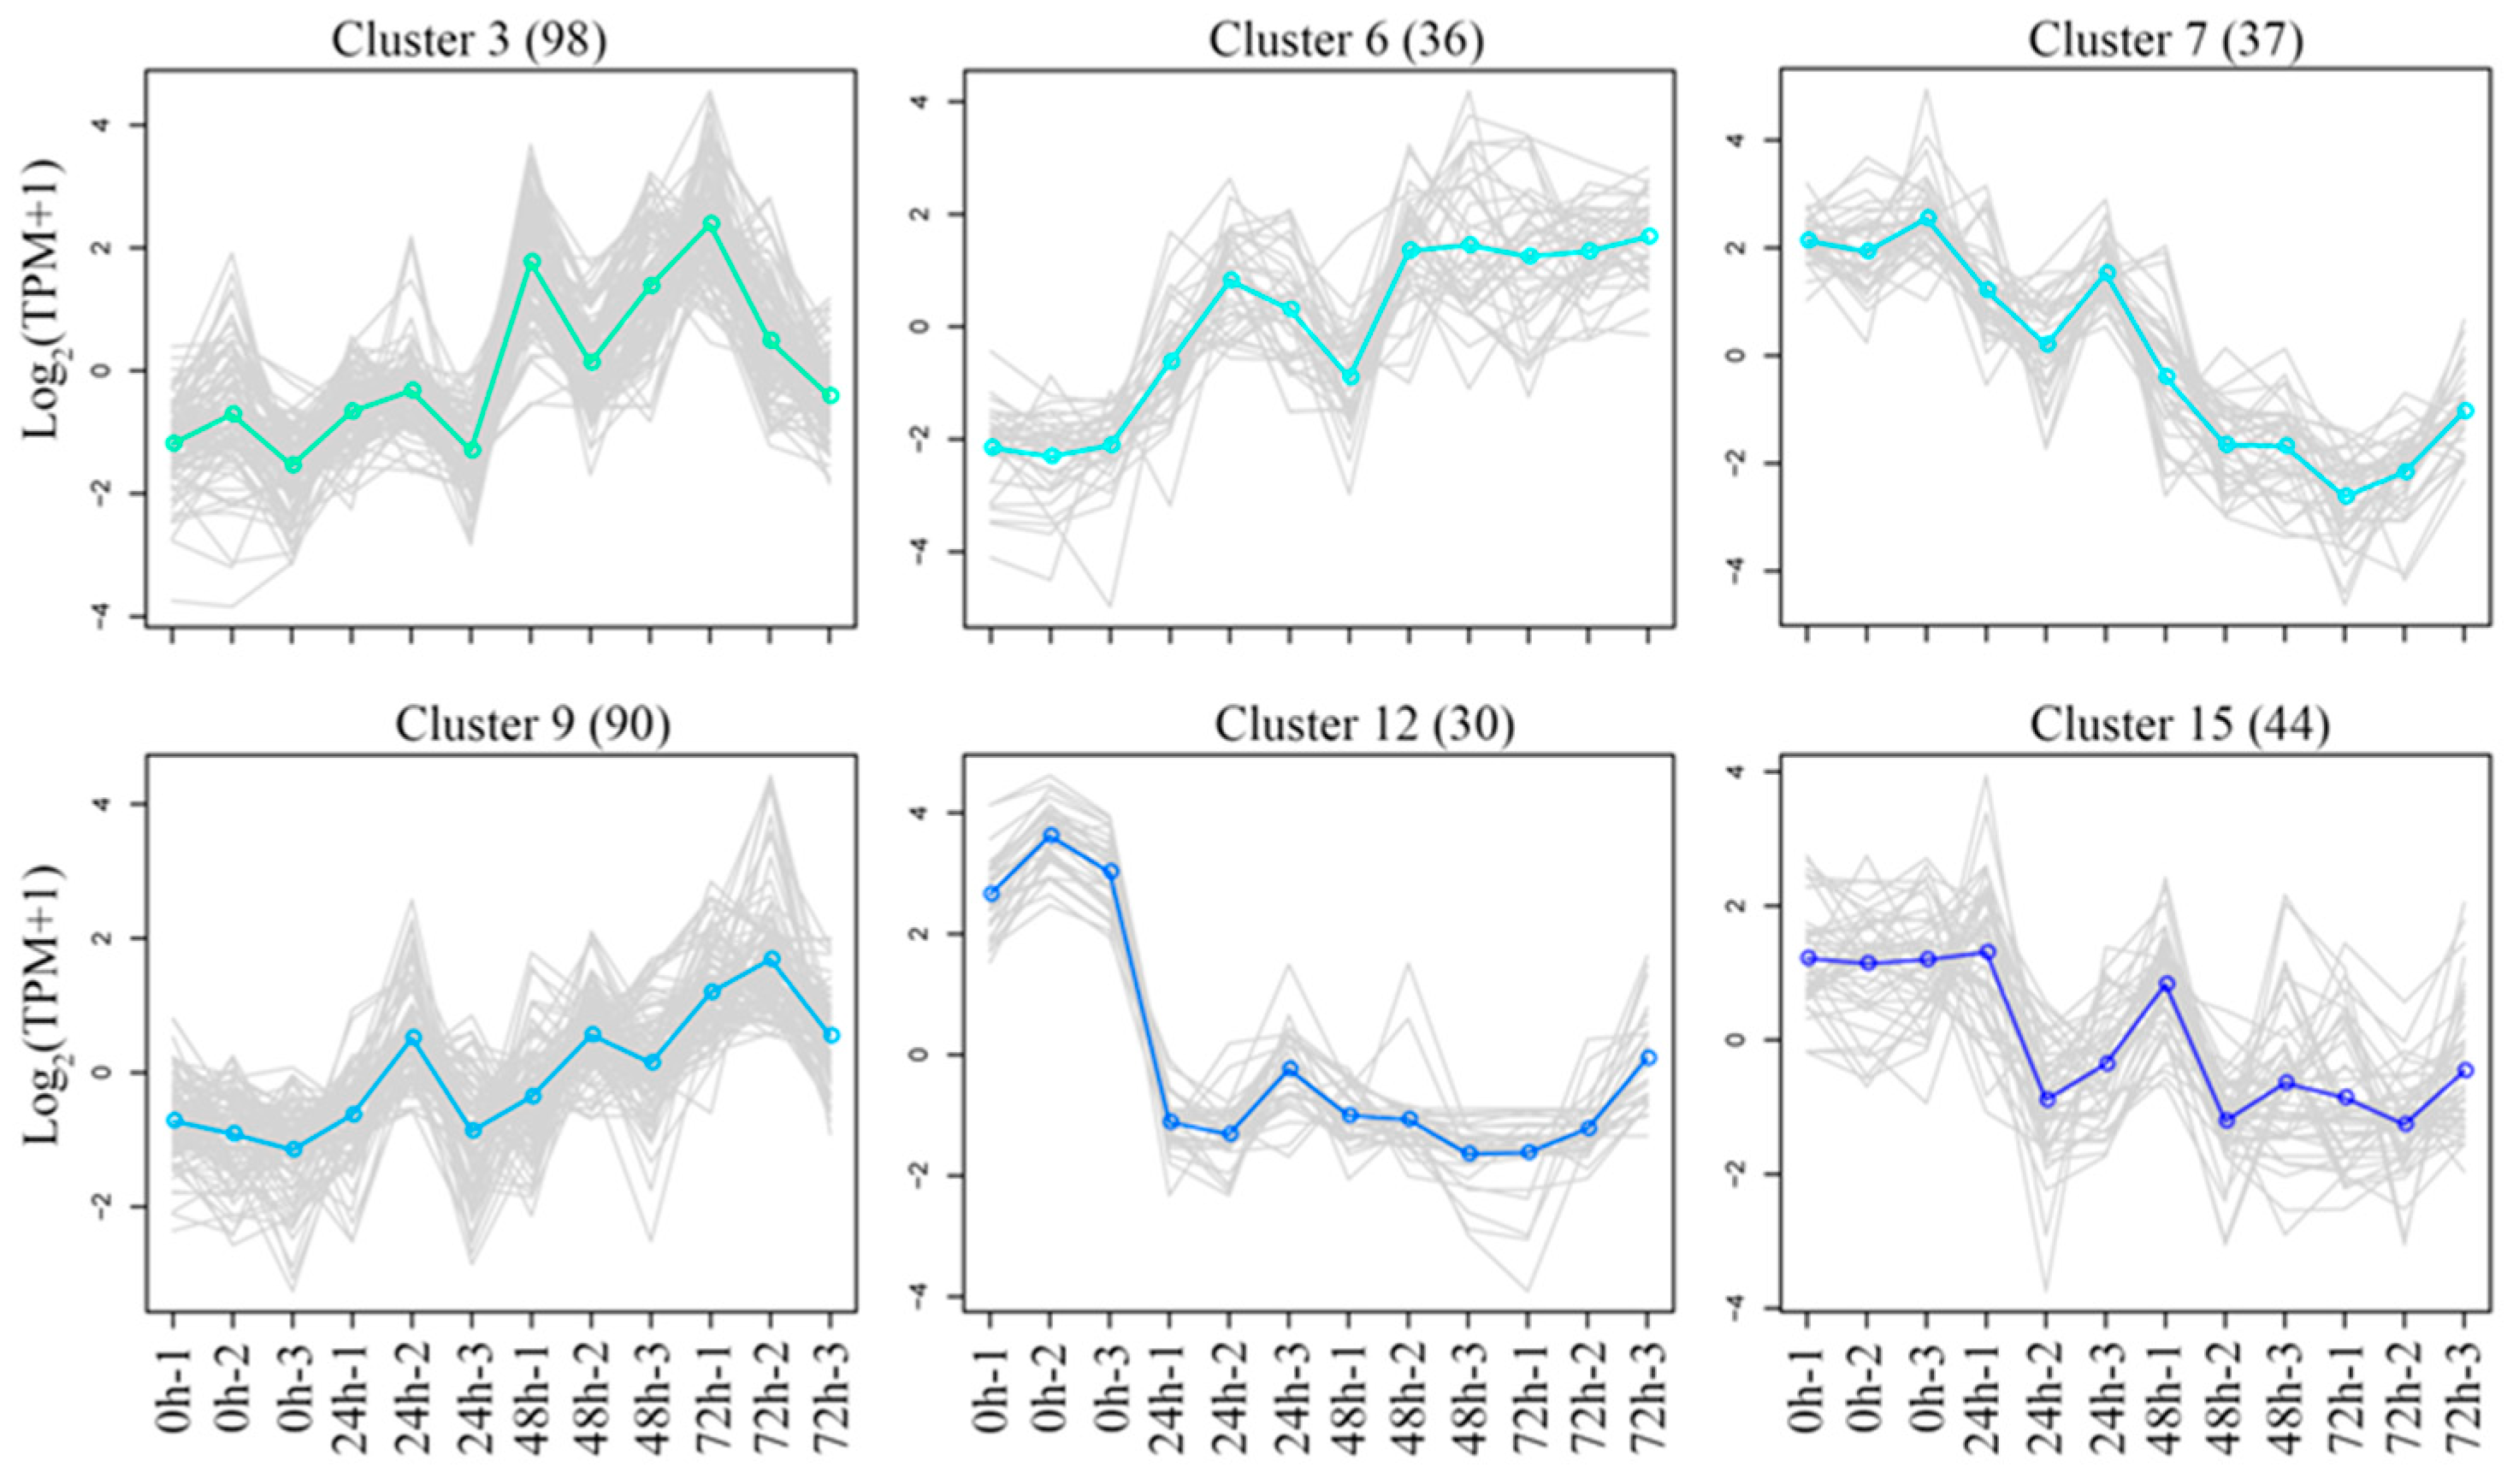
3.6. K-Means Clustering of DGEs

We performed a k-means clustering analysis of the 5165 DEGs using the k-means function in R (Figure 6). A total of 30 clusters with various gene expression dynamics were identified. Significantly, Clusters 3, 6, 7, 9, 12 and 15 exhibited obviously specific expression patterns (Figure 7). The transcription levels of 98, 36 and 90 genes contained in Clusters 3, 6 and 9, respectively, increased with increasing stress time, whereas the transcription levels of 37, 30 and 44 genes contained in Clusters 7, 12 and 15, respectively, decreased with increasing stress time. KEGG analysis of six clusters with significant specific expression patterns revealed that Cluster 3 was significantly enriched in “phenylpropanoid biosynthesis”, “zeatin biosynthesis” and “glutathione metabolism”, Cluster 6 was enriched in “phenylpropanoid biosynthesis”, Cluster 7 was enriched in “photosynthesis-antenna proteins”, Cluster 9 was enriched in “phenylpropanoid biosynthesis” and “cysteine and methionine metabolism”, Cluster 12 was enriched in “phenylpropanoid biosynthesis”, and Cluster 15 was enriched in “phenylpropanoid biosynthesis”, “ubiquitin mediated proteolysis”, “RNA polymerase” and “protein processing in endoplasmic reticulum” (Table 4). These results suggest that quinoa coping strategies for salt stress are multifaceted and complex, and DEG enrichment pathways can provide important clues for the regulatory mechanism of quinoa salt stress.

3.7. KEGG Enrichment Analysis of DEGs Under Salt Stress

Salt stress has an impact on the entire growth and development process of quinoa; not only will early osmotic stress lead to the loss of quinoa water, but later ionic toxicity will also lead to an imbalance in the ROS [32]. Therefore, to explore genes that are highly correlated with the regulatory mechanisms of salt stress, we compared the DEGs of 72 h vs. 0 h, 48 h vs. 0 h and 24 h vs. 0 h. As shown in Figure 6, there were 1395 DEGs co-expressed in 72 h vs. 0 h and 48 h vs. 0 h, 1319 DEGs specifically expressed in 72 h vs. 0 h and 1368 DEGs specifically expressed in 48 h vs. 0 h. KEGG enrichment revealed that these up-regulated DEGs were enriched in “phenylpropanoid biosynthesis” (Figure 8a) and down-regulated in “phenylpropanoid biosynthesis” and “photosynthesis” (Figure 8b). We speculate that these pathways may be involved in the regulatory mechanisms of quinoa under salt stress in later stages. A total of 157 DEGs were co-expressed in 72 h vs. 0 h, 48 h vs. 0 h and 24 h vs. 0 h. KEGG enrichment indicated that there was no significant enrichment pathway for these up-regulated DEGs (Figure 8a). The down-regulated DEGs were primarily enriched in “phenylpropanoid biosynthesis” and “starch and sucrose metabolism” (Figure 8b). However, 455 DEGs were specifically expressed in 24 h vs. 0 h, and 428 DEGs were co-expressed in 48 h vs. 0 h and 24 h vs. 0 h. KEGG enrichment indicated that these up-regulated DEGs were enriched in “glutathione metabolism” (Figure 8a) and down-regulated in “photosynthesis” and “ribosome” (Figure 8b). We speculate that these pathways may be involved in the regulatory mechanisms of quinoa under salt stress in the early stage. Since the co-expressed DEGs of 72 h vs. 0 h and 24 h vs. 0 h are unlikely to participate in salt stress regulation, no further analysis was performed.

3.8. Salt Stress Treatment Affected the Expression of Photosynthetic Pathway Genes in Quinoa Seedlings

Through KEGG enrichment analysis, we found that salt stress had a greater effect on the photosynthesis of quinoa seedlings. The “photosynthesis” and “photosynthesis-antenna proteins” pathway mapping of DEGs revealed that a total of 92 key genes for photosynthesis were regulated by salt stress. Ten LHCA and thirteen LHCB photosynthetic antennatin genes were found in the “photosynthesis-antenna proteins” pathway (Figure 9a). In addition, there were 69 DEGs in the “photosynthesis” pathway, of which twenty Psas6 genes were involved in PS I, thirty-one Psb genes in PS II, nine Pet genes in photosynthetic electron transport (PET) and seven affecting F-ATPase activity. Of note is the discovery of two Cyt-b6/f genes (Figure 9b). The expression levels of these genes were down-regulated to varying degrees under salt stress. The KEGG map revealed that the photosynthesis of quinoa seedlings was not significantly reduced at 24 h, and only two PsaL genes involved in the PS I process were down-regulated. However, at 24–48 h, all stages of photosynthesis were severely affected, but photosynthesis did not decreased between 48–72 h. The “photosynthesis-antenna protein” pathway has a similar time dependence to “photosynthesis”. This indicates that when quinoa seedlings are exposed to salt stress, photosynthesis does not decline immediately and will not change until a threshold is reached. Quinoa, as a halophytic pseudocereal plant, is tolerant to salt stress, but chronic stress can also lead to an imbalance in its physiological processes.

3.9. Salt Stress Treatment Affects the Expression of of Glutathione Metabolism Genes in Quinoa Seedlings

Photosynthesis decreased primarily between 24–48 h, and a simultaneously enriched pathway was “glutathione metabolism”, which is involved in the plant response to environmental stress, plant development and ROS signaling. Through pathway mapping localization, a total of 40 DEGs were found to participate in “glutathione metabolism” (Figure 10): five APXs, nine GSTs, thirteen GSTUs, two Hsps, two CLEB3J9 and nine undefined (Table S2). Among them, APXs, GSTs and GSTUs all regulate ROS balance. Hsps can participate in the regulation of biological stresses as molecular chaperones, and the GO annotation for CLEB3J9 is GO:0010206, which is involved in PS II process repair. High tolerance to salt stress in quinoa is speculated to be related to its efficient removal of excess ROS through “glutathione metabolism”.

3.10. Salt Stress Treatment Affects the Expression of Phenylpropanoid Biosynthesis, Starch and Sucrose Metabolism Genes in Quinoa Seedlings

The KEGG mapper of DEGs identified early-term enrichment in the “phenylpropanoid biosynthesis” pathway and long-term enrichment in the “phenylpropanoid biosynthesis” and “starch and sucrose metabolism” pathways. Eighty-seven down-regulated and thirty-three up-regulated genes were mapped to the “phenylpropanoid biosynthesis” pathway (Figure 11a). These genes were annotated and found to contain primarily peroxidases (PERs), peroxisomal adenine nucleotide carrier 2 (PNC2s) and caffeic acid O-methyl transferase (COMTs) genes, which are generally involved in the elimination of H2O2, oxidation of toxic reducing agents, and biosynthesis and degradation of lignin (Table S3). There were 31 down-regulated and 16 up-regulated genes localized to “starch and sucrose metabolism” (Figure 11b). Four SS genes were identified by gene annotation in sixteen up-regulated genes (Table S4). Due to the less energy required for SS to catalyze sucrose catabolism, plants under stress conditions tend to rely more on sucrose synthase-catalyzed reactions to provide reducing sugars for normal development [33]. We speculate that quinoa seedlings resist salt stress primarily through “phenylpropanoid biosynthesis” and “starch and sucrose metabolism” processes in the late and long-term stages.

3.11. Transcription Factors in Quinoa Are Involved in Salt Stress Regulation

Due to the key role of transcription factors in the regulation of salt stress process sections, we predicted that TFs for 2411 and 2711 were up- and down-regulated DEGs, respectively. A total of 156 up-regulated TFs belonging to 31 TF families were screened and found to be dominated by bHLH, NAC and bZIP. Seventy-nine down-regulated TFs, belonging to twenty-three TF families, were dominated by bHLH, ERF and B3 (Figure 12). bHLH, ERF, B3, MYB_related, G2-like, C2H2, GRAS, HD-ZIP, MYB, WRKY, C3H, TCP, bZIP, GRF, HSF, LBD, MIKC_MADS, M-type_MADS and WOX were shared between up- and down-regulated genes. Notably, we found that 45 TFs belonging to NAC, NF-YA, Dof, Trihelix, NF-YB, ARR-B, GATA, TALE, ZF-HD, BES1, NF-YC and SRS were specifically up-regulated by salt stress. Meanwhile, eight TFs belonging to CO-like, DBB, LSD and RAV were specifically down-regulated by salt stress (Tables S5 and S6). Therefore, we hypothesize that these TFs may be important positive and negative transcriptional regulators in response to salt stress signaling in quinoa seedlings.

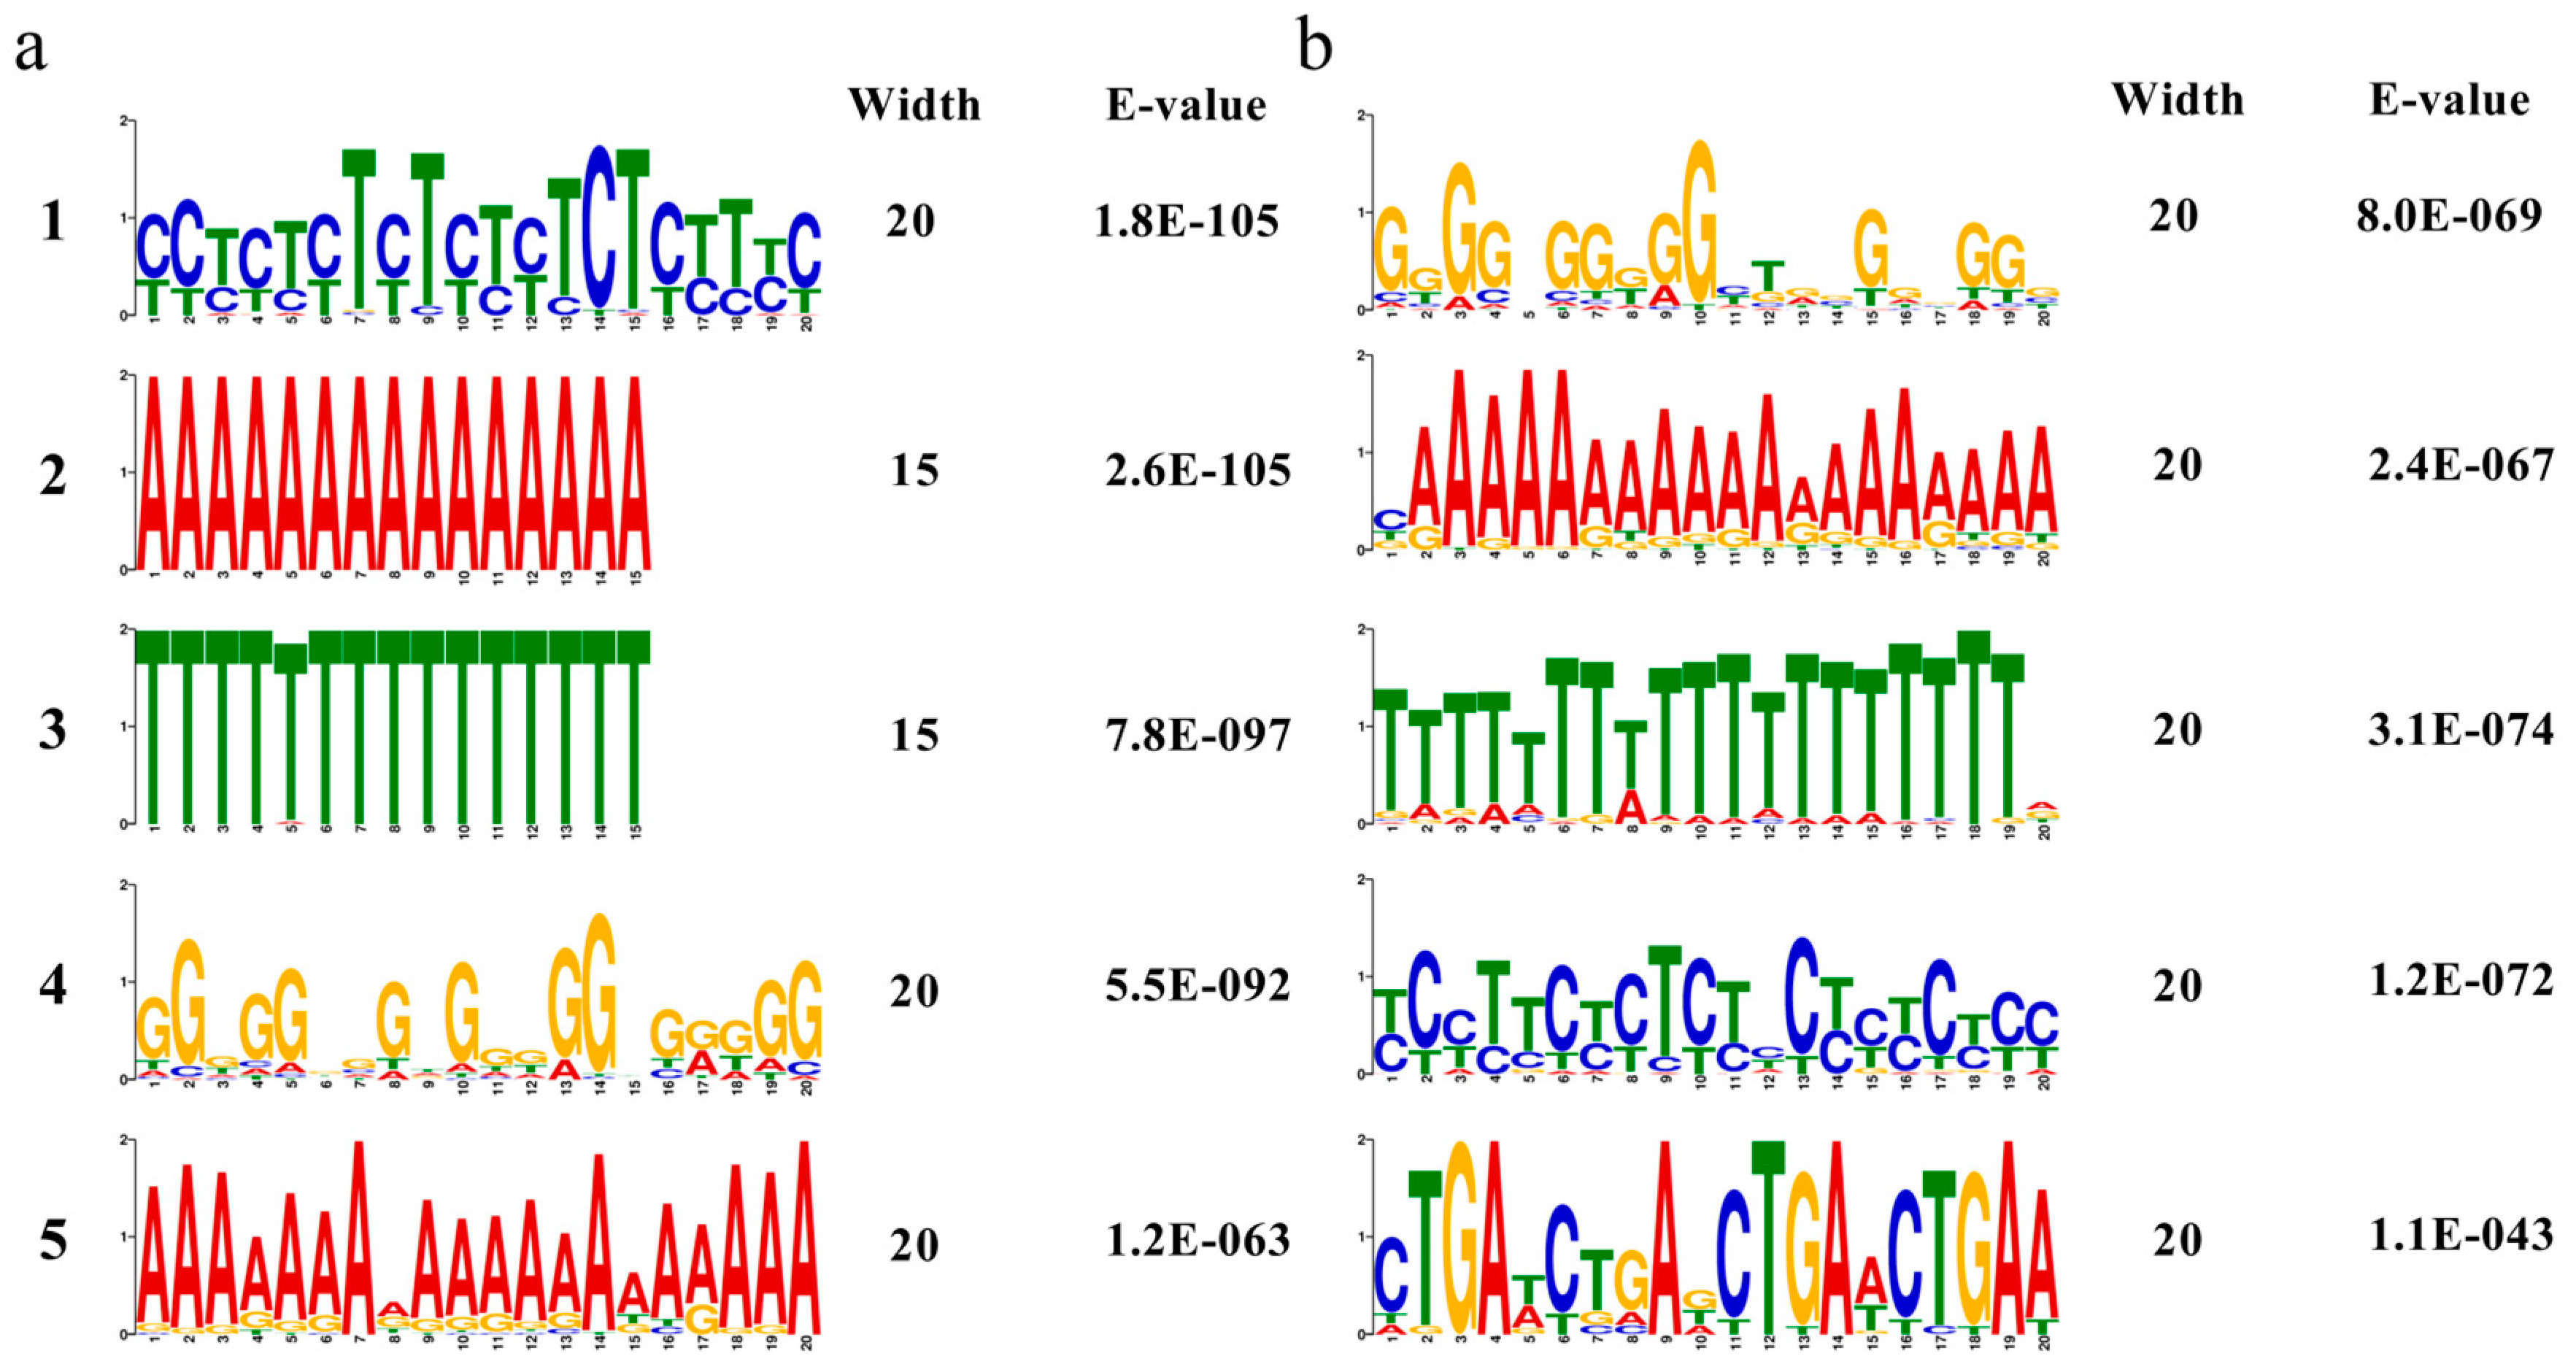
3.12. Prediction and Overrepresented Cis-Elements in the Promoter Regions of Transcription Factors

The transcriptional regulation of TFs underlying many biological processes is initiated by recognizing external signals, and deciphering the potential cis-elements of TFs affected by salt stress can help to rapidly identify upstream signals. To determine which cis-element is enriched in the TF promoters up- and down-regulated by salt stress, we submitted the 2.0 kb sequences of these gene promoter regions to PlantCARE and found that “defense and stress-responsive”, “MeJA-responsive”, “drought-inducibility”, “abscisic acid-responsive”, “auxin-responsive”, “salicylic acid-responsive”, “gibberellin-responsive” and other cis-elements were present in the 156 and 79 TF promoters that were up- and down-regulated (Figures S3 and S4). The 235 predicted TFs not only respond to abiotic stress regulation, but also participate in a variety of biogenic hormone metabolic pathways. Motif analysis of the promoter regions of TFs by MEME yielded five extremely significant DNA motifs for the up- and down-regulated TF promoter regions (Figure 13). With a cutoff of e-value = 0.1, we matched the overrepresented motifs to known cis-elements in Arabidopsis. Among the five motifs up-regulated by salt stress, motifs 1 and 5 were better matched with the BPC5 binding site of the BBRBPC TFs, motifs 2 and 3 were better matched with the VRN1 binding site of the ABI3/VP1 TFs, and motif 4 was better matched with the MYB67 binding site of the MYB TFs. VRNs are key regulators of the abscisic acid (ABA) signaling pathway, whereas MYBs are involved in the salicylic acid (SA) signaling pathway, both of which play an important role in plant responses to stresses. Among the five motifs down-regulated by salt stress, motifs 1 and 2 were better matched with the MYB60 binding site of the MYB TFs, and motifs 3, 4 and 5 were better matched with the DEL2 binding site of the E2FDP TFs, the TCP1 binding site of the TCP TFs and the WLIM2A binding site of the LIM TFs (Table 5).

4. Discussion

Quinoa, an important model halophytic crop species, is used in grain production and is conducive to the development of saline agriculture, which not only promotes the utilization of arid and semiarid, saline-alkali and other wastelands, but also effectively supplements the production of staple food [34]. Despite a long history in studying the mechanisms of plant salinity tolerance, the engineering of salinity-tolerant crops remains very challenging. Crop salinity tolerance is a complex trait associated with multiple subtraits, each with a complex genetic basis [35]. Manipulating a single or a limited number of genes has proven to be inadequate to create salinity-tolerant crops. To alleviate this dilemma, engineering tolerant crops, which are typically minor crops cultivated in marginal areas, for better yields could be an easier alternative to engineering major crops to be salt tolerant, and quinoa is considered to be a perfect candidate [8]. Thus, it is essential to understand the mechanisms and explore the key regulatory factors of salt tolerance in quinoa.
Previously, numerous studies have demonstrated that higher NaCl stress can reduce the germination rate of quinoa and disrupt normal physiological processes [36,37]. In this study, the germination rate of quinoa seeds decreased with increasing NaCl concentration, and when NaCl exceeded 200 mM, the embryo and radicle length were significantly altered. In addition, the NaCl IC50 for germination rate was 312.8 mM, thus 300 mM NaCl was used for the simulated salt stress treatment of quinoa seedlings, and samples were collected at 0, 24, 48 and 72 h for MDA, H2O2, activities of antioxidant enzymes and RNA-seq analysis. In the experiment, we found that salt stress causes an imbalance of ROS in quinoa, which disrupts cell membrane integrity, whereas the elevated activity of antioxidant enzymes, such as SOD, POD, GR and GPX, can scavenge excess ROS and mitigate cell membrane damage. Transcriptome data analysis was performed, and clustering found that 0 and 24 h samples were clustered as adjacent clades, distant from the 48 and 72 h clades, consistent with the result of PCA between samples. We hypothesize that the mechanisms involved in the regulation of salt stress in quinoa may change as the duration of salt stress increases. Cross-group comparison revealed that the number of DEGs produced increased with increasing duration of salt stress. Clustering analysis of the expression of DEGs also revealed that 0 and 24 h were clustered into one clade and 48 and 72 h were clustered into another clade, providing further evidence of differences in the genes and biological processes involved in the regulation of quinoa in the early and late stages of salt stress. KEGG enrichment analysis indicated that a large number of key genes for photosynthesis were inhibited between 24~48 h, while the expression levels of key genes in glutathione metabolism were generally higher, suggesting that fine regulation of glutathione metabolic processes is a key pathway in quinoa for scavenging ROS in response to salt stress early stage [38]. In contrast, DEGs occurring in the late and long-term stages of salt stress were mainly enriched in “phenylpropanoid biosynthesis” and “starch and sucrose metabolism”. “Phenylpropanoid biosynthesis” is a series of enzymatic reactions starting with phenylalanine that produce a large number of secondary metabolites that play an important role in plant growth and development, as well as plant–environment interactions [39,40]. Gene annotation revealed primarily PER, PNC2 and COMT genes, which are involved in the elimination of H2O2, oxidation of toxic reducing agents, and lignin biosynthesis and degradation. The lignin produced by the lignin pathway can not only provide mechanical support for plants, but also participate in the transport of water and minerals. In addition, the xylem is rapidly loaded with Na+ to regulate osmotic pressure, which is also an important mechanism by which quinoa resists salt stress [41]. These data reveal why quinoa has elevated antioxidant enzyme activity during exposure to salt stress. “Starch and sucrose metabolism” is also important for plants to cope with abiotic stresses, as the process of starch and sucrose metabolism not only scavenges excess ROS to maintain normal cellular redox reactions [11], but also produces soluble sugars that regulate osmotic pressure homeostasis [42]. Large amounts of sucrose are produced during starch and sucrose metabolism, and the enrichment of sucrose under salt stress is considered a long-term defense strategy for plants [43,44]. Differences in the expression pattern of DEGs produced by time-course analysis of salt stress may be due to a preadaptive response to salinity in quinoa, resulting in a constitutive overexpression of stress-related genes [45,46]. However, due to the many ecological types of quinoa, whether these traits are widespread in quinoa requires further research.
Transcription factor annotation results revealed that twelve families of TFs (NAC, NF-YA, Dof, Trihelix, NF-YB, ARR-B, GATA, TALE, ZF-HD, BES1, NF-YC and SRS) were specifically up-regulated and four families of TFs (CO-like, DBB, LSD and RAV) were specifically down-regulated in DEGs under salt stress, indicating that they play an important role in enhancing and reducing salt tolerance in quinoa. In addition, 20 families of TFs (bHLH, ERF, B3, MYB_related, G2-like, C2H2, GRAS, HD-ZIP, MYB, WRKY, C3H, TCP, bZIP, GRF, HSF, LBD, MIKC_MADS, M-type, MADS and WOX) were present in up- and down-regulated DEGs, suggesting possible antagonistic effects between different members of the same TF family in quinoa during resistance to salt stress. In recent years, many studies have also demonstrated that these transcription factors play an important role in the regulation of salt stress. An overexpression of GmNAC06 can significantly increase the accumulation of proline and betaine in soybeans and Arabidopsis and can alleviate the oxidative stress caused by excess ROS, thereby enhancing plant salt tolerance [47]. SmERF1 in Eggplant exhibits transcriptional activity in the nucleus, and knocking down the expression of SmERF1 can significantly reduce antioxidant enzyme activity and improve salt sensitivity [48]. RAVs negatively regulate growth and multiple abiotic stresses in Arabidopsis [49]. In addition, bioinformatic analysis of the promoter regions of these TFs revealed an enrichment of diverse cis-acting regulatory elements associated with stress adaptation and phytohormone signaling. Notably, “defense and stress-responsive” and “drought-induvibility” elements were identified, suggesting roles in abiotic stress tolerance. Multiple hormone-related motifs were also detected, including “MeJA-responsive”, “abscisic acid-responsive”, “auxin-responsive”, “salicylic acid-responsive”, “gibberellin-responsive” and other action progenitors. The co-occurrence of these regulatory elements underscores the functional versatility of these TFs in salt stress and endogenous signals. The promoters of up-regulated TFs were significantly enriched for motifs, including VRN1 (a vernalization-responsive element critical for flowering time control), MYB67 (linked to abiotic stress responses and ion homeostasis) and BPC5 (a GAGA-binding motif involved in chromatin remodeling and growth regulation). Conversely, promoters of down-regulated TFs were predominantly enriched for motifs such as MYB60 (associated with drought response and stomatal closure), TCP1 (a plant-specific motif regulating cell proliferation and leaf morphogenesis) and DEL2 (implicated in secondary cell wall biosynthesis and developmental repression). This further suggests that quinoa may prioritize stress adaptation under salt stress conditions through its own growth and developmental transitions [50].

5. Conclusions

This study found that the growth of quinoa seedlings was significantly inhibited under salt stress, and physiological and biochemical traits such as H2O2, MDA, SOD, POD, GR and GPX showed an upward trend, suggesting that the elevated activity of antioxidant enzymes in seedlings can alleviate the damage caused by salt stress. In parallel, RNA-seq analysis showed that the ROS imbalance caused by early-term salt stress induced the up-regulation of the expression of antioxidant enzyme-related genes (e.g., GSTs, GSTUs, APXs, etc.) in the “glutathione metabolism” pathway. However, the expression of SS genes in the “starch and sucrose metabolism” pathway was up-regulated during the later stages of salt stress, suggesting that quinoa may also utilize sucrose synthase-catalyzed reactions that reduce energy consumption and provide reducing sugars for development. In addition, 235 TFs were predicted to be involved in the salt stress response, with multiple cis-elements in their promoter regions (e.g., “MeJA-responsive”, “abscisic acid-responsive”, “auxin-responsive”, etc.), which also suggests that there are multiple hormones involved in the salt stress response process in quinoa. Understanding these mechanisms not only enhances our knowledge of salt stress responses, but also offers potential strategies for improving quinoa salinity and productivity.

Supplementary Materials

The following supporting information can be downloaded at https://www.mdpi.com/article/10.3390/biology14040416/s1: Table S1: The primer design of genes. Table S2: Annotation of DEGs in the glutathione metabolic pathway. Table S3: Annotation of DEGs in the phenylpropanoid biosynthesis pathway. Table S4: Annotation of DEGs in the starch and sucrose metabolism pathway. Tables S5 and S6: TFs in salt-repressed. Figure S1: Correlation analysis of QRT-PCR and TMP. Figure S2: Photographs of quinoa seedlings under CK and salt stress conditions. Figures S3 and S4: Cis-elements in the promoter regions of transcription factors.

Author Contributions

Y.Z.: conceptualization, methodology, funding acquisition and visualization; P.L.: material preparation, software, writing—original draft and formal analysis. All authors have read and agreed to the published version of the manuscript.

Funding

We would like to acknowledge the financial support of this research by the Shandong Provincial Natural Science Foundation (ZR2024QC385) and the One Hundred Excellent Talents Support Program of Jining University (2023ZYRC51).

Institutional Review Board Statement

Not applicable.

Informed Consent Statement

Not applicable.

Data Availability Statement

The RNA-seq data generated from Chenododium quinoa seeding samples in this study were deposited in the NCBI SRA database (http://trace.ncbi.nlm.nih.gov/Traces/sra accessed on 6 January 2025) under accession PRJNA894199.

Conflicts of Interest

The authors declare no conflicts of interest.

References

  1. Zhao, S.; Zhang, Q.; Liu, M.; Zhou, H.; Ma, C.; Wang, P. Regulation of plant responses to salt stress. Int. J. Mol. Sci. 2021, 22, 4609. [Google Scholar] [CrossRef] [PubMed]
  2. Guo, H.; Zhang, L.; Cui, Y.N.; Wang, S.; Bao, A.K. Identification of candidate genes related to salt tolerance of the secretohalophyte Atriplex canescens by transcriptomic analysis. BMC Plant Biol. 2019, 19, 213. [Google Scholar] [CrossRef]
  3. Shrivastava, P.; Kumar, R. Soil salinity, A serious environmental issue and plant growth promoting bacteria as one of the tools for its alleviation. Saudi J. Biol. Sci. 2015, 22, 123–131. [Google Scholar] [CrossRef]
  4. Weber, H.; Sciubba, J.D. The effect of population growth on the environment, evidence from European regions. Eur. J. Popul. 2018, 35, 379–402. [Google Scholar] [CrossRef]
  5. Salwan, R.; Sharma, A.; Sharma, V. Microbes mediated plant stress tolerance in saline agricultural ecosystem. Plant Soil 2019, 442, 1–22. [Google Scholar] [CrossRef]
  6. Wu, P.; Wu, X.; Wang, Y.; Xu, H.; Owens, G. Towards sustainable saline agriculture, interfacial solar evaporation for simultaneous seawater desalination and saline soil remediation. Water Res. 2022, 212, 118099. [Google Scholar] [CrossRef] [PubMed]
  7. Cheeseman, J.M. The evolution of halophytes, glycophytes and crops, and its implications for food security under saline conditions. New Phytol. 2015, 206, 557–570. [Google Scholar] [CrossRef] [PubMed]
  8. Zou, C.; Chen, A.; Xiao, L.; Muller, H.M.; Ache, P.; Haberer, G.; Zhang, M.; Jia, W.; Deng, P.; Huang, R.; et al. High-quality genome assembly of quinoa provides insights into the molecular basis of salt bladder-based salinity tolerance and the exceptional nutritional value. Cell Res. 2017, 27, 1327–1340. [Google Scholar] [CrossRef]
  9. Vega-Gálvez, A.; Miranda, M.; Vergara, J.; Uribe, E.; Puente, L.; Martínez, E.A. Nutrition facts and functional potential of quinoa (Chenopodium quinoa willd.), an ancient Andean grain, a review. J. Sci. Food Agric. 2010, 90, 2541–2547. [Google Scholar] [CrossRef]
  10. Filho, A.M.; Pirozi, M.R.; Borges, J.T.; Pinheiro-Sant’Ana, H.M.; Chaves, J.B.; Coimbra, J.S. Quinoa, nutritional, functional, and antinutritional aspects. Crit. Rev. Food Sci. Nutr. 2017, 57, 618–1630. [Google Scholar] [CrossRef]
  11. Delatorre-Herrera, J.; Pinto, M. Importance of ionic and osmotic components of salt stress on the germination of four quinua (Chenopodium quinoa Willd.) selections. Chil. J. Agric. Res. 2009, 69, 477–485. [Google Scholar] [CrossRef]
  12. Hariadi, Y.; Marandon, K.; Tian, Y.; Jacobsen, S.E.; Shabala, S. Ionic and osmotic relations in quinoa (Chenopodium quinoa Willd.) plants grown at various salinity levels. J. Exp. Bot. 2011, 62, 185–193. [Google Scholar] [CrossRef] [PubMed]
  13. Shabala, L.; Mackay, A.; Tian, Y.; Jacobsen, S.E.; Zhou, D.; Shabala, S. Oxidative stress protection and stomatal patterning as components of salinity tolerance mechanism in quinoa (Chenopodium quinoa). Physiol. Plant. 2012, 146, 26–38. [Google Scholar] [CrossRef]
  14. Zhang, Y.M.; Qiang, Q.; Li, Z.Z.; Chen, Z.G. Comparative physiological and biochemical mechanisms of drought tolerance in three contrasting cultivars of quinoa (Chenopodium quinoa). An. Jard. Bot. Madr. 2022, 79, e123. [Google Scholar] [CrossRef]
  15. Slimani, N.; Arraouadi, S.; Hajlaoui, H.; Cid-Samamed, A.; Borgi, M.A.; Snoussi, M. Salt stress enhanced bioactivity of quinoa leaf extracts: An in vitro and in silico study of acetylcholinesterase and tyrosinase inhibition for sustainable drug development. Pharmaceuticals 2025, 18, 77. [Google Scholar] [CrossRef] [PubMed]
  16. Pan, J.; Peng, F.; Tedeschi, A.; Xue, X.; Wang, T.; Liao, J.; Zhang, W.; Huang, C. Do halophytes and glycophytes differ in their interactions with arbuscular mycorrhizal fungi under salt stress? A meta-analysis. Bot. Stud. 2020, 61, 13. [Google Scholar] [CrossRef]
  17. Burrieza, H.P.; Koyro, H.W.; Tosar, L.M.; Kobayashi, K.; Maldonado, S. High salinity induces dehydrin accumulation in Chenopodium quinoa Willd. Cv, Hualhuas Embryos. Plant Soil 2012, 354, 69–79. [Google Scholar] [CrossRef]
  18. Jarvis, D.E.; Ho, Y.S.; Lightfoot, D.J.; Schmöckel, S.M.; Li, B.; Borm, T.J.; Ohyanagi, H.; Mineta, K.; Michell, C.T.; Saber, N.; et al. The genome of Chenopodium quinoa. Nature 2017, 542, 307–312. [Google Scholar] [CrossRef]
  19. Hassan, I.; Chen, Y.; Muhammad, W.; Syed, T.R.; Muhammad, S.; Zeeshan, A. Salinity and exogenous H2O2 improve gas exchange, osmoregulation, and antioxidant metabolism in quinoa under drought stress. Physiol. Plant. 2023, 175, e14057. [Google Scholar]
  20. Bodrug-Schepers, A.; Stralis-Pavese, N.; Buerstmayr, H.; Dohm, J.C.; Himmelbauer, H. Quinoa genome assembly employing genomic variation for guided scaffolding. Theor. Appl. Genet. 2021, 134, 3577–3594. [Google Scholar] [CrossRef]
  21. Schmöckel, S.M.; Lightfoot, D.J.; Razali, R.; Tester, M.; Jarvis, D.E. Identification of putative transmembrane proteins involved in salinity tolerance in Chenopodium quinoa by integrating physiological data, RNAseq, and SNP analyses. Front. Plant Sci. 2017, 8, 1023. [Google Scholar] [CrossRef] [PubMed]
  22. Yu, C.W.; Murphy, T.M.; Lin, C.H. Hydrogen peroxide-induced chilling tolerance in mung beans mediated through ABA-independent glutathione accumulation. Funct. Plant Biol. 2003, 30, 955–963. [Google Scholar] [CrossRef]
  23. Ma, N.L.; Che, L.W.; Abd, K.N.; Mustaqim, M.; Rahmat, Z.; Ahmad, A.; Lam, S.D.; Ismail, M.R. Susceptibility and tolerance of rice crop to salt threat: Physiological and metabolic inspections. PLoS ONE 2018, 13, e0192732. [Google Scholar] [CrossRef]
  24. Hemeda, H.M.; Klein, B. Effects of naturally occurring antioxidants on peroxidase activity of vegetable extracts. J. Food Sci. 1990, 55, 184–185. [Google Scholar] [CrossRef]
  25. Gallé, Á.; Bela, K.; Hajnal, Á.; Faragó, N.; Horváth, E.; Horváth, M.; Puskás, L.; Csiszár, J. Crosstalk between the redox signalling and the detoxification: GSTs under redox control? Plant Physiol. Biochem. 2021, 169, 149–159. [Google Scholar] [CrossRef] [PubMed]
  26. Kim, D.; Langmead, B.; Salzberg, S.L. HISAT, a fast spliced aligner with low memory requirements. Nat. Methods 2015, 12, 357–360. [Google Scholar] [CrossRef]
  27. Love, M.I.; Huber, W.; Anders, S. Moderated estimation of fold change and dispersion for RNA-seq data with DESeq2. Genome Biol. 2014, 15, 550. [Google Scholar] [CrossRef]
  28. Kazachkova, Y.; Eshel, G.; Pantha, P.; Cheeseman, J.M.; Dassanayake, M.; Barak, S. Halophytism, what have we learnt from Arabidopsis thaliana relative model systems? Plant Physiol. 2018, 178, 972–988. [Google Scholar] [CrossRef]
  29. Jin, J.; Tian, F.; Yang, D.C.; Meng, Y.Q.; Kong, L.; Luo, J.; Gao, G. PlantTFDB 4.0, toward a central hub for transcription factors and regulatory interactions in plants. Nucleic Acids Res. 2017, 45, D1040–D1045. [Google Scholar] [CrossRef]
  30. Lescot, M.; Déhais, P.; Thijs, G.; Marchal, K.; Moreau, Y.; Van-de-Peer, Y.; Rouzé, P.; Rombauts, S. PlantCARE, a database of plant cis-acting regulatory elements and a portal to tools for in silico analysis of promoter sequences. Nucleic Acids Res. 2002, 30, 325–327. [Google Scholar] [CrossRef]
  31. Gupta, S.; Stamatoyannopoulos, J.A.; Bailey, T.L.; Noble, W.S. Quantifying similarity between motifs. Genome Biol. 2007, 8, R24. [Google Scholar] [CrossRef] [PubMed]
  32. Zhou, H.P.; Shi, H.F.; Yang, Y.Q.; Feng, Y.Q.; Chen, X.; Xiao, F.; Lin, H.H.; Guo, Y. Insights into plant salt stress signaling and tolerance. J. Genet. Genom. 2024, 51, 16–34. [Google Scholar] [CrossRef]
  33. Kaur, S.; Gupta, A.; Kaur, N. Effect of kinetin on starch and sucrose metabolising enzymes in salt stressed chickpea seedlings. Biol. Plant 2003, 46, 67–72. [Google Scholar] [CrossRef]
  34. Jacobsen, S.E. The worldwide potential for quinoa (Chenopodium quinoa Willd.). Food Rev. Int. 2003, 19, 167–177. [Google Scholar] [CrossRef]
  35. Shabala, S. Learning from halophytes, physiological basis and strategies to improve abiotic stress tolerance in crops. Ann. Bot. 2013, 112, 1209–1221. [Google Scholar] [CrossRef] [PubMed]
  36. Derbali, W.; Manaa, A.; Goussi, R.; Derbali, I.; Abdelly, C.; Koyro, H.W. Post-stress restorative response of two quinoa genotypes differing in their salt resistance after salinity release. Plant Physiol. Biochem. 2021, 164, 222–236. [Google Scholar] [CrossRef]
  37. Vita, F.; Ghignone, S.; Bazihizina, N.; Rasouli, F.; Sabbatini, L.; Kiani-Pouya, A.; Kiferle, C.; Shabala, S.; Balestrini, R.; Mancuso, S. Early Responses to salt stress in quinoa genotypes with opposite behavior. Physiol. Plant. 2021, 173, 1392–1420. [Google Scholar] [CrossRef] [PubMed]
  38. Cimini, S.; Locato, V.; Giacinti, V.; Molinari, M.; De, G.L. A multifactorial regulation of glutathione metabolism behind salt tolerance in rice. Antioxidants 2022, 11, 1114. [Google Scholar] [CrossRef]
  39. Vogt, T. Phenylpropanoid biosynthesis. Mol. Plant 2010, 3, 2–20. [Google Scholar] [CrossRef]
  40. Dong, N.Q.; Lin, H.X. Contribution of phenylpropanoid metabolism to plant development and plant-environment interactions. J. Integr. Plant Biol. 2021, 63, 180–209. [Google Scholar] [CrossRef]
  41. Shabala, S.; Cuin, T.A.; Pang, J.; Percey, W.; Chen, Z.; Conn, S.; Eing, C.; Wegner, L.H. Xylem ionic relations and salinity tolerance in barley. Plant J. 2010, 61, 839–853. [Google Scholar] [CrossRef]
  42. Hussain, S.; Khaliq, A.; Tanveer, M.; Matloob, A.; Hussain, H.A. Aspirin priming circumvents the salinity-induced effects on wheat emergence and seedling growth by regulating starch metabolism and antioxidant enzyme activities. Acta Physiol. Plant. 2018, 40, 68. [Google Scholar] [CrossRef]
  43. Cha-um, S.; Charoenpanich, A.; Roytrakul, S.; Kirdmanee, C. Sugar accumulation, photosynthesis and growth of two indica rice varieties in response to salt stress. Acta Physiol. Plant. 2009, 31, 477–486. [Google Scholar] [CrossRef]
  44. Yin, Y.G.; Kobayashi, Y.; Sanuki, A.; Kondo, S.; Fukuda, N.; Ezura, H.; Sugaya, S.; Matsukura, C. Salinity induces carbohydrate accumulation and sugar-regulated starch biosynthetic genes in tomato (Solanum lycopersicum L. Cv. ‘Micro-tom’) fruits in an ABA- and osmotic stress-independent manner. J. Exp. Bot. 2010, 61, 563–574. [Google Scholar] [CrossRef]
  45. Kanehisa, M.; Goto, S. KEGG, kyoto encyclopedia of genes and genomes. Nucleic Acids Res. 2000, 28, 27–30. [Google Scholar] [CrossRef] [PubMed]
  46. Ruiz, K.B.; Maldonado, J.; Biondi, S.; Silva, H. RNA-seq analysis of salt-stressed versus non salt-stressed transcriptomes of Chenopodium quinoa landrace R49. Genes 2019, 10, 1042. [Google Scholar] [CrossRef] [PubMed]
  47. Li, M.; Chen, R.; Jiang, Q.; Sun, X.; Zhang, H.; Hu, Z. GmNAC06, a nac domain transcription factor enhances salt stress tolerance in Soybean. Plant Mol. Biol. 2021, 105, 333–345. [Google Scholar] [CrossRef]
  48. Shen, L.; Zhao, E.; Liu, R.; Yang, X. Transcriptome analysis of eggplant under salt stress, AP2/ERF transcription factor SmERF1 acts as a positive regulator of salt stress. Plants 2022, 11, 2205. [Google Scholar] [CrossRef]
  49. Fu, M.; Kang, H.K.; Son, S.H.; Kim, S.K.; Nam, K.H. A subset of Arabidopsis rav transcription factors modulates drought and salt stress responses independent of ABA. Plant Cell Physiol. 2014, 55, 1892–1904. [Google Scholar] [CrossRef]
  50. Van-Zelm, E.; Zhang, Y.; Testerink, C. Salt tolerance mechanisms of plants. Annu. Rev. Plant Biol. 2020, 71, 403–433. [Google Scholar] [CrossRef]
Figure 1. Germination test of quinoa seeds under CK and NaCl treatment. Germination rate under CK and varying NaCl concentrations. (a). Significant differences in germination rate among varying NaCl concentrations (b). The half maximal inhibitory concentration of quinoa seed germination under varying NaCl concentrations. Data are presented as mean ± SD, n = 3. * p < 0.05.
Biology 14 00416 g001
Figure 2. Content of H2O2 and MDA in quinoa under CK and NaCl treatment. H2O2 content in quinoa seedlings under varying NaCl treatment times (a). MDA content in quinoa seedlings under varying NaCl treatment times (b). Significant differences in H2O2 and MDA content among varying NaCl treatment times are represented by distinct lowercase.
Biology 14 00416 g002
Figure 3. Activities of antioxidant enzymes in quinoa under CK and NaCl treatment. SOD (a), POD (b), GR (c) and GPX (d) activities in quinoa seedlings under varying NaCl treatment times. Significant differences in activities of antioxidant enzymes among varying NaCl treatment times are represented by distinct lowercase.
Biology 14 00416 g003
Figure 4. Gene expression analysis between samples. Cluster analysis (a), PCA analysis (b) and Venn analysis (c) between tgroups.
Biology 14 00416 g004
Figure 5. KEGG enrichment analysis of the DEGs at 24 h (a), 48 h (b), 48 h vs. 24 h (c), 72 h (d), 72 h vs. 24 h (e), and 72 h vs. 48 h (f).
Biology 14 00416 g005
Figure 6. K−means cluster analysis of the DEGs.
Biology 14 00416 g006
Figure 7. Obvious expression patterns of genes in the 30 k−means cluster.
Biology 14 00416 g007
Figure 8. Venn diagram and KEGG enrichment analysis of the up-regulated (a) and down-regulated (b) genes between comparisons of 72 h vs. 0 h, 48 h vs. 0 h and 24 h vs. 0 h.
Biology 14 00416 g008
Figure 9. Heatmap of expression patterns of DEGs in photosynthesis (a) and photosynthesis-antenna (b).
Biology 14 00416 g009
Figure 10. Heatmap of expression patterns of DEGs in glutathione metabolism pathway.
Biology 14 00416 g010
Figure 11. Heatmap of expression patterns of DEGs in phenylpropanoid biosynthesis (a) and starch and sucrose metabolism (b).
Biology 14 00416 g011
Figure 12. TFs in salt-induced (a) and repressed (b).
Biology 14 00416 g012
Figure 13. Cis−elements enriched in the promotors of salt-induced (a) and salt-repressed genes (b).
Biology 14 00416 g013
Table 1. Summary of the RNA-seq data generated by Illumina sequencing in this study.
SampleTotal BasesCGQ30Inputs ReadsMapped ReadsMultiple MappedUniquely Mapped
0 h-18,843,742,77444.42%94.04%59,298,84857,400,456 (96.80%)3,921,182 (6.61%)53,479,274 (90.19%)
0 h-210,255,249,58044.35%93.61%67,999,86065,990,183 (97.04%)4,623,856 (6.80%)61,366,327 (90.24%)
0 h-38,680,840,87243.98%93.74%59,573,37256,359,117 (94.60%)3,395,622 (5.70%)52,963,495 (88.90%)
24 h-17,918,433,58444.53%93.94%52,369,70850,951,859 (97.29%)4,434,371 (8.47%)46,517,488 (88.83%)
24 h-28,200,490,34744.56%93.09%54,658,44852,822,028 (96.64%)4,634,431 (8.48%)48,187,597 (88.16%)
24 h-38,226,565,95844.88%93.33%52,652,99450,838,650 (96.55%)5,104,926 (9.70%)45,733,724 (86.86%)
48 h-18,594,627,49443.67%93.84%58,684,34857,358,612 (97.74%)3,938,468 (6.71%)53,420,144 (91.03%)
48 h-28,227,452,48644.32%92.79%56,137,57454,107,863 (96.38%)6,304,612 (11.23%)47,803,251 (85.15%)
48 h-37,261,377,84144.41%92.95%49,692,45848,213,248 (97.02%)4,596,286 (9.25%)43,616,962 (87.77%)
72 h-17,089,095,61644.31%92.88%48,094,65646,794,677 (97.30%)5,274,057 (10.97%)41,520,620 (86.33%)
72 h-27,299,664,28044.05%92.27%50,057,91248,374,621 (96.64%)6,299,653 (12.58%)42,074,968 (84.05%)
72 h-36,901,494,78244.80%93.22%47,039,72845,724,732 (97.20%)5,697,288 (12.11%)40,027,444 (85.09%)
Table 2. The expressed genes with an average TPM > 1 in each group.
GroupNumber of Expressed Genes (Average TPM > 1)
0 h24,350
24 h24,251
48 h24,075
72 h24,292
Table 3. The DEGs screened by comparison between groups.
Up-RegulatedDown-Regulated
24 h vs. 0 h435643
48 h vs. 0 h13501795
48 h vs. 24 h524588
72 h vs. 0 h15531559
72 h vs. 24 h348503
72 h vs. 48 h2254
Table 4. KEGG enrichment analysis of the genes in different expression pattern clusters.
KEGG PathwayIDp Value
Cluster 3Phenylpropanoid biosynthesisko009404.58 × 10−13
Zeatin biosynthesisko009082.75 × 10−23
Glutathione metabolismko004800.002475429
Cluster 6Phenylpropanoid biosynthesisko009400.002516425
Cluster 7Photosynthesis-antenna proteinsko001967.56 × 10−7
Cluster 9Phenylpropanoid biosynthesisko009400.001351993
Cysteine and methionine metabolismko005200.001256953
Cluster 12Phenylpropanoid biosynthesisko009400.000255861
Cluster 15Phenylpropanoid biosynthesisko009403.21 × 10−8
Ubiquitin mediated proteolysisko041200.000542454
RNA polymeraseko030203.54 × 10−12
Protein processing in endoplasmic reticulumko041411.25 × 10−4
Table 5. Overrepresented cis-elements in the promotors of TFs.
Discovered MotifMatched Known Motif in ArabidopsisE-Value
Up-regulatedYYHNHYBYYYYYYYHYYYHHBBRBPC_tnt.BPC5_colamp_a_m1 (BPC5)1.54 × 10⁻³
AAAAAAAAAAAAAAAABI3VP1_tnt.VRN1_col_a_m1 (VRN1)2.71 × 10⁻¹³
TTTTWTTTTTTTTTTABI3VP1_tnt.VRN1_col_a_m1 (VRN1)5.17 × 10⁻⁷
NVNNNDNDDNNDDRBDNDDVMYB_tnt.MYB67_col_a_m1 (MYB67)9.79 × 10⁻³
VRRRDDDADDVNVWDHRRRABBRBPC_tnt.BPC5_colamp_a_m1 (BPC5)1.24 × 10⁻²
YYHNHYBYYYYYYYHYYYHHBBRBPC_tnt.BPC5_colamp_a_m1 (BPC5)1.54 × 10⁻³
Down-regulatedNNRNRNNNDKHNNNNDNDNNMYB_tnt.MYB60_col_m1 (MYB60)2.04 × 100
BRWRRRRDDDDDDDDRRNNDMYB_tnt.MYB60_col_m1 (MYB60)3.07 × 10⁻⁴
NDDWNDKWDWWHWWWWHTKDE2FDP_tnt.DEL2_col_a_m1 (DEL2)5.79 × 10⁻¹
HYHYNHHBHYHHYYBHNNNHTCP_tnt.TCP1_col_a_m1 (TCP1)3.74 × 10⁻¹
HKGADYBVADYTKADYYKAWLIM_tnt.WLIM2A_col_a_m1 (WLIM2A)9.65 × 100
Disclaimer/Publisher’s Note: The statements, opinions and data contained in all publications are solely those of the individual author(s) and contributor(s) and not of MDPI and/or the editor(s). MDPI and/or the editor(s) disclaim responsibility for any injury to people or property resulting from any ideas, methods, instructions or products referred to in the content.

