Article

Predicting the Potential Suitable Distribution of Albizia odoratissima (L. f.) Benth. Under Climate Change Based on the Biomod2 Model

1
Ministry of Education Key Laboratory for Ecology of Tropical Islands, Key Laboratory of Tropical Animal and Plant Ecology of Hainan Province, College of Life Sciences, Hainan Normal University, Haikou 571158, China
2
Co-Innovation Center for Sustainable Forestry in Southern China, College of Forestry, Nanjing Forestry University, Nanjing 210037, China
*
Author to whom correspondence should be addressed.
Biology 2025, 14(2), 180; https://doi.org/10.3390/biology14020180
Submission received: 18 December 2024 / Revised: 27 January 2025 / Accepted: 6 February 2025 / Published: 10 February 2025
(This article belongs to the Section Ecology)

Simple Summary

Albizia odoratissima holds significant economic and ecological value, with considerable potential for development. This study used the Biomod2 model to evaluate the impact of climate change on the distribution of A. odoratissima in China. The results reveal that the primary factors influencing the distribution of A. odoratissima are the Mean Temperature of Coldest Quarter, Temperature Seasonality, and Mean Temperature of Wettest Quarter. Currently, the area of suitable habitat for A. odoratissima in China is 136.98 × 10⁴ km2. With climate change, the distribution of A. odoratissima will gradually expand, and the distribution center will move westward. These findings are crucial for the protection and utilization of A. odoratissima resources.

Abstract

Albizia odoratissima (L. f.) Benth. is a highly valuable tree species, both economically and ecologically. It has great potential for development. To conserve, develop, and use its genetic resources sustainably, it is crucial to evaluate the potential habitat of A. odoratissima and identify the key environmental factors that affect its distribution. In this study, the Biomod2 model was used to predict the potential distribution of A. odoratissima in China, using 65 occurrence points and 11 environmental variables for both current and future climate scenarios. The distribution of A. odoratissima is mainly influenced by three temperature-related factors: bio4, bio8, and bio11. Our prediction shows that the suitable habitats for A. odoratissima are mostly located in several southern provinces of China, totaling 136.98 × 10⁴ km2. Under different climate scenarios, the suitable habitat area is expected to shift northward in the future, although the highly suitable areas will remain relatively stable. These findings have important implications for the conservation, development, and sustainable utilization of A. odoratissima resources.

1. Introduction

Climate plays a crucial role in shaping the distribution ranges of plant species, and climate change will cause rapid shifts in the distribution of plants [1,2,3]. Since the Industrial Revolution, global temperatures have been steadily rising. Compared to 1880, the current temperature of the Earth has risen by one degree Celsius [4]. Studies indicate that intensified climate change drives habitat loss and fragmentation, threatening species survival and potentially leading to the extinction or decline of endangered species [5,6].
Species distribution models (SDMs) are widely used tools for predicting the potential response of species to climate change [7]. These models can combine environmental variables and known distribution points to assess the ecological requirements of species and project the calculated results in a specific spatiotemporal context to predict the potential distribution status of species [8]. Numerous models, such as BioClim [9], Genetic Algorithm for Rule-set Prediction (GARP) [10], Generalized Linear Models (GLMs), Random Forest (RF), and maximum entropy models (MaxEnt) [11], have been developed to predict species distribution areas [12,13]. Differences in underlying algorithms give each model distinct advantages and limitations, resulting in variable outcomes when applied to the same species. To address this, ensemble models have been developed to improve prediction accuracy by combining multiple models. Biomod2, an R-based platform, integrates several commonly used species distribution models, enhancing predictive precision [14]. To date, the Biomod2 model has been successfully applied to predict the potential distribution areas of various plants, such as Eucommia ulmoides, Luculia pinceana, and Salvia hydrangea [15,16,17].
Albizia odoratissima (L. f.) Benth. is an evergreen tall tree species belonging to the Leguminosae family, native to southern China, as well as India, Bangladesh, and Sri Lanka [18]. A. odoratissima is characterized by a straight trunk, rapid growth, and high economic value. It has excellent wood properties, significant differences between the heartwood and sapwood, is not easy to crack or deform, and is insect- and corrosion-resistant. These attributes make it a valuable material for the production of musical instruments, furniture, and other high-demand goods [18]. Additionally, extracts from the flowers, leaves, and bark of A. odoratissima exhibit potent antibacterial and antioxidant properties, contributing to its significant medicinal value [19,20,21]. Furthermore, A. odoratissima belongs to the Caesalpinioideae subfamily of the legume family (The Legume Phylogeny Working Group, LPWG, 2017) [22], which has strong nitrogen fixation ability and is highly resistant to harsh environments, making it an excellent choice for afforestation and soil and water conservation and has important ecological value. Therefore, understanding the distribution patterns and trends of A. odoratissima habitats under varying climate scenarios is of great significance for the future introduction, domestication, and management of the species, as well as for the development of effective germplasm resource management strategies.
A. odoratissima holds significant development potential. While previous studies primarily focused on its genetic diversity [23], drought resistance mechanism [24] and medicinal value [21], research on its potential suitable habitats remains limited. In this paper, the suitable habitats of A. odoratissima were simulated, and the changes in potential suitable areas of A. odoratissima under various shared socioeconomic pathways (SSPs) in the future were predicted. The results will provide a theoretical foundation and key insights for the conservation, scientific introduction, and cultivation of A. odoratissima.

2. Materials and Methods

2.1. Data Collection

A total of 324 distribution data for A. odoratissima were obtained from published literature and the Global Biodiversity Information Facility (https://www.gbif.org/ (accessed on 20 September 2024)). To mitigate the risk of model over fitting due to over-density of local distribution points, the software ENMTools 1.1.0 [25] was employed to remove duplicate records, retaining only one occurrence point per 20 km × 20 km grid cell. Ultimately, 65 unique distribution records of A. odoratissima in China were selected for further analysis (Table S1).

2.2. Environmental Variables

In this study, 19 bioclimatic variables with 2.5 min spatial resolution for the historical (1970–2000s) were downloaded from the WorldClim database (http://worldclim.org (accessed on 20 September 2024)). Slope, aspect, and altitude data were extracted from digital elevation model (DEM) data with an accuracy of 500 m, obtained from the Geospatial Data Cloud (http://www.gscloud.cn/ (accessed on 20 September 2024)). To assess the impact of future climate change on species distribution, BCC-CSM2-MR from the CMIP6 were applied, which included four SSPs (SSP126, SSP245, SSP370, and SSP585). Compared with other global circulation models, BCC-CSM2-MR is more suitable for simulating the suitable habitats of species in China [26,27]. All environmental variables in raster format were aligned with the geographic space using raster (https://github.com/rspatial/raster (accessed on 25 September 2024)).
ENMTools was used to conduct correlation analysis on 21 environmental variables. If the correlation coefficient between two variables was high (|r| ≥ 0.8), the variable with the higher contribution to the MaxEnt model, based on trial runs, was retained. Finally, 11 environmental variables were retained for further analysis (Table S2). The contribution of each variable was assessed using logistic regression within the MaxEnt model. The MaxEnt model were optimized by ENMeval [28] with the regularization multiplier (RM) set within the range of 0.5 to 4, with an increase of 0.5 per run, and five different feature combinations (FCs) were tested, namely L, LQ, LQH, LQHP, and LQHPT. Then, the above 40 parameters were combined into ENMeval package 2.04 for verification, and the parameter combination with the lowest delta AICc will be used for model prediction [29].

2.3. Model Calibration

In the present study, Biomod2 v4.2-5-2 was used to conduct SDM for A. odoratissima [30]. Twelve different algorithms within Biomod2 were employed for model predictions, including artificial neural networks (ANN), flexible discriminant analysis (FDA), classification tree analysis (CTA), generalized additive models (GAMs), generalized boosting models (GBM), generalized linear models (GLM), maximum entropy (MAXENT), maximum entropy new implementation (MAXNET), multivariate adaptive regression splines (MARS), eXtreme gradient boosting (XGBOOST), a random forest (RF), and a species range envelope (SRE). A total of 1000 pseudo-absence points were randomly generated using the random function of the dismo [31]. For each modeling, 75% of the distribution data were randomly selected as the training dataset and remaining used for testing, repeating 10 times. Model performance was evaluated using two metrics: the receiver operating characteristic (ROC) and the True Skill Statistic (TSS) to evaluate model performance. After the evaluation of single models, Biomod2 was used to combine those with TSS values surpassing 0.75 into a final ensemble model.
ArcGIS [32] was used to process the prediction results. The natural breakpoint method was applied to categorize the results into four suitability classes for A. odoratissima: unsuitable, low-suitable, medium-suitable, and high-suitable, with the following thresholds: 0–134, 134–448, 448–791, and 791–1000, respectively. To examine the changes in suitable habitat, the SDM toolbox was employed to analyze the geometric centers of suitable areas. By monitoring the shifts in the position of the geometric center, the trend of changes in the suitable habitat of A. odoratissima under different climatic conditions were investigated.

3. Results

3.1. Model Validation

After 10 repeated runs, nine models showed high performance, with TSS values greater than 0.75 and AUC values greater than 0.9 (Figure 1). Among these, the EMca version of the ensemble model exhibited the highest accuracy, with a TSS value of 0.897 and an ROC value of 0.979 (Table 1). Given its outstanding performance, the EMca was selected for further analysis.

3.2. Selection of Environmental Variables

Based on the results of the MaxEnt model trial run, a total of 11 environmental variables were selected to predict the distribution habitats of A. odoratissima. The prediction results from the nine individual models indicate that Mean Temperature of Coldest Quarter (bio11) has the greatest impact on the distribution of A. odoratissima, followed by Temperature Seasonality (bio4) and Mean Temperature of Wettest Quarter (bio8) (Figure 2). According to the response curve, A. odoratissima exhibits the highest adaptability when the bio11 exceeds 6.28 °C, the bio4 (standard deviation × 100) is below 788.82, and the bio8 is above 18.66 °C (Figure 3). This indicates that A. odoratissima is a typical tropical plant, suitable for tropical and south subtropical zone with high temperatures and minimal annual temperature fluctuations.

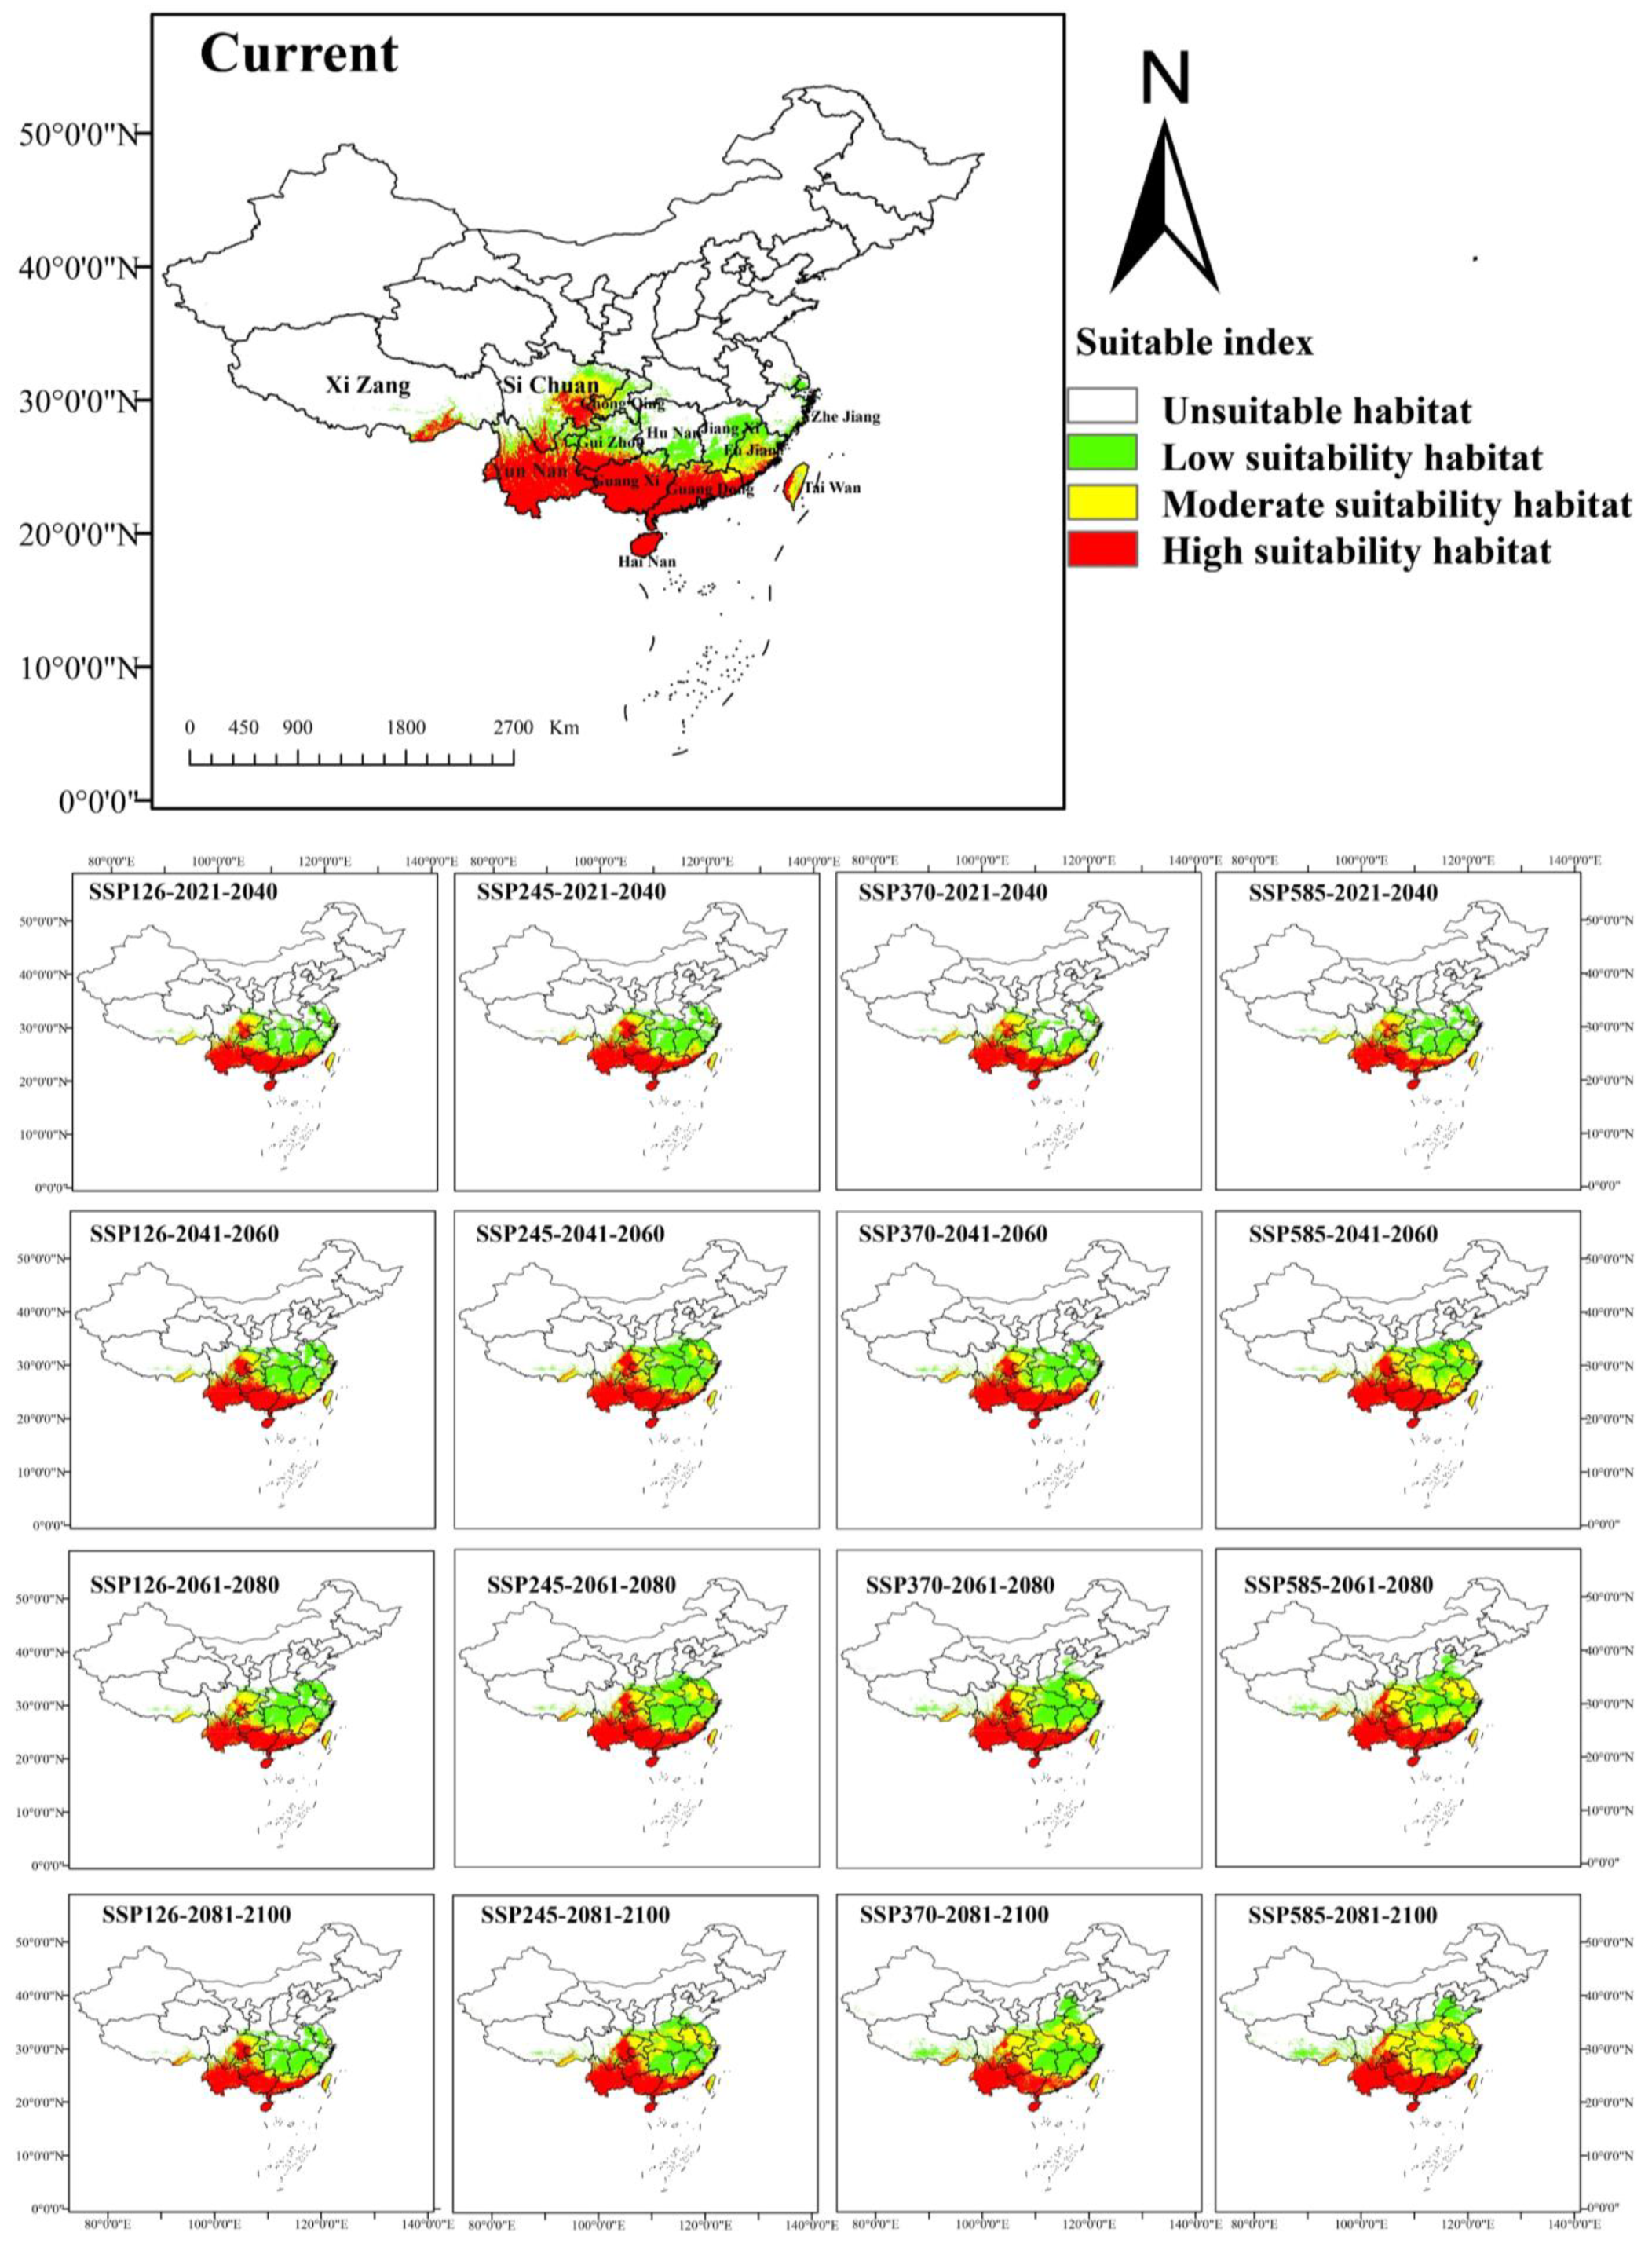
3.3. Current Potential Geographical Distribution in China

The potential distribution of A. odoratissima in China under both current and future climatic scenarios was predicted using ensemble model community averaging (EMca) (Figure 4). Under the current scenario, the area of highly suitable habitat for A. odoratissima covers 75.58 × 10⁴ km2, while the moderately suitable habitat area is 28.40 × 10⁴ km2, and the low suitable habitat extends over 33.00 × 10⁴ km2, totaling 136.98 × 10⁴ km2 of suitable habitat. The highly suitable habitats are mainly located in southern China, including the provinces of Hainan, Guangdong, Guangxi, and Yunnan, as well as sporadic areas in Taiwan, Guizhou, Sichuan, Fujian, and Xinjiang. The predicted distribution largely aligns with the actual geographic distribution data for A. odoratissima.

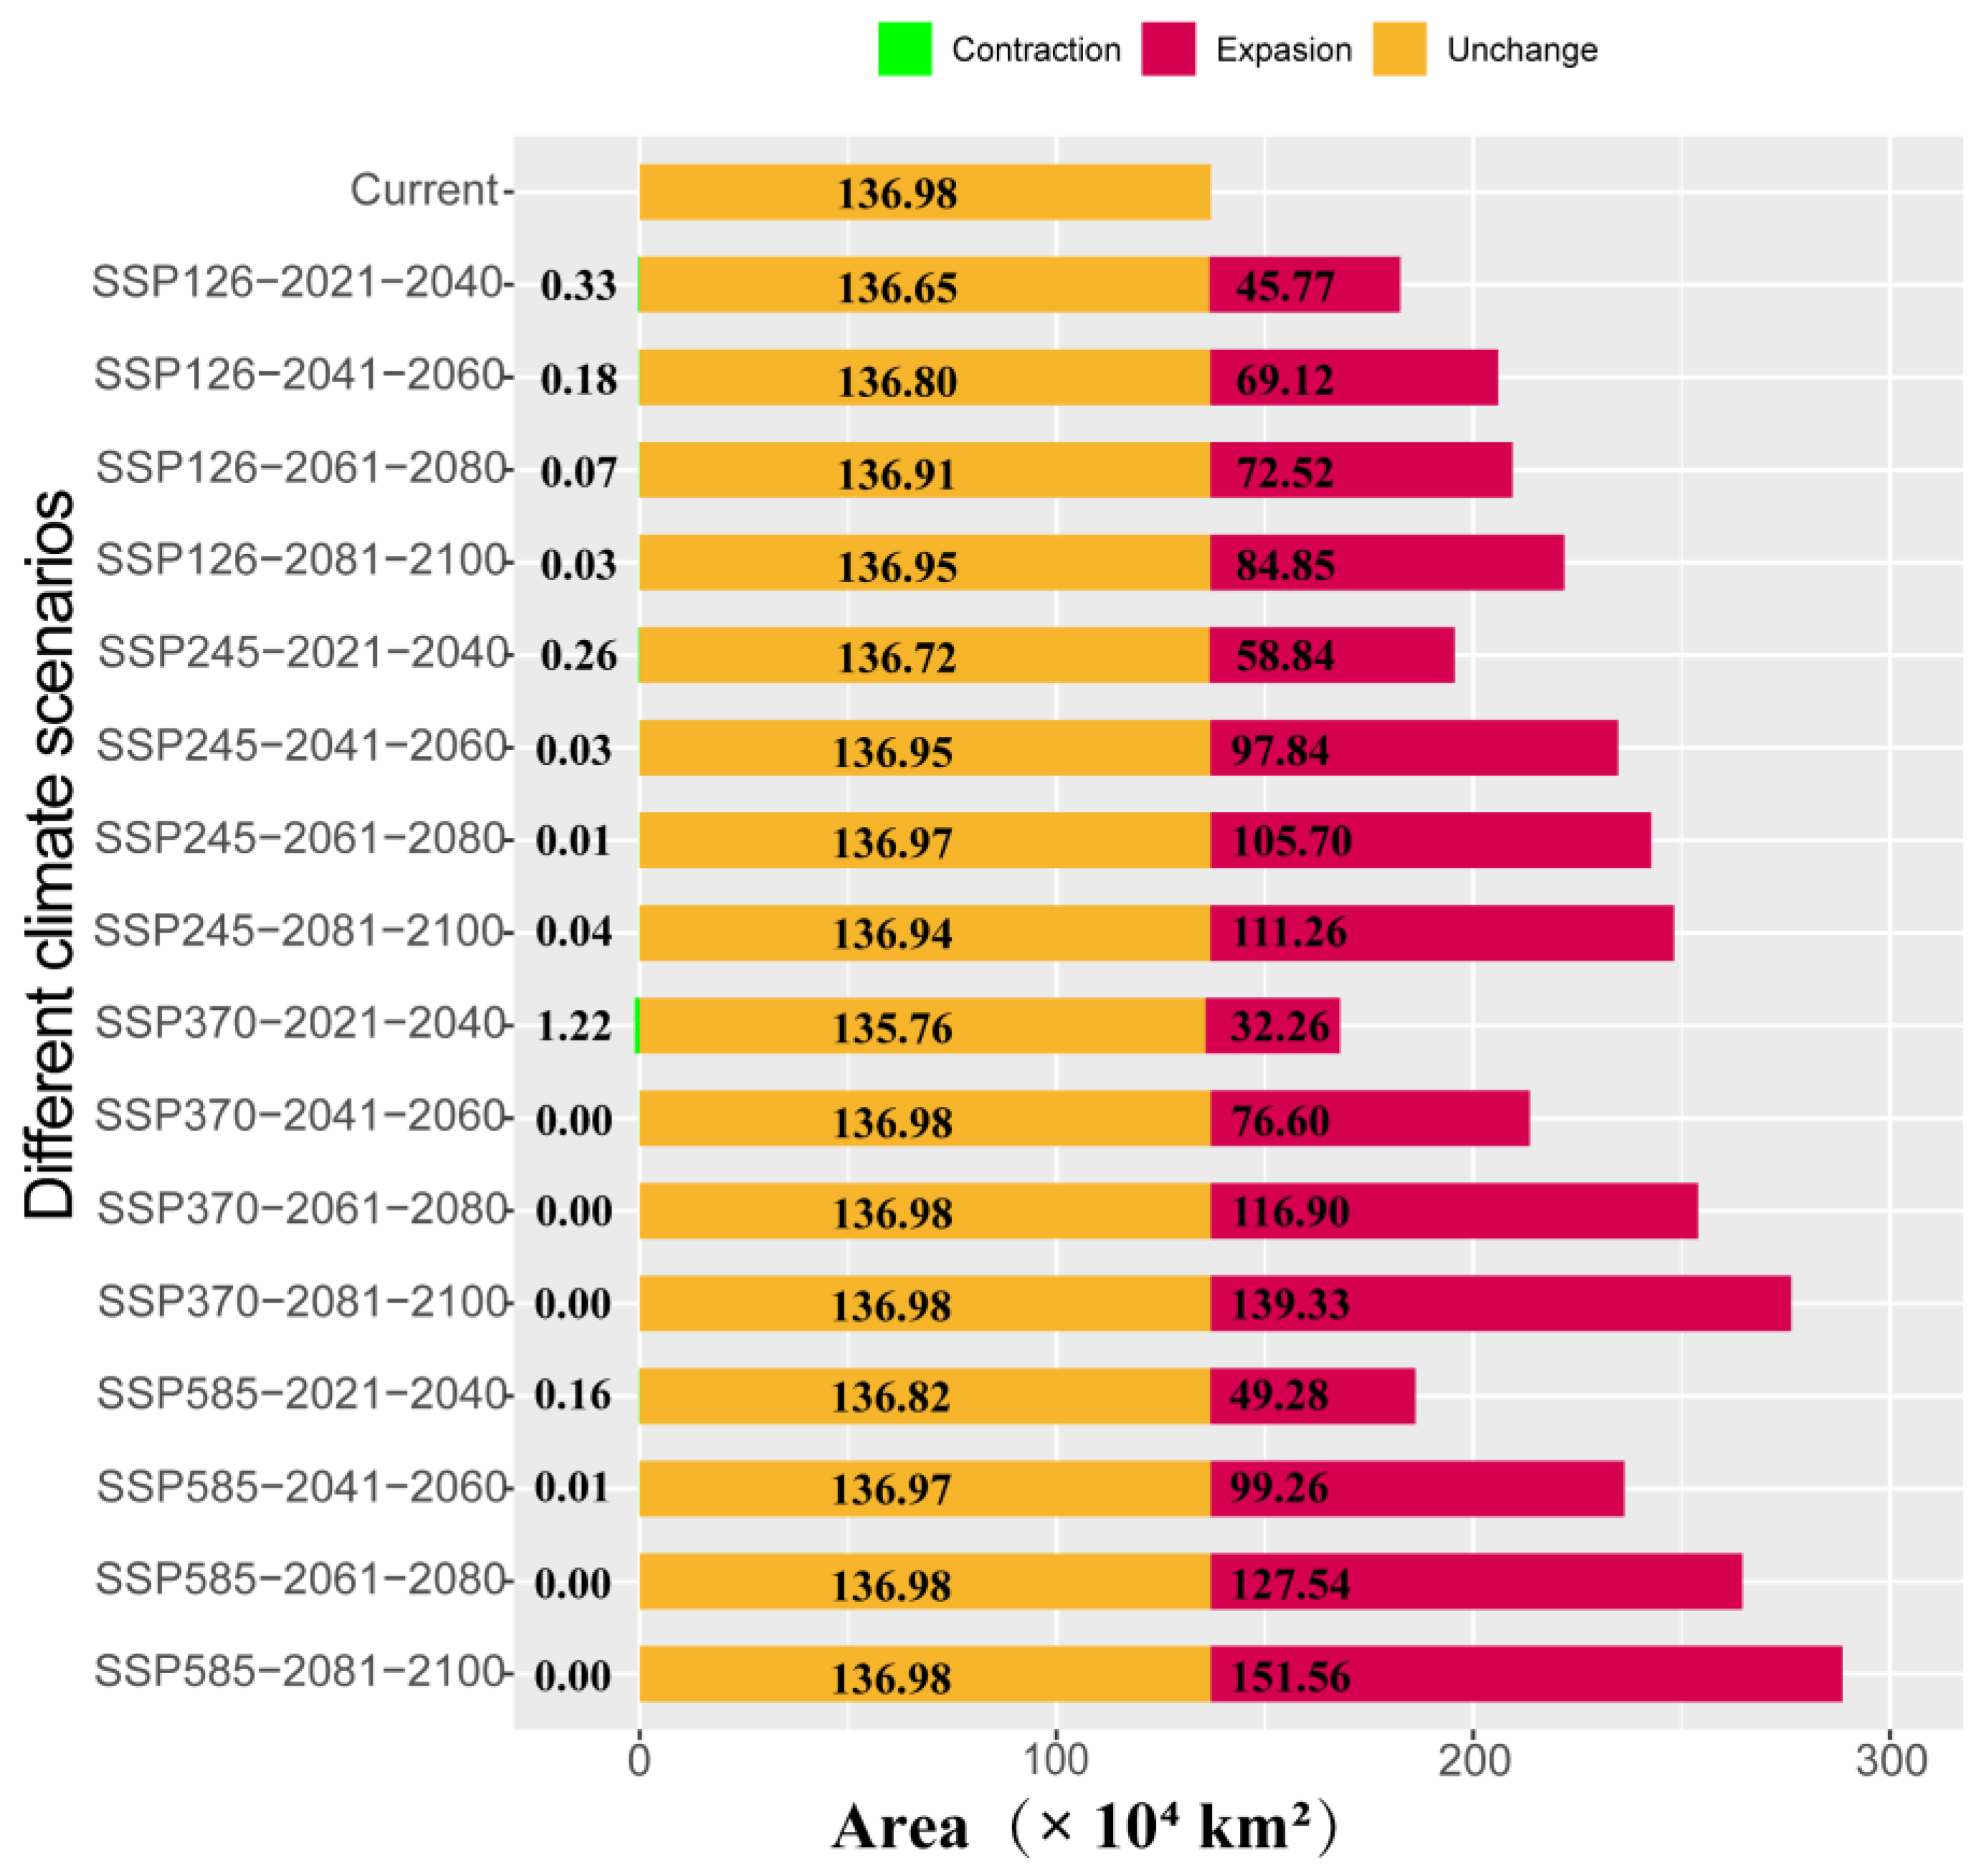
3.4. Distribution Changes Under Future Climate Conditions

Under future climate scenarios, the potential distribution area of A. odoratissima in China is expected to gradually expand (Figure 4 and Figure 5). Under four different scenarios, there are significant differences in the size of area expansion. The SSP126 scenario predicts the smallest expansion, with the suitable habitat area increasing to 221.80 × 10⁴ km2 between 2081 and 2100, representing a 1.6-fold increase. In contrast, the SSP585 scenario forecasts the largest expansion, with the suitable habitat area growing to 288.54 × 10⁴ km2 during the same period, more than doubling in size. The areas of expansion are primarily concentrated in the provinces of Jiangsu, Anhui, Hunan, and Hubei. Notably, there was no significant reduction in habitat under different scenarios (Figure 5).
The geometric center of potential habitats was used to represent the overall spatial location of potential suitable habitats for A. odoratissima. Currently, the geometric center of its potential suitable habitats is located in Guizhou Province (106.517° E, 27.706° N). Under the SSP126 climate scenario, during the 2081–2100 period, the center will shift northward to the northern part of Guizhou Province (106.876° E, 28.324° N), at a distance of 77.23 km from the current distribution centroid. Under the SPS585 climate scenario, the centroid will move northward to Chongqing (105.774° E, 29.193° N) during 2061–2080, at a distance of 180.59 km from its current location (Figure 6).

4. Discussion

4.1. Evaluation of Modeling Performance

The choice of model is crucial to the accuracy of prediction results. Differences in algorithms, spatial distribution, and sample size among various models can significantly impact both accuracy and predictive performance [33]. Currently, there is no model that can perform well in all prediction tasks [34]. The ensemble modeling approach, which combines the outputs of multiple individual models, provides an effective solution to this challenge. In recent years, ensemble models have gained popularity and are widely used for species distribution predictions, such as for Centaurea solistialis [35], moso bamboo [36], and Fritillaria [37]. In this study, the TSS value of the EMca ensemble model was 0.897, and the ROC value was 0.979, indicating strong performance and high predictive accuracy.

4.2. Critical Environmental Factors Influencing A. odoratissima Distribution

Climate factors exert a significant influence on species distribution patterns, with temperature and precipitation being key determinants [38,39]. The results of this study indicate that the primary climatic factors affecting the distribution of A. odoratissima are bio4, bio8, and bio11, all of which are temperature related factors (Table S2). Specifically, the higher the temperature and the smaller the seasonal temperature variation, the greater the adaptability of A. odoratissima, which aligns with the climate characteristics of its current distribution areas. It is worth noting that although the high suitability habitats are mainly located in tropical regions with a tropical monsoon climate, high temperatures and humidity, and abundant summer precipitation, the influence of precipitation on the species’ adaptability is relatively low. In fact, as an excellent pioneer species, A. odoratissima is drought-resistant and barren [24], with strong nitrogen fixation ability, and has an improving effect on the soil ecological environment. Consequently, precipitation has a relatively minor impact on the adaptability of A. odoratissima.

4.3. Impact of Climatic Changes on Suitable Habitats for A. odoratissima

In this study, most of the highly suitable habitats for A. odoratissima were located south of latitude 25′ N, encompassing the provinces of Hainan, Guangdong, Guangxi, and Yunnan, as well as the southern regions of Fujian, Guizhou, Xinjiang, and Taiwan. Additionally, a significant suitable habitat was identified near latitude 30′ N, primarily within the Sichuan Basin. The Sichuan Basin, surrounded by mountains, experiences milder winter temperatures compared to other regions at the same latitude. This is due to the Daba Mountains to the north, which block the southward movement of cold air, resulting in a more temperate climate [40]. These climatic conditions create a more favorable environment for the growth of A. odoratissima.
Global climate change has driven the northward migration of habitats for various species [39,41,42]. Similarly, climate change has caused the centroid of A. odoratissima’s distribution to shift northward. The extent of this northward expansion varies under different climatic scenarios. By 2100, under the SSP585 scenario, the distribution area of A. odoratissima will reach its maximum, expanding to 288.55 × 10⁴ km2, more than doubling the current area. However, the expansion primarily occurs in low and moderately suitable habitats, while the range of highly suitable habitats remains largely unchanged. In addition, with climate change, the predicted distribution area of A. odoratissima shows almost no contraction under different SSP scenarios, suggesting that its potential distribution remains relatively stable despite ongoing climate change.

5. Conclusions

In this study, ensemble models were employed to investigate the potential geographic distribution of A. odoratissima and its changes under different climate change scenarios. The analysis identified that the key factors limiting the distribution of A. odoratissima are bio11, bio4, and bio8. Under the current climate, the potential distribution area of A. odoratissima is concentrated in southern China, with a total area of 136.98 × 10⁴ km2. Highly suitable habitats are mainly located in the provinces of Hainan, Guangdong, Guangxi, Yunnan, as well as the southern regions of Fujian, Guizhou, Xinjiang, and Taiwan, along with some areas in Sichuan province. Under the future climate scenarios, the distribution range of A. odoratissima will expand northward, but the core distribution area will still remain relatively unchanged. The research results can provide reference for the investigation, collection, and protection of natural resources of A. odoratissima.

Supplementary Materials

The following supporting information can be downloaded at: https://www.mdpi.com/article/10.3390/biology14020180/s1. Table S1: The occurrence data for modeling; Table S2: Information on the environmental variables used in this study.

Author Contributions

Conceptualization, Z.L. and Y.G. (Yali Guan); methodology, Z.L. and Q.J.; investigation, Y.Y. and Y.G. (Yunfei Gao); writing—original draft preparation, Z.L. and Q.J.; writing—review and editing, Y.G. (Yali Guan) and M.X.; project administration, Y.G. (Yali Guan). All authors have read and agreed to the published version of the manuscript.

Funding

This research was supported by The Key Research and Development Program of Hainan Province (ZDYF2022XDNY178).

Institutional Review Board Statement

Not applicable.

Informed Consent Statement

Not applicable.

Data Availability Statement

The datasets analyzed during the current study are available from the corresponding author upon reasonable request.

Conflicts of Interest

The authors declare no conflicts of interest.

References

  1. Kelly, A.E.; Goulden, M.L. Rapid shifts in plant distribution with recent climate change. Proc. Natl. Acad. Sci. USA 2008, 105, 11823–11826. [Google Scholar] [CrossRef] [PubMed]
  2. Kosanic, A.; Anderson, K.; Harrison, S.; Turkington, T.; Bennie, J. Changes in the geographical distribution of plant species and climatic variables on the West Cornwall peninsula (South West UK). PLoS ONE 2018, 13, e0191021. [Google Scholar] [CrossRef] [PubMed]
  3. Varol, T.; Canturk, U.; Cetin, M.; Ozel, H.B.; Sevik, H. Impacts of climate change scenarios on European ash tree (Fraxinus excelsior L.) in Turkey. For. Ecol. Manag. 2021, 491, 119199. [Google Scholar] [CrossRef]
  4. Demiral, E.E.; Sağlam, Ü. Sustainable production assessment of the 50 US states. J. Clean. Prod. 2023, 419, 138086. [Google Scholar] [CrossRef]
  5. Huang, Z.; Xie, L.; Wang, H.; Zhong, J.; Li, Y.; Liu, J.; Ou, Z.; Liang, X.; Li, Y.; Huang, H.; et al. Geographic distribution and impacts of climate change on the suitable habitats of Zingiber species in China. Ind. Crops Prod. 2019, 138, 111429. [Google Scholar] [CrossRef]
  6. Leimu, R.; Vergeer, P.; Angeloni, F.; Ouborg, N.J. Habitat fragmentation, climate change, and inbreeding in plants. Ann. N. Y. Acad. Sci. 2010, 1195, 84–98. [Google Scholar] [CrossRef] [PubMed]
  7. Brown, J. SDMtoolbox: A python-based GIS toolkit for landscape genetic, biogeographic and species distribution model analyses. Methods Ecol. Evol. 2014, 5, 694–700. [Google Scholar] [CrossRef]
  8. Franklin, J. Species distribution models in conservation biogeography: Developments and challenges. Divers. Distrib. 2013, 19, 1217–1223. [Google Scholar] [CrossRef]
  9. Booth, T.H.; Nix, H.A.; Busby, J.R.; Hutchinson, M.F. Bioclim: The first species distribution modelling package, its early applications and relevance to most current MaxEnt studies. Divers. Distrib. 2014, 20, 1–9. [Google Scholar] [CrossRef]
  10. Stockman, A.; Beamer, D.; Bond, J. An evaluation of a GARP model as an approach to predicting the spatial distribution of non-vagile invertebrate species. Divers. Distrib. 2006, 12, 81–89. [Google Scholar] [CrossRef]
  11. Phillips, S.J.; Anderson, R.P.; Schapire, R.E. Maximum entropy modeling of species geographic distributions. Ecol. Model. 2006, 190, 231–259. [Google Scholar] [CrossRef]
  12. Aguirre-Gutiérrez, J.; Carvalheiro, L.G.; Polce, C.; van Loon, E.E.; Raes, N.; Reemer, M.; Biesmeijer, J.C. Fit-for-purpose: Species distribution model performance depends on evaluation criteria—Dutch Hoverflies as a case study. PLoS ONE 2013, 8, e63708. [Google Scholar] [CrossRef]
  13. Arenas-Castro, S.; Regos, A.; Martins, I.; Honrado, J.; Alonso, J. Effects of input data sources on species distribution model predictions across species with different distributional ranges. J. Biogeogr. 2022, 49, 1299–1312. [Google Scholar] [CrossRef]
  14. Hao, T.; Elith, J.; Guillera-Arroita, G.; Lahoz-Monfort, J.J. A review of evidence about use and performance of species distribution modelling ensembles like BIOMOD. Divers. Distrib. 2019, 25, 839–852. [Google Scholar] [CrossRef]
  15. Cao, G.; Yuan, X.; Shu, Q.; Gao, Y.; Wu, T.; Xiao, C.; Xu, J.; Zhang, Y. Prediction of the potentially suitable areas of Eucommia ulmoides Oliver in China under climate change based on optimized Biomod2 and MaxEnt models. Front. Plant Sci. 2024, 15, 1359271. [Google Scholar] [CrossRef] [PubMed]
  16. Gao, C.; Guo, S.; Ma, C.; Yang, J.; Kang, X.; Li, R. Impact of Climate Change on the Potential Geographical Distribution Patterns of Luculia pinceana Hook. f. since the Last Glacial Maximum. Forests 2024, 15, 253. [Google Scholar] [CrossRef]
  17. Ghehsareh Ardestani, E.; Heidari Ghahfarrokhi, Z. Ensembpecies distribution modeling of Salvia hydrangea under future climate change scenarios in Central Zagros Mountains, Iran. Glob. Ecol. Conserv. 2021, 26, e01488. [Google Scholar] [CrossRef]
  18. Sowmya Dhanalakshmi, C.; Kaliappan, S.; Mohammed Ali, H.; Sekar, S.; Depoures, M.V.; Patil, P.P.; Subbaiah, B.S.; Socrates, S.; Birhanu, H.A. Flash Pyrolysis Experiment on Albizia odoratissima Biomass under Different Operating Conditions: A Comparative Study on Bio-Oil, Biochar, and Noncondensable Gas Products. J. Chem. 2022, 2022, 9084029. [Google Scholar] [CrossRef]
  19. Banothu, V.; Neelagiri, C.; Adepally, U.; Lingam, J.; Bommareddy, K. Phytochemical screening and evaluation of in vitro antioxidant and antimicrobial activities of the indigenous medicinal plant Albizia odoratissima. Pharm. Biol. 2017, 55, 1155–1161. [Google Scholar] [CrossRef] [PubMed]
  20. Koteswara Rao, Y.; Vijaya Bhaskar Reddy, M.; Venkata Rao, C.; Gunasekar, D.; Blond, A.; Caux, C.; Bodo, B. Two new 5-deoxyflavones from Albizia odoratissima. Chem. Pharm. Bull. 2002, 50, 1271–1272. [Google Scholar] [CrossRef]
  21. Kumar, D.; Kumar, S.; Kohli, S.; Arya, R.; Gupta, J. Antidiabetic activity of methanolic bark extract of Albizia odoratissima Benth. In alloxan induced diabetic albino mice. Asian Pac. J. Trop. Med. 2011, 4, 900–903. [Google Scholar] [CrossRef]
  22. Azani, N.; Babineau, M.; Bailey, C.D.; Banks, H.; Barbosa, A.; Barbosa Pinto, R.; Boatwright, J.; Borges, L.; Brown, G.; Bruneau, A.; et al. A new subfamily classification of the Leguminosae based on a taxonomically comprehensive phylogeny. Taxon 2017, 66, 44–77. [Google Scholar] [CrossRef]
  23. An, Q.; Feng, Y.; Yang, Z.; Hu, L.; Wu, D.; Gong, G. Differences in Albizia odoratissima genetic diversity between Hainan Island and mainland populations in China. Front. Plant Sci. 2024, 15, 1369409. [Google Scholar] [CrossRef] [PubMed]
  24. Wei, S.; Gao, F.; Wang, Z.; Yin, G.; Wen, S.; Ou, H.; Liu, Z. Transcriptome and Metabolome Analyses Reveal the Molecular Mechanisms of Albizia odoratissima’s Response to Drought Stress. Plants 2024, 13, 2732. [Google Scholar] [CrossRef] [PubMed]
  25. Warren, D.; Glor, R.; Turelli, M. ENMTools: A toolbox for comparative studies of environmental niche models. Ecography 2010, 33, 607–611. [Google Scholar] [CrossRef]
  26. Shi, X.; Yin, Q.; Sang, Z.; Zhu, Z.; Jia, Z.; Ma, L. Prediction of potentially suitable areas for the introduction of Magnolia wufengensis under climate change. Ecol. Indic. 2021, 127, 107762. [Google Scholar] [CrossRef]
  27. Yu, F.; Wang, T.; Groen, T.A.; Skidmore, A.K.; Yang, X.; Ma, K.; Wu, Z. Climate and land use changes will degrade the distribution of Rhododendrons in China. Sci. Total Environ. 2019, 659, 515–528. [Google Scholar] [CrossRef]
  28. Kass, J.M.; Muscarella, R.; Galante, P.J.; Bohl, C.L.; Pinilla-Buitrago, G.E.; Boria, R.A.; Soley-Guardia, M.; Anderson, R.P. ENMeval 2.0: Redesigned for customizable and reproducible modeling of species’ niches and distributions. Methods Ecol. Evol. 2021, 12, 1602–1608. [Google Scholar] [CrossRef]
  29. Muscarella, R.; Galante, P.J.; Soley-Guardia, M.; Boria, R.A.; Kass, J.M.; Uriarte, M.; Anderson, R.P. ENMeval: An R package for conducting spatially independent evaluations and estimating optimal model complexity for MaxEnt ecological niche models. Methods Ecol. Evol. 2014, 5, 1198–1205. [Google Scholar] [CrossRef]
  30. Wilfried, T.; Damien, G.; Maya, G.; Robin, E.; Frank, B.; Bruno, L.; Remi, P.; Helene, B. biomod2: Ensemble Platform for Species Distribution Modeling. 2024. Available online: https://biomodhub.github.io/biomod2/ (accessed on 30 September 2024).
  31. Hijmans, R.J.; Phillips, S.; Leathwick, J.; Elith, J. dismo: Species Distribution Modeling. R package version 1.3–14. 2023. Available online: https://CRAN.R-project.org/package=dismo (accessed on 30 September 2024).
  32. ESRI. ArcGIS Desktop, version 10.7; Environmental Systems Research Institute: Redlands, CA, USA, 2019. [Google Scholar]
  33. Kaky, E.; Nolan, V.; Alatawi, A.; Gilbert, F. A comparison between Ensemble and MaxEnt species distribution modelling approaches for conservation: A case study with Egyptian medicinal plants. Ecol. Inform. 2020, 60, 101150. [Google Scholar] [CrossRef]
  34. Norberg, A.; Abrego, N.; Blanchet, F.G.; Adler, F.R.; Anderson, B.J.; Anttila, J.; Araújo, M.B.; Dallas, T.; Dunson, D.; Elith, J.; et al. A comprehensive evaluation of predictive performance of 33 species distribution models at species and community levels. Ecol. Monogr. 2019, 89, e01370. [Google Scholar] [CrossRef]
  35. Jia, T.; Qi, Y.; Zhao, H.; Xian, X.; Li, J.; Huang, H.; Yu, W.; Liu, W. Estimation of climate-induced increased risk of Centaurea solstitialis L. invasion in China: An integrated study based on biomod2. Front. Ecol. Evol. 2023, 11, 1113474. [Google Scholar] [CrossRef]
  36. Gu, R.; Wei, S.; Li, J.; Zheng, S.; Li, Z.; Liu, G.; Fan, S. Predicting the impacts of climate change on the geographic distribution of moso bamboo in China based on biomod2 model. Eur. J. For. Res. 2024, 143, 1499–1512. [Google Scholar] [CrossRef]
  37. Huang, D.; An, Q.; Huang, S.; Tan, G.; Quan, H.; Chen, Y.; Zhou, J.; Liao, H. Biomod2 modeling for predicting the potential ecological distribution of three Fritillaria species under climate change. Sci. Rep. 2023, 13, 18801. [Google Scholar] [CrossRef]
  38. Fang, J.; Lechowicz, M.J. Climatic limits for the present distribution of beech (Fagus L.) species in the world. J. Biogeogr. 2006, 33, 1804–1819. [Google Scholar] [CrossRef]
  39. Xie, C.; Li, M.; Chen, L.; Jim, C.Y. Climate-driven changes to the spatial–temporal pattern of endangered tree Toona ciliata Roem. in China. Theor. Appl. Climatol. 2024, 155, 2071–2085. [Google Scholar] [CrossRef]
  40. Liu, Y.; Tang, G.; Huang, X.; Wei, K.; Wu, S.; Wang, M.; Wang, Y.; Zhang, J.; Wang, Y. Unexpected deep mixing layer in the Sichuan Basin, China. Atmos. Res. 2021, 249, 105300. [Google Scholar] [CrossRef]
  41. He, Y.; Wang, G.; Ren, Y.; Gao, S.; Chu, D.; McKirdy, S.J. Machine learning ensemble model prediction of northward shift in potato cyst nematodes (Globodera rostochiensis and G. pallida) distribution under climate change conditions. J. Integr. Agric. 2024, 23, 3576–3591. [Google Scholar] [CrossRef]
  42. Zhao, G.; Cui, X.; Sun, J.; Li, T.; Wang, Q.; Ye, X.; Fan, B. Analysis of the distribution pattern of Chinese Ziziphus jujuba under climate change based on optimized biomod2 and MaxEnt models. Ecol. Indic. 2021, 132, 108256. [Google Scholar] [CrossRef]
Figure 1. TSS and ROC evaluations of each single-model.
Biology 14 00180 g001
Figure 2. Contribution rate of environmental factors for each single model.
Biology 14 00180 g002
Figure 3. Response curves of A. odoratissima.
Biology 14 00180 g003
Figure 4. Potential geographic distribution of A. odoratissima in China under current and future climatic scenarios.
Biology 14 00180 g004
Figure 5. Areal change in A. odoratissima habitat in different periods.
Biology 14 00180 g005
Figure 6. Migration of the center of suitable habitat for A. odoratissima under different climatic scenarios. Arrows indicate the direction of migration direction of the center.
Biology 14 00180 g006
Table 1. TSS and ROC evaluations of ensemble model.
VariablesTSSROC
EMmean0.8940.972
EMmedian0.8960.967
EMca0.8970.979
EMwmean0.8950.973
Disclaimer/Publisher’s Note: The statements, opinions and data contained in all publications are solely those of the individual author(s) and contributor(s) and not of MDPI and/or the editor(s). MDPI and/or the editor(s) disclaim responsibility for any injury to people or property resulting from any ideas, methods, instructions or products referred to in the content.

