Article

Network Pharmacology, Molecular Docking, and Molecular Dynamics Simulation Analysis Reveal Insights into the Molecular Mechanism of Cordia myxa in the Treatment of Liver Cancer

by
Li Li
1,
Alaulddin Hazim Mohammed
2,
Nazar Aziz Auda
3,
Sarah Mohammed Saeed Alsallameh
3,
Norah A. Albekairi
4,
Ziyad Tariq Muhseen
1,5,* and
Christopher J. Butch
1,6,*
1
Department of Biomedical Engineering, College of Engineering and Applied Sciences, Nanjing University, Nanjing 210093, China
2
School of Life Sciences and Technology, Huazhong University of Science and Technology, Wuhan 430074, China
3
Department of Medical Laboratories Techniques, College of Health and Medical Techniques, Gilgamesh Ahliya University (GAU), Baghdad 10022, Iraq
4
Department of Pharmacology and Toxicology, College of Pharmacy, King Saud University, P.O. Box 2455, Riyadh 11451, Saudi Arabia
5
Department of Pharmacy, Al-Mustaqbal University, Hillah 51001, Iraq
6
State Key Laboratory of Analytical Chemistry for Life Science, Jiangsu Key Laboratory of Artificial Functional Materials, Nanjing University, Nanjing 210093, China
*
Authors to whom correspondence should be addressed.
Biology 2024, 13(5), 315; https://doi.org/10.3390/biology13050315
Submission received: 12 March 2024 / Revised: 18 April 2024 / Accepted: 23 April 2024 / Published: 1 May 2024

Abstract

:

Simple Summary

Traditional cancer treatments have long struggled with issues such as toxicity, drug resistance, and financial burdens. However, there is growing interest in using natural compounds, like those found in complementary alternative medicine, due to their ability to influence various molecular pathways with fewer side effects. In our study, we focused on understanding how active components of Cordia myxa could potentially treat liver cancer (LC). By employing network pharmacology techniques, we identified key molecular targets and pathways involved. Through a combination of data analysis and computational modeling, we found that certain genes, including HSP90AA1, ESR1, CYP3A4, CDK1, and MMP9, play crucial roles in LC patient survival. Specifically, our findings suggest that compounds like cosmosiin, rosmarinic acid, quercetin, and rubinin may interact with HSP90AA1, offering a promising avenue for therapeutic intervention. Molecular dynamics simulations further validated these interactions, highlighting the stability of the drug–protein complexes. Overall, our integrated approach underscores the potential of C. myxa in combating LC by modulating cancer-related signaling pathways.

Abstract

Traditional treatments of cancer have faced various challenges, including toxicity, medication resistance, and financial burdens. On the other hand, bioactive phytochemicals employed in complementary alternative medicine have recently gained interest due to their ability to control a wide range of molecular pathways while being less harmful. As a result, we used a network pharmacology approach to study the possible regulatory mechanisms of active constituents of Cordia myxa for the treatment of liver cancer (LC). Active constituents were retrieved from the IMPPAT database and the literature review, and their targets were retrieved from the STITCH and Swiss Target Prediction databases. LC-related targets were retrieved from expression datasets (GSE39791, GSE76427, GSE22058, GSE87630, and GSE112790) through gene expression omnibus (GEO). The DAVID Gene Ontology (GO) database was used to annotate target proteins, while the Kyoto Encyclopedia and Genome Database (KEGG) was used to analyze signaling pathway enrichment. STRING and Cytoscape were used to create protein–protein interaction networks (PPI), while the degree scoring algorithm of CytoHubba was used to identify hub genes. The GEPIA2 server was used for survival analysis, and PyRx was used for molecular docking analysis. Survival and network analysis revealed that five genes named heat shot protein 90 AA1 (HSP90AA1), estrogen receptor 1 (ESR1), cytochrome P450 3A4 (CYP3A4), cyclin-dependent kinase 1 (CDK1), and matrix metalloproteinase-9 (MMP9) are linked with the survival of LC patients. Finally, we conclude that four extremely active ingredients, namely cosmosiin, rosmarinic acid, quercetin, and rubinin influence the expression of HSP90AA1, which may serve as a potential therapeutic target for LC. These results were further validated by molecular dynamics simulation analysis, which predicted the complexes with highly stable dynamics. The residues of the targeted protein showed a highly stable nature except for the N-terminal domain without affecting the drug binding. An integrated network pharmacology and docking study demonstrated that C. myxa had a promising preventative effect on LC by working on cancer-related signaling pathways.

1. Introduction

Liver cancer (LC) is the fifth most common type of cancer and the third-leading cause of death globally [1]. According to the global cancer statistics reports, LC caused an estimated 781,631 deaths worldwide in 2018 [2]. According to the UK Cancer Research report, liver cancer will likely have one of the fastest rates of growth and will experience a significant rise in the number of patients by 2035 [3]. Hepatocellular carcinoma (HCC), the most prevalent type of LC, makes up between 70% and 85% of all LC [4]. HCC is strongly linked to chronic hepatitis B or C virus infection, consumption of aflatoxin-contaminated foods, and excessive intake of alcohol [5]. The majority of patients can only receive palliative care because they are typically given a diagnosis at an advanced stage and cannot undergo surgical resection. Understanding the molecular mechanisms that cause HCC and developing alternative therapies with lower toxicity levels is crucial in order to improve clinical outcomes and reduce treatment side effects [6].
Cordia myxa is a medicinal plant often known as “Assyrian plum and Lasura” and is a member of the “Boraginaceae” family. It is found in eastern India, tropical Africa, tropical Asia, Australia, and America [7]. Fruit extract from C. myxa was found to contain oil, saponins, flavonoids, glycosides, sterols, terpenoids, phenolic acids, alkaloids, coumarins, resins, gums, tannins, and mucilage [8]. It has anti-cancer, anti-bacterial, antibiotic, anti-inflammatory, hepatoprotective, anti-fungal, anti-hypertensive, anti-diabetic, anti-mitotic, and anti-oxidant properties. C. myxa leaves and fruit pulp have been used for centuries to treat coughs, respiratory infections, sore throats, rheumatic pain, wounds, ulcers, trypanosomiasis, skin diseases, and colic [9].
Network pharmacology (NP) in traditional Chinese medicine (TCM) is a technology that combines various fields, including computer science, systems biology, and pharmacology, which offers a unique network mode comprising “multiple targets, multiple effects, and complicated diseases” [10]. It associates drugs and diseases in a broader sense, and it provides different approaches for investigating the mechanisms of traditional Chinese medicine by introducing and developing new drugs [11]. Bioinformatics is an innovative field that integrates molecular biology with mathematics, statistics, computer science, and other disciplines. It can be used to examine the relationships and laws that govern biological genes and diseases. Furthermore, it has rapidly evolved into the most appealing frontier of life sciences nowadays [12]. Batool et al. [13] employed both bioinformatics and network pharmacology to elucidate the anti-cancer effect of Fumaria indica to treat liver cancer. Sadaqat et al. [14] implemented an advanced network-pharmacology-based approach to examine the active components of Bacopa monnieri for the treatment of liver cancer.
The present study utilized a network pharmacology approach to investigate the active ingredients and potential targets of C. myxa for liver cancer treatment. This approach constructs models that consider multiple components and targets, providing a comprehensive understanding of the complex interactions between active compounds and target proteins. In addition, survival analysis and molecular docking studies were conducted to validate the results. Furthermore, the obtained results were supplemented by all-atom molecular dynamics (MD) simulation for 100 ns, followed by MMGBA/PBSA analysis to examine the conformational changes, stability, and interaction mechanism of target proteins when bound to the proposed compounds. This study is the first to explore the efficacy and mechanism of C. myxa in liver cancer treatment, offering theoretical support and guidance for future research. It provides valuable insights into the molecular mechanisms underlying the anti-liver-cancer activity of C. myxa and accelerates the drug discovery process. However, further wet lab experiments are required to analyze the pharmacological potential of C. myxa-related compounds.

2. Materials and Methods

2.1. Collection and Screening of Active Constituents and Corresponding Targets

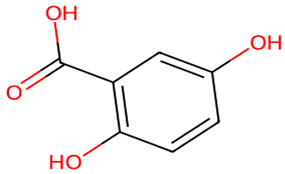
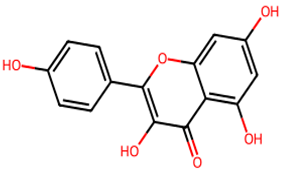
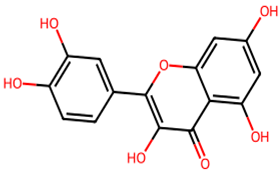
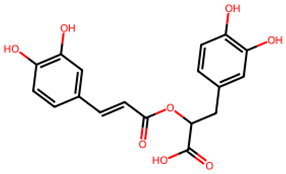
Active compounds of C. myxa were obtained from the review of the literature and the Indian Medicinal Plants, Phytochemistry, and Therapeutics database (IMPPAT; https://cb.imsc.res.in/imppat/, accessed on 29 December 2022) [15]. Using canonical smiles, the bioactive compounds were obtained using the oral bioavailability (OB) ≥ 30% and drug-likeness (DL) ≥ 0.18 retrieval filters through SwissADME (http://www.swissadme.ch/, accessed on 1 January 2023) [16] and Molsoft (https://molsoft.com/mprop/, accessed on 1 January 2023) [17], respectively. The amount and pace at which oral medicine is absorbed into the systemic circulation are referred to as OB [18]. DL is a chemical qualitative characteristic that is commonly used during the early phases of drug discovery [19]. The compound ID, canonical smiles, and molecular weight (MW) were retrieved from the PubChem (https://pubchem.ncbi.nlm.nih.gov/, accessed on 2 January 2023) database [20]. The 2D structures of active constituents were drawn through the RDKit package of Python [21].
The potential targets related to active constituents of C. myxa were investigated and evaluated using public databases such as the Swiss Target Prediction (http://www.swisstargetprediction.ch/, accessed on 5 January 2023) [22] and STITCH (http://stitch.embl.de/, accessed on 5 January 2023) databases [23]. Once the target was predicted, the species in each of these databases was confined to Homo Sapiens. The active constituent–target network was constructed using Cytoscape version 3.9.1 [24].

2.2. Identification of Critical Genes in LC from Expression Datasets

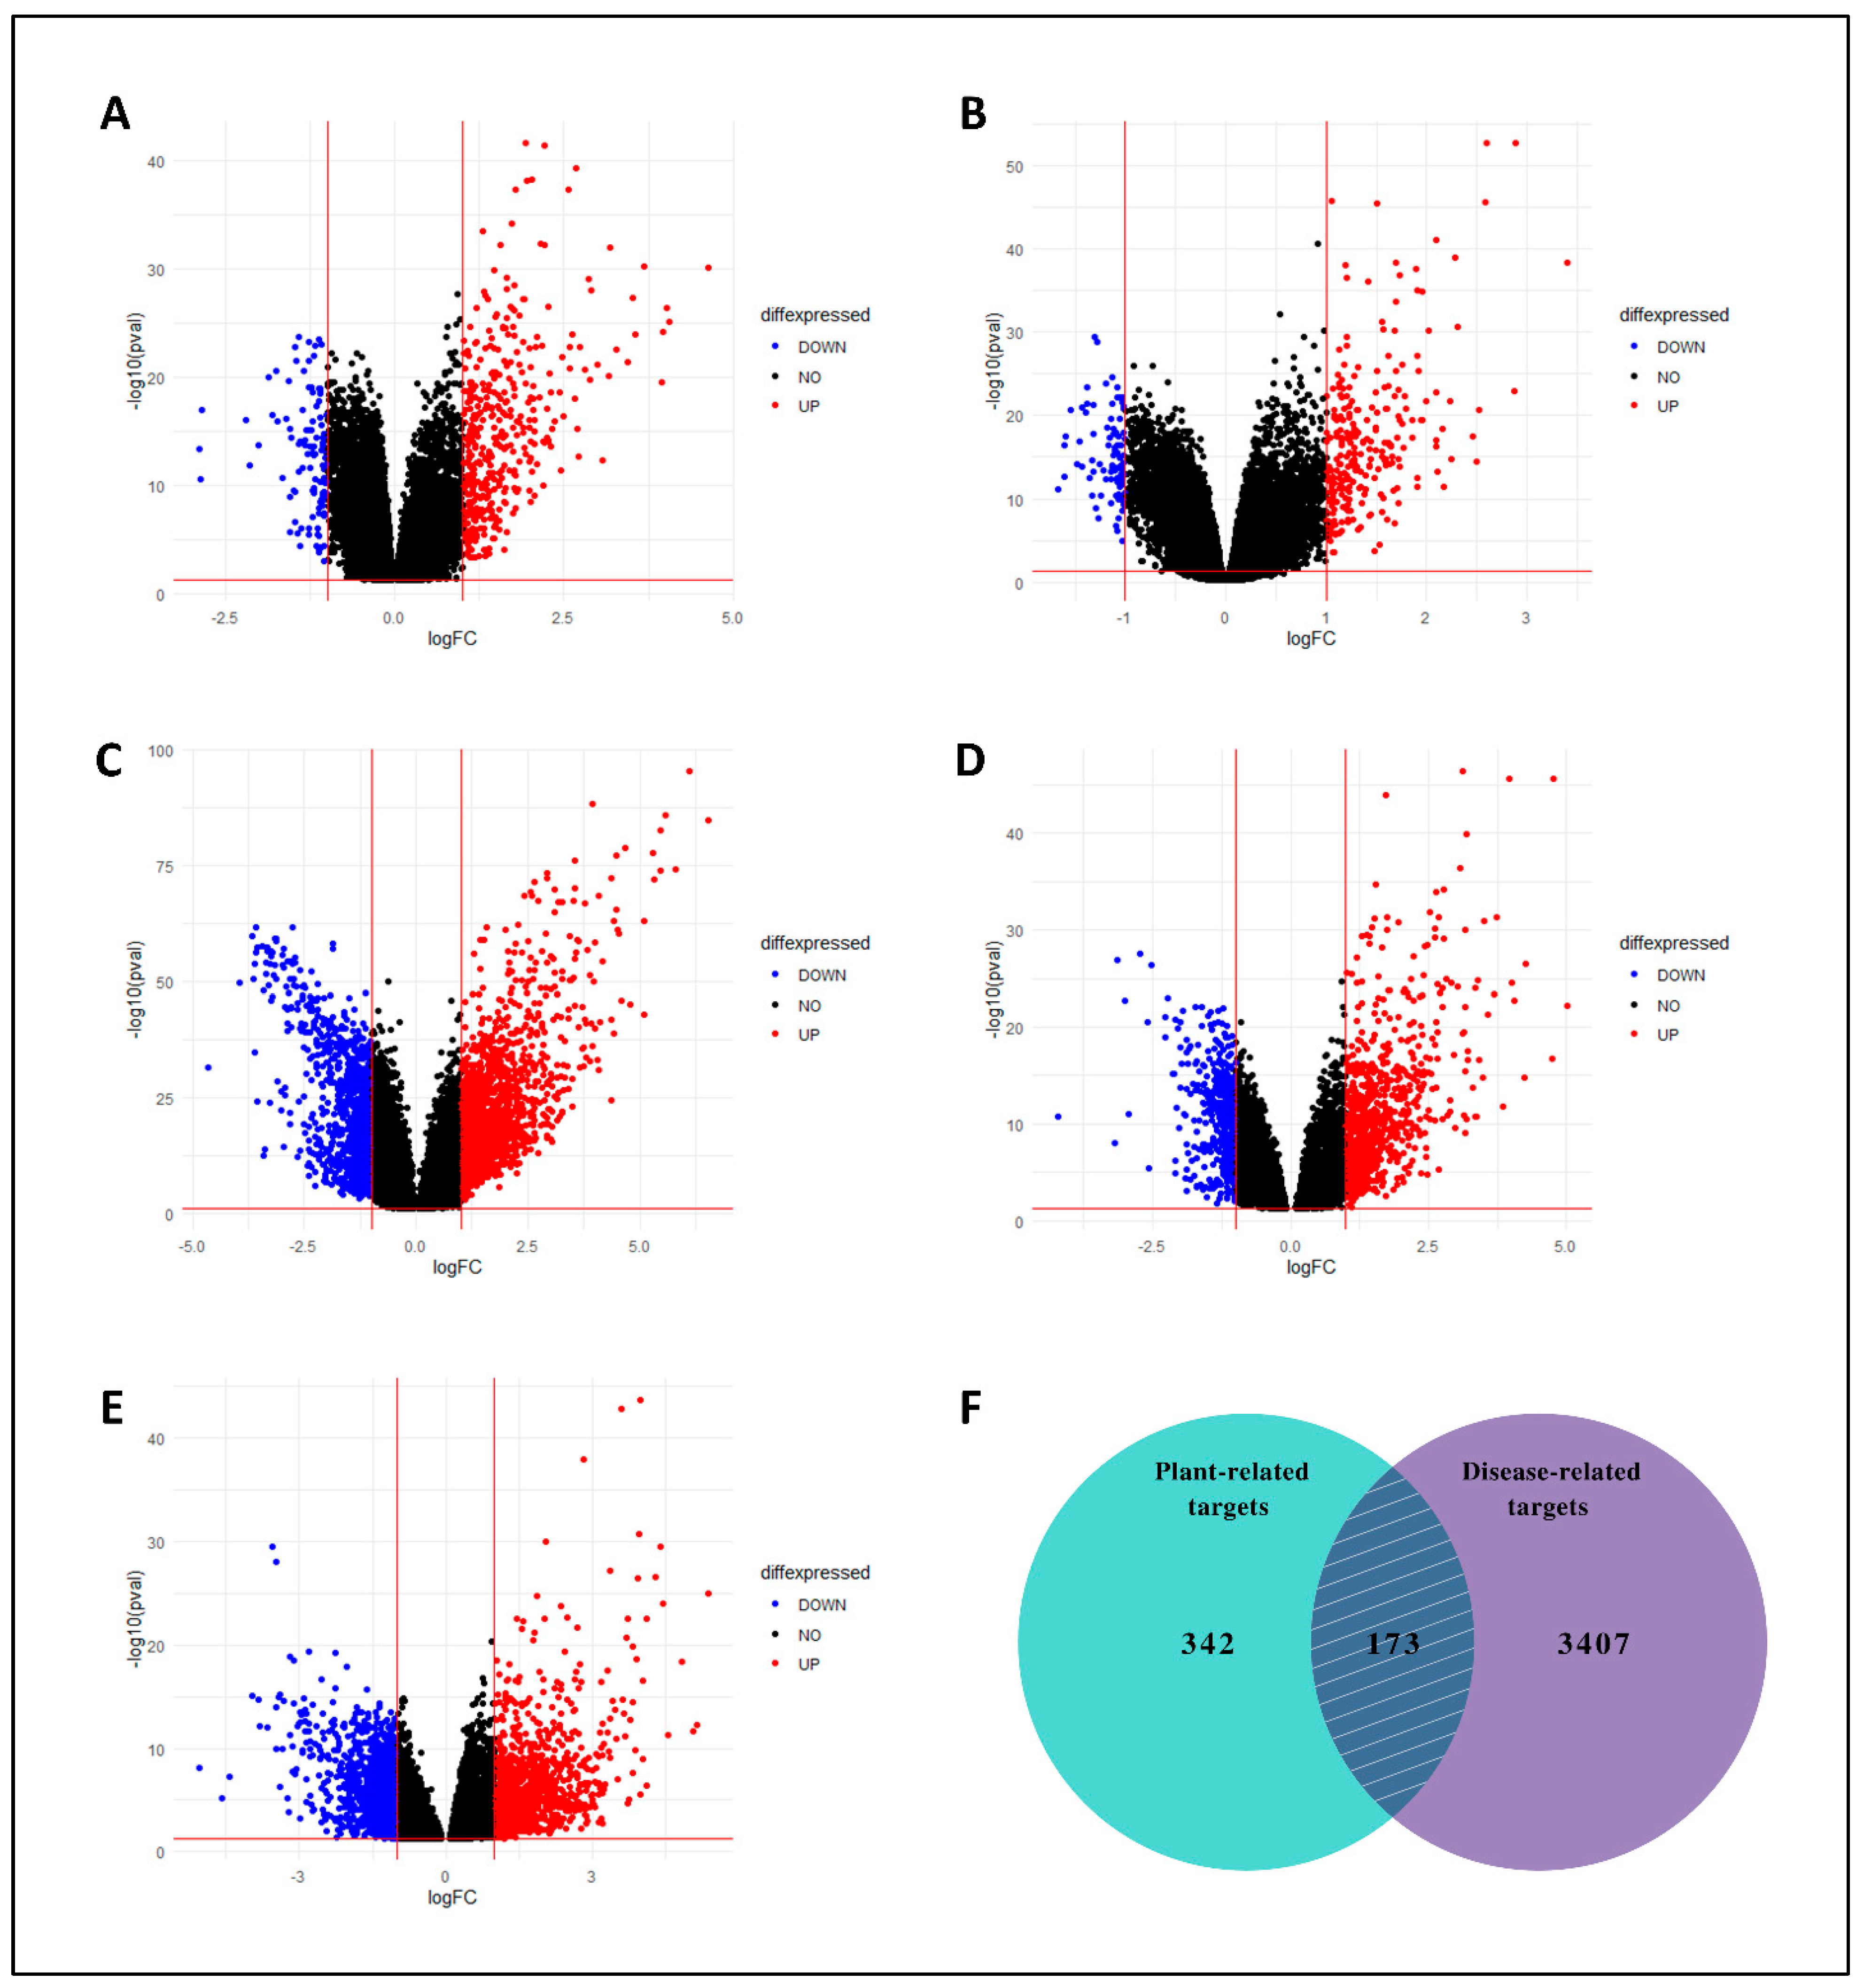
Five microarray datasets (GSE39791, GSE76427, GSE22058, GSE87630, and GSE112790) were selected for the identification of differentially expressed genes (DEGs) in LC. The NCBI-GEO database (https://www.ncbi.nlm.nih.gov/geo/, accessed on 6 January 2023) [25] was used to retrieve these datasets. GSE39791, GSE76427, GSE22058, GSE87630, and GSE112790 consisted of 144 (72 normal and 72 affected), 167 (52 normal and 115 affected), 197 (97 normal and 100 affected), 94 (30 normal and 64 affected), and 198 (15 normal and 183 affected) tissue samples. Limma v.3.26.8 package of R language was used for the normalization of datasets from which data redundancy is eliminated, and data alteration errors are minimized [26]. The genes having adjusted p-value < 0.05, log (FC) < −1, and log (FC) > 1 were considered significant DEGs and defined as LC-specific genes. To illustrate major up-regulated and down-regulated genes, volcano plots were created for the LC vs. normal comparison. The DEGs acquired from the preceding technique were used for further analysis. Targets from the compound target databases and GEO datasets (non-redundant) were combined, and a Venn diagram was constructed to highlight the genes shared by C. myxa and LC targets.

2.3. Pathways and Gene Ontology (GO) Enrichment Analysis of Potential Targets

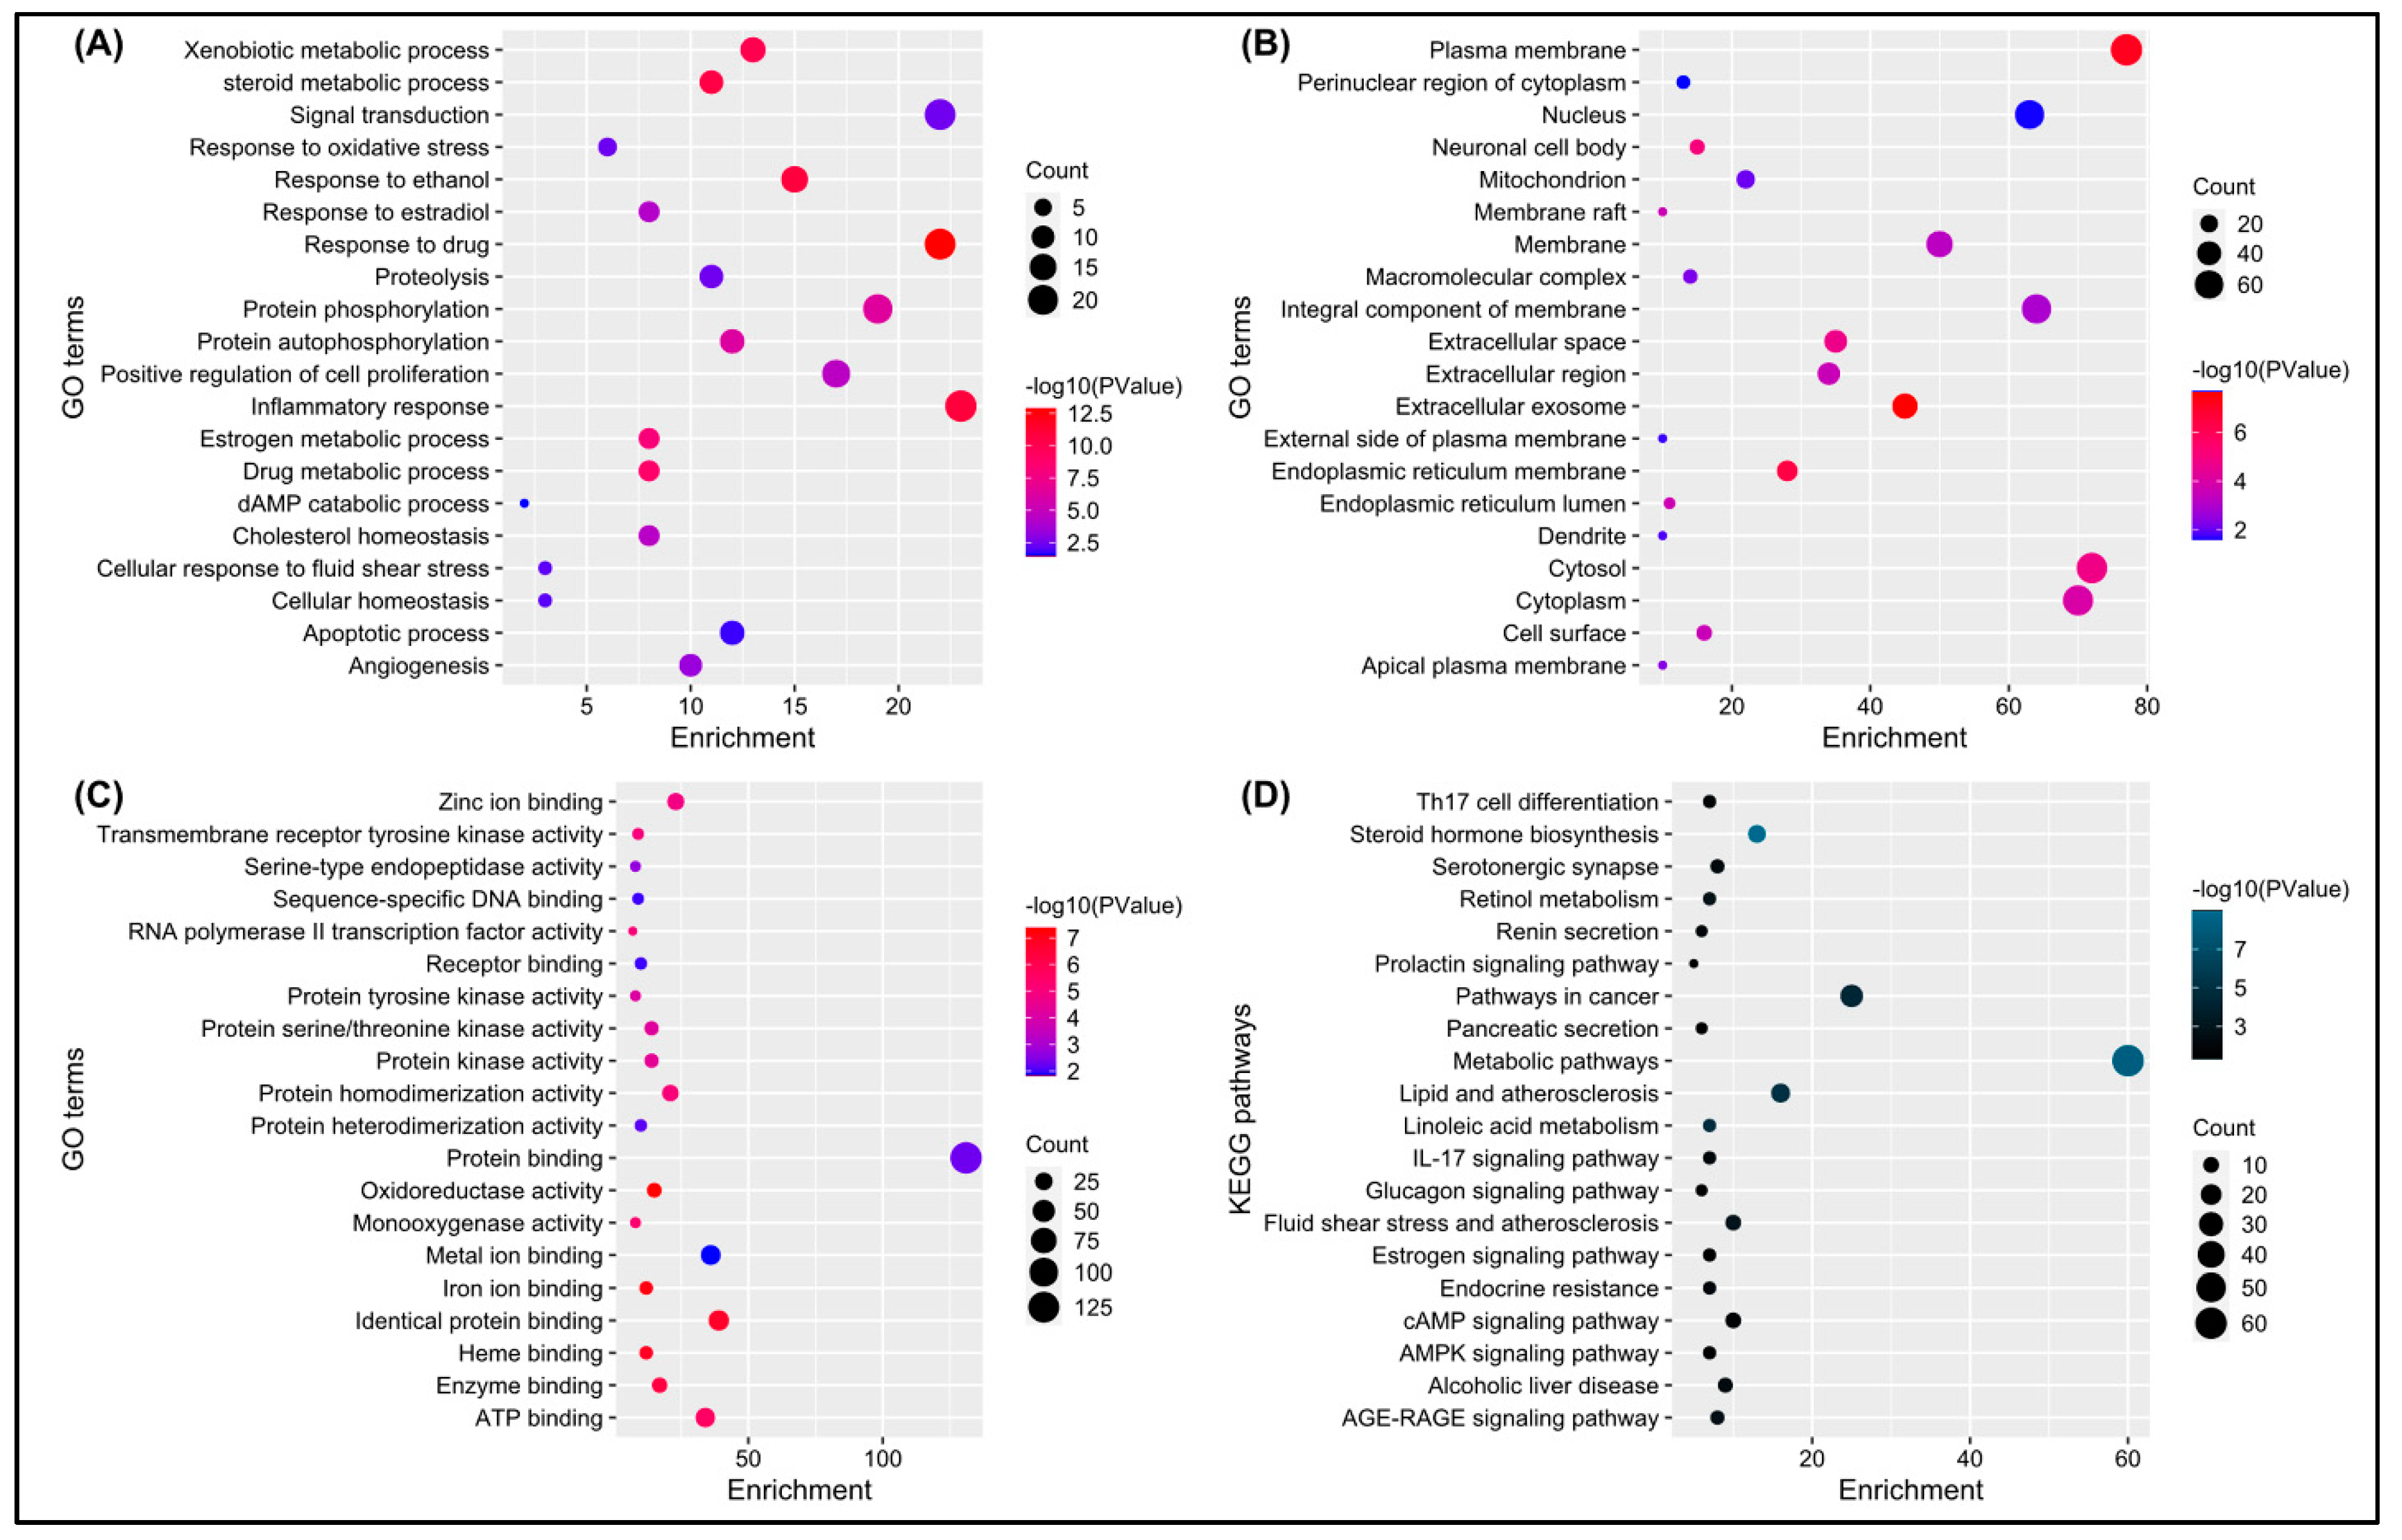
Gene Ontology (GO) analysis is currently a popular way to analyze genomic data, particularly large-scale transcriptome data. Potential targets were analyzed for GO functional enrichment in 3 groups: biological process (BP), cellular component (CC), and molecular function (MF). The DAVID database (https://david.ncifcrf.gov/home.jsp/, accessed on 8 January 2023) [27] was used to perform GO functional and KEGG pathway enrichment analyses on target genes. The enriched GO keywords and pathways with p-values less than 0.05 were chosen for visualization. A package of R “ggplot2” was used to create a bubble graph of the top 20 significant pathways and GO terms (BP, CC, and MF) [28].

2.4. Protein–Protein Interactions (PPIs) and Network Analyses

PPI is the process through which two or more protein molecules form protein complexes via noncovalent bonding. The STRING database (https://string-db.org/, accessed on 9 January 2023) [29] was used to assess the relationship between LC therapeutic targets. Homo sapiens was selected as the reference organism, and the total score was set to 0.5 or higher. The PPI network was visualized using Cytoscape, and the CytoHubba plugin was utilized to find hub genes based on the degree method and higher-degree nodes [30].
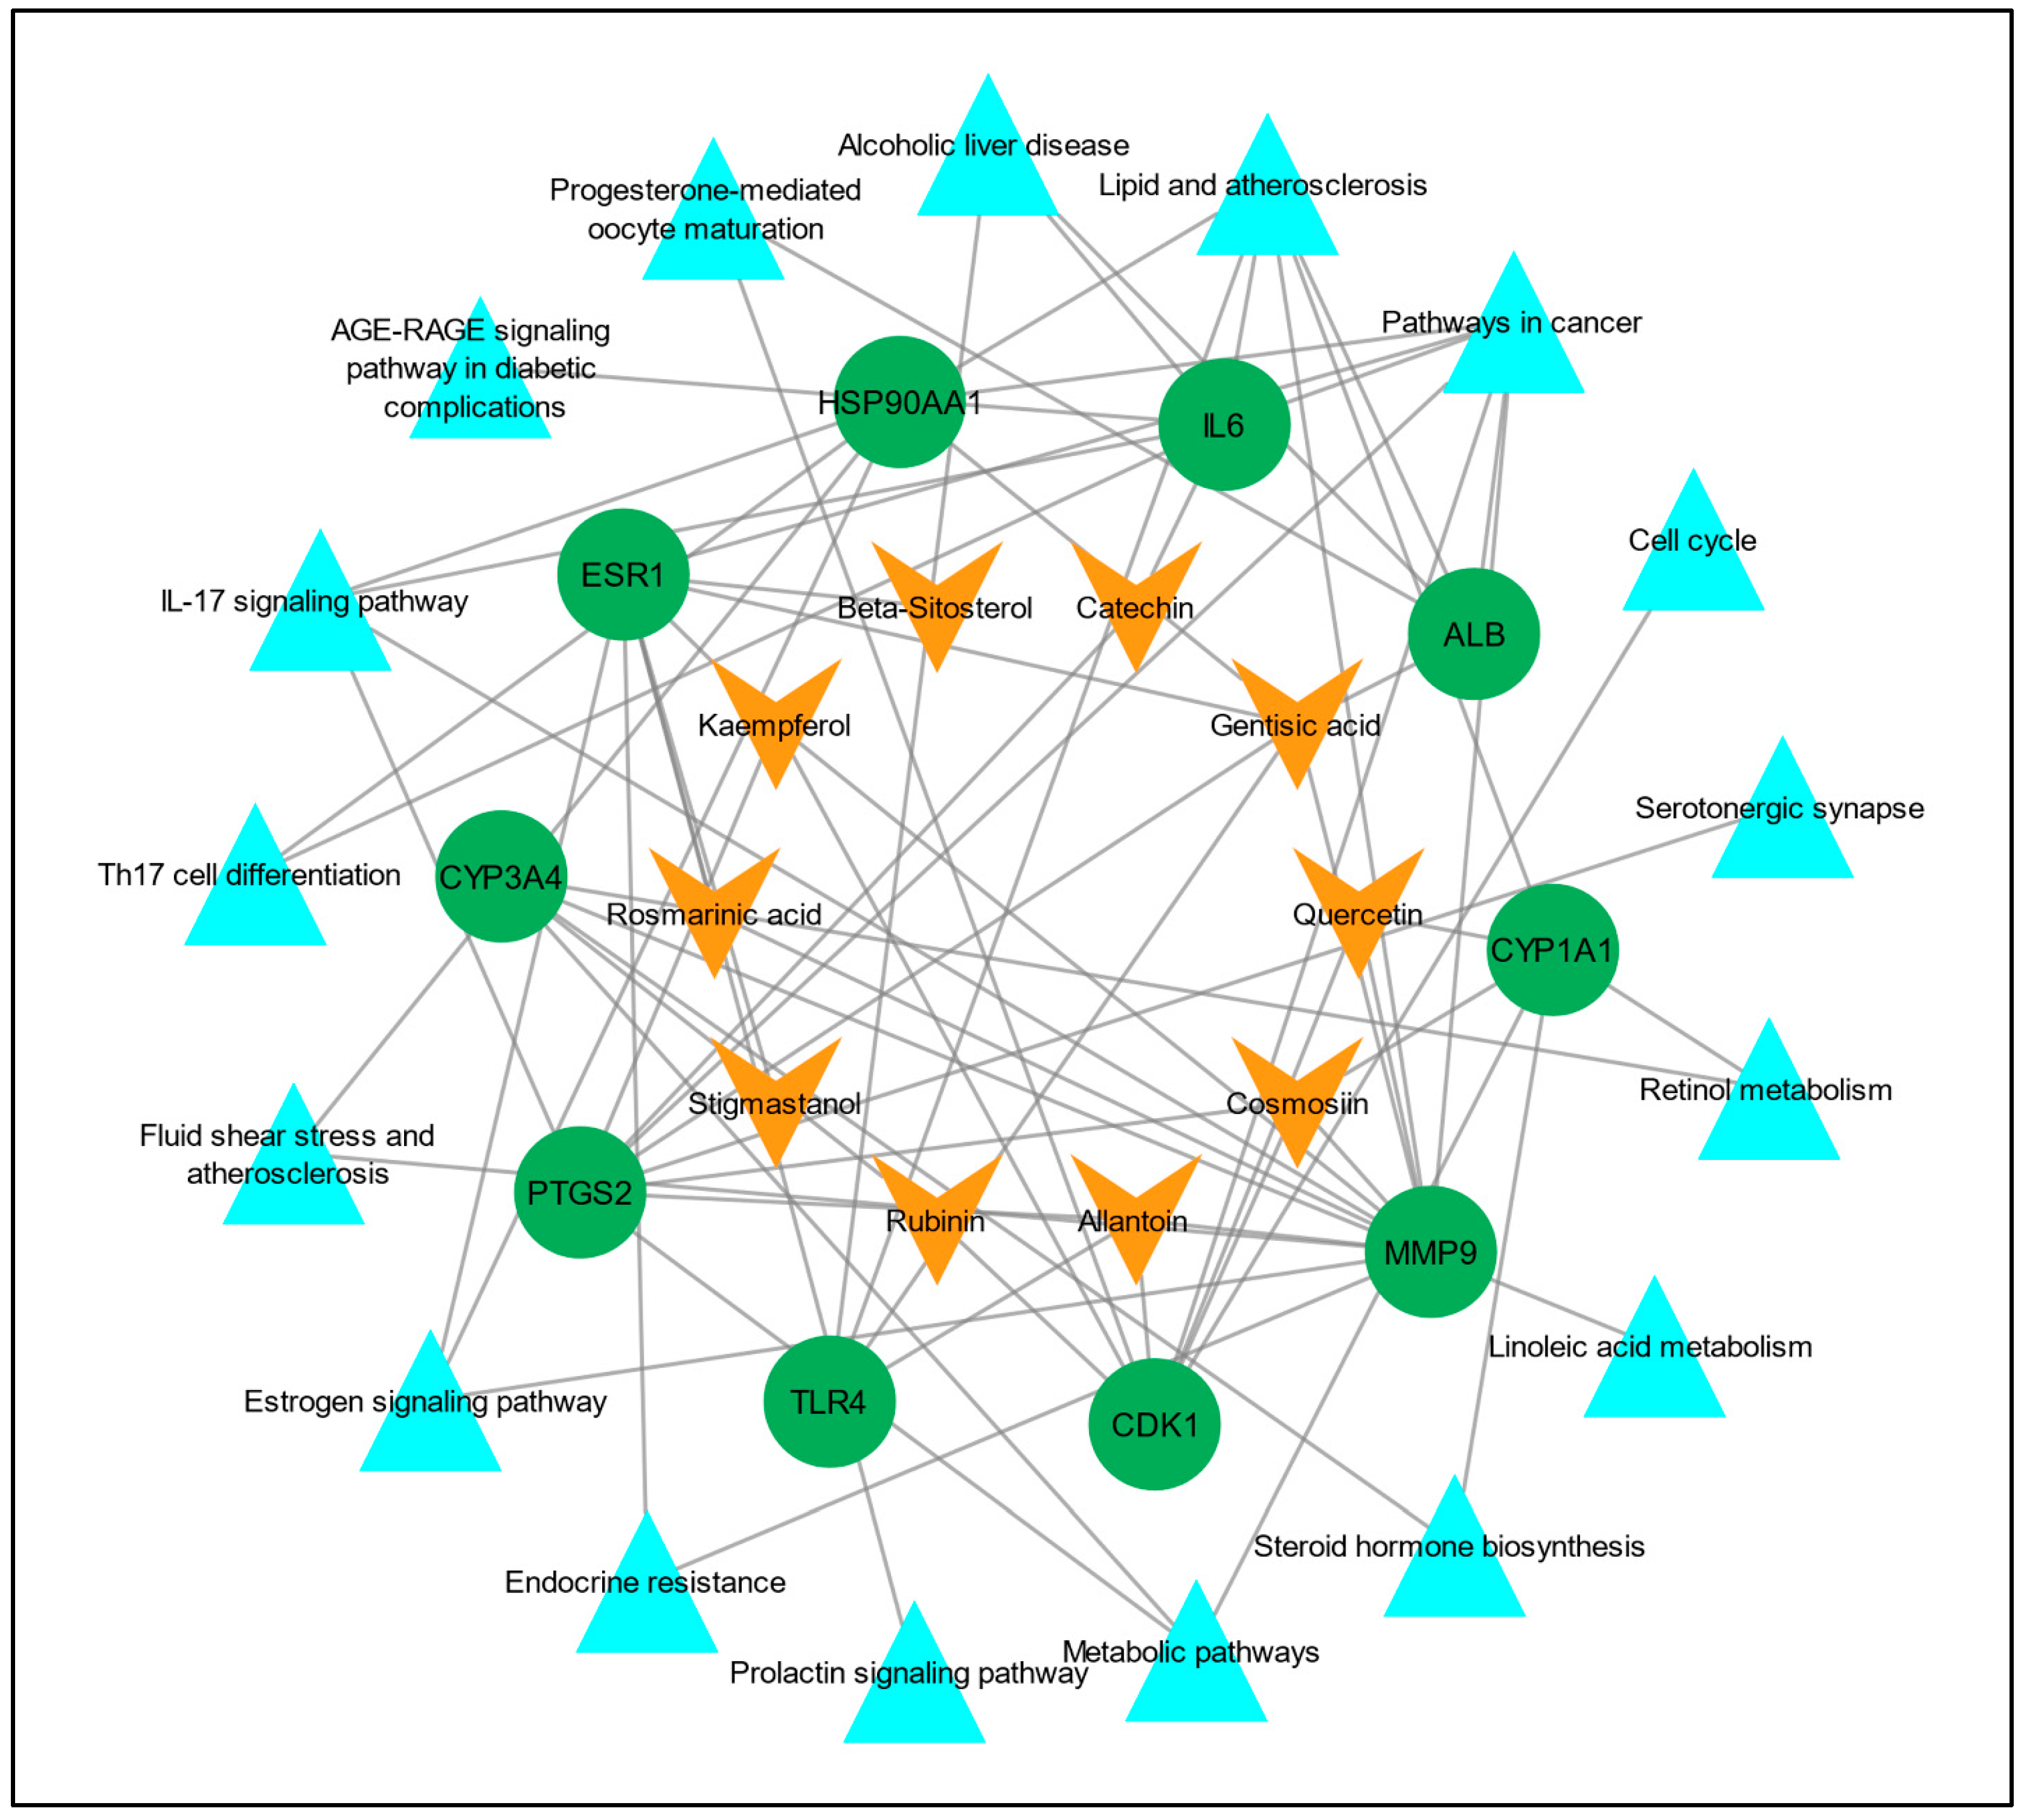
A network of active constituents–targets–pathways was generated using Cytoscape software, version 3.9.1, to characterize the therapeutic mechanisms of C. myxa for LC. The nodes with different colors and geometries in the network represent active constituents, target genes, and pathways, respectively, and an “edge” represents a link between the nodes.

2.5. Survival Analysis

To investigate the impact of the hub targets on the overall survival (OS) of LC, a cancer genomics server called GEPIA 2 (http://gepia2.cancer-pku.cn/#index, accessed on 12 January 2023) [31] was used to quantify the prognostic importance of each hub gene. A Kaplan–Meier survival plot was used to compare the two groups of LC patients who were classified into high- and low-expression groups [32]. Hazard ratios (HRs; 95% confidence intervals) and logrank p values were determined for survival, with logrank p < 0.05 serving as the statistical significance threshold [33].

2.6. Molecular Docking

The Protein Data Bank (PDB; https://www.rcsb.org/, accessed on 13 January 2023) [34] was used to search and download the target protein structure predicted by the X-ray crystallography method. UCSF Chimera was used for the removal of non-standard atoms, solvents, and energy minimization [35]. The online tool Computed Atlas of Surface Topography of Protein (CASTp; http://sts.bioe.uic.edu/castp/index.html?2cpk, accessed on 13 January 2023) [36] was used to predict binding pockets of target protein. The PubChem database (https://pubchem.ncbi.nlm.nih.gov/, accessed on 2 January 2023) [20] was used to download 3D structures of compounds. PyRx software v0.8 was used for virtual screening and molecular docking of target protein with drug molecules [37]. Two- and three-dimensional interactions of docking complexes were visualized using Discovery Studio [38] and ChimeraX [39], respectively.

2.7. Analysis of Molecular Dynamic Simulation

The molecular dynamic simulation was performed using the AMBER22 program [40]. An in silico simulation method called molecular dynamic simulations (MDs) is mostly used to understand intermolecular dynamics along the simulation time [41]. In a molecular dynamic simulation pipeline, the atom and molecular trajectories are generated by solving Newton’s equations of motion, and a macromolecule is permitted to exhibit dynamic behavior for a predetermined period of time [42]. In this study, a 100 ns computer simulation was utilized to assess the drugs’ dynamic behavior using the AMBER22 program [43]. The antechamber program was used to prepare the systems, and GAFF2 and FF19Sb were employed as force fields for parameterizing the complexes. This was done to read how the ligands’ drug affinities for the receptor gene changed over time. To attain charge neutrality, the right number of counter ions was added to the system [44]. A cubic box of OPC with a size of eight angstroms was considered sufficient to solvate the complexes. Energy minimization of the complexes was carried out through steepest descent and conjugate gradient. The complexes were heated to 310 K for 500 ps, followed by equilibration and production run for 100 ns [45]. The temperature during the production run was maintained through the Langevin dynamics algorithm, while the hydrogen bonded atoms were constrained via SHAKE algorithm. The generated trajectories were structurally investigated via the CCPTRAJ module [46].

2.8. MMPB/GBSA Analysis

MMPB/GBSA analysis was used to predict the binding free energies of docked ligands with the HSP90AA1 gene [47,48]. A script from the AMBER v22 program named MMPBSA.py was used to accomplish this [49]. The script took into account 5000 frames from the paths that were chosen at regular intervals. The MMPB/GBSA energy formula is as follows:
∆Gbinding = Gcomplex − (Gprotein − ∆Gligand).
The free ligand energy is represented by ΔGligand, the free energy of the receptor protein by ΔGreceptor, the complex free energy by ΔGcomplex, and the overall binding free energy by ΔGbind. To determine the distinct free energies of a complex, protein, and ligand, utilize the following formula. The results show that the MM/PBSA and MM/GBSA methods function similarly. The MM/GBSA uses the Generalized Born equation, which is thought to be quicker to solve the previous equation, for determining the electrostatic energy contribution to the free energy, whereas the MM/PBSA uses the Poisson–Boltzmann equation [40]. Figure 1 illustrates the whole methodology used in this study.

3. Results

3.1. Identification and Filtration of Active Constituents of C. myxa

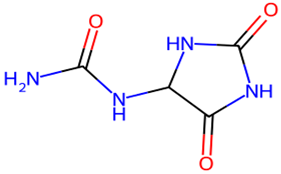
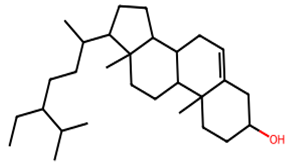
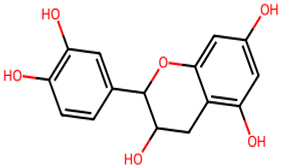
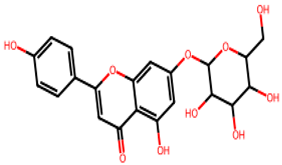
After searching, identification, screening, and removal of duplications, a total of 10 putative compounds including allantoin, beta-sitosterol, cosmosiin, catechin, gentisic acid, kaempferol, quercetin, rosmarinic acid, rubinin, and stigmastanol with OB ≥ 30% and DL ≥ 0.18 were selected as novel compounds (Table 1) [50].

3.2. Identification and Screening of Potential Targets for C. myxa and LC

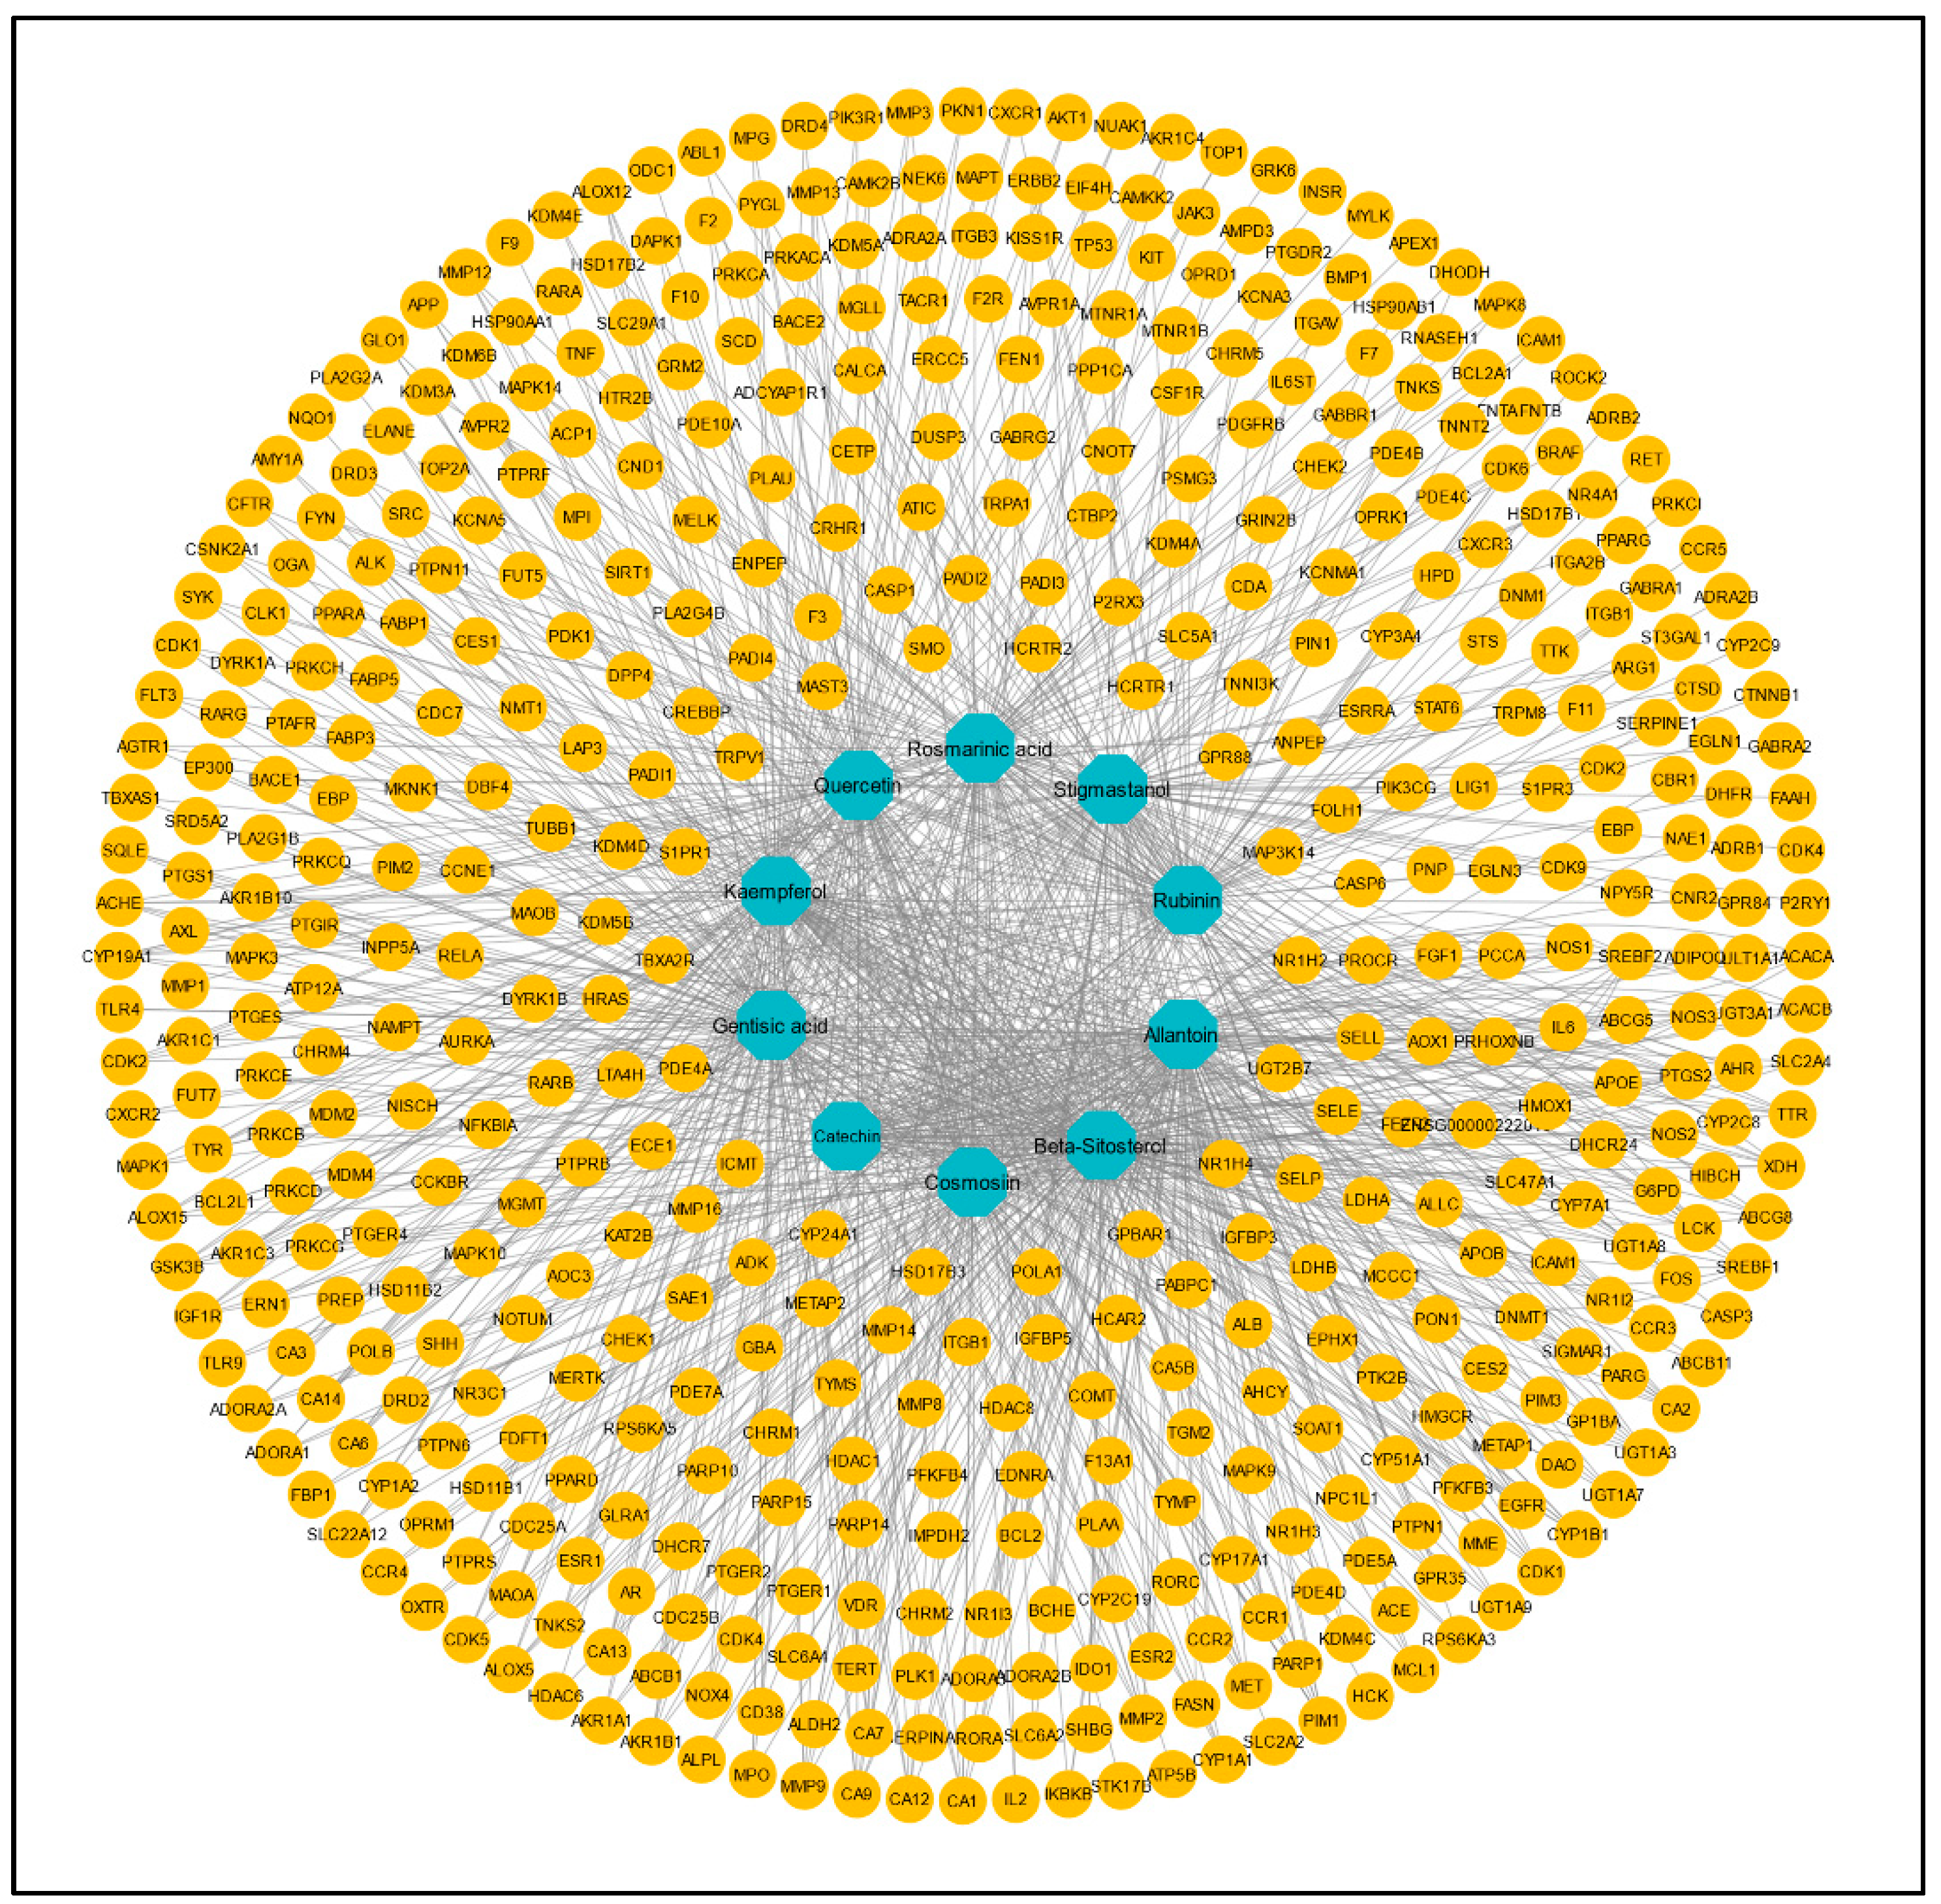
From these 10 active constituents, 515 potential target genes were retrieved from the Swiss Target Prediction and STITCH databases. An active constituent–target network was constructed using Cytoscape version 3.9.1. There were 525 nodes and 1057 edges in the network (Figure 2). The dark-cyan nodes represent active compounds, while the orange nodes represent targets. The CytoHubba plugin of Cytoscape was used to calculate the degree and other parameters (MNC, MCC, closeness, betweenness) of active constituents (Table 2).
On the other hand, from five GEO expression datasets, collectively 3580 DEGs related to LC were identified between LC and normal tissues. The volcano plots were generated using the DEGs from all five datasets (Figure 3A–E). Both compound-related and LC-related target genes were submitted to find overlapped/mutual genes through the Venn diagram, and 173 mutual targets were obtained (Figure 3F). These targets were assumed as key targets and proceeded for further analysis.

3.3. Pathways and GO Enrichment Analysis

The DAVID database provided a total of 204 significant biological processes, 49 cellular components, 92 molecular functions, and 46 KEGG pathways terms. According to the biological processes (BPs), the target genes are mainly involved in response to the drug, inflammatory response, response to ethanol, and so forth (Figure 4A). Cellular components (CCs) indicate that most of the genes are present in the plasma membrane, extracellular exome, cytosol, and so forth (Figure 4B). Molecular functions revealed that genes are involved in protein, ATP, zinc ion binding, and so forth (Figure 4C). KEGG pathway analysis showed that genes are mainly involved in metabolic pathways, pathways in cancer, steroid hormone biosynthesis, and so forth (Figure 4D).

3.4. Interaction of Protein with Other Proteins (PPI)

Using STRING version 11.5, the 173 potential genes were linked to form an initial PPI network. The output file was downloaded in tsv format, and a filter on a combined score ≥ 0.5 was applied. The file was taken as input into the Cytoscape version 3.9.1 to construct and check the significant interactions among proteins in a pharmacological network. There were 161 nodes and 725 edges in the network. The degree scoring algorithm of CytoHubba was applied to the network to find the top 10 hub genes (Figure 5A,B). ALB (51), IL6 (43), HSP90AA1 (31), ESR1 (30), CYP3A4 (29), PTGS2 (24), TLR4 (23), CDK1 (23), MMP9 (22), and CYP1A1 (22) have the higher degree and proceed further for drug–target–pathways network and survival analysis. Figure 5C shows the co-expression relationships of hub genes among each other. The dark color indicates high confidence in relationships [51].

3.5. Construction of the Drug–Target–Pathways Network

To understand the multi-target effect of C. myxa in LC, two networks, the “drug–target network” and “target–pathways network” were constructed separately in Cytoscape version 3.9.1. In the drug–target network, there were 20 nodes and 30 edges, and in the target–pathways network, there were 27 nodes and 43 edges. Later, these two networks were merged to construct a drug–target–pathways network, and there were 37 nodes and 72 edges in the merged network (Figure 6).

3.6. Survival Analysis

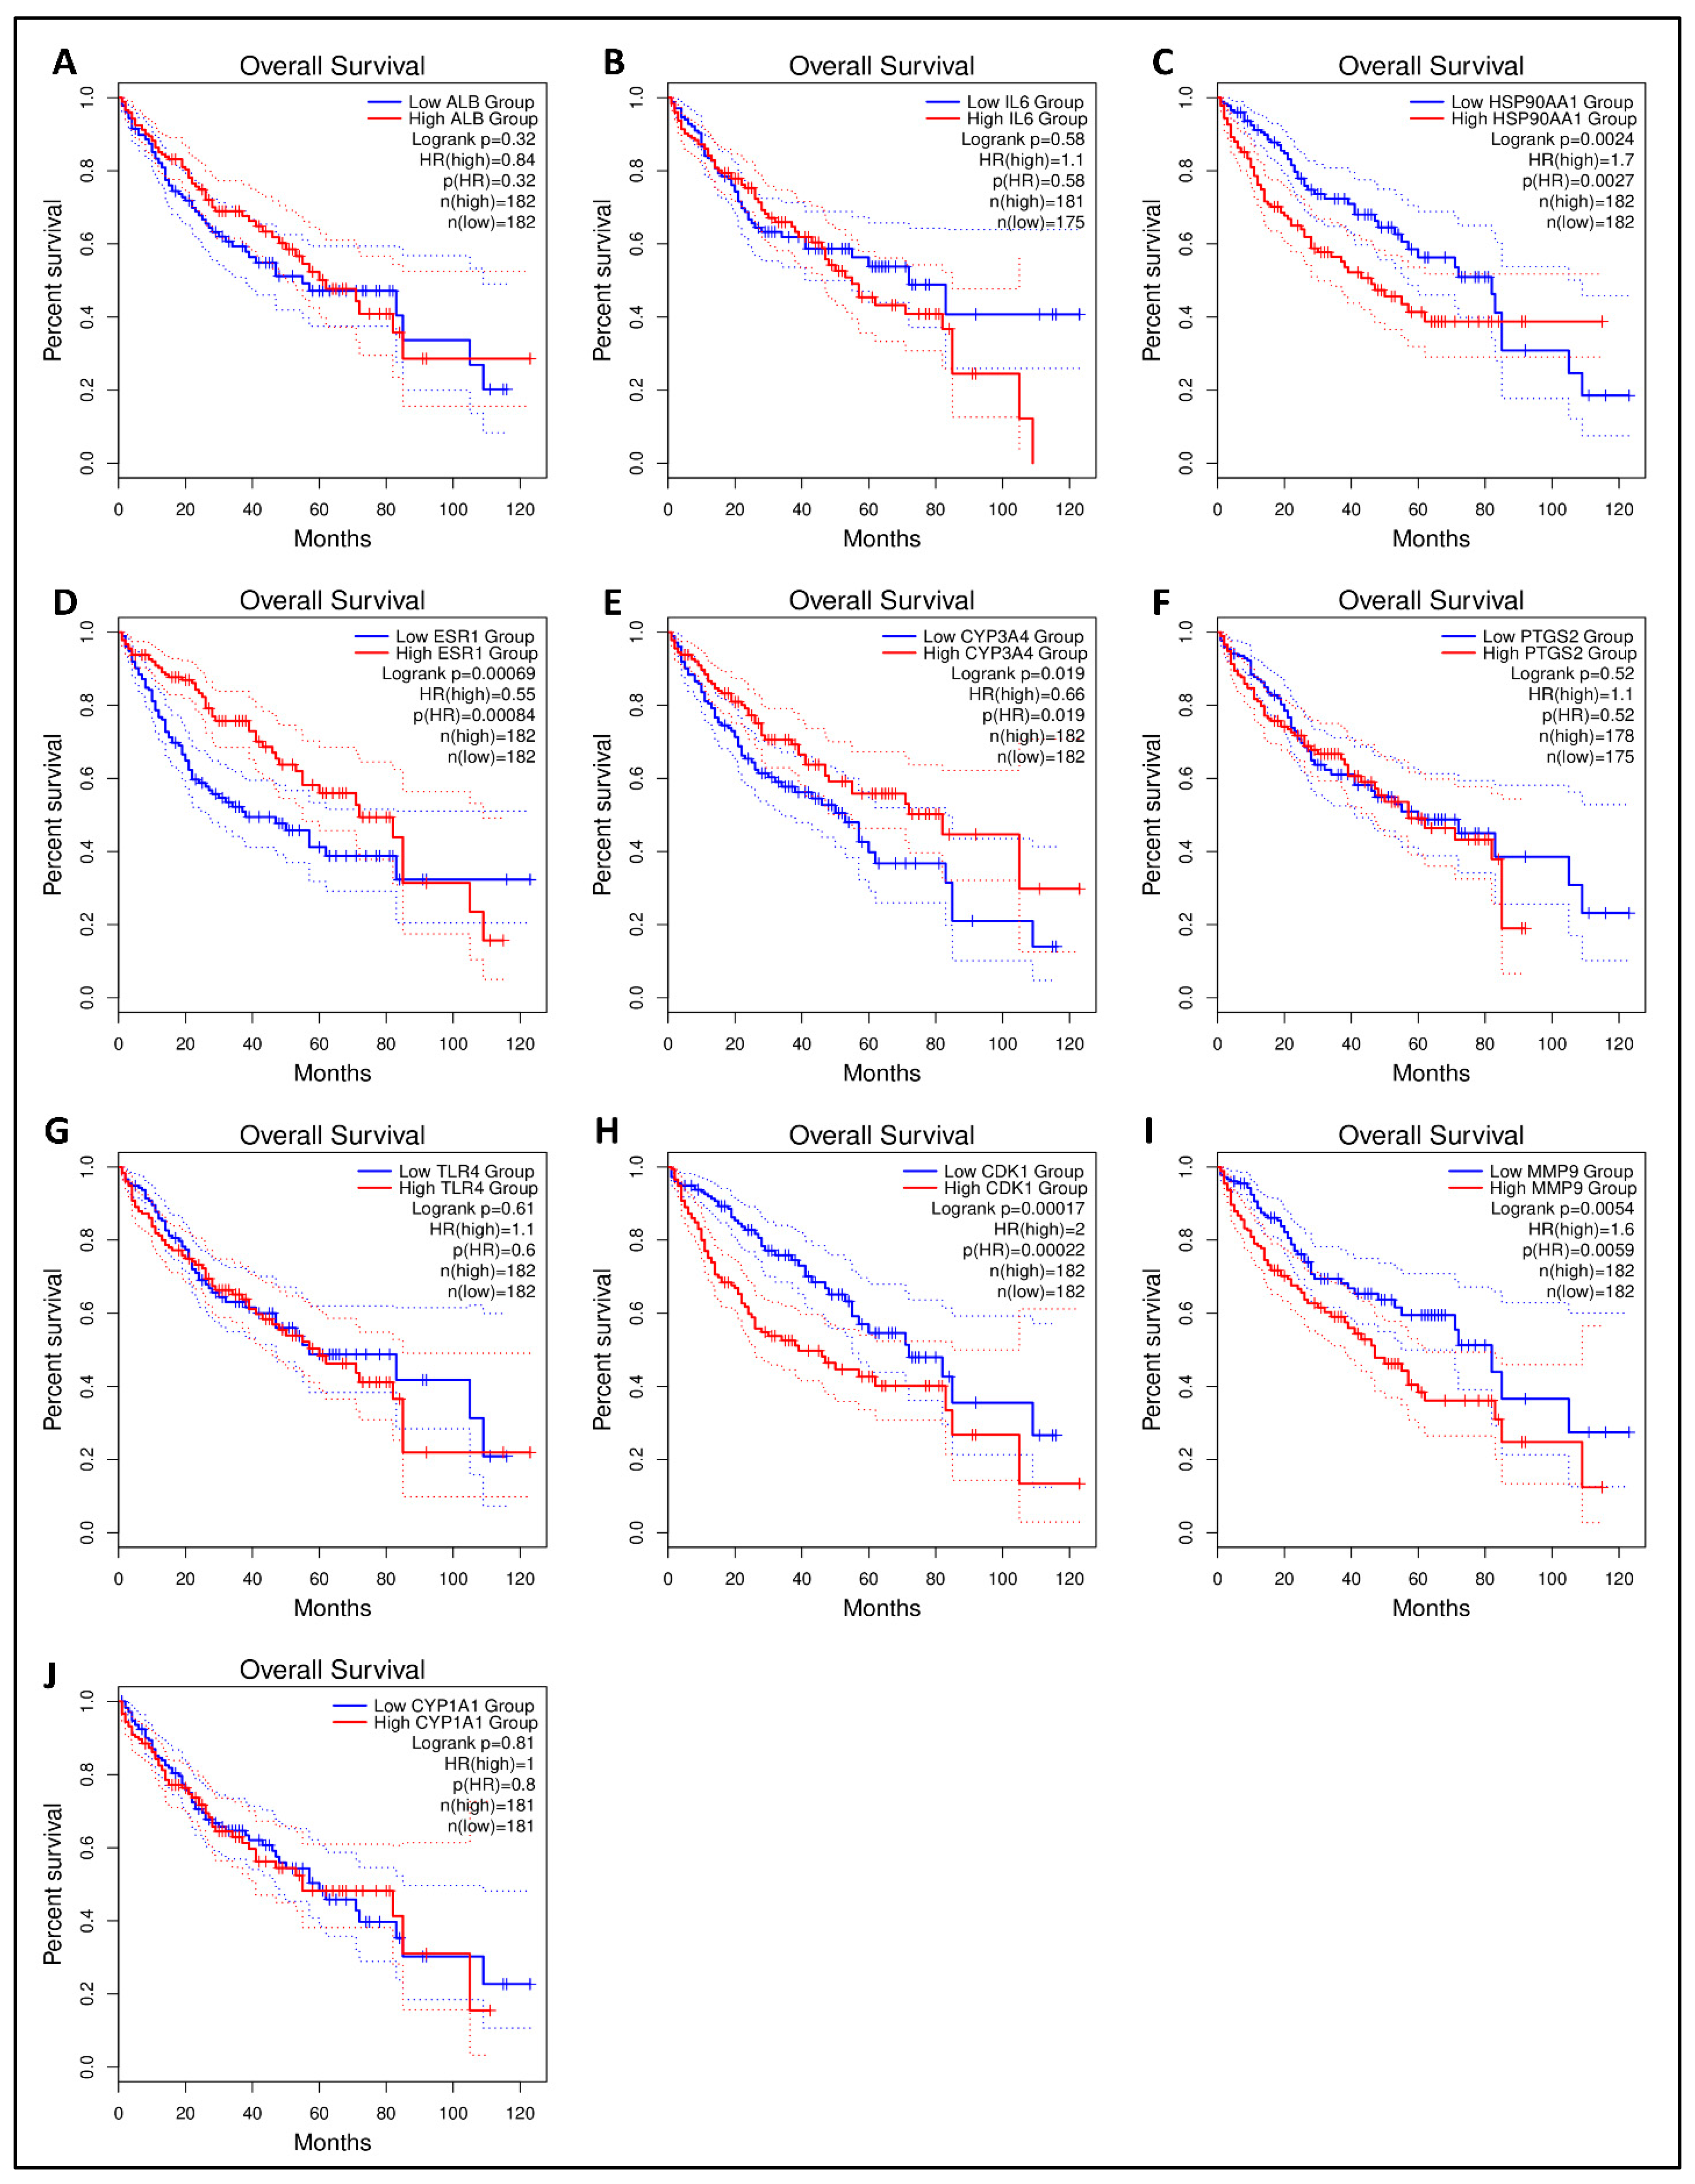
The Kaplan–Meier survival plot was used to examine the disease-free survival of the hub genes in LC to further investigate if hub genes contributed to the prognosis in patients [52]. From 10 hub genes, HSP90AA1, ESR1, CYP3A4, CDK1, and MMP9 were linked to overall survival in all LC patients (logrank p < 0.05), suggesting that they may prevent LC development. There was no statistical significance (logrank p < 0.05) in the overall survival analysis of the remaining five core genes with high and low expression (Figure 7). One hub gene (HSP90AA1) having a higher degree and significance in survival was proceeded further for molecular docking analysis.

3.7. Molecular Docking

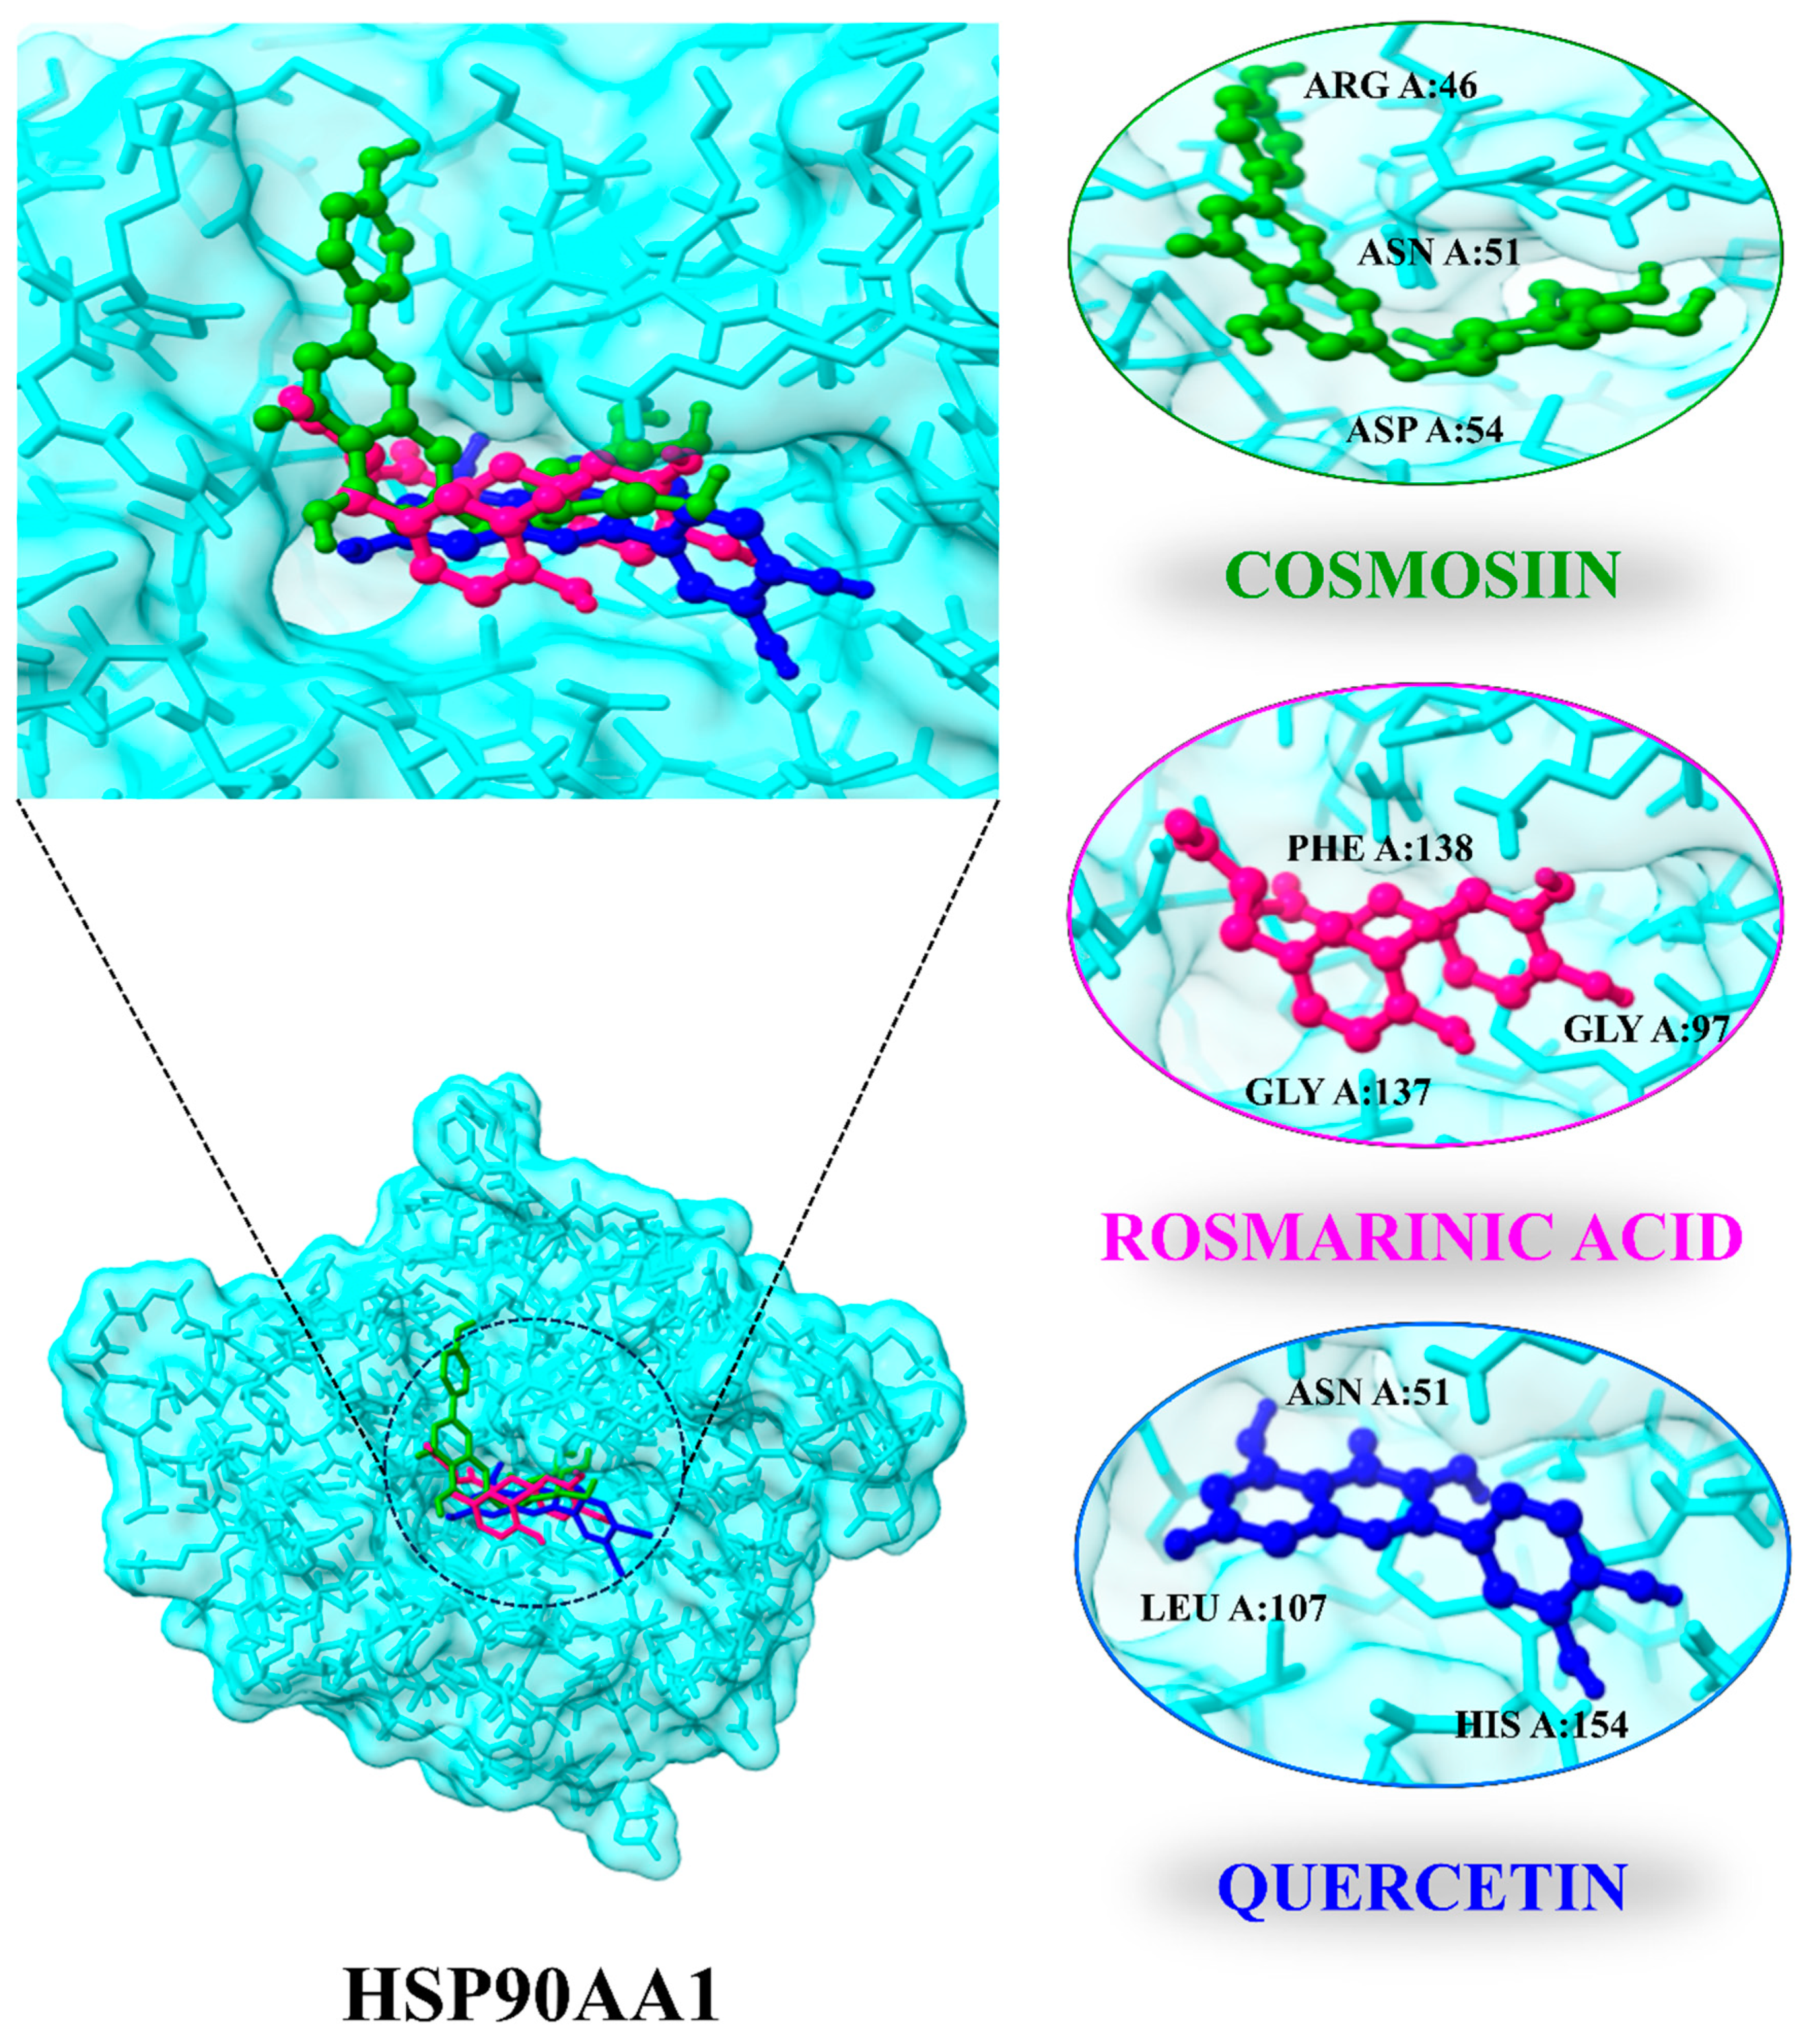
Ten compounds were docked with the HSP90AA1 (PDB ID: 4BQG) target protein in this experiment. All compounds demonstrated good binding and a high degree of matching with the target protein. Moreover, alvespimycin [53,54] was identified as a positive control drug of HSP90AA1. The results demonstrated that HSP90AA1 has a higher binding affinity with cosmosiin (−7.3 kJ mol), rosmarinic acid (−7.2 kJ/mol), quercetin (−6.7 kJ /mol), and rubinin (−6.7 kJ/mol) compared to alvespimycin (−6.0 kJ/mol). Cosmosiin and rosmarinic acid side chains form hydrogen bonds with ARG A:46, ASN A:51, and ASP A:54 and with LYA A:58, GLY A:97, MET A:98, and GLY A:137, respectively, while quercetin side chains form hydrogen bonds with ASN A:51, GLY A:97, NET A:98, LEU A:107, and HIS A:154. Rubinin side chains also form stable bonds with ASN A:51, ALA A:55, LYS A:58, MET, and A:98 residues. As a result, these findings suggest that active C. myxa components bind stably to the HSP90AA1 target protein and serve as an LC repressor. Additionally, subsequent research will concentrate on the active ingredients binding pockets with the core protein (Figure 8; Table 3). In comparison with control drug, all compounds show stable binding with ASN A:51 residue except rosmarinic acid. The RMSD of cosmosiin (1.183 Å), rosmarinic acid (2.552 Å), and quercetin (1.136 Å) is lower compared to alvespimycin (2.631 Å) suggesting these have potential to effectively bind with the binding pocket of the target protein.

3.8. Molecular Dynamic Simulation

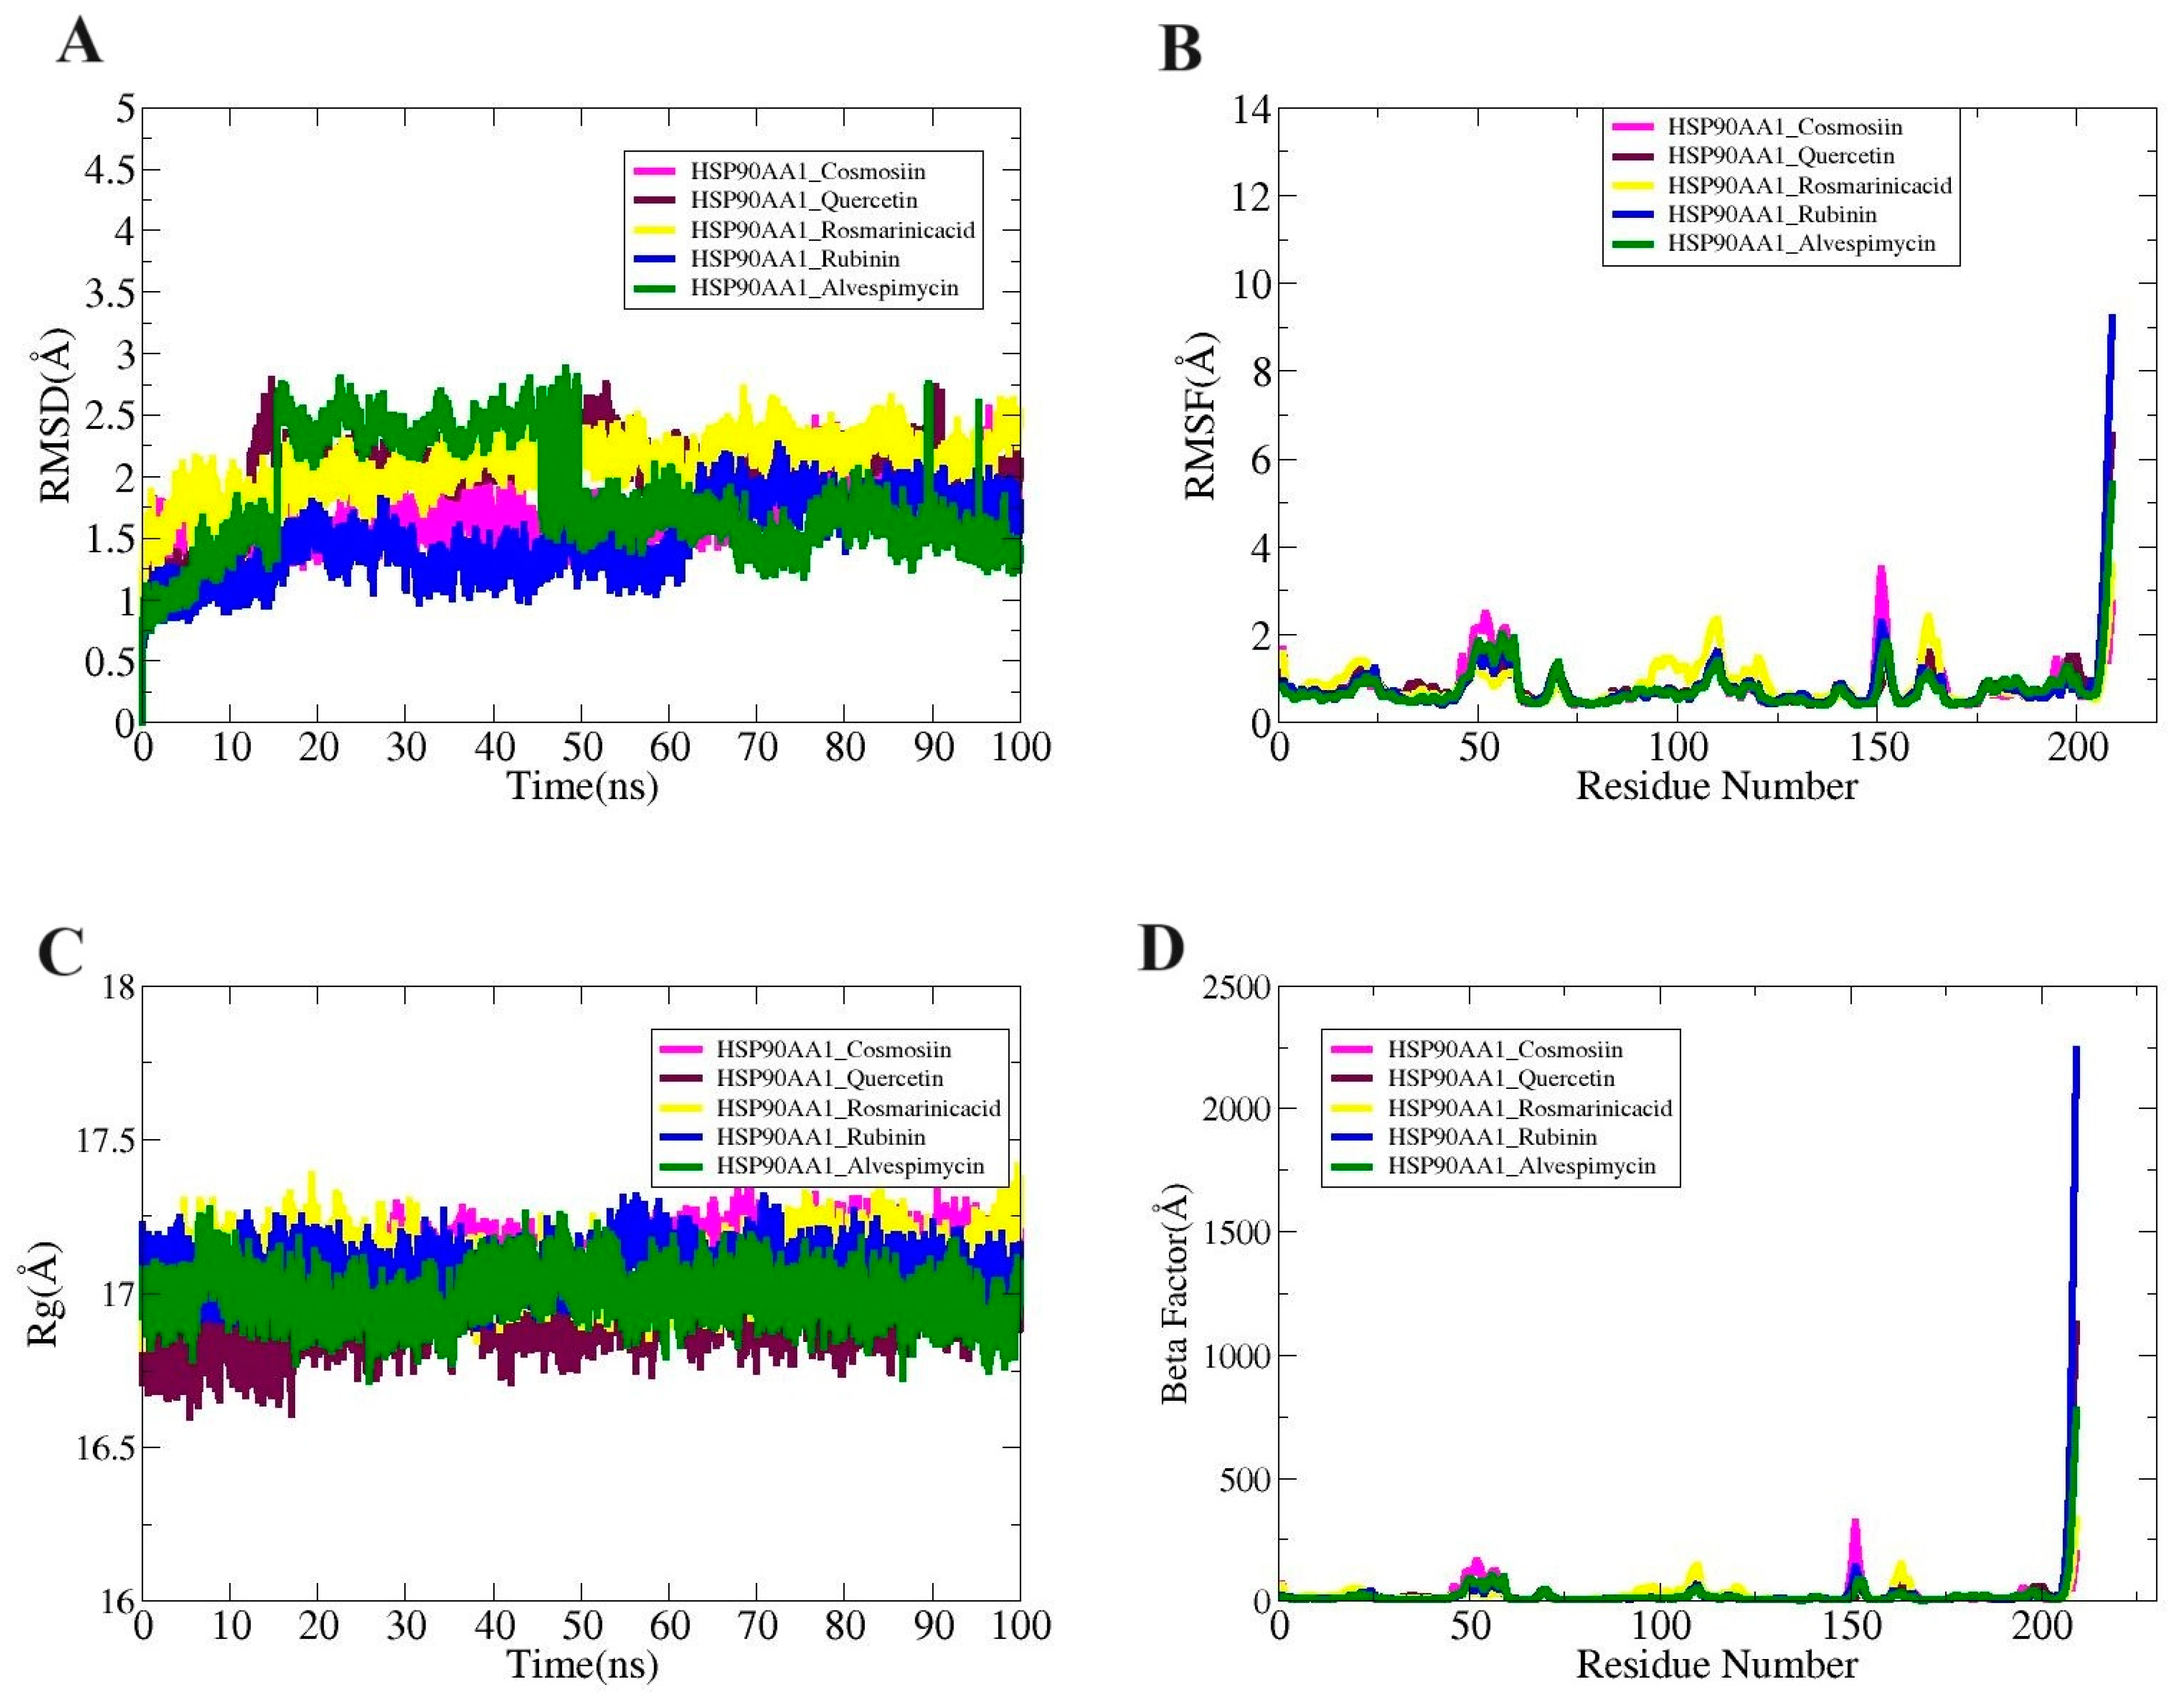
Molecular dynamic simulation studies essentially validate the dynamic behavior of macromolecules. Radius of gyration (RoG), root mean square fluctuation (RMSF), and root mean square deviation (RMSD) are all included in the simulations analysis. The carbon alpha atom of the complexes served as the basis for all of these investigations. These studies sought to determine whether interactions between the ligand and receptor persisted during the simulation period and whether the binding was stable. Ensuring that the ligand is correctly delivered to the HSP90AA1 target protein is dependent on stable receptor–ligand interaction. There were no obvious structural alterations at first, as seen by the systems’ uniform RMSD plot.
While the greatest values of the systems’ root mean square deviation (RMSD) ranged <3 Å, the mean values of HSP90AA1_Cosmosiin, HSP90AA1_Quercetin, HSP90AA1_Rosmarinic acid, HSP90AA1_ Rubinin, and HSP90AA1_Alvespimycin were determined to be 1.71 Å, 2.02 Å, 2.08 Å,1.49 Å, and 1.81 Å, respectively (Figure 9A). Secondly, the RMSF was computed to disclose details regarding the adaptability of the receptor residues when the ligand molecule is present (Figure 9B). The majority of system residues fell under the average stability range (<5 Å). The root mean square fluctuation (RMSF) for HSP90AA1_Cosmosiin, HSP90AA1_Quercetin, HSP90AA1_Rosmarinic acid, HSP90AA1_ Rubinin, and HSP90AA1_Alvespimycin was 3.48Å, 6.54Å, 3.55 Å, 9.12 Å, and 5.87 Å at the maximum; 0.80Å, 0.84 Å, 0.86 Å, 0.67 Å, and 0.60 Å at the mean; and 0.40 Å, 0.40 Å, 0.43 Å, 0.31 Å, and 0.39 Å at the lowest value. It was demonstrated that the loop pressure within the system was the cause of the greater degree of flexibility observed in certain of the residues. Using the RoG analysis, the system’s compactness was examined over time. These differences did not impact the manner in which ligands bound to the receptors, however. The RoG maximum values of 17.36 Å, 17.21 Å, 17.41 Å, 17.31 Å, and 17.27 Å; mean values of 17.09 Å, 16.90 Å, 17.09 Å, 17.08 Å, and 16.99 Å; and minimum values of 16.75 Å, 16.59 Å, 16.82 Å, 16.88 Å, and 16.71 Å were observed for HSP90AA1_Cosmosiin, HSP90AA1_Quercetin, HSP90AA1_Rosmarinic acid, HSP90AA1_ Rubinin, and HSP90AA1_Alvespimycin, respectively (Figure 9C). By the end of the simulation, RMSD showed that every system was compact and had not undergone any significant changes. The following findings were obtained from the Beta Factor study: According to Figure 9D, the mean values of HSP90AA1_Cosmosiin, HSP90AA1_Quercetin, HSP90AA1_Rosmarinic acid, HSP90AA1_Rubinin, and HSP90AA1_Alvespimycin were 23.02 Å, 28.05 Å, 24.58 Å, 35.53 Å, and 23.19 Å; the lowest values were 4.24 Å, 4.27 Å, 4.94 Å, 4.21 Å, and 3.95 Å; and the maximum values were 320.20 Å, 1128.2 Å, and 33.3 Å, 2239.78 Å, and 776.08 Å.

3.9. Solvent-Accessible Surface Area Analysis

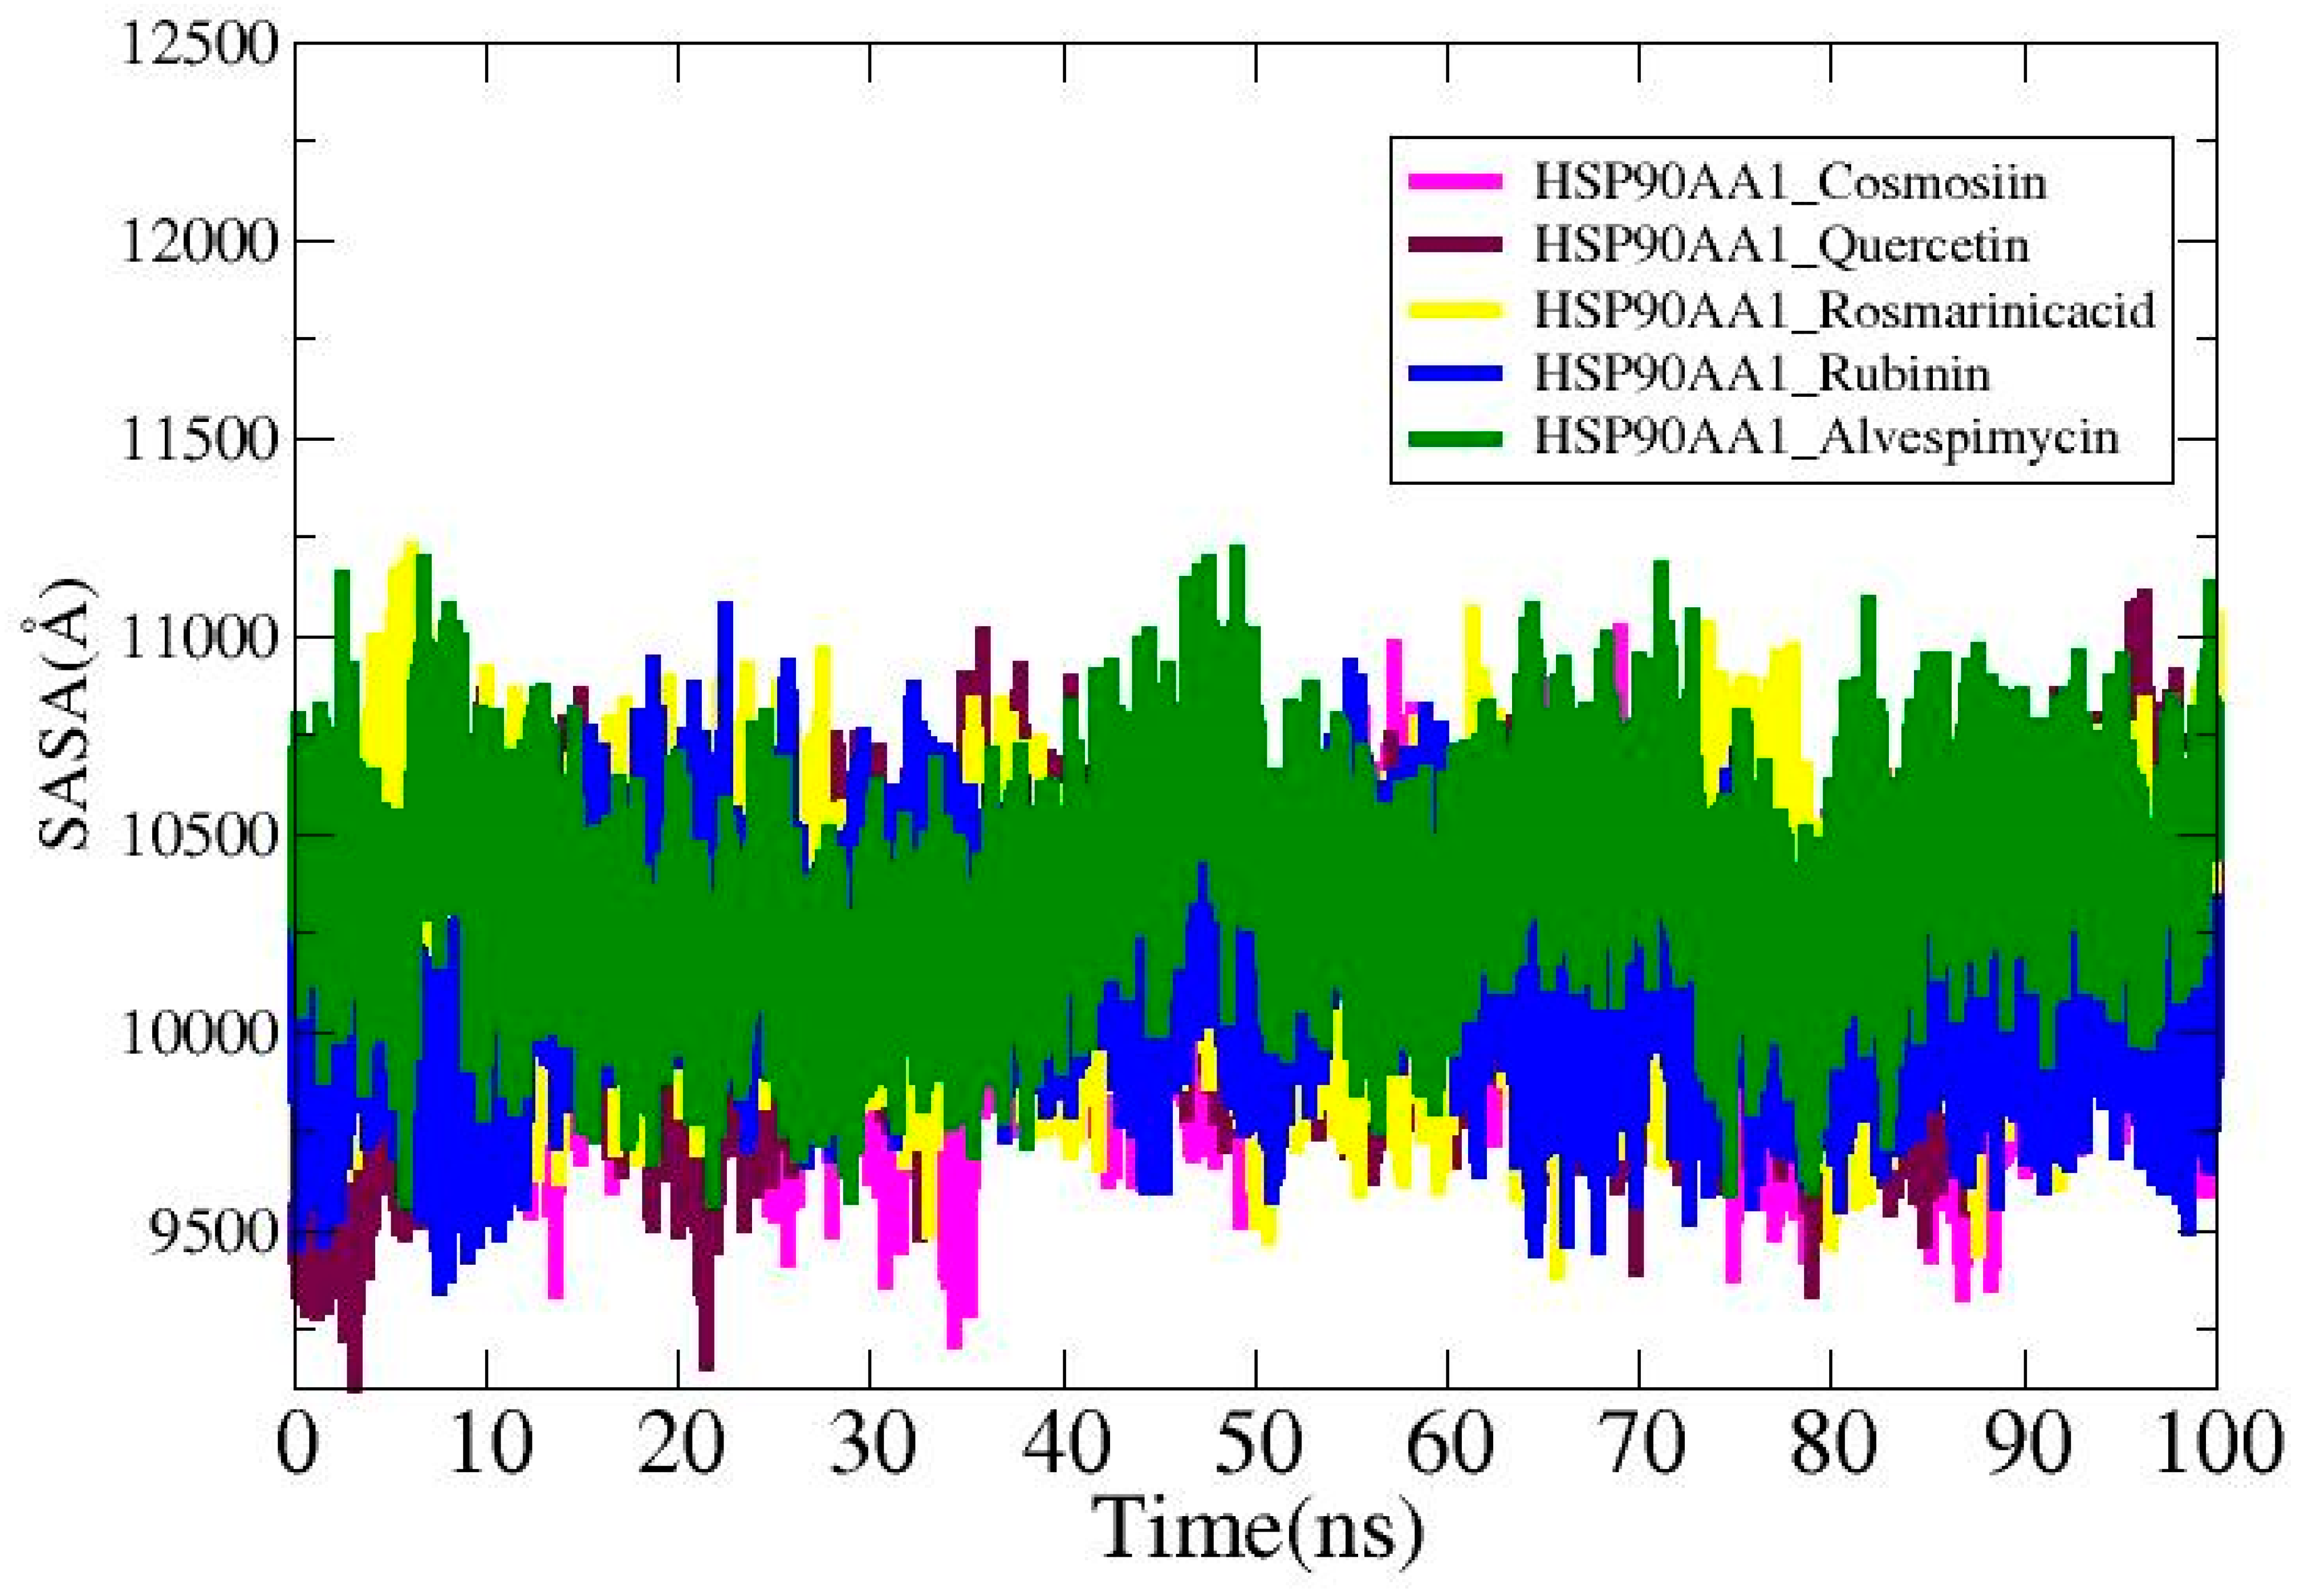
Solvent-accessible surface area (SASA) study was carried out for the ligands in order to find out more about the surface area of the HSP90AA1 that interacts with the solvent molecules. The average values for the systems are HSP90AA1_Cosmosiin (10,096.2 Å2), HSP90AA1_Quercetin (10,143.4 Å2), HSP90AA1_Rosmarinic acid (10,249.5 Å2), HSP90AA1_ Rubinin (10,135.2 Å2), and HSP90AA1_Alvespimycin (10,357.6 Å2). The lowest SASA values for HSP90AA1_Cosmosiin, HSP90AA1_Quercetin, HSP90AA1_Rosmarinic acid, HSP90AA1_ Rubinin, and HSP90AA1_Alvespimycin were 9221.03 Å2, 9107.7 Å2, 9397.7 Å2, 9358.71 Å2, and 9576.98 Å2, as shown in Figure 10. The highest values recorded were 11,016 Å2, 11,103.4 Å2, 11,218.4 Å2, 11,068 Å2, and 11,208 Å2 in that order. Plots display the notable differences that are seen upon ligand binding.

3.10. MMPB/GBSA Analysis

The docked complexes that were selected underwent an investigation using the MMPB/GBSA method. These techniques are considered more successful in determining the binding affinity between the docked ligand and the receptor protein. The formation of strong intermolecular systems and stable complexes is evident from the highly negative net binding energies observed in all the docked and control complexes. The dominant force responsible for the stability of the complexes is the van der Waals force, which ensures the docking of the ligands at the designated site and stabilizes the systems. Specifically, the net van der Waals energies of HSP90AA1_Cosmosiin, HSP90AA1_Quercetin, HSP90AA1_Rosmarinic acid, HSP90AA1_ Rubinin, and HSP90AA1_Alvespimycin were found to be −41.25 kcal/mol, −46.01 kcal/mol, −44.69 kcal/mol, −51.01 kcal/mol, and −55.94 kcal/mol, respectively.
Furthermore, the electrostatic energies of each docked complex were remarkably consistent. Among all the computed energies, the solvation energy had the least impact and made a negative contribution to the net energy. In MM-GBSA, the net solvation energies for HSP90AA1_Cosmosiin, HSP90AA1_Quercetin, HSP90AA1_Rosmarinic acid, HSP90AA1_Rubinin, and HSP90AA1_Alvespimycin were 8.08 kcal/mol, 7.14 kcal/mol, 7.78 kcal/mol, 8.66 kcal/mol, and 8.09 kcal/mol, respectively. On the other hand, in MM/PBSA, the net solvation energies for the same compounds were 7.52 kcal/mol, 8.06 kcal/mol, 7.65 kcal/mol, 8.16 kcal/mol, and 8.04 kcal/mol, respectively. Additional details regarding the energy terms and their corresponding values can be found in Table 4.

4. Discussion

Disease treatments with many components and different targets have received increased interest, and this is one of the benefits of traditional Chinese medicine. C. myxa has traditionally been used in folk medicine. Many of its constituents have been demonstrated in studies to have anti-cancer properties and can help prevent the development of LC [55]. However, the precise processes of C. myxa in LC therapy have not yet been fully established. The active components of C. myxa and the mechanisms linked with the therapeutic effect of C. myxa on LC were investigated using network pharmacology, survival analysis, and molecular docking.
In the current investigation, the active components and associated targets of C. myxa were screened from the IMPPAT, Swiss Target Prediction, and STITCH databases. DEGs were extracted from LC datasets GSE39791, GSE76427, GSE22058, GSE87630, and GSE112790 using the p-value < 0.05 and logFC > 1 for up- and logFC < −1 for down-regulated genes [56]. Plant-related and disease-related DEGs were intersected to find overlapping targets, and 173 potential target genes were found. Using the degree threshold, 10 hub genes were identified from the PPI network.
The GO functional enrichment study revealed that the hub genes were related with GO keywords such as drug response, inflammatory response, ethanol response, positive regulation of cell proliferation, plasma membrane, cytosol, endoplasmic reticulum membrane, extracellular exosome, identical protein binding, protein heterodimerization activity, and binding of zinc ion. The KEGG pathways related to the hub genes include metabolic pathways, cAMP signaling pathway, cancer pathway, alcoholic liver disease, AGE-RAGE signaling pathway in diabetic complications, IL-17 signaling pathway, and AMPK signaling pathway. After a survival analysis, and drug–target–pathway analysis, five hub genes (HSP90AA1, ESR1, CYP3A4, CDK1, and MMP9) were discovered to be involved in the overall survival of LC patients. These five genes have been identified as targets of C. myxa’s active constituents associated with LC, making them the most dependable genes for use in clinical studies.
The results of the network analysis and survival analysis indicated HSP90AA1 as an important protective factor in LC treatment. Higher HSP90AA1 expression is linked to depression in HCC patients [57]. From survival and network analysis, one essential target HSP90AA1 was tested for anti-LC effectiveness by binding with ten active components of C. myxa. The docking analysis results confirmed our findings, which revealed that the chemicals cosmosiin, rosmarinic acid, quercetin, and rubinin can have stable interactions with the binding sites of the target gene. The binding affinity and RMSD value indicate that the active constituents of C. myxa have higher binding affinity and lower RMSD compared to the positive control drug alvespimycin, which indicates that these constituents have more potential and stable binding with HSP90AA1.
Animal models play a crucial role in understanding the role of HSP90AA1 in liver cancer. Research has shown that targeting HSP90AA1 can lead to inhibition of cancer cell proliferation and survival, making it a potential therapeutic target [57,58]. These animal models allow researchers to study the effects of HSP90AA1 inhibition on tumor growth, metastasis, and response to treatment, providing essential data for the development of novel cancer therapies [59].
The molecular dynamic simulation, solvent-accessible surface area (SASA) analysis, and MMPB/GBSA analysis provided insightful data on the interactions between the HSP90AA1 target protein and various ligands, including cosmosiin, quercetin, rosmarinic acid, rubinin, and alvespimycin. Firstly, the RMSD analysis revealed stable receptor–ligand interactions throughout the simulation period, with RMSD values indicating minimal deviation from the initial structure. Notably, all systems maintained RMSD values below 3 Å, suggesting structural stability. However, subtle differences were observed in the mean RMSD values, with rubinin displaying the lowest mean deviation of 1.49 Å, indicating slightly tighter binding compared to other ligands. Secondly, RMSF analysis provided insights into the flexibility of receptor residues in the presence of ligands. While most residues exhibited average stability (<5 Å), notable variations were observed among the ligands. Rubinin exhibited the highest RMSF values, indicating greater flexibility, potentially due to loop pressure within the system. Furthermore, RoG analysis indicated consistent compactness of the systems over time, with minimal impact on ligand–receptor binding. However, slight differences were observed in maximum, mean, and minimum RoG values among the ligands, suggesting subtle variations in complex conformation. The SASA analysis revealed differences in the surface area of HSP90AA1 interacting with solvent molecules upon ligand binding. While all ligands displayed similar average SASA values, variations were observed in the lowest and highest SASA values, indicating distinct solvent accessibility patterns influenced by ligand structure. Finally, MMPB/GBSA analysis provided insights into the binding affinity and stability of the complexes. Highly negative net binding energies indicated strong intermolecular interactions and stable complexes for all ligands. Van der Waals forces predominantly contributed to complex stability, with electrostatic energies showing remarkable consistency across complexes.
As a result, this network-pharmacology-based investigation elaborates the mechanism of action of active drugs, their associated probable target genes, and link pathways to treat LC, laying the groundwork for additional experimental validation of the findings. Despite the fact that we have presented some intriguing data, more research and clinical studies are required to better investigate the potential of C. myxa and prove its medicinal potential.

5. Conclusions

This investigation elucidates the efficacy of multicomponent, multi-target drug combinations and uncovers novel therapeutic targets for LC treatment. Through the integration of network pharmacology, survival analysis, molecular docking, and molecular dynamics simulations, a comprehensive understanding of the molecular mechanisms underlying C. myxa in LC therapy has been achieved. The network analysis highlights the multi-targeting nature of C. myxa compounds, concurrently impacting multiple pathways implicated in LC progression. Particularly, the identification of the HSP90AA1 gene as a promising therapeutic target offers potential avenues for LC prevention and intervention, with the prospect of enhancing treatment efficacy. Despite these advancements, it is imperative to acknowledge the inherent limitations of the present study, underscoring the need for further phytochemical and pharmacological investigations to validate and expand upon our findings. This research establishes a robust scientific framework for exploring the therapeutic potential of C. myxa in LC management, paving the way for future studies aimed at optimizing its clinical application and improving patient outcomes.

Author Contributions

Conceptualization, Z.T.M. and C.J.B.; methodology, A.H.M. and N.A.A. (Nazar Aziz Audaand); software, Z.T.M.; validation, Z.T.M. and C.J.B.; formal analysis, L.L. and N.A.A. (Nazar Aziz Audaand); investigation, A.H.M.; resources, C.J.B.; data curation, L.L. and S.M.S.A.; writing—original draft preparation, L.L., N.A.A. (Nazar Aziz Audaand) and N.A.A. (Norah A. Albekairi); writing—review and editing, Z.T.M. and C.J.B.; visualization, L.L.; supervision, Z.T.M.; project administration, C.J.B.; funding acquisition, N.A.A. (Nazar Aziz Audaand) and C.J.B. All authors have read and agreed to the published version of the manuscript.

Funding

This research received no external funding.

Institutional Review Board Statement

Not applicable.

Informed Consent Statement

Not applicable.

Data Availability Statement

All the data are available publicly and within the article.

Acknowledgments

“Supported by the Fundamental Research Funds for the Central Universities” 0213-14380238. Authors are thankful to the Researchers Supporting Project number (RSPD2024R1035), King Saud University, Riyadh, Saudi Arabia.

Conflicts of Interest

The authors declare no conflicts of interest.

References

  1. Shao, C.; Zhang, Q.; Kuang, G.; Fan, Q.; Ye, F. Construction and application of liver cancer models in vitro. Eng. Regen. 2022, 3, 310–322. [Google Scholar] [CrossRef]
  2. Siegel, R.L.; Miller, K.D.; Jemal, A. Cancer statistics, 2019. CA Cancer J. Clin. 2019, 69, 7–34. [Google Scholar] [CrossRef] [PubMed]
  3. Smittenaar, C.R.; Petersen, K.A.; Stewart, K.; Moitt, N. Cancer incidence and mortality projections in the UK until 2035. Br. J. Cancer 2016, 115, 1147–1155. [Google Scholar] [CrossRef]
  4. Bray, F.; Ferlay, J.; Soerjomataram, I.; Siegel, R.L.; Torre, L.A.; Jemal, A. Global cancer statistics 2018: GLOBOCAN estimates of incidence and mortality worldwide for 36 cancers in 185 countries. CA Cancer J. Clin. 2018, 68, 394–424. [Google Scholar] [CrossRef] [PubMed]
  5. Fung, J.; Lai, C.-L.; Yuen, M.-F. Hepatitis B and C virus-related carcinogenesis. Clin. Microbiol. Infect. 2009, 15, 964–970. [Google Scholar] [CrossRef]
  6. Cheng, H.; Sun, G.; Chen, H.; Li, Y.; Han, Z.; Li, Y.; Zhang, P.; Yang, L.; Li, Y. Trends in the treatment of advanced hepatocellular carcinoma: Immune checkpoint blockade immunotherapy and related combination therapies. Am. J. Cancer Res. 2019, 9, 1536. [Google Scholar] [PubMed]
  7. Al-Khafaji, S.A.; Alsaadawi, M.A.; Al-Yasari, A.M.; Al-Saadawe, M.A. Article Review: Cordia myxa L.: The Gift of the Nature, A Review. Basrah J. Agric. Sci. 2021, 34, 267–277. [Google Scholar] [CrossRef]
  8. Inas, Z.A.; Hala, A.K.; Gehan, H.H. Gastroprotective effect of Cordia myxa L. fruit extract against indomethacin-induced gastric ulceration in rats. Life Sci. J. 2011, 8, 433–445. [Google Scholar]
  9. Al-Snafi, A.E. The Pharmacological and therapeutic importance of Cordia myxa—A review. IOSR J. Pharm. 2016, 6, 47–57. [Google Scholar]
  10. Casas, A.I.; Hassan, A.A.; Larsen, S.J.; Gomez-Rangel, V.; Elbatreek, M.; Kleikers, P.W.M.; Guney, E.; Egea, J.; López, M.G.; Baumbach, J. From single drug targets to synergistic network pharmacology in ischemic stroke. Proc. Natl. Acad. Sci. USA 2019, 116, 7129–7136. [Google Scholar] [CrossRef]
  11. Guan, N.; Wang, C.; Zhang, L.; Huang, L.; Li, J.; Piao, X. In silico prediction of potential miRNA-disease association using an integrative bioinformatics approach based on kernel fusion. J. Cell. Mol. Med. 2020, 24, 573–587. [Google Scholar] [CrossRef]
  12. Yao, J.; Zhang, Z.; Li, S.; Li, B.; Wang, X. Melittin inhibits proliferation, migration and invasion of bladder cancer cells by regulating key genes based on bioinformatics and experimental assays. J. Cell. Mol. Med. 2020, 24, 655–670. [Google Scholar] [CrossRef]
  13. Batool, S.; Javed, M.R.; Aslam, S.; Noor, F.; Javed, H.M.F.; Seemab, R.; Rehman, A.; Aslam, M.F.; Paray, B.A.; Gulnaz, A. Network Pharmacology and Bioinformatics Approach Reveals the Multi-Target Pharmacological Mechanism of Fumaria indica in the Treatment of Liver Cancer. Pharmaceuticals 2022, 15, 654. [Google Scholar] [CrossRef]
  14. Sadaqat, M.; Qasim, M.; Tahir ul Qamar, M.; Masoud, M.S.; Ashfaq, U.A.; Noor, F.; Fatima, K.; Allemailem, K.S.; Alrumaihi, F.; Almatroudi, A. Advanced network pharmacology study reveals multi-pathway and multi-gene regulatory molecular mechanism of Bacopa monnieri in liver cancer based on data mining, molecular modeling, and microarray data analysis. Comput. Biol. Med. 2023, 161, 107059. [Google Scholar] [CrossRef]
  15. Mohanraj, K.; Karthikeyan, B.S.; Vivek-Ananth, R.P.; Chand, R.P.; Aparna, S.R.; Mangalapandi, P.; Samal, A. IMPPAT: A curated database of Indian medicinal plants, phytochemistry and therapeutics. Sci. Rep. 2018, 8, 4329. [Google Scholar] [CrossRef]
  16. Bakchi, B.; Krishna, A.D.; Sreecharan, E.; Ganesh, V.B.J.; Niharika, M.; Maharshi, S.; Puttagunta, S.B.; Sigalapalli, D.K.; Bhandare, R.R.; Shaik, A.B. An Overview on Applications of SwissADME Web Tool in the Design and Development of Anticancer, Antitubercular and Antimicrobial agents: A Medicinal Chemist’s Perspective. J. Mol. Struct. 2022, 1259, 132712. [Google Scholar] [CrossRef]
  17. Molsoft, L.L.C. Drug-Likeness and Molecular Property Prediction; Molsoft, L.L.C.: San Diego, CA, USA, 2018. [Google Scholar]
  18. Aungst, B.J. Optimizing oral bioavailability in drug discovery: An overview of design and testing strategies and formulation options. J. Pharm. Sci. 2017, 106, 921–929. [Google Scholar] [CrossRef]
  19. Jia, C.-Y.; Li, J.-Y.; Hao, G.-F.; Yang, G.-F. A drug-likeness toolbox facilitates ADMET study in drug discovery. Drug Discov. Today 2020, 25, 248–258. [Google Scholar] [CrossRef]
  20. Kim, S.; Thiessen, P.A.; Bolton, E.E.; Chen, J.; Fu, G.; Gindulyte, A.; Han, L.; He, J.; He, S.; Shoemaker, B.A.; et al. PubChem substance and compound databases. Nucleic Acids Res. 2016, 44, D1202–D1213. [Google Scholar] [CrossRef]
  21. Bento, A.P.; Hersey, A.; Félix, E.; Landrum, G.; Gaulton, A.; Atkinson, F.; Bellis, L.J.; De Veij, M.; Leach, A.R. An open source chemical structure curation pipeline using RDKit. J. Cheminform. 2020, 12, 51. [Google Scholar] [CrossRef]
  22. Daina, A.; Michielin, O.; Zoete, V. SwissTargetPrediction: Updated data and new features for efficient prediction of protein targets of small molecules. Nucleic Acids Res. 2019, 47, W357–W364. [Google Scholar] [CrossRef]
  23. Kuhn, M.; von Mering, C.; Campillos, M.; Jensen, L.J.; Bork, P. STITCH: Interaction networks of chemicals and proteins. Nucleic Acids Res. 2007, 36, D684–D688. [Google Scholar] [CrossRef]
  24. Kohl, M.; Wiese, S.; Warscheid, B. Cytoscape: Software for visualization and analysis of biological networks. In Data Mining in Proteomics; Springer: Berlin/Heidelberg, Germany, 2011; pp. 291–303. [Google Scholar]
  25. Barrett, T.; Wilhite, S.E.; Ledoux, P.; Evangelista, C.; Kim, I.F.; Tomashevsky, M.; Marshall, K.A.; Phillippy, K.H.; Sherman, P.M.; Holko, M. NCBI GEO: Archive for functional genomics data sets—Update. Nucleic Acids Res. 2012, 41, D991–D995. [Google Scholar] [CrossRef]
  26. Smyth, G.K. Limma: Linear models for microarray data. In Bioinformatics and Computational Biology Solutions Using R and Bioconductor; Springer: Berlin/Heidelberg, Germany, 2005; pp. 397–420. [Google Scholar]
  27. Dennis, G.; Sherman, B.T.; Hosack, D.A.; Yang, J.; Gao, W.; Lane, H.C.; Lempicki, R.A. DAVID: Database for annotation, visualization, and integrated discovery. Genome Biol. 2003, 4, P3. [Google Scholar] [CrossRef]
  28. Wickham, H.; Chang, W.; Wickham, M.H. Package ‘ggplot2’: Create Elegant Data Visualisations Using the Grammar of Graphics Version; R Software Inc.: New York, NY, USA, 2016; Volume 2, pp. 1–189. [Google Scholar]
  29. von Mering, C.; Huynen, M.; Jaeggi, D.; Schmidt, S.; Bork, P.; Snel, B. STRING: A database of predicted functional associations between proteins. Nucleic Acids Res. 2003, 31, 258–261. [Google Scholar] [CrossRef]
  30. Chin, C.-H.; Chen, S.-H.; Wu, H.-H.; Ho, C.-W.; Ko, M.-T.; Lin, C.-Y. cytoHubba: Identifying hub objects and sub-networks from complex interactome. BMC Syst. Biol. 2014, 8, S11. [Google Scholar] [CrossRef]
  31. Tang, Z.; Kang, B.; Li, C.; Chen, T.; Zhang, Z. GEPIA2: An enhanced web server for large-scale expression profiling and interactive analysis. Nucleic Acids Res. 2019, 47, W556–W560. [Google Scholar] [CrossRef]
  32. Sedgwick, P. How to read a Kaplan-Meier survival plot. BMJ 2014, 349, g5608. [Google Scholar] [CrossRef]
  33. Paulussen, M.; Ahrens, S.; Burdach, S.; Craft, A.; Dockhorn-Dworniczak, B.; Dunst, J.; Fröhlich, B.; Winkelmann, W.; Zoubek, A.; Jürgens, H. Primary metastatic (stage IV) Ewing tumor: Survival analysis of 171 patients from the EICESS studies. Ann. Oncol. 1998, 9, 275–281. [Google Scholar] [CrossRef]
  34. Kouranov, A.; Xie, L.; de la Cruz, J.; Chen, L.; Westbrook, J.; Bourne, P.E.; Berman, H.M. The RCSB PDB information portal for structural genomics. Nucleic Acids Res. 2006, 34, D302–D305. [Google Scholar] [CrossRef]
  35. Pettersen, E.F.; Goddard, T.D.; Huang, C.C.; Couch, G.S.; Greenblatt, D.M.; Meng, E.C.; Ferrin, T.E. UCSF Chimera—A visualization system for exploratory research and analysis. J. Comput. Chem. 2004, 25, 1605–1612. [Google Scholar] [CrossRef]
  36. Tian, W.; Chen, C.; Lei, X.; Zhao, J.; Liang, J. CASTp 3.0: Computed atlas of surface topography of proteins. Nucleic Acids Res. 2018, 46, W363–W367. [Google Scholar] [CrossRef]
  37. Dallakyan, S.; Olson, A.J. Small-molecule library screening by docking with PyRx. Chem. Biol. Methods Protoc. 2015, 1263, 243–250. [Google Scholar]
  38. Jejurikar, B.L.; Rohane, S.H. Drug designing in discovery studio. Asian J. Res. Chem 2021, 14, 135–138. [Google Scholar]
  39. Pettersen, E.F.; Goddard, T.D.; Huang, C.C.; Meng, E.C.; Couch, G.S.; Croll, T.I.; Morris, J.H.; Ferrin, T.E. UCSF ChimeraX: Structure visualization for researchers, educators, and developers. Protein Sci. 2021, 30, 70–82. [Google Scholar] [CrossRef]
  40. Salomon-ferrer, R.; Case, D.A.; Walker, R.C. An overview of the Amber biomolecular simulation package. Wiley Interdiscip. Rev. Comput. Mol. Sci. 2013, 3, 198–210. [Google Scholar] [CrossRef]
  41. Zhao, H.; Caflisch, A. Molecular dynamics in drug design. Eur. J. Med. Chem. 2015, 91, 4–14. [Google Scholar] [CrossRef]
  42. Shaikh, I.A.; Muddapur, U.M.; Krithika, C.; Badiger, S.; Kulkarni, M.; Mahnashi, M.H.; Alshamrani, S.A.; Huneif, M.A.; More, S.S.; Khan, A.A.; et al. In Silico Molecular Docking and Simulation Studies of Protein HBx Involved in the Pathogenesis of Hepatitis B Virus-HBV. Molecules 2022, 27, 1513. [Google Scholar] [CrossRef]
  43. Patel, L.; Shukla, T.; Huang, X.; Ussery, D.W.; Wang, S. Machine learning methods in drug discovery. Molecules 2020, 25, 5277. [Google Scholar] [CrossRef]
  44. Brogi, S.; Ramalho, T.C.; Kuca, K.; Medina-Franco, J.L.; Valko, M. Editorial: In silico Methods for Drug Design and Discovery. Front. Chem. 2020, 8, 612. [Google Scholar] [CrossRef]
  45. Macalino, S.J.Y.; Billones, J.B.; Organo, V.G.; Carrillo, M.C.O. In silico strategies in tuberculosis drug discovery. Molecules 2020, 25, 665. [Google Scholar] [CrossRef]
  46. Roe, D.R.; Cheatham, T.E., III. PTRAJ and CPPTRAJ: Software for processing and analysis of molecular dynamics trajectory data. J. Chem. Theory Comput. 2013, 9, 3084–3095. [Google Scholar] [CrossRef]
  47. Hou, T.; Wang, J.; Li, Y.; Wang, W. Assessing the performance of the MM/PBSA and MM/GBSA methods. 1. The accuracy of binding free energy calculations based on molecular dynamics simulations. J. Chem. Inf. Model. 2011, 51, 69–82. [Google Scholar] [CrossRef]
  48. Zhang, X.; Perez-Sanchez, H.; Lightstone, F.C. A Comprehensive Docking and MM/GBSA Rescoring Study of Ligand Recognition upon Binding Antithrombin. Curr. Top. Med. Chem. 2017, 17, 1631. [Google Scholar] [CrossRef]
  49. Miller III, B.R.; McGee Jr, T.D.; Swails, J.M.; Homeyer, N.; Gohlke, H.; Roitberg, A.E. MMPBSA. py: An efficient program for end-state free energy calculations. J. Chem. Theory Comput. 2012, 8, 3314–3321. [Google Scholar] [CrossRef]
  50. Li, A.P. Screening for human ADME/Tox drug properties in drug discovery. Drug Discov. Today 2001, 6, 357–366. [Google Scholar] [CrossRef]
  51. Fatima, K.; Ali, U.; Tahir, M.; Asif, M.; Haque, A.; Qasim, M.; Alamri, M.A.; Tariq, Z.; Noor, F.; Sadaqat, M. South African Journal of Botany Advanced network pharmacology and molecular docking-based mechanism study to explore the multi-target pharmacological mechanism of Cymbopogon citratus against Alzheimer’ s disease. South Afr. J. Bot. 2024, 165, 466–477. [Google Scholar] [CrossRef]
  52. Ma, C.; Xu, T.; Sun, X.; Zhang, S.; Liu, S.; Fan, S.; Lei, C.; Tang, F.; Zhai, C.; Li, C. Network pharmacology and bioinformatics approach reveals the therapeutic mechanism of action of baicalein in hepatocellular carcinoma. Evid. Based Complement. Altern. Med. 2019, 2019, 7518374. [Google Scholar] [CrossRef]
  53. Overington, J.P.; Al-Lazikani, B.; Hopkins, A.L. How many drug targets are there? Nat. Rev. Drug Discov. 2006, 5, 993–996. [Google Scholar] [CrossRef]
  54. Imming, P.; Sinning, C.; Meyer, A. Drugs, their targets and the nature and number of drug targets. Nat. Rev. Drug Discov. 2006, 5, 821–834. [Google Scholar] [CrossRef]
  55. Oza, M.J.; Kulkarni, Y.A. Traditional uses, phytochemistry and pharmacology of the medicinal species of the genus Cordia (Boraginaceae). J. Pharm. Pharmacol. 2017, 69, 755–789. [Google Scholar] [CrossRef] [PubMed]
  56. Chen, Y.; Zhang, J.; Li, F. Inhibitory role of remifentanil in hepatic ischemia-reperfusion injury through activation of Fmol/Parkin signaling pathway: A study based on network pharmacology analysis and high-throughput sequencing. Phytomedicine 2024, 128, 155300. [Google Scholar] [CrossRef] [PubMed]
  57. Xiang, X.; You, X.-M.; Li, L.-Q. Expression of HSP90AA1/HSPA8 in hepatocellular carcinoma patients with depression. Onco. Targets. Ther. 2018, 11, 3013. [Google Scholar] [CrossRef] [PubMed]
  58. Fornari, F.; Giovannini, C.; Piscaglia, F.; Gramantieri, L. Animal models of hepatocellular carcinoma: Current applications in clinical research. J. Hepatocell. Carcinoma 2022, 9, 1263–1278. [Google Scholar] [CrossRef]
  59. Li, Y.; Tang, Z.-Y.; Hou, J.-X. Hepatocellular carcinoma: Insight from animal models. Nat. Rev. Gastroenterol. Hepatol. 2012, 9, 32–43. [Google Scholar] [CrossRef]
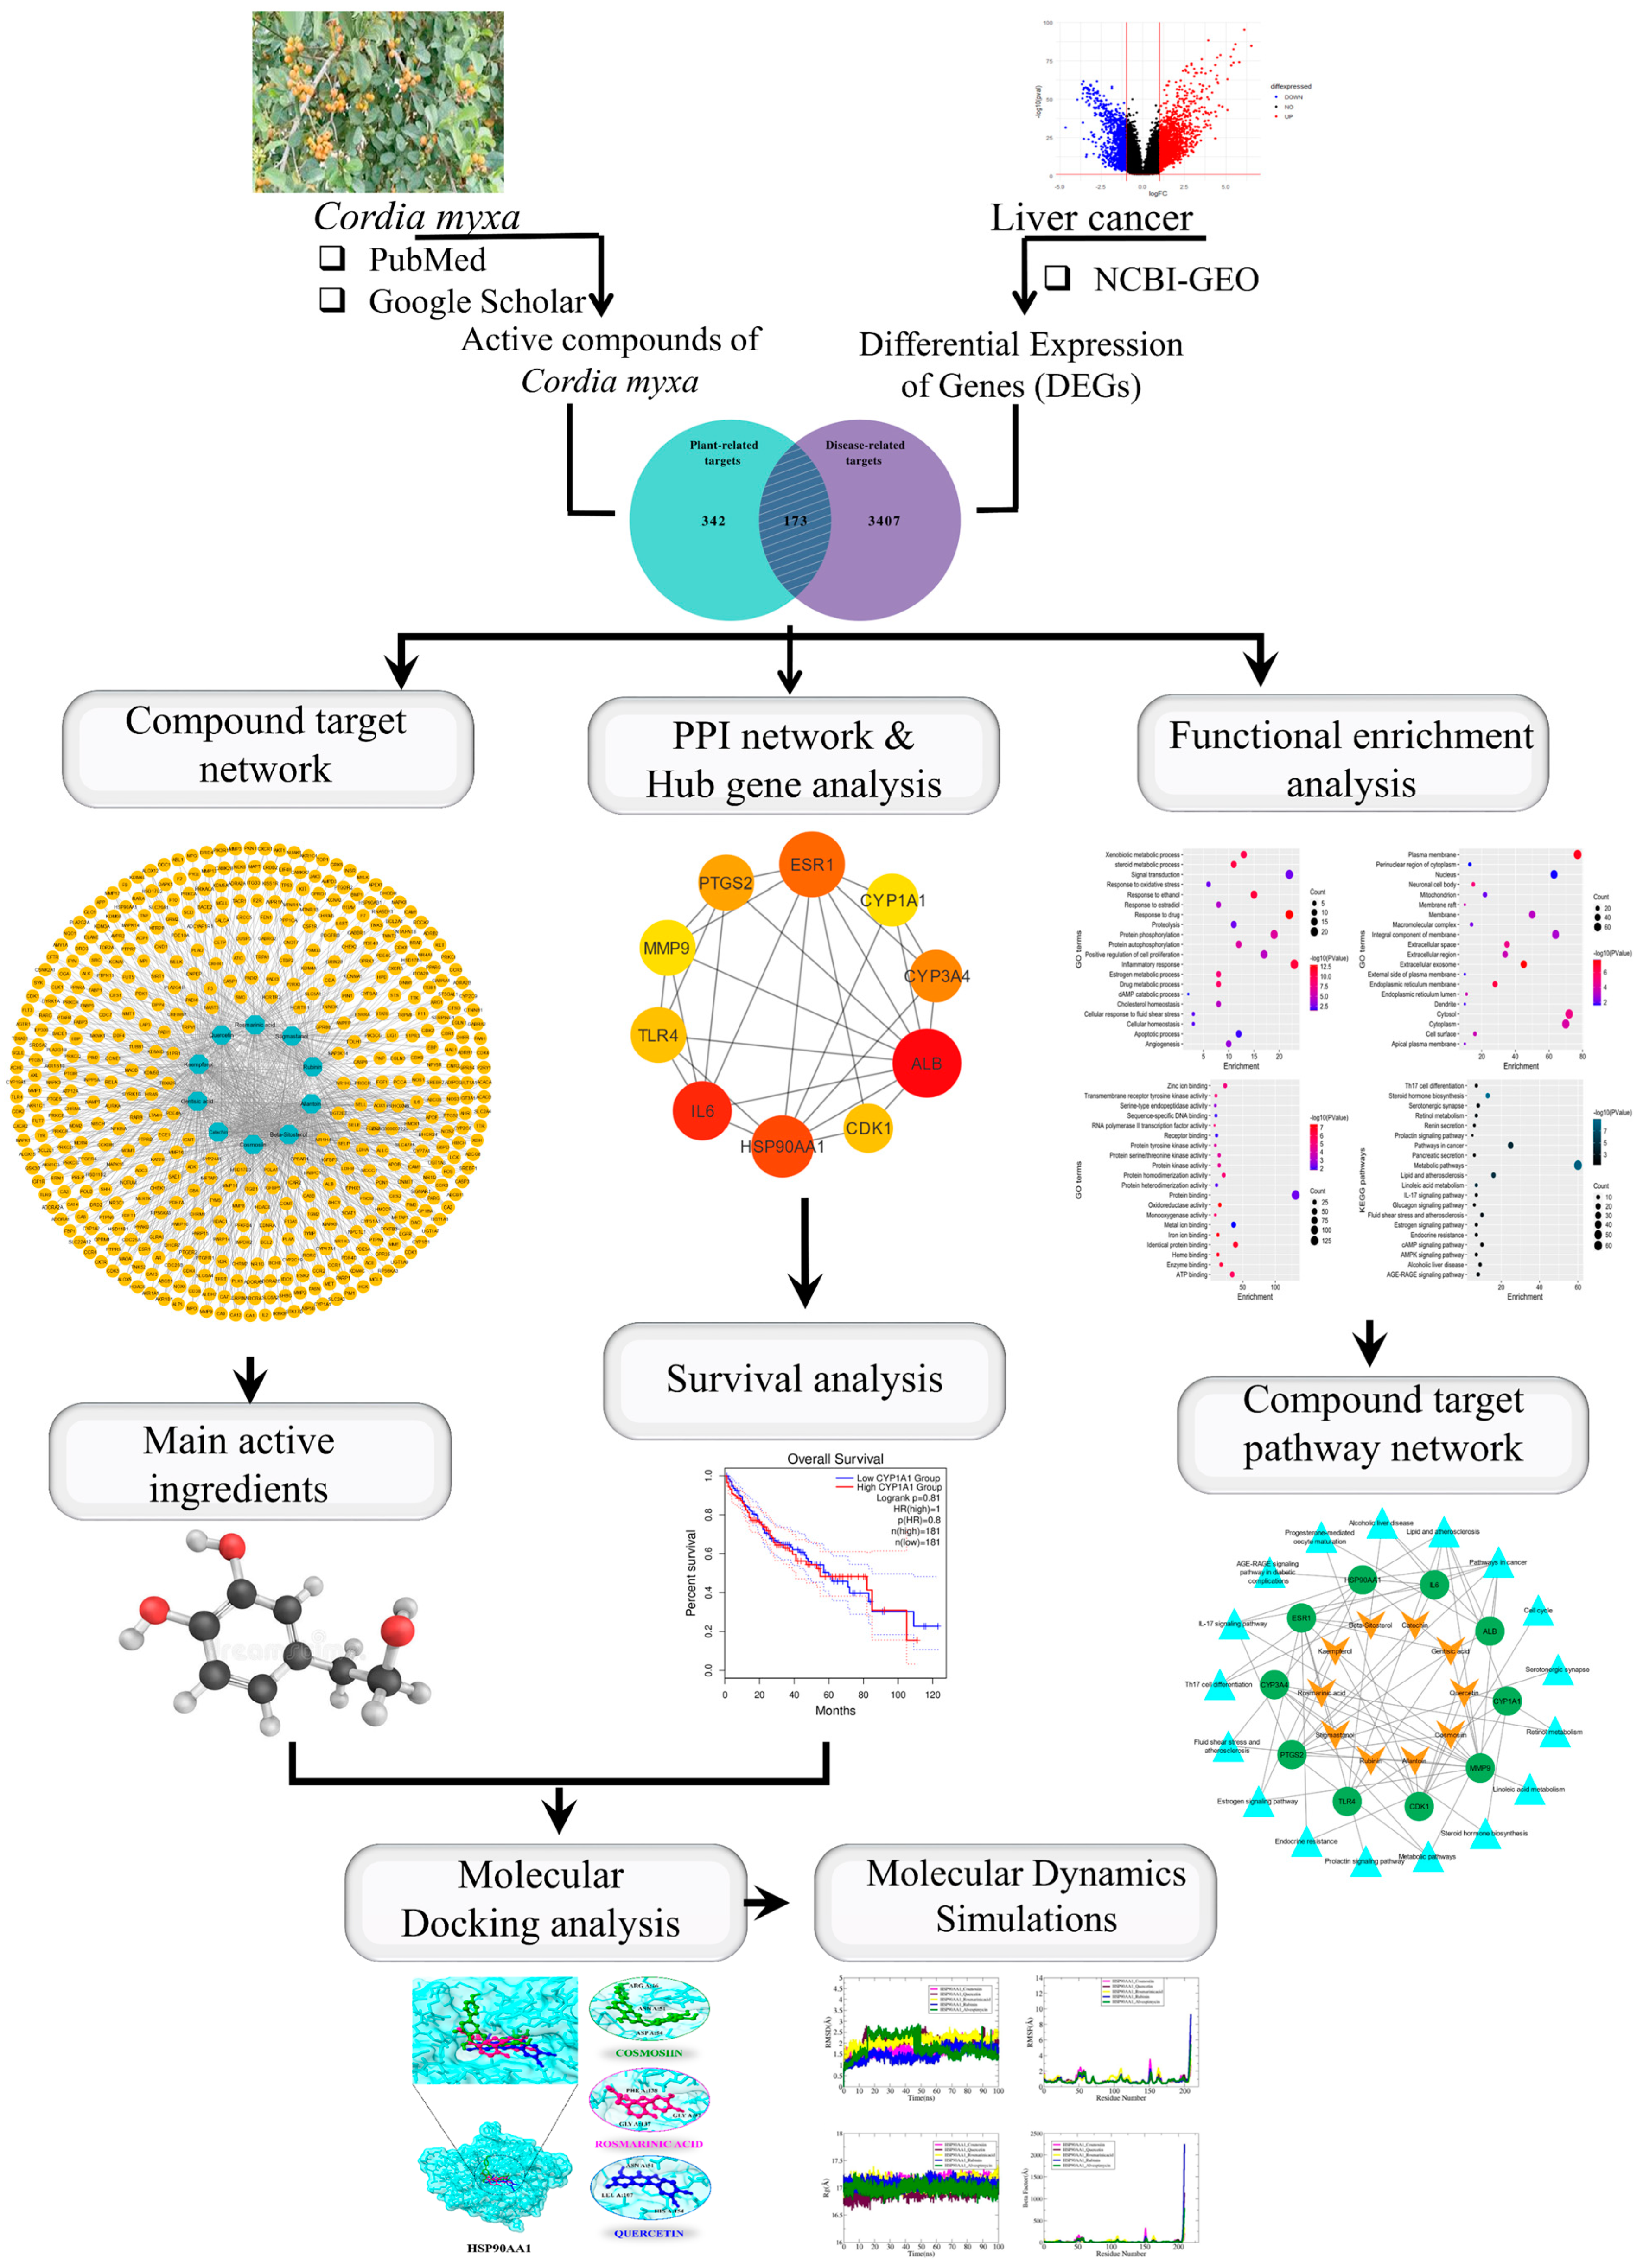
Figure 1. Graphical representation of the workflow of this study.
Biology 13 00315 g001
Figure 2. Compound–target network of 173 common targets of 10 active compounds. Blue color represents the compounds, and yellow color represents the targets.
Biology 13 00315 g002
Figure 3. Volcano plots of DEGs. (A) GSE39791, (B) GSE76427, (C) GSE22058, (D) GSE87630, and (E) GSE112790. Blue and red colors represent down-regulated and up-regulated genes, respectively. (F) With a total of 173 overlapping genes, the Venn diagram shows the targets of C. myxa and LC.
Biology 13 00315 g003
Figure 4. (AD) depicts a bubble chart of the top 20 enriched GO terms (BP, CC, MF) and KEGG pathways, respectively.
Biology 13 00315 g004
Figure 5. (A) Ten hub genes based on degree. (B) Bar chart of 10 hub genes. (C) Co-expression of hub genes in Homo sapiens.
Biology 13 00315 g005
Figure 6. Compound/drug–target–pathways network. The orange V shapes represent the active constituents/drugs associated with hub genes, the green circles represent hub genes, and the cyan triangles represent the pathways linked to the hub genes.
Biology 13 00315 g006
Figure 7. The GEPIA 2 was used to evaluate the survival data of the hub genes including (A) ALB, (B) IL6, (C) HSP90AA1, (D) ESR1, (E) CYP3A4, (F) PTGS2, (G) TLR4, (H) CDK1, (I) MMP9, and (J) CYP1A1. The red line shows patients with expression levels above the median, whereas the black line reflects expression levels below the median. HR stands for the hazard ratio.
Biology 13 00315 g007
Figure 8. Docking position and interactions of 3 highly bounded compounds with HSP90AA1.
Biology 13 00315 g008
Figure 9. (A) RMSD, (B) RMSF, (C) RoG, and (D) Beta Factor plots for the complexes.
Biology 13 00315 g009
Figure 10. SASA analysis for the studied complexes.
Biology 13 00315 g010
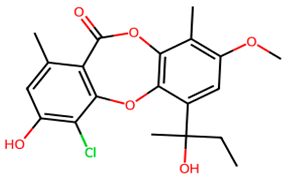
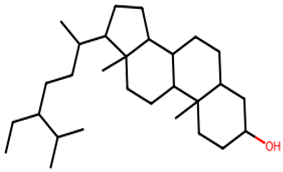
Table 1. Active constituents, their properties, and 2D structures.
CompoundMWDLOB2D StructureCID
Allantoin158.120.880.55Biology 13 00315 i001204
Beta-sitosterol414.70.780.55Biology 13 00315 i002222,284
Catechin290.270.640.55Biology 13 00315 i0039064
Cosmosiin432.40.590.55Biology 13 00315 i0045,280,704
Gentisic acid154.120.30.56Biology 13 00315 i0053469
Kaempferol286.240.50.55Biology 13 00315 i0065,280,863
Quercetin302.230.520.55Biology 13 00315 i0075,280,343
Rosmarinic acid360.30.370.56Biology 13 00315 i0085,281,792
Rubinin392.80.180.55Biology 13 00315 i009101,316,842
Stigmastanol416.70.290.55Biology 13 00315 i010241,572
Table 2. Active constituents, their class, and CytoHubba’s different scoring algorithms.
CompoundClassDegreeMNCMCCClosenessBetweenness
AllantoinAzoles1281110249.561,187.7
Beta-sitosterolSteroids1341109248.83357,693.4
CosmosiinFlavonoids1031102244.16745,039
CatechinFlavonoids30110175.1338527.81
Gentisic acidBenzenoids1061105246.16753,199
KaempferolFlavonoids1291107247.532,115.4
QuercetinFlavonoids1131108246.8533,069.9
Rosmarinic acidCinnamic acids1101106245.51758,365.3
RubininFlavonoids1001100242.83356,869.3
StigmastanolSteroids1041103244.83353,677.2
Table 3. Docking results of 10 active ingredients and one control drug with HSP90AA1.
ProteinCompoundBinding Affinity (kJ/mol)RMSD
(Å)
Interacting Residues
HSP90AA1Cosmosiin−7.31.183ARG A:46, ASN A:51, ASP A:54
Rosmarinic acid−7.22.552LYA A:58, GLY A:97, MET A:98, GLY A:137
Quercetin−6.71.136ASN A:51, GLY A:97, NET A:98, LEU A:107, HIS A:154
Rubinin−6.72.778ASN A:51, ALA A:55, LYS A:58, MET A:98
(+)-Catechin−6.62.775LEU A:107, ILE A:110, ALA A:111, VAL A:136
Kaempferol−6.51.485GLU A:47, SER A:50, ASP A:54, GLY A:132
Stigmastanol−6.41.368ALA A:55, MET A:98, LEU A:107
Beta-sitosterol−6.41.477ALA A:55, LYS A:58, MET A:98, LEU A:107
Alvespimycin−6.02.631ASN A:51, ASP A:102, HIS A:154
Allantoin−5.52.967ASN A:51, ASP A:54, THR A:184
Gentisic acid−4.80.884LEU A:107, ALA A:111, VAL A:136, PHE A:138
Table 4. Docked complexes MMPB/GBSA energies in kcal/mol.
ParameterHSP90AA1_CosmosiinHSP90AA1_QuercetinHSP90AA1_Rosmarinic AcidHSP90AA1_AlvespimycinHSP90AA1_Rubinin
MM/GBSA
Energy van der Waals−41.25−46.01−44.69−55.94−51.01
Energy Electrostatic−11.02−10.67−12.08−13.71−14.08
Total Gas Phase Energy−52.27−56.68−56.77−69.65−65.09
Total Solvation Energy8.087.147.788.098.66
Net Energy−44.19−49.54−48.99−61.56−56.43
MM/PBSA
Energy van der Waals−41.25−46.01−44.69−55.94−51.01
Energy Electrostatic−11.02−10.67−12.08−13.71−14.08
Total Gas Phase Energy−52.27−56.68−56.77−69.65−65.09
Total Solvation Energy7.528.067.658.048.16
Net Energy−44.75−48.62−49.12−61.6156.93
Disclaimer/Publisher’s Note: The statements, opinions and data contained in all publications are solely those of the individual author(s) and contributor(s) and not of MDPI and/or the editor(s). MDPI and/or the editor(s) disclaim responsibility for any injury to people or property resulting from any ideas, methods, instructions or products referred to in the content.