Article

Lysophosphatidylcholine Acetyltransferase 2 (LPCAT2) Influences the Gene Expression of the Lipopolysaccharide Receptor Complex in Infected RAW264.7 Macrophages, Depending on the E. coli Lipopolysaccharide Serotype

1
Faculty of Health, University of Plymouth, Plymouth PL4 8AA, UK
2
Zoonoses Research Unit, College of Veterinary Medicine, University of Bagdad, Baghdad 10071, Iraq
3
College of Medicine and Health, University of Exeter, Exeter EX1 2HZ, UK
*
Author to whom correspondence should be addressed.
Biology 2024, 13(5), 314; https://doi.org/10.3390/biology13050314
Submission received: 29 March 2024 / Revised: 25 April 2024 / Accepted: 30 April 2024 / Published: 1 May 2024
(This article belongs to the Special Issue Macrophages and Antimicrobial Immune Response)

Abstract

:

Simple Summary

E. coli harms over 100 million patients worldwide annually. Its toxin component is lipopolysaccharide, which has various forms, referred to as smooth or rough, based on their structure. Macrophages’ main function is to eat up foreign organisms through phagocytosis. This process requires membrane fluidity, which means the phospholipid in the macrophage plasma membrane needs to be regularly remodelled. A lipid-modifying enzyme known as LPCAT2 performs phospholipid remodelling and participates in inflammation. Here, we studied how this enzyme influences the gene expression of receptors that recognise and bind to lipopolysaccharides. These receptors are TLR4, CD14, and MD2. Our results show that LPCAT2 only influenced these receptors when macrophages were infected with smooth lipopolysaccharides. We conclude that LPCAT2 does not influence the gene expression of the receptors in macrophages infected with rough lipopolysaccharides because they do not require lipid-raft microdomains to mediate inflammation, but smooth lipopolysaccharides do.

Abstract

Escherichia coli (E. coli) is a frequent gram-negative bacterium that causes nosocomial infections, affecting more than 100 million patients annually worldwide. Bacterial lipopolysaccharide (LPS) from E. coli binds to toll-like receptor 4 (TLR4) and its co-receptor’s cluster of differentiation protein 14 (CD14) and myeloid differentiation factor 2 (MD2), collectively known as the LPS receptor complex. LPCAT2 participates in lipid-raft assembly by phospholipid remodelling. Previous research has proven that LPCAT2 co-localises in lipid rafts with TLR4 and regulates macrophage inflammatory response. However, no published evidence exists of the influence of LPCAT2 on the gene expression of the LPS receptor complex induced by smooth or rough bacterial serotypes. We used RAW264.7—a commonly used experimental murine macrophage model—to study the effects of LPCAT2 on the LPS receptor complex by transiently silencing the LPCAT2 gene, infecting the macrophages with either smooth or rough LPS, and quantifying gene expression. LPCAT2 only significantly affected the gene expression of the LPS receptor complex in macrophages infected with smooth LPS. This study provides novel evidence that the influence of LPCAT2 on macrophage inflammatory response to bacterial infection depends on the LPS serotype, and it supports previous evidence that LPCAT2 regulates inflammatory response by modulating protein translocation to lipid rafts.

1. Introduction

Escherichia coli (E. coli) is a gram-negative bacterium that lives harmlessly in healthy humans. However, pathogenic E. coli exists and harms immunocompromised humans. E. coli is implicated in many nosocomial infections, including septic shock, pneumonia, and meningitis. Worldwide, these infections affect over 100 million individuals per year. Therefore, studying the pathological mechanisms by which E. coli induces inflammatory responses during infection is relevant. This understanding will contribute to new knowledge and identify therapeutic targets or biomarkers for inflammatory disorders [1,2,3]. Bacterial lipopolysaccharides are the toxin components found on gram-negative bacterial cell walls. They are complex glycolipids comprising the O-antigen, the core oligosaccharide region, and diphosphoryl lipid A—the toxin (see Figure 1). The core oligosaccharide region can be further divided into the inner core (proximal to diphosphoryl lipid A) and outer core (proximal to the O-antigen), where the outer core is composed primarily of hexoses and the inner core is composed of the monosaccharide 2-keto-3-deoxyoctonoic acid (Kdo). The O-antigen is a chain of sugars that is highly variable and is responsible for the diversity of bacteria strains. The entire structure of bacterial lipopolysaccharide is called ‘smooth’, whereas ‘rough’ forms result from mutations that cause bacteria to lose their O-antigen [4,5,6,7,8].
Mammalian host immune response to bacterial infection comprises innate and adaptive immune responses. Innate immunity is the first line of defence against microbial infection or injury. It can be mediated by various cells, including macrophages, natural killer cells, neutrophils, dendritic cells, mast cells, eosinophils, basophils, and innate lymphoid cells. Their primary function is the elimination of microbial pathogens and foreign organisms via endocytosis/phagocytosis and enzymatic pathways. Some of these cells also present antigens from digested microbes to adaptive immune cells, linking the innate immune system to the adaptive immune system. Innate immune cells also secrete cytokines and chemokines, contributing to inflammation [9,10].
On a molecular level, pathogen recognition receptors drive innate immune cells’ recognition and inflammatory responses to microbial pathogens. They recognise pathogen-associated molecular patterns from microbes such as bacterial lipopolysaccharides and mediate inflammation via signalling pathways. Some commonly known pathogen recognition receptors include toll-like, nod-like, and RIG-I-like receptors. There are ten known toll-like receptors (TLRs) in humans, of which the last is a pseudogene. In other mammals, there are up to 13 toll-like receptors. TLR4 is the critical receptor for the recognition of bacterial lipopolysaccharides. It forms a complex with co-receptors—MD2 and CD14—known as the LPS receptor complex. Like other TLRs, TLR4 is synthesised in the endoplasmic reticulum before being transported to the plasma membrane, where it binds lipopolysaccharides [11,12,13].
The plasma membrane is a phospholipid bilayer that comprises various lipid species and proteins. Canonically, phospholipids found in the plasma membrane are phosphatidylcholine, sphingomyelin, cholesterol, gangliosides, phosphatidylethanolamine, and phosphatidylserine. The non-uniformity of the eukaryotic plasma membrane allows for protein trafficking, protein aggregation, the formation of microdomains, and signal transduction. Lipid rafts are detergent-resistant and highly dynamic plasma membrane microdomains. GPI-anchored proteins such as CD14 reside in lipid rafts. They play vital roles in biological processes such as endocytosis, protein trafficking, and signal transduction. Cholesterol is a pivotal component of lipid-raft microdomains as it keeps the lipid-raft assembly of sphingolipids and non-saturated phospholipids together. Therefore, cholesterol depletion in lipid rafts can lead to protein dissociation and dysfunction [14,15,16].
The phospholipid remodelling pathway maintains plasma membrane diversity by recycling lysophospholipids to phospholipids and vice versa. Substrates for this reaction come from the de novo pathway, and the key enzymes that participate in phospholipid remodelling are acyltransferases and phospholipases. LPCAT2 is one of these enzymes. It belongs to a group of LPCATs with similar structures and functions; however, LPCAT2 is abundantly expressed in macrophages and participates in inflammatory processes [17,18,19,20]. Therefore, this study used gene expression analysis of crucial biomolecules for LPS recognition and macrophage inflammatory response to understand the mechanisms of LPCAT2 in inflammation. We compared groups of macrophages infected with smooth or rough serotype LPS to non-infected macrophages.

2. Materials and Methods

Chemical reagents, including nuclease-free water and DNase I amplification kit, were purchased from Sigma Aldrich, Gillingham, UK, and Fisher Scientific, Loughborough, UK. Pre-designed siRNA, Opti-MEM, Power SYBR Green, and the high-capacity RNA to cDNA kit were purchased from Life Technologies, Inchinnan, UK. PolyPlus Interferin and Lipofectamine 2000 reagents were purchased from PolyPlus-Sartorius, Epsom, UK. LAL reagent water, Dulbecco’s Modified Eagle Medium (DMEM), L-Glutamine, and Foetal Bovine Serum (FBS) were purchased from Lonza, Slough, UK. Smooth LPS—E. coli O111:B4—was purchased from Sigma-Aldrich. Semi-rough (Rc) LPS—E. coli J5 and Rough (Re) LPS—E. coli K12 D32m4—was purchased from List Biological Laboratories, Eastbourne, UK.

2.1. Cell Line and Culture

The RAW264.7-macrophage-like cell line was obtained from the European Collection of Cell Cultures (ECACC) through Public Health England, UK. RAW264.7 macrophages were maintained in DMEM supplemented with 10% (v/v) FBS and 1% (v/v) 0.2 M L-Glutamine, and incubated at 37 °C, 5% CO2. The cells were regularly monitored using inverted confocal microscopes, and cell viability checks were performed using trypan blue exclusion assays.

2.2. Gene Manipulation

RAW264.7 macrophages were cultured 24 h before gene manipulation. Then, a mixture containing PolyPlus Interferin transfection reagent, siRNA, and Opti-MEM as diluent was prepared and added slowly to a flask containing RAW264.7 cells. Finally, the cells were incubated at 37 °C, 5% CO2 with Opti-MEM for 24 h for efficient gene silencing.
Plasmid vector with or without murine LPCAT2 recombinant DNA was transfected into RAW264.7 cells using Lipofectamine 2000 transfection reagent, then incubated at 37 °C, 5% CO2 in Opti-MEM. Adding Geneticin to the flask containing RAW264.7 cells killed off those not taking up the plasmid vectors carrying LPCAT2 and the neomycin-resistant gene, selecting only cells overexpressing LPCAT2.

2.3. Bacterial Infection

LPS was resuspended in LAL reagent water (<0.005 EU/mL endotoxin levels). Adding 100 ng/mL of either lipopolysaccharide serotype to a flask containing RAW264.7 cells stimulated the desired inflammatory response for 6 h, after which the culture medium was removed, and the cells were collected for analysis.

2.4. RNA Purification and Quantification

After bacterial infection, RAW264.7 cells were separated from the cell culture medium, rinsed with cold PBS (phosphate-buffered saline), and suspended in a buffer solution containing 4 M Guanidinium Thiocyanate, 0.75 M Sodium Citrate Dihydrate (pH 7.0), 10% (w/v) N-Laurosylsarcosine, and 0.72% (v/v) β-Mercaptoethanol for the RNA extraction procedure. The total RNA isolation procedure was adopted from [21] with minor modifications (chloroform was replaced with Bromochloropropane to form a liquid interphase). Total RNA was treated with DNase I to remove residual DNA according to the manufacturer’s protocol. Total RNA was quantified using NanoDrop2000 [ThermoFisher Scientific, Oxford, UK]; the purity was estimated using the A260/A280 ratio.

2.5. Primer Design

PCR primers were designed with Primer3 Plus Bioinformatics Software (version 3.3.0) and NCBI BLAST and purchased from Eurofins Genomics, Wolverhampton, UK. Selected primers had a low probability of primer dimer or secondary structure formation, GC% of 50–65%, and melting temperature between 55 and 60 °C.

2.6. Reverse Transcriptase-Real Time Quantitative Polymerase Chain Reaction

Following the manufacturer’s procedure for the high-capacity RNA to cDNA kit, we performed RNA to cDNA endpoint PCR. The reaction master mix for real-time quantitative PCR contained nuclease-free water, target primers (a mixture of forward and reverse primers), Power SYBR Green, and cDNA; the reaction was initiated at 95 °C for 10 min, then up to 40 repeated cycles of denaturing (15 s, 95 °C), annealing, and extension (60 s, 60 °C). GAPDH and ATP5B were used as endogenous controls.

2.7. Relative Quantitation and Statistical Analysis

We performed statistical analysis using R statistical programming software (version 4.3.2). Data represent the mean ± standard error of at least three independent experiments. We used paired t-tests with Dunnett’s multiple comparison tests to estimate statistical significance. All statistical tests were significant at a 95% confidence interval, p ≤ 0.05. We used the 2-ΔΔCt method [22] for the relative quantification of gene expression with GAPDH and ATP5B as endogenous reference genes.

3. Results

3.1. Structure of LPS

Bacterial lipopolysaccharides exist in various serotypes. The complete molecule that includes the ‘O-antigen’ polysaccharide repeat units is called smooth (S) LPS. In contrast, various truncated forms are known as rough (R) form LPS and have subtypes referred to as Ra, Rc, Rd, and Re, depending on the structure of the ‘core’ region of the molecule [5,6,7,8].

3.2. Analysis of LPCAT2 Transcription after Gene Silencing in Both Infected and Non-Infected RAW264.7 Macrophages

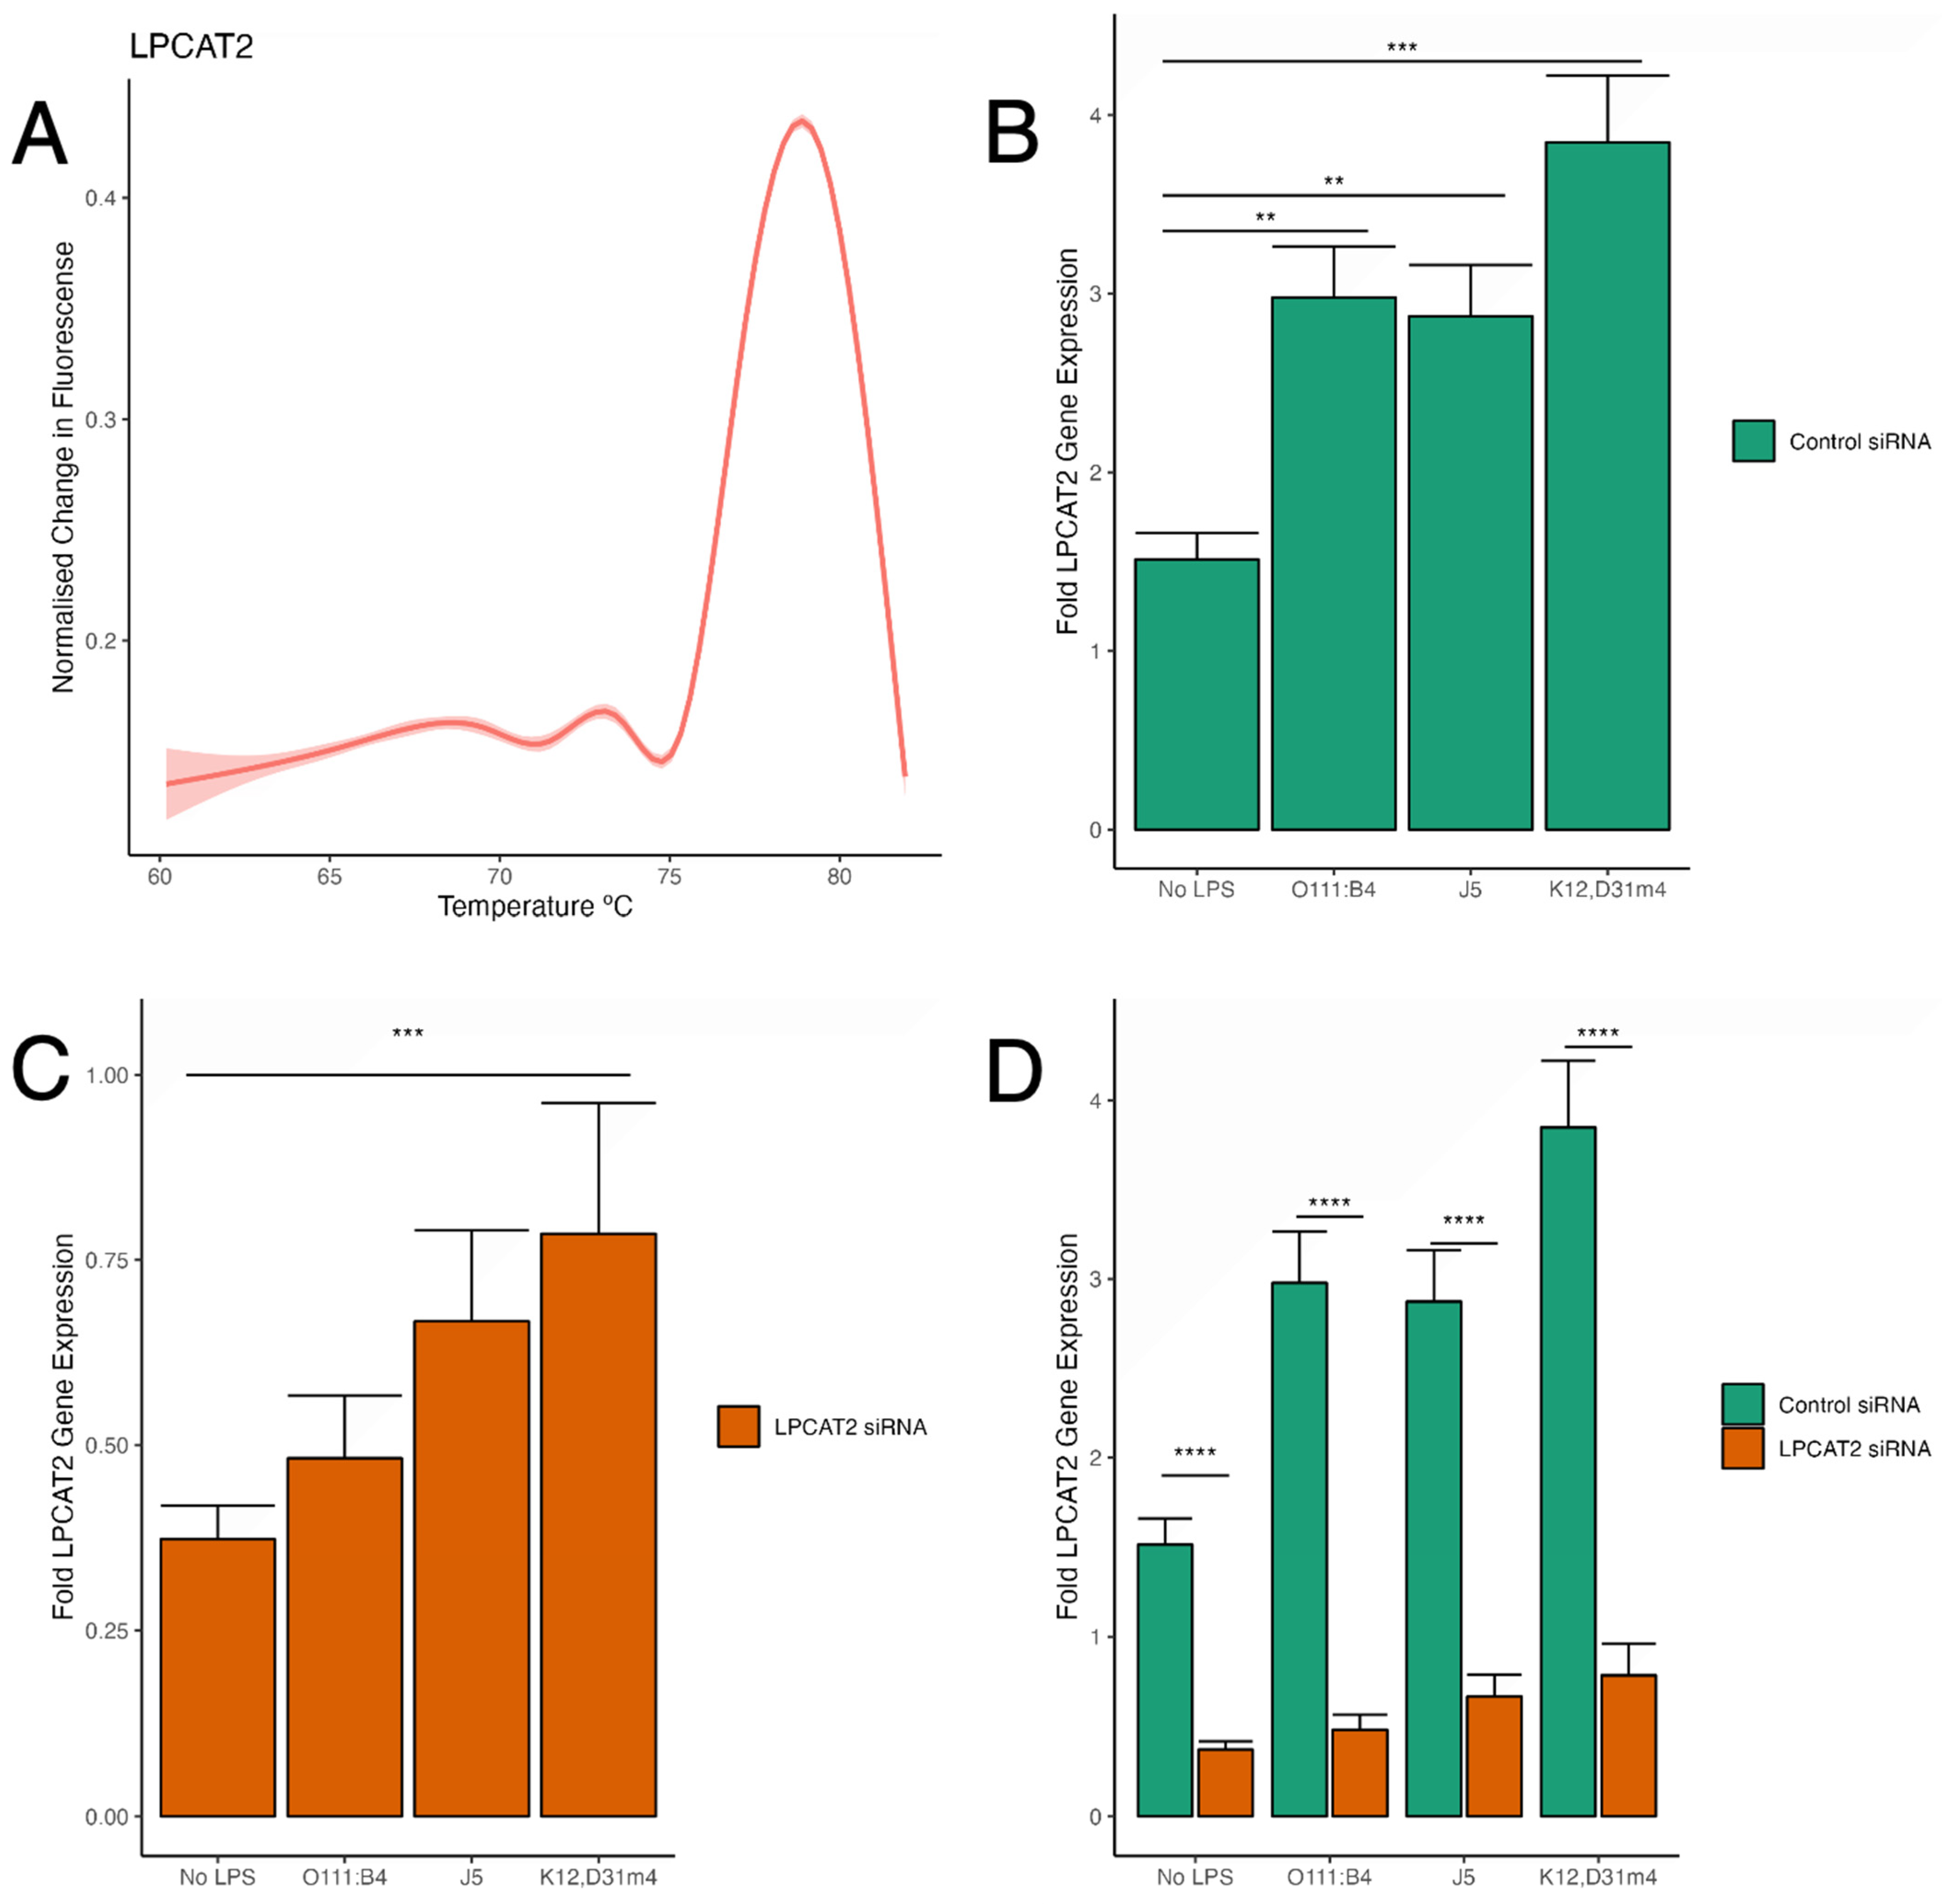
RT-qPCR was used to analyse LPCAT2 gene expression to confirm the efficiency of the RNA interference gene silencing procedure in various conditions. Figure 2C,D show that the LPCAT2 gene was significantly lower in macrophages transfected with LPCAT2 siRNA with or without LPS infection. Furthermore, Figure 2B indicates that the LPCAT2 gene was markedly higher in cells infected with LPS, but there was no significant difference between LPS serotypes. The melt curve in Figure 2A shows that the LPCAT2 amplicon was specific, as there is only one peak above the noise level. Figure 2C shows a gradual increase in LPCAT2 gene expression with each LPS serotype (smooth to rough), and macrophages infected with Re LPS had significantly higher LPCAT2 gene expression than those without LPS. However, all values were below 1-fold, and there was no significant difference between LPS serotypes. Figure 2 shows ≥70% efficiency in silencing LPCAT2 gene expression.

3.3. Differential Transcriptional Effect of Silencing LPCAT2 Gene on TLR4, CD14, and MD2 Gene Expression, Depending on LPS Serotype

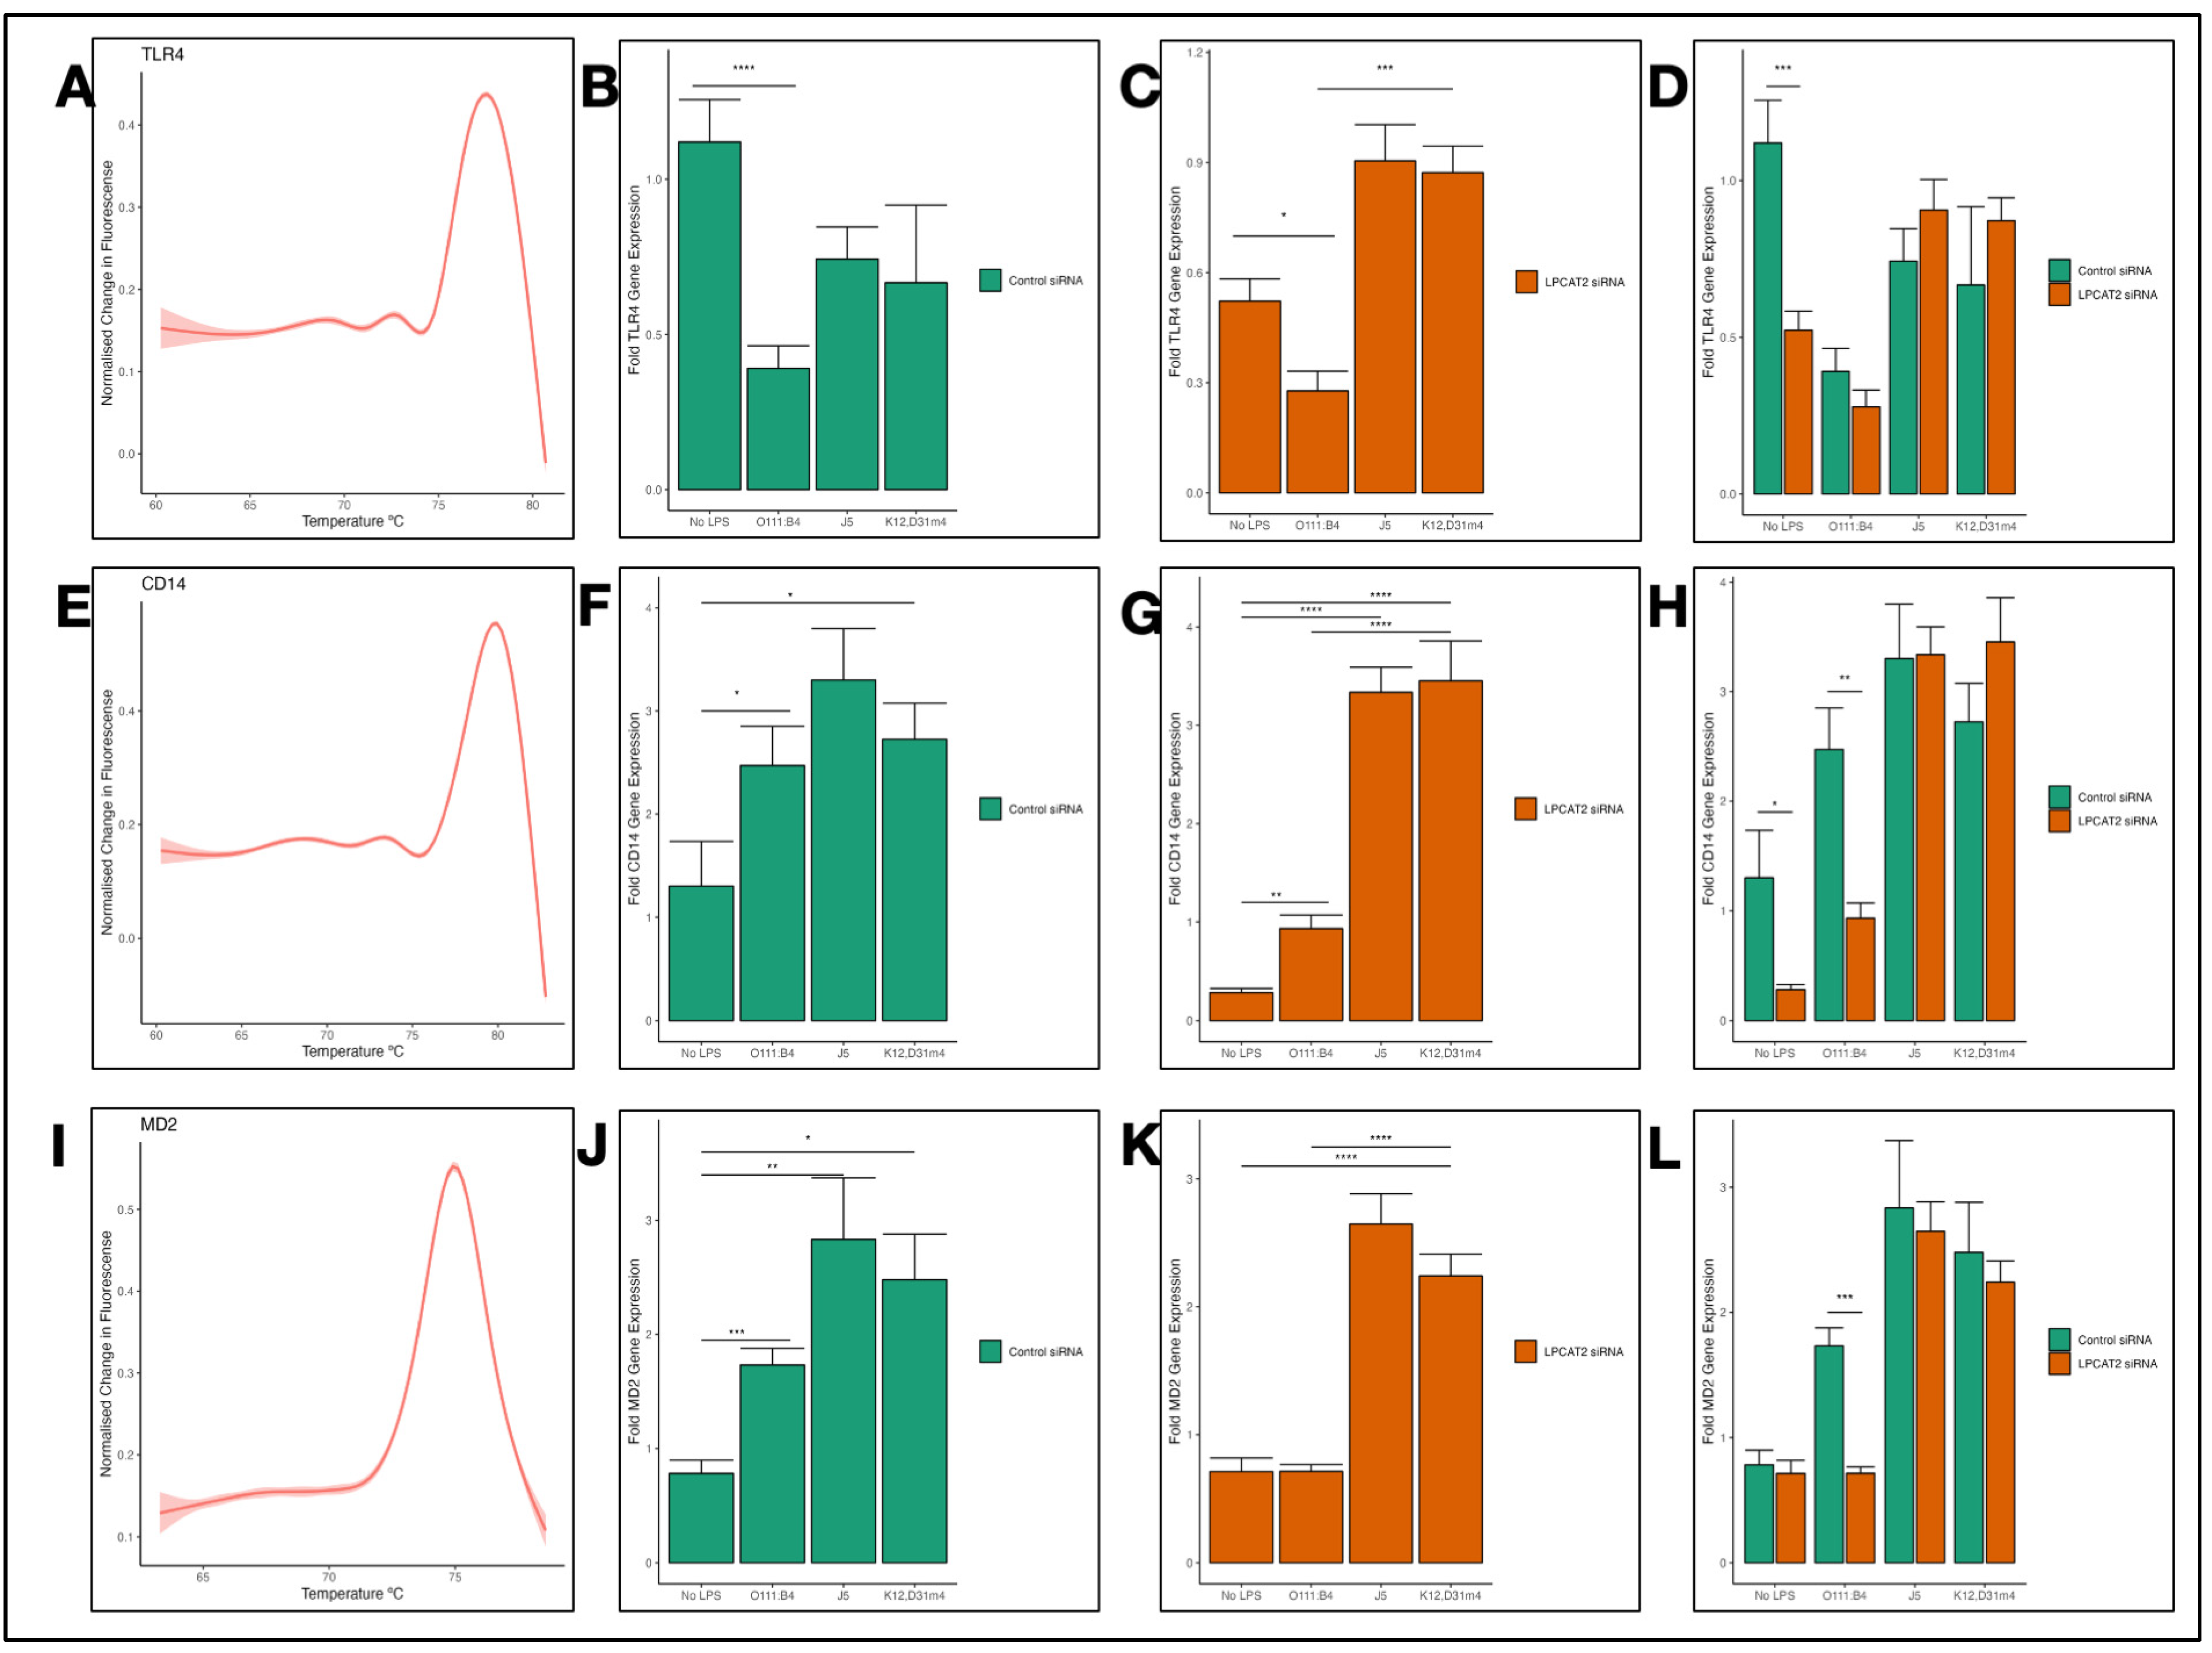
Using RT-qPCR, we analysed the transcriptional effects of silencing the LPCAT2 gene on TLR4, CD14, and MD2 gene expression in RAW264.7 macrophages. Figure 3A,E,I show that the amplicons were specific because they have a single fluorescence peak above the baseline. Figure 3B shows that infecting the macrophages with E. coli O111:B4 LPS caused downregulation of TLR4 gene expression. However, macrophages infected with E. coli J5 or K12, D31m4 showed no significant change in TLR4 gene expression. Furthermore, in negative controls (macrophages with no LPS infection), we see that silencing LPCAT2 significantly decreased TLR4 gene expression (Figure 3C). In macrophages infected with LPS, there was no significant difference in TLR4 gene expression between the control and the silenced LPCAT2 groups (Figure 3D). However, macrophages from the silenced LPCAT2 group infected with E. coli O111:B4 had slightly lower TLR4 gene expression than the control. CD14 (Figure 3F) and MD2 (Figure 3J) gene expression were significantly higher in LPS-infected macrophages. Like TLR4, CD14 (Figure 3H) and MD2 (Figure 3L) gene expression was not affected by silencing LPCAT2. However, macrophages from the silenced LPCAT2 group showed significantly decreased gene expression of CD14 (Figure 3G) and MD2 (Figure 3K) compared to the control. This result indicates that silencing LPCAT2 in non-infected macrophages decreased TLR4 and CD14 gene expression. Moreover, silencing LPCAT2 in LPS-infected macrophages decreased CD14 and MD2 gene expression.

3.4. Overexpression of LPCAT2 in RAW264.7 Macrophages and Transcriptional Effect on TLR4 and CD14 Gene Expression

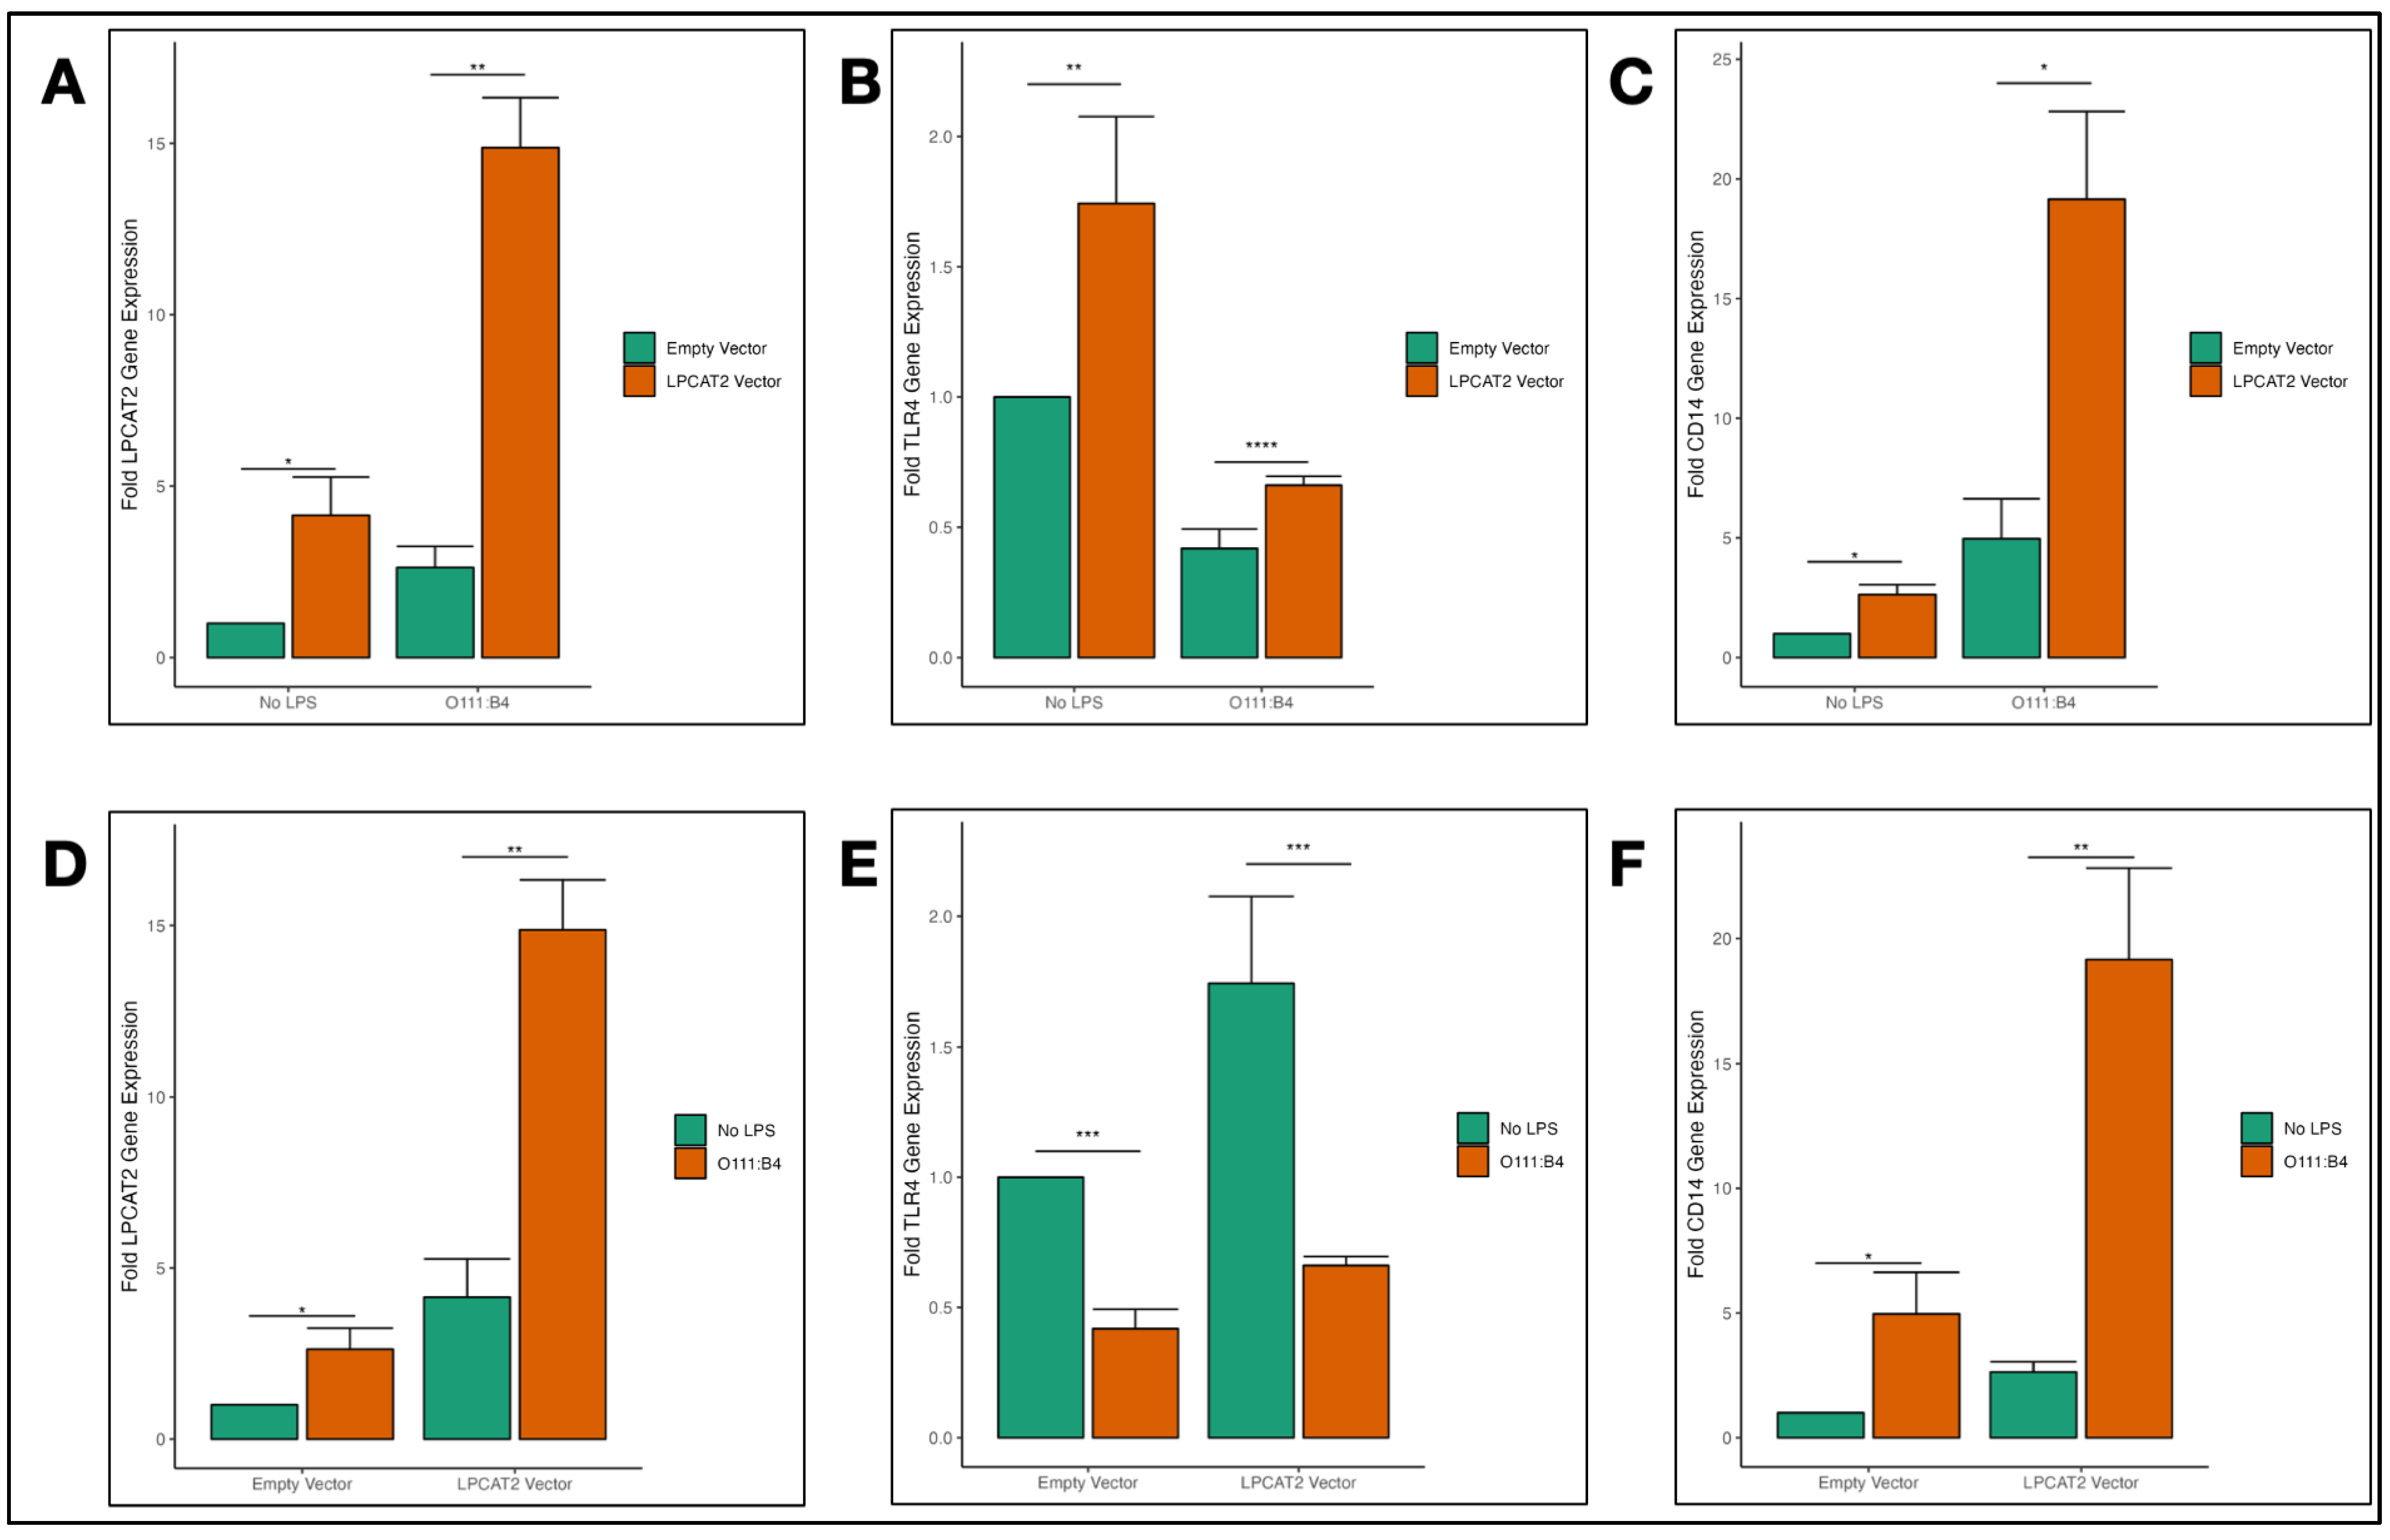
We overexpressed LPCAT2 in RAW264.7 macrophages and used RT-qPCR to measure its effects on TLR4 and CD14 gene expression. Figure 4A,D show significantly higher LPCAT2 gene expression in macrophages overexpressing LPCAT2 with or without LPS infection, which confirms the efficiency of LPCAT2 overexpression. Figure 3, above, shows that infecting RAW264.7 macrophages with E. coli O111:B4 downregulated TLR4 gene expression, and Figure 4E shows a similar observation. However, on this occasion, macrophages overexpressing LPCAT2 significantly increased TLR4 gene expression with or without LPS (Figure 4B). On the other hand, CD14 gene expression was markedly higher in macrophages overexpressing LPCAT2 and infected with E. coli O111:B4 (Figure 4C,F). This result provides further evidence that LPCAT2 regulates CD14 and TLR4 gene expression.

3.5. Differential Transcriptional Effect of Silencing LPCAT2 Gene on Tumor Necrosis Factor (TNFα), Interleukin 6 (IL6), Interferon Beta (IFNß), and Interferon Gamma-Inducible Protein 10 (IP10) Gene Expression, Depending on LPS Serotype

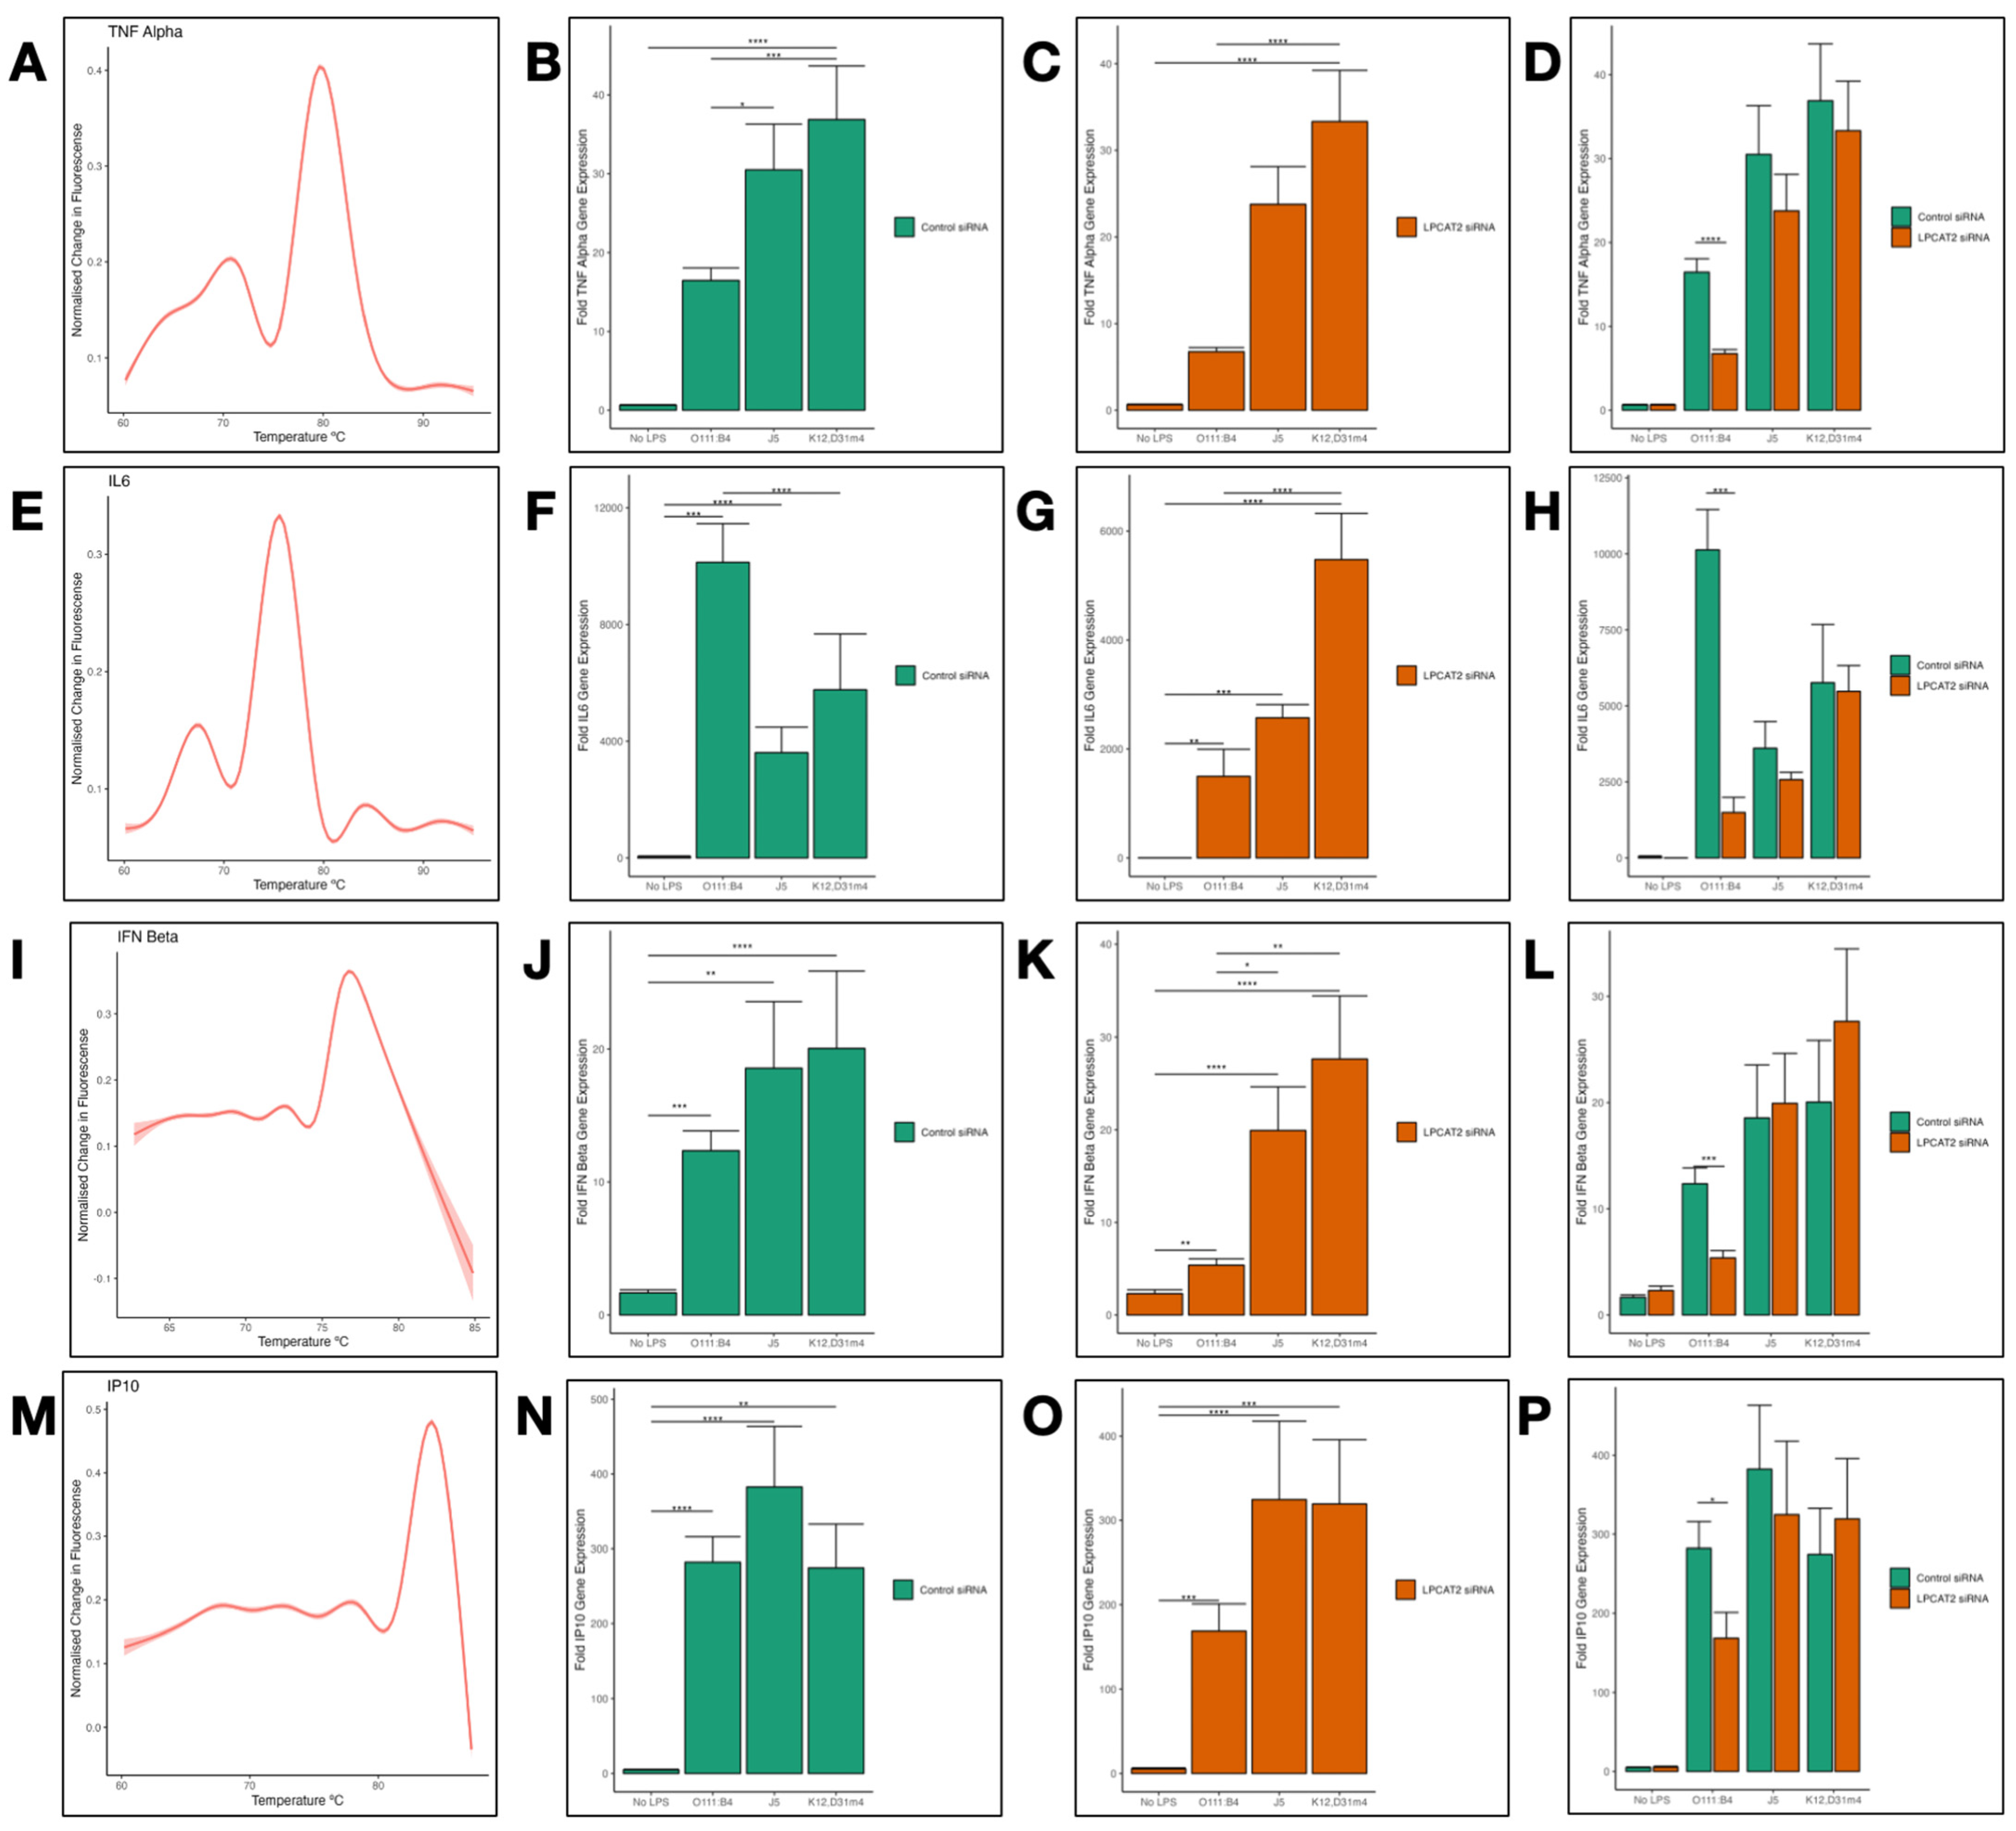
Using RT-qPCR, we analysed the transcriptional effects of silencing the LPCAT2 gene on the gene expression of cytokines TNFα, IL6, IFNß, and IP10 in RAW264.7 macrophages. The melt curves in Figure 5A,E,I,M show a single peak above the fluorescence baseline, indicating the specificity of PCR products. The effect of silencing LPCAT2 on the cytokines in Figure 5 is akin to the influence on the gene expression of the LPS receptors. As expected, all serotypes of LPS induced high gene expression of the cytokines (Figure 5B,F,J,N). However, silencing LPCAT2 only caused a significant in macrophages infected with E. coli O111:B4 (Figure 5D,H,L,P). Figure 5B shows a substantial difference in TNFα gene expression between macrophages infected with E. coli O111:B4 and J5/K12, D31m4.

4. Discussion

RAW264.7 macrophage cell lines are standard experimental models for studying inflammatory responses to various pathogen-associated molecular patterns. They were cloned from murine tumours using the Abelson leukaemia virus, and they express properties of macrophages such as phagocytosis, pinocytosis, and antibody-dependent pathogen killing [23]. They have also been used to study macrophage inflammatory responses to bacterial infection via various signalling pathways [24,25]. Although E. coli resides in healthy humans, there are pathogenic types that cause illness in immunocompromised humans. It is a frequent gram-negative bacterium that causes nosocomial infections, affecting more than 100 million patients annually worldwide. It also causes pneumonia, meningitis, and bacterial peritonitis [1,2,3].
The RT-qPCR experiments used SYBR Green as a fluorescent dye to quantify gene PCR amplicons in this study. SYBR Green is an intercalating dye that fluoresces when it binds to the minor groove of a double-stranded DNA [26]. Melt curves often validate the purity or specificity of amplicons from PCR assays using intercalating dyes, as specificity is usually a concern for these assays. It is generally assumed that more than one peak in the melt curve indicates the presence of more than one amplicon, as different amplicons will have different melting temperatures. However, that is only sometimes valid [27,28].
The broad premise of this study was to show that LPCAT2 is a pro-inflammatory molecule that regulates macrophage inflammatory responses in an LPS-serotype-dependent manner. Figure 2 and Figure 5 show that LPCAT2 gene expression was increased in macrophages infected with LPS. This observation is in line with reports from several other publications. Besides LPCAT2 gene expression, its protein expression and enzymatic activity are enhanced during infection [17,29]. Various evidence-based theories exist for the molecular mechanisms by which LPCAT2 influences macrophage inflammatory responses. It could be via its metabolites [19,30], by association with the LPS receptor—TLR4—during the inflammatory response to bacterial infection [11], or by influencing post-translational modifications during the inflammatory response to bacterial infection [18]. Phospholipid remodelling is crucial for forming lipid rafts (phospholipid membrane ‘platforms’ for signalling), and LPCAT2 participates in phospholipid remodelling; this is also one of the proposed mechanisms.
Moreover, LPCAT2 has been implicated as a biomarker for inflammatory disorders such as cedar pollen allergenic rhinitis [31], pneumonia [32], and pulmonary tuberculosis [33]. All these publications support evidence that LPCAT2 is pro-inflammatory; however, data on the effect of LPCAT2 on various pro-inflammatory molecules are unavailable.
TLR4, CD14, and MD2 are crucial for macrophage inflammatory responses to LPS [34]. CD14 first recognises and binds to LPS, then presents it to the TLR4–MD2 complex. It is a co-receptor for other TLRs; therefore, it can mediate inflammation without TLR4 [35]. On the other hand, MD2 associates with the extracellular domain of TLR4 and enhances its response to LPS recognition. It also plays a role in TLR4 subcellular localisation [36,37]. TLR4 has two canonical signalling pathways: the MyD88-dependent and MyD88-independent pathways. Scientific evidence shows CD14 is vital for TLR4 signalling via the MyD88-independent pathway [38]. As the results described in this paper confirm, CD14 gene expression is increased by LPS in alveolar macrophages after several hours of infection [39], TLR4 gene expression is decreased by LPS infection of mouse macrophages [40], and MD2 gene expression is higher after LPS infection of alveolar macrophages [41]. Furthermore, our data show, in Figure 3 and Figure 4, that LPCAT2 regulated these molecules’ gene expression, albeit only in non-infected and E. coli O111:B4-infected macrophages. This is a novel finding, as no other publication has shown the effect of LPCAT2 on TLR4, CD14, and MD2 gene expression. Previous studies mentioned that LPCAT2 did not influence CD14 or TLR4 expression; however, no data was shown, nor was the type of molecular expression clarified. Lysophosphatidic acid (LPA) is a product of LPCAT2 metabolite—lysophosphatidylcholine [42]. LPA1, a receptor that recognises and binds LPA and LPS, was shown to regulate CD14 expression in epithelial cells [43]. This somewhat supports the results in Figure 3 and Figure 4. Moreover, several publications have demonstrated that CD14, TLR4, and MD2 gene expression decreases when the inflammatory response to LPS infection is inhibited [44,45].
Downstream of TLR4 signalling, transcription factors such as Interferon Regulatory Factor (IRF3), Nuclear Factor Kappa Beta (NFκB), and Mitogen-Activated Protein Kinase (MAPK) proteins induce the transcription of cytokines, which leads to cytokine release and, thus, feeds back into the inflammatory response [46]. Interferon beta is known to be favourably induced by the TLR4-MyD88-independent pathway by IRF3 [47]. On the other hand, IL6, TNFα, and IP10 are induced by NFκΒ [48]. In Figure 5, our results show that all serotypes of LPS increased cytokine gene expression, and LPCAT2 regulated cytokine expression. Several other studies have shown similar evidence [11,14,22,25]. However, we show here, for the first time, that LPCAT2 regulates IFNß.
Researchers have shown evidence that various LPS serotypes differentially regulate TNFα gene expression. Rough Salmonella and Brucella serotypes induce higher TNFα and IL6 expression in monocytes and macrophages [49,50]. This supports the data shown in Figure 5B. Our results, however, show higher IL6 expression with smooth LPS (Figure 5F). Conversely, Figure 5N shows no significant difference in IP10 gene expression between macrophages infected with smooth or rough LPS. A study that compared various serotypes of E. coli and Brucella LPS showed similar results [51].
Many species of bacteria have either smooth or rough LPS serotypes, and these variances in bacterial structures cause differences in their pathological mechanisms. Rough forms of LPS can activate the TLR4-MyD88-dependent signalling pathway without CD14 [52,53,54], and CD14 is crucial for endocytosis, which depends on lipid-raft formation [15,16,55]. Furthermore, there is evidence that smooth forms of LPS rely on lipid-raft formation for internalization, but not rough forms. In J774.A1 cells, disrupting lipid-raft formation prevented the internalisation of smooth Brucella LPS but had limited effect on rough Brucella LPS [56]. Cholesterol is an essential component of lipid rafts. However, high-density lipoprotein interacts with high-density lipoprotein receptors, leading to lipid-rafts’ cholesterol depletion. Cholesterol depletion in lipid rafts leads to protein dissociation and dysfunction [15,57]. Researchers have shown that high-density lipoprotein caused decreased binding and uptake of smooth-type LPS in CHO cells [58]. In the same vein, the results of this study show that LPCAT2 did not influence inflammatory response to rough LPS. Although CD14 is required for LPS endocytosis, rough LPS is still endocytosed, suggesting it may use a CD14-independent endocytosis pathway. The phagocytic pathways of rough and smooth LPS are different, where phagosomes containing rough LPS are fusiogenic, phagosomes containing smooth LPS are non-fusiogenic. Also, rough LPS activates the inflammasome, Ca2+/calcineurin, and NFAT pathways in dendritic cells, leading to higher cytokine production than smooth LPS [49,52]. As LPCAT2 affects CD14-dependent endocytosis, this published evidence aligns with our finding that rough LPS induced higher cytokine production but was not affected by LPCAT2 as it is independent of CD14. Overall, this supports the theory that LPCAT2 influences macrophage inflammatory responses by regulating lipid-raft formation and supports the previous study that showed evidence of LPCAT2 inhibition preventing TLR4 translocation to lipid rafts [17].
Lipidomic, proteomic, and genomic analysis would be beneficial for better understanding the influence of LPCAT2 on macrophage inflammatory response to bacterial infection. Due to limited research funds, we selected key molecular targets for this study. Additionally, it will be advantageous to study the influence of LPCAT2 on macrophage inflammatory responses mediated by other pathogen recognition receptors that either depend on CD14 or require lipid-raft domains for signalling. As this study was carried out in vitro using murine secondary cell lines, replicating it in human primary cell lines or ex vivo studies would be favourable because they would imply applicability in vivo. A better understanding of the influence of LPCAT2 on phagocytic pathways and cell morphology would also be beneficial. An in-depth understanding of LPCAT2 molecular mechanisms in macrophage inflammatory response will make it a potential therapeutic target or biomarker for inflammatory disorder.

5. Conclusions

In conclusion, this study has shown novel evidence that LPCAT2 does not influence macrophage inflammatory responses to rough forms of E. coli. We have also published new evidence that LPCAT2 regulates CD14, TLR4, MD2, and IFNß gene expression. The ability of LPCAT2 to regulate CD14 gene expression implies that it influences CD14-dependent endocytosis, which is crucial for TLR4 signalling. As lipid-raft domains are vital to endocytosis, it also indicates that LPCAT2 influences the assembly of lipid-raft domains. Several publications suggest that rough forms of LPS do not require lipid-raft domains for mediating inflammatory responses. This aligns with our finding that LPCAT2 only influences macrophage inflammatory response to smooth-form LPS because LPCAT2 participates in the phospholipid remodelling pathway, which regulates the assembly or depletion of lipid-raft domains. Our research group has previously shown that silencing LPCAT2 prevents TLR4 translocation to the lipid-raft domain, an observation supported by this study and another study that showed cholesterol depletion did not influence rough LPS uptake but influenced smooth LPS uptake.
Simply put, this study provides evidence that LPCAT2 does not influence macrophage inflammatory responses to rough forms of LPS and supports previous evidence by our research group that LPCAT2 regulates macrophage inflammatory responses by influencing TLR4 translocation to lipid-raft domains. These results will pave the way for further studies to better understand the role of LPCAT2 in inflammatory responses. It also contributes insights to biochemistry, immunology, and molecular biology.

Author Contributions

Conceptualization, V.I.P. and H.A.; methodology, V.I.P. and H.A.; software, V.I.P.; validation, V.I.P., W.A., N.D.A., G.F. and S.K.J.; formal analysis, V.I.P.; investigation, V.I.P. and H.A.; resources, S.K.J. and G.F.; data curation, V.I.P. and H.A.; writing—original draft preparation, V.I.P.; writing—review and editing, V.I.P.; visualization, V.I.P.; supervision, W.A., N.D.A., G.F. and S.K.J.; project administration, V.I.P.; funding acquisition, S.K.J. All authors have read and agreed to the published version of the manuscript.

Funding

This research was funded by the University of Plymouth, School of Biomedical and Healthcare Sciences, Quality Research Grant under Professor Simon K. Jackson’s research group (Grant number: GD110033-103).

Institutional Review Board Statement

Not Applicable.

Informed Consent Statement

Not Applicable.

Data Availability Statement

Data are available upon request.

Conflicts of Interest

The authors declare no conflicts of interest.

References

  1. Taye, Z.W.; Abebil, Y.A.; Akalu, T.Y.; Tessema, G.M.; Taye, E.B. Incidence and determinants of nosocomial infection among hospital admitted adult chronic disease patients in University of Gondar Comprehensive Specialized Hospital, North–West Ethiopia, 2016–2020. Front. Public Health 2023, 11, 1087407. [Google Scholar] [CrossRef] [PubMed]
  2. Mueller, M.; Tainter, R.C. Escherichia coli Infection. 13 July 2023; [Online]. Available online: https://www.ncbi.nlm.nih.gov/books/NBK564298/ (accessed on 28 March 2024).
  3. Kaper, J.B.; Nataro, J.P.; Mobley, H.L.T. Pathogenic Escherichia coli. Nat. Rev. Microbiol. 2004, 2, 123–140. [Google Scholar] [CrossRef] [PubMed]
  4. Lerouge, I.; Vanderleyden, J. O-antigen structural variation: Mechanisms and possible roles in animal/plant–microbe interactions. FEMS Microbiol. Rev. 2002, 26, 17–47. [Google Scholar] [CrossRef] [PubMed]
  5. Somerville, J.E., Jr.; Cassiano, L.; Bainbridge, B.; Cunningham, M.D.; Darveau, R.P. A novel Escherichia coli lipid A mutant that produces an antiinflammatory lipopolysaccharide. J. Clin. Investig. 1996, 97, 359–365. [Google Scholar] [CrossRef] [PubMed]
  6. Pulido, D.; Garcia-Mayoral, M.F.; Moussaoui, M.; Velazquez, D.; Torrent, M.; Bruix, M.; Boix, E. Structural basis for endotoxin neutralization by the eosinophil cationic protein. FEBS J. 2016, 283, 4176–4191. [Google Scholar] [CrossRef] [PubMed]
  7. Qimron, U.; Marintcheva, B.; Tabor, S.; Richardson, C.C. Genomewide screens for Escherichia coli genes affecting growth of T7 bacteriophage. Proc. Natl. Acad. Sci. USA 2006, 103, 19039–19044. [Google Scholar] [CrossRef] [PubMed]
  8. Heinrichs, D.E.; Yethon, J.A.; Whitfield, C. Molecular basis for structural diversity in the core regions of the lipopolysaccharides of Escherichia coli and Salmonella enterica. Mol. Microbiol. 1998, 30, 221–232. [Google Scholar] [CrossRef] [PubMed]
  9. Marshall, J.; Warrington, R.; Watson, W.; Kim, H.L. An introduction to immunology and immunopathology. Allergy Asthma Clin. Immunol. 2018, 14, 49. [Google Scholar] [CrossRef]
  10. Medzhitov, R. Recognition of microorganisms and activation of the immune response. Nature 2007, 449, 819–826. [Google Scholar] [CrossRef]
  11. Fitzgerald, K.A.; Kagan, J.C. Toll-like Receptors and the control of immunity. Cell 2020, 180, 1044–1066. [Google Scholar] [CrossRef]
  12. Bryant, C.E.; Spring, D.R.; Gangloff, M.; Gay, N.J. The molecular basis of the host response to lipopolysaccharide. Nat. Rev. Microbiol. 2009, 8, 8–14. [Google Scholar] [CrossRef] [PubMed]
  13. Yin, Q.; Fu, T.-M.; Li, J.; Wu, H. Structural Biology of Innate Immunity. Annu. Rev. Immunol. 2015, 33, 393–416. [Google Scholar] [CrossRef] [PubMed]
  14. Ingolfsson, H.I.; Melo, M.N.; van Eerden, F.J.; Arnarez, C.; Lopez, C.A.; Wassenaar, T.A.; Periole, X.; de Vries, A.H.; Tieleman, P.D.; Marrink, S.J. Lipid Organization of the Plasma Membrane. J. Am. Chem. Soc. 2014, 136, 14554–14559. [Google Scholar] [CrossRef] [PubMed]
  15. Simons, K.; Robert, E. Cholesterol, lipid rafts, and disease. J. Clin. Investig. 2002, 110, 597–603. [Google Scholar] [CrossRef]
  16. Rajendran, L.; Simons, K. Lipid rafts and membrane dynamics. J. Cell Sci. 2005, 118, 1099–1102. [Google Scholar] [CrossRef] [PubMed]
  17. Abate, W.; Alrammah, H.; Kiernan, M.; Tonks, A.J.; Jackson, S.K. Lysophosphatidylcholine acyltransferase 2 (LPCAT2) co-localises with TLR4 and regulates macrophage inflammatory gene expression in response to LPS. Sci. Rep. 2020, 10, 10355. [Google Scholar] [CrossRef] [PubMed]
  18. Poloamina, V.I.; Abate, W.; Fejer, G.; Jackson, S.K. Possible regulation of Toll-like receptor 4 by lysine acetylation through LPCAT2 activity in RAW264.7 cells. Biosci. Rep. 2022, 42, BSR20220251. [Google Scholar] [CrossRef] [PubMed]
  19. Tarui, M.; Shindou, H.; Kumagai, K.; Nagano, T.; Nagase, T.; Shimizu, T. Selective inhibitors of a PAF biosynthetic enzyme lysophosphatidylcholine acyltransferase 2. J. Lipid Res. 2014, 55, 1386–1396. [Google Scholar] [CrossRef] [PubMed]
  20. Hishikawa, D.; Hashidate, T.; Shimizu, T.; Shindou, H. Diversity and function of membrane glycerophospholipids generated by the remodeling pathway in mammalian cells. J. Lipid Res. 2014, 55, 799–807. [Google Scholar] [CrossRef]
  21. Chomczynski, P.; Sacchi, N. Single-step method of RNA isolation by acid guanidinium thiocyanate-phenol-chloroform extraction. Anal. Biochem. 1987, 162, 156–159. [Google Scholar] [CrossRef]
  22. Livak, K.J.; Schmittgen, T.D. Analysis of Relative Gene Expression Data Using Real-Time Quantitative PCR and the 2−ΔΔCT Method. Methods 2001, 25, 402–408. [Google Scholar] [CrossRef] [PubMed]
  23. Raschke, W.C.; Baird, S.; Ralph, P.; Nakoinz, I. Functional macrophage cell lines transformed by abelson leukemia virus. Cell 1978, 15, 261–267. [Google Scholar] [CrossRef]
  24. Rutledge, H.R.; Jiang, W.; Yang, J.; Warg, L.A.; Schwartz, D.A.; Pisetsky, D.S.; Yang, V.I. Gene expression profiles of RAW264.7 macrophages stimulated with preparations of LPS differing in isolation and purity. Innate Immun. 2011, 18, 80–88. [Google Scholar] [CrossRef]
  25. Hambleton, J.; Weinstein, S.L.; Lem, L.; DeFranco, A.L. Activation of c-Jun N-terminal kinase in bacterial lipopolysaccharide-stimulated macrophages. Proc. Natl. Acad. Sci. USA 1996, 93, 2774–2778. [Google Scholar] [CrossRef] [PubMed]
  26. Zipper, H.; Brunner, H.; Bernhagen, J.; Vitzthum, F. Investigations on DNA intercalation and surface binding by SYBR Green I, its structure determination and methodological implications. Nucleic Acids Res. 2004, 32, e103. [Google Scholar] [CrossRef]
  27. Keyserling, H.V.; Bergmann, T.; Wiesel, M.; Kaufmann, A.M. The use of melting curves as a novel approach for validation of real-time PCR instruments. BioTechniques 2011, 51, 179–184. [Google Scholar] [CrossRef]
  28. Downey, N. Integrated DNA Technologies. 2 February 2023. [Online]. Available online: https://eu.idtdna.com/pages/education/decoded/article/interpreting-melt-curves-an-indicator-not-a-diagnosis (accessed on 28 March 2024).
  29. Morimoto, R.; Shindou, H.; Oda, Y.; Shimizu, T. Phosphorylation of Lysophosphatidylcholine Acyltransferase 2 at Ser34 Enhances Platelet-activating Factor Production in Endotoxin-stimulated Macrophages. J. Biol. Chem. 2010, 285, 29857–29862. [Google Scholar] [CrossRef]
  30. Murano, H.; Inoue, S.; Miyazake, O.; Hanawa, T.; Minegishi, Y.; Sato, K.; Kobayashi, M.; Sato, M.; Nemoto, T.; Nishiwaki, M.; et al. Lysophosphatidylcholine Acyltransferase 2 Promotes Cigarette Smoke Induced Emphysema Via Platelet-activating Factor. ATS J. 2023, 207, A5721. [Google Scholar]
  31. Watanabe, H.; Miyake, K.; Matsuoka, T.; Kojima, R.; Sakurai, D.; Masuyama, K.; Yamagata, Z. LPCAT2 Methylation, a Novel Biomarker for the Severity of Cedar Pollen Allergic Rhinitis in Japan. Am. J. Rhinol. Allergy 2020, 35, 631–639. [Google Scholar] [CrossRef]
  32. Ma, X.; Chen, L.; He, Y.; Zhao, L.; Yu, W.; Xie, Y.; Yu, Y.; Yu, X.; Zheng, Y.; Li, R.; et al. Targeted lipidomics reveals phospholipids and lysophospholipids as biomarkers for evaluating community-acquired pneumonia. Ann. Transl. Med. 2022, 10, 395. [Google Scholar] [CrossRef]
  33. Long, N.P.; Anh, N.K.; Yen, N.T.H.; Phat, N.K.; Park, S.; Thu, V.T.A.; Cho, Y.; Shin, J.; Oh, J.Y.; Kim, D.H. Comprehensive lipid and lipid-related gene investigations of host immune responses to characterize metabolism-centric biomarkers for pulmonary tuberculosis. Sci. Rep. 2022, 12, 13395. [Google Scholar] [CrossRef]
  34. Fujihara, M.; Muroi, M.; Tanamoto, K.-I.; Suzuki, T.; Azuma, H.; Ikeda, H. Molecular mechanisms of macrophage activation and deactivation by lipopolysaccharide: Roles of the receptor complex. Pharmacol. Ther. 2003, 100, 171–194. [Google Scholar] [CrossRef]
  35. Zanoni, I.; Granucci, F. Role of CD14 in host protection against infections and in metabolism regulation. Front. Cell. Infect. Microbiol. 2013, 3, 32. [Google Scholar] [CrossRef]
  36. Nagai, Y.; Akashi, S.; Nagafuku, M.; Ogata, M.; Iwakura, Y.; Akira, S.; Kitamura, T.; Kosugi, A.; Kimoto, M.; Miyake, K. Essential role of MD-2 in LPS responsiveness and TLR4 distribution. Nat. Immunol. 2002, 3, 667–672. [Google Scholar] [CrossRef]
  37. Visintin, A.; Iliev, D.B.; Monks, B.G.; Halmen, K.A.; Golenblock, D.T. MD-2. Immunobiology 2006, 211, 437–447. [Google Scholar] [CrossRef]
  38. Jiang, Z.; Georgel, P.; Du, X.; Shamel, L.; Sovath, S.; Mudd, S.; Huber, M.; Kalis, C.; Keck, S.; Galanos, C.; et al. CD14 is required for MyD88-independent LPS signaling. Nat. Immunol. 2005, 6, 565–570. [Google Scholar] [CrossRef]
  39. Haugen, T.S.; Nakstad, B.; Skjonsberg, O.H.; Lyberg, T. CD14 Expression and Binding of Lipopolysaccharide to Alveolar Macrophages and Monocytes. Inflammation 1998, 22, 521–532. [Google Scholar] [CrossRef]
  40. Matsuguchi, T.; Musikacharoen, T.; Ogawa, T.; Yoshikai, Y. Gene Expressions of Toll-Like Receptor 2, But Not Toll-Like Receptor 4, Is Induced by LPS and Inflammatory Cytokines in Mouse Macrophages. J. Immunol. 2000, 165, 5767–5772. [Google Scholar] [CrossRef]
  41. Ren, W.; Hu, L.; Hua, F.; Jin, J.; Wang, Y.; Zhu, L. Myeloid differentiation protein 2 silencing decreases LPS-induced cytokine production and TLR4/MyD88 pathway activity in alveolar macrophages. Immunol. Lett. 2011, 141, 94–101. [Google Scholar] [CrossRef]
  42. Aoki, J. Mechanisms of lysophosphatidic acid production. Semin. Cell Dev. Biol. 2004, 15, 477–489. [Google Scholar] [CrossRef]
  43. Zhao, J.; He, D.; Su, Y.; Berdyshev, E.; Chun, J.; Natarajan, V.; Zhao, Y. Lysophosphatidic acid receptor 1 modulates lipopolysaccharide-induced inflammation in alveolar epithelial cells and murine lungs. Lung Cell. Mol. Physiol. 2011, 301, L547–L556. [Google Scholar] [CrossRef]
  44. Lauener, R.P.; Goyert, S.M.; Geha, S.R.; Vercelli, D. Interleukin 4 down-regulates the expression of CD14 in normal human monocytes. Eur. J. Immunol. 1990, 20, 2375–2381. [Google Scholar] [CrossRef]
  45. Abreu, M.T.; Vora, P.; Faure, E.; Thomas, L.S.; Arnold, E.T.; Arditi, M. Decreased Expression of Toll-Like Receptor-4 and MD-2 Correlates with Intestinal Epithelial Cell Protection Against Dysregulated Proinflammatory Gene Expression in Response to Bacterial Lipopolysaccharide. J. Immunol. 2001, 167, 1609–1616. [Google Scholar] [CrossRef]
  46. Kawai, T.; Akira, S. Toll-like receptor downstream signaling. Arthritis Res. Ther. 2004, 7, 12–19. [Google Scholar] [CrossRef]
  47. Yamamoto, M.; Sato, S.; Hemmi, H.; Hoshino, K.; Kaisho, T.; Sanjo, H.; Takeuchi, O.; Sugiyama, M.; Okabe, M.; Takeda, K.; et al. Role of Adaptor TRIF in the MyD88-Independent Toll-Like Receptor Signaling Pathway. Science 2001, 301, 640–643. [Google Scholar] [CrossRef]
  48. Gohda, J.; Matsumura, T.; Inoue, J.-i. TNFR-Associated Factor (TRAF) 6 Is Essential for MyD88-Dependent Pathway but Not Toll/IL-1 Receptor Domain-Containing Adaptor-Inducing IFN-β (TRIF)-Dependent Pathway in TLR Signaling. J. Immunol. 2004, 173, 2913–2917. [Google Scholar] [CrossRef]
  49. Rittig, M.G.; Kaufmann, A.; Robins, A.; Shaw, B.; Sprenger, H.; Gemsa, D.; Foulongne, V.; Rouot, B.; Dornand, J. Smooth and rough lipopolysaccharide phenotypes of Brucella induce different intracellular trafficking and cytokine/chemokine release in human monocytes. J. Leukoc. Biol. 2003, 74, 1045–1055. [Google Scholar] [CrossRef]
  50. Kelly, N.M.; Young, L.; Cross, A.S. Differential induction of tumor necrosis factor by bacteria expressing rough and smooth lipopolysaccharide phenotypes. Infect. Immun. 1991, 59, 4491–4496. [Google Scholar] [CrossRef]
  51. Duenas, A.I.; Orduna, A.; Crespo, M.S.; Garcia-Rodriguez, C. Interaction of endotoxins with Toll-like receptor 4 correlates with their endotoxic potential and may explain the proinflammatory effect of Brucella spp. LPS. Int. Immunol. 2004, 16, 1467–1475. [Google Scholar] [CrossRef]
  52. Zanoni, I.; Bodio, C.; Broggi, A.; Ostuni, R.; Caccia, M.; Collini, M.; Venkatesh, A.; Spreafico, R.; Capuano, G.; Granucci, F. Similarities and differences of innate immune responses elicited by smooth and rough LPS. Immunol. Lett. 2011, 142, 41–47. [Google Scholar] [CrossRef] [PubMed]
  53. Pupo, E.; Lindner, B.; Brade, H.; Schromm, A.B. Intact rough- and smooth-form lipopolysaccharides from Escherichia coli separated by preparative gel electrophoresis exhibit differential biologic activity in human macrophages. FEBS J. 2012, 280, 1095–1111. [Google Scholar] [CrossRef] [PubMed]
  54. Triantafilou, M.; Triantafilou, K.; Fernandez, N. Rough and smooth forms of fluorescein-labelled bacterial endotoxin exhibit CD14/LBP dependent and independent binding that is influenced by endotoxin concentration. Eur. J. Biochem. 2000, 267, 2218–2226. [Google Scholar] [CrossRef] [PubMed]
  55. Zanoni, I.; Ostuni, R.; Marek, L.R.; Barresi, S.; Barbalat, R.; Barton, G.M.; Granucci, F.; Kagan, J.C. CD14 controls the LPS-induced endocytosis of Toll-like Receptor 4. Cell 2011, 147, 868–880. [Google Scholar] [CrossRef] [PubMed]
  56. Pei, J.; Turse, J.E.; Ficht, T.A. Evidence of Brucella abortus OPS dictating uptake and restricting NF-κB activation in murine macrophages. Microbes Infect. 2008, 10, 582–590. [Google Scholar] [CrossRef] [PubMed]
  57. Grao-Cruces, E.; Lopez-Enriquez, S.; Martin, M.E.; Montserrat-de la Paz, S. High-density lipoproteins and immune response: A review. Int. J. Biol. Macromol. 2022, 195, 117–123. [Google Scholar] [CrossRef]
  58. Hamann, L.; Alexander, C.; Stamme, C.; Zahringer, U.; Schumann, R.R. Acute-Phase Concentrations of Lipopolysaccharide (LPS)-Binding Protein Inhibit Innate Immune Cell Activation by Different LPS Chemotypes via Different Mechanisms. Infect. Immun. 2005, 73, 193–200. [Google Scholar] [CrossRef]
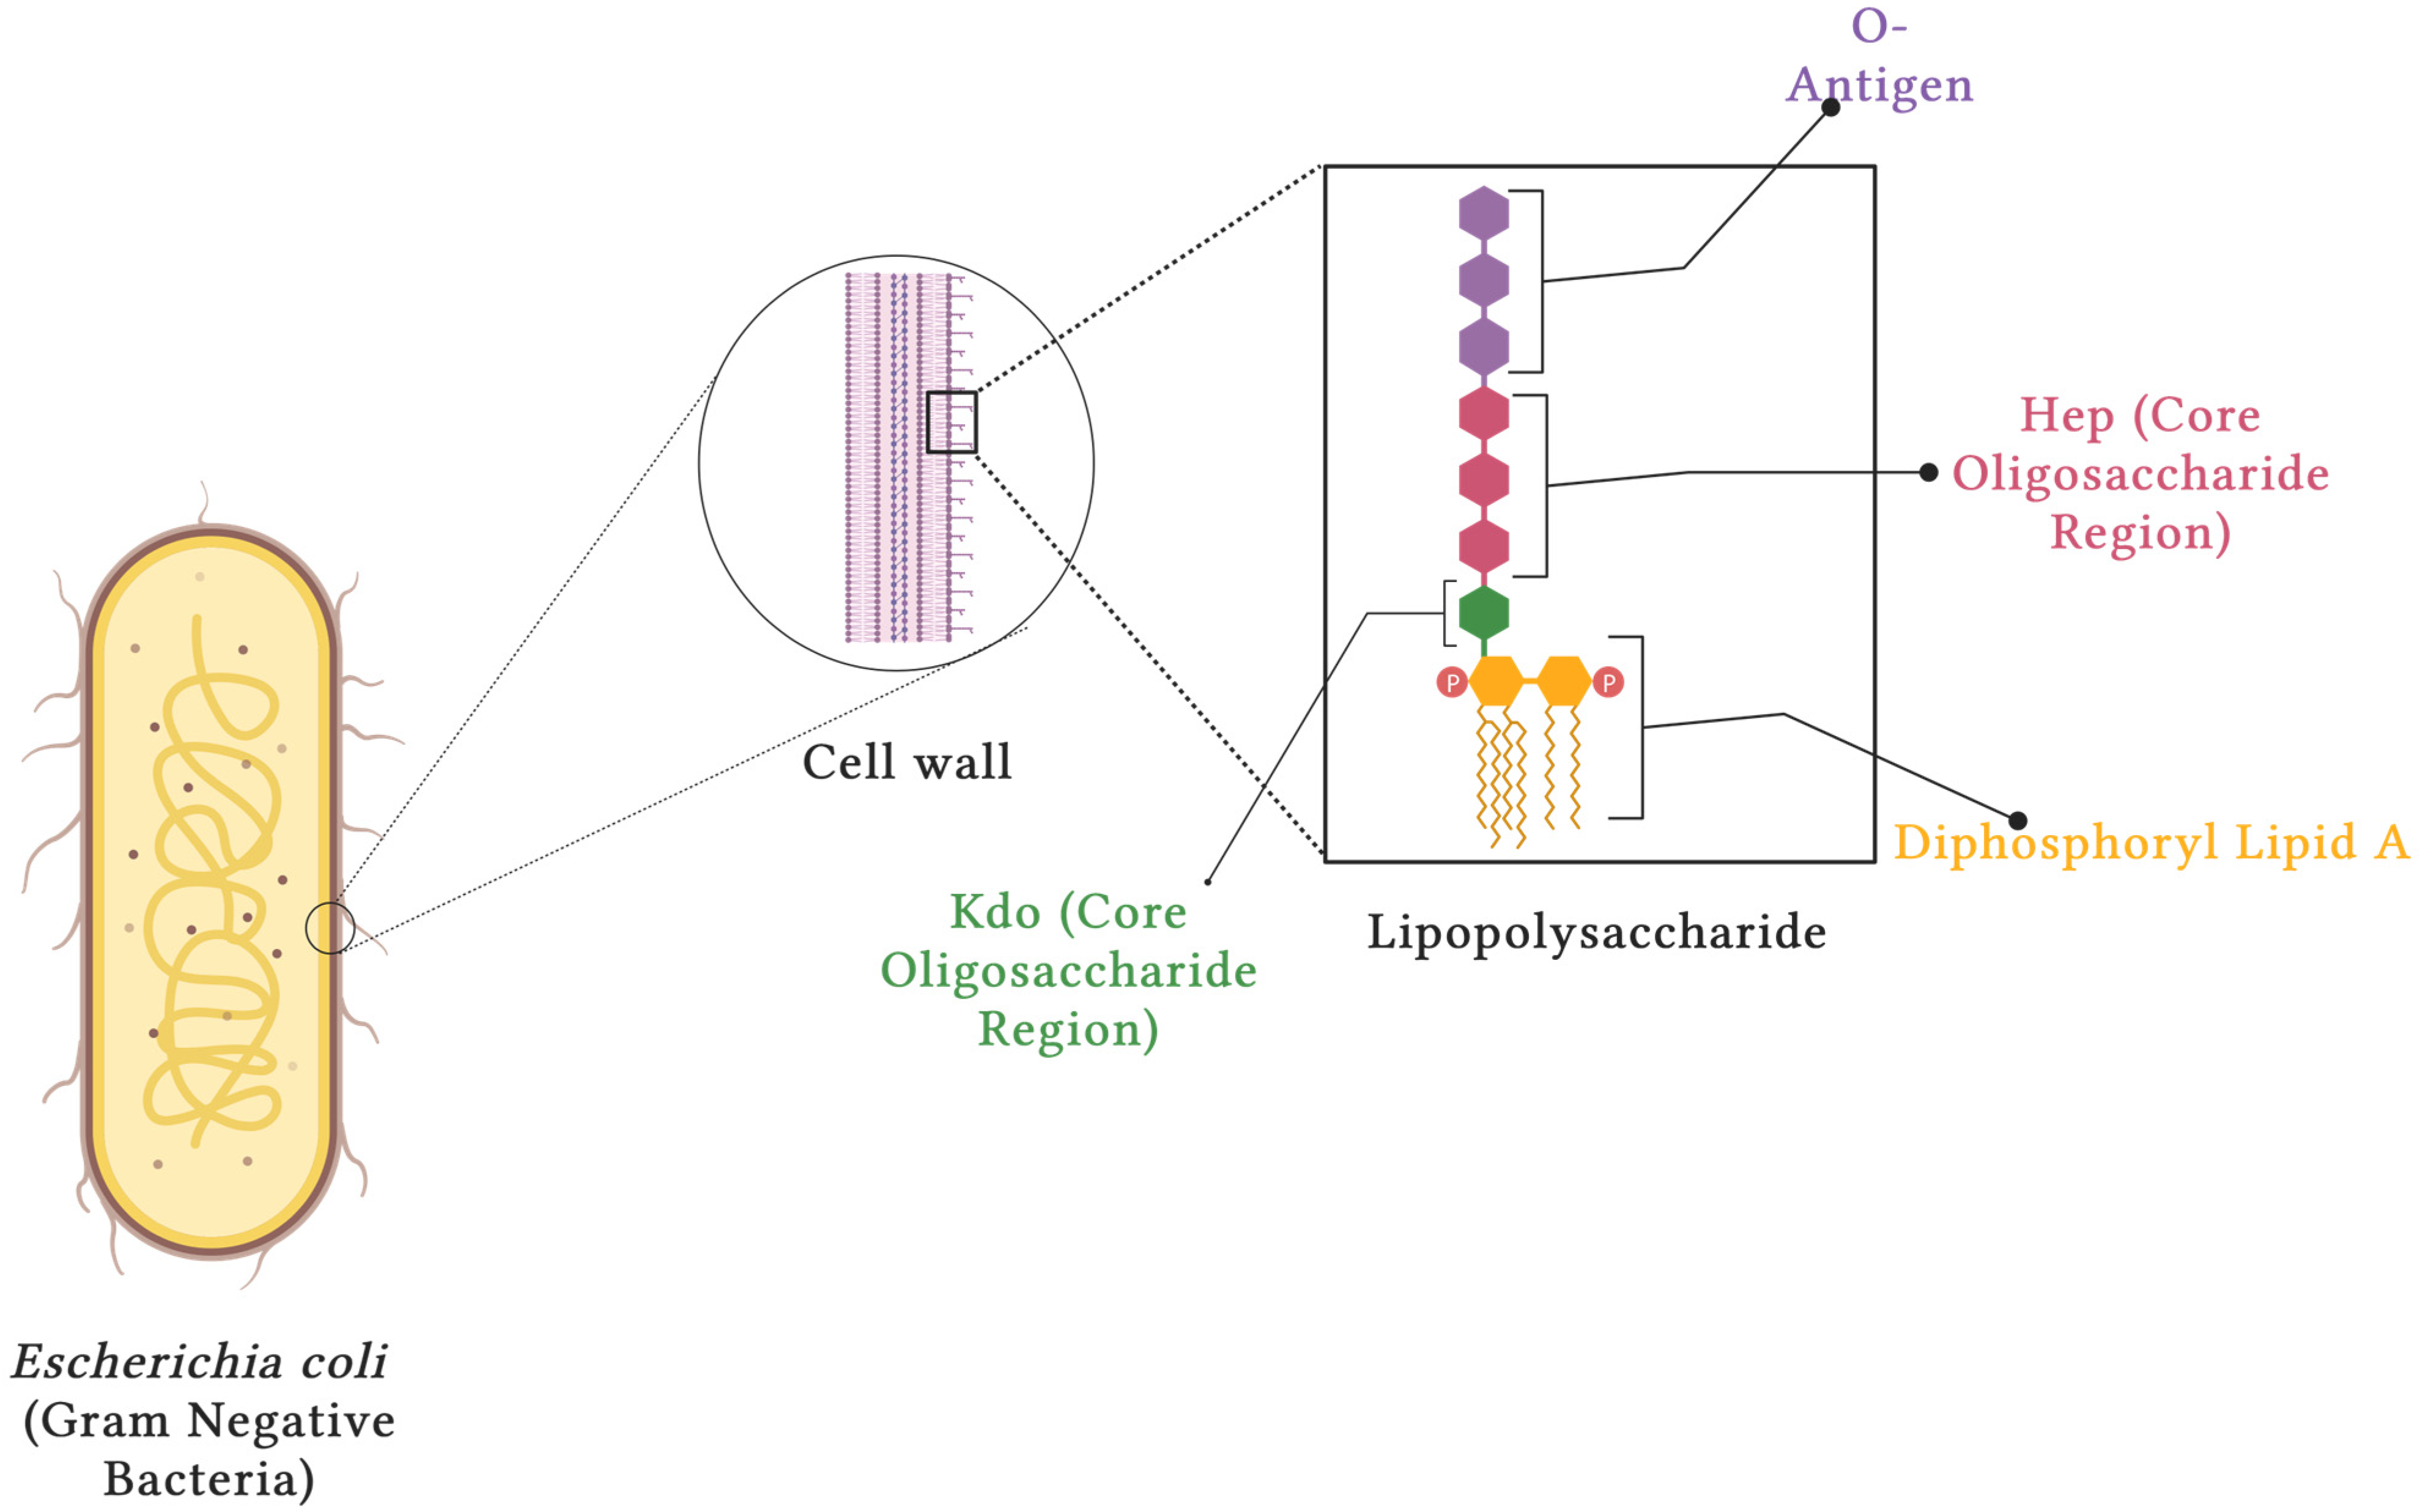
Figure 1. General structure of bacterial lipopolysaccharide [5,6,7,8]. Created with BioRender.com (web-based illustration software, ©2024). The LPS structure consists of three main components: the O-antigen; the core oligosaccharide region, which is split into the L-Glycero-D-Manno-Heptose region (Hep) and the 3-deoxy-d-manno-oct-2-ulosonic acid (Kdo); and the lipid A region.
Biology 13 00314 g001
Figure 2. Efficiency of LPCAT2 gene silencing in RAW264.7 macrophages with or without LPS infection. (A) The melt curve for the LPCAT2 amplicon was obtained by reverse transcribing LPCAT2 mRNA to cDNA and amplifying cDNA with real-time qPCR. Using R/ggplot2 (method = “gam”, formula = y~s (x, bs = “cs”)), the smooth curve was created from pooled data from all LPCAT2 RT-qPCR experiments (≥3 independent experiments). (B) A control group of RAW264.7 macrophages were transiently transfected with negative siRNA and infected with either E. coli O111:B4, J5, or K12, D31m4 LPS serotypes; non-infected cells were used as negative controls. After incubation, the cells were lysed for RNA extraction and RT-qPCR. (C) A group of RAW264.7 macrophages was transiently transfected with LPCAT2 siRNA and infected with either E. coli O111:B4, J5, or K12, D31m4 LPS serotypes; non-infected cells were used as negative controls. (D) LPCAT2 gene expression in the control group is compared with that in the silenced LPCAT2 group. Bars and error bars represent the mean ± standard error of the mean. **—p < 0.01, ***—p < 0.001, ****—p < 0.0001.
Biology 13 00314 g002
Figure 3. Transcriptional effects of silencing LPCAT2 gene in RAW264.7 macrophages. (A,E,I) The melt curves for TLR4, CD14, and MD2 amplicons were obtained by reverse transcribing mRNA to cDNA and amplifying cDNA with real-time qPCR. Using R/ggplot2 (method = “gam”, formula = y~s (x, bs = “cs”)), the smooth curves were created from pooled data from all TLR4, CD14, and MD2 RT-qPCR experiments (≥3 independent experiments). (B,F,J) A control group of RAW264.7 macrophages were transiently transfected with negative siRNA and infected with either E. coli O111:B4, J5, or K12, D31m4 LPS serotypes; non-infected cells were used as negative controls. After incubation, the cells were lysed for RNA extraction and RT-qPCR. (C,G,K) A group of RAW264.7 macrophages was transiently transfected with LPCAT2 siRNA and infected with either E. coli O111:B4, J5, or K12, D31m4 LPS serotypes; non-infected cells were used as negative controls. (D,H,L) LPCAT2 gene expression in the control group is compared with that in the silenced LPCAT2 group. Bars and error bars represent the mean ± standard error of the mean. *—p ≤ 0.05, **—p < 0.01, ***—p < 0.001, ****—p < 0.0001.
Biology 13 00314 g003
Figure 4. Transcriptional effects of overexpressing LPCAT2 on TLR4 and CD14 gene expression in RAW264.7 macrophages. A control group of RAW264.7 macrophages were transiently transfected with either empty vectors (plasmid vectors with no target sequence) or LPCAT2 vectors (plasmid vectors with LPCAT2 sequence) and infected with either E. coli O111:B4, J5, or K12, D31m4 LPS serotypes; non-infected cells were used as negative controls. After incubation, the cells were lysed for RNA extraction and RT-qPCR. (AC) Comparison of LPCAT2, TLR4, and CD14 gene expression in non-infected and LPS-infected cells. (DF) Comparison of LPCAT2, TLR4, and CD14 gene expression in the control group and overexpressed LPCAT2 group. Bars and error bars represent the mean ± standard error of the mean. *—p ≤ 0.05, **—p < 0.01, ***—p < 0.001, ****—p < 0.0001. Data were obtained from at least three independent experiments.
Biology 13 00314 g004
Figure 5. Transcriptional effects of silencing LPCAT2 gene in RAW264.7 macrophages. (A,E,I,M). The melt curves for TNF Alpha, IL6, IFN Beta, and IP10 amplicons were obtained by reverse transcribing mRNA to cDNA and amplifying cDNA with real-time qPCR. Using R/ggplot2 (method = “gam”, formula = y~s (x, bs = “cs”)), the smooth curves were created from pooled data from all TNF Alpha, IL6, IFN Beta, and IP10 RT-qPCR experiments (≥3 independent experiments). (B,F,J,N) A control group of RAW264.7 macrophages were transiently transfected with negative siRNA and infected with either E. coli O111:B4, J5, or K12, D31m4 LPS serotypes; non-infected cells were used as negative controls. After incubation, the cells were lysed for RNA extraction and RT-qPCR. (C,G,K,O) A group of RAW264.7 macrophages was transiently transfected with LPCAT2 siRNA and infected with either E. coli O111:B4, J5, or K12, D31m4 LPS serotypes; non-infected cells were used as negative controls. (D,H,L,P) LPCAT2 gene expression in the control group is compared with that in the silenced LPCAT2 group. Bars and error bars represent the mean ± standard error of the mean. *—p ≤ 0.05, **—p < 0.01, ***—p < 0.001, ****—p < 0.0001.
Biology 13 00314 g005
Disclaimer/Publisher’s Note: The statements, opinions and data contained in all publications are solely those of the individual author(s) and contributor(s) and not of MDPI and/or the editor(s). MDPI and/or the editor(s) disclaim responsibility for any injury to people or property resulting from any ideas, methods, instructions or products referred to in the content.