1. Introduction
Biological sequences usually refer to nucleotides or amino-acid-based sequences, and their analysis can provide detailed information about the functional and structural behaviors of the corresponding viruses, which are usually responsible for causing diseases, for example, flu [
1] and COVID-19 [
2]. This information is very useful in building prevention mechanisms, such as drugs [
3], vaccines [
4], etc., and to control the disease spread, eliminate the negative impacts, and perform virus spread surveillance.
Influenza A virus (IAV) is such an example, which is responsible for causing a highly contagious respiratory illness that can significantly threaten global public health. As the Centers for Disease Control and Prevention Center (CDC) (
https://www.cdc.gov/flu/weekly/index.htm, accessed on 20 April 2023) reports, so far this season, there have been at least 25 million illnesses, 280,000 hospitalizations, and 17,000 deaths from flu in the United States. Therefore, identifying and tracking the evolution of IAV accurately is a vital step in the fight against this virus. The classification of IAV is an essential task in this aspect as it can provide valuable information on the origin, evolution, and spread of the virus. Similarly, coronaviruses are also known to infect multiple hosts and create global health crises [
5] by causing pandemics, for instance, COVID-19, which is caused by the SARS-CoV-2 coronavirus. Therefore, determining the infected host information of this virus is essential for understanding the genetic diversity and evolution of the virus. As the spike protein region from the coronavirus genome is used to attach to the host cell membrane, so utilizing only the spike region provide sufficient information to determine the corresponding host. Moreover, the identification of the viral taxonomy can further enrich its understanding, e.g., the viral polymerase palmprint sequence of a virus is utilized to determine its taxonomy (species generally) [
6]. A polymerase palmprint is a unique sequence of amino acids located at the thumb subunit of the viral RNA-dependent polymerase. Furthermore, examining the antigen specificities based on the T-cell receptor sequences can provide beneficial information regarding solving numerous problems of both basic and applied immunology research.
Many traditional sequence analysis methods follow phylogeny-based techniques [
7,
8] to identify sequence homology and predict disease transmission. However, the availability of large-size sequence data exceeds the computational limit of such techniques. Moreover, the application of ML approaches for performing biological sequence analysis is a popular research topic these days [
9,
10]. The ability of ML methods to determine the sequence’s biological functions makes them desirable to be employed for sequence analysis. Additionally, ML models can also determine the relationship between the primary structure of the sequence and its biological functions. For example, ref. [
9] built a random forest-based algorithm to classify the sucrose transporter (SUT) protein, ref. [
10] designed a novel tool for protein–protein interactions data and functional analysis, and ref. [
11] developed a new ML model to identify RNA pseudo-uridine modification sites. ML-based biological sequence analysis approaches can be categorized into feature-engineering-based methods [
12,
13], kernel-based methods [
14], neural network-based techniques [
15,
16], and pre-trained deep learning models [
17,
18]. However, extrinsic factors limit the performance of ML-based techniques and one such major factor is data imbalance, as in the case of biological sequences, the data are generally imbalanced because the number of negative samples is much larger than that of positive samples [
19]. ML models can obtain the best results when the dataset is balanced while unbalanced data will greatly affect the training of machine learning models and their application in real-world scenarios [
20].
In this paper, we explore the idea of improving the performance of ML methods for biological sequence analysis by eradicating the data imbalance challenge using generative adversarial networks (GANs). Our method leverages the strengths of GANs to effectively analyze these sequences, with the potential to have significant implications for virus surveillance and tracking, as well as the development of new antiviral strategies. By accurately classifying the viral sequences, our study contributes to the field of virus surveillance and tracking. The ability to effectively identify and track viral strains can assist in monitoring the spread of infectious diseases, understanding the evolution of viruses, and informing public health interventions. Moreover, the accurate classification of the viral sequences has significant implications for the development of antiviral strategies. By better understanding the genetic diversity and relatedness of viral strains, researchers can identify potential targets for antiviral therapies, design effective vaccines, and predict the emergence of drug-resistant strains. We discuss how our study’s findings can contribute to these areas, emphasizing the importance of accurate sequence analysis in guiding the development of new antiviral strategies.
Our contributions to this work are as follows:
We explore the idea of classifying biological sequences using generative adversarial networks (GANs).
We show that usage of GANs improves predictive performance by eliminating the data imbalance challenge.
We demonstrated the potential implications of the proposed approach for virus surveillance and tracking, and for the development of new antiviral strategies.
The rest of the paper is organized as follows:
Section 2 contains the related work. The proposed approach details are discussed in
Section 3. The datasets used in the experiments along with the ML models and evaluation metrics information is provided in
Section 4.
Section 5 highlights the experimental results and their discussion. Finally, the paper is concluded in
Section 6.
2. Related Work
The combination of biological sequence analysis and ML models has gained quite a lot of attention among researchers in recent years [
9,
10]. As a biological sequence consists of a long string of characters corresponding to either nucleotides or amino acids, it needs to be transformed into a numerical form to make it compatible with the ML model. Various numerical embedding generation mechanisms are proposed to extract features from the biological sequences [
12,
15,
18].
Some of the popular embedding generation techniques use the underlying concept of
k-mer to compute the embeddings. Similar to how refs. [
21] use the
k-mers frequencies to obtain the vectors, refs. [
13,
22] combine position distribution information and
k-mers frequencies to obtain the embeddings. Other approaches [
15,
16] employ neural networks to obtain the feature vectors. Moreover, kernel-based methods [
14] and pre-trained deep-learning-model-based methods [
17,
18] also play a vital role in generating the embeddings. Although all these techniques illustrate promising analysis results, they have not mentioned anything about dealing with data imbalance issues, which if handled properly, will yield performance improvement.
Furthermore, another set of methods tackles the class imbalance challenge with the aim to enhance overall analytical performance. They use resampling techniques at the data level by either oversampling the minority class or undersampling the majority class. For instance, ref. [
9] uses the borderline-SMOTE algorithm [
23], an oversampling approach, to balance the feature set of the sucrose transporter (SUT) protein dataset. However, due to the usage of the k-nearest neighbor algorithm, borderline-SMOTE has high time complexity and is susceptible to noise data and is unable to make good use of the information of the majority samples [
24]. Similarly, ref. [
25] performs protein classification by handling the data imbalance using a hybrid sampling algorithm that combines both ensemble classifier and over-sampling techniques, KernelADASYN [
26] employs a kernel-based adaptive synthetic over-sampling approach to deal with data imbalance. However, these methods do not utilize the overall data distribution, they are only based on local information [
27].
3. Proposed Approach
In this section, we discuss our idea of exploring GANs to obtain analytical performance improvement for biological sequences in detail. As our input sequence data consists of string sequences representing amino acids, they need to be transformed into numerical representations in order to operate GANs on them. For that purpose, we use four distinct and effective numerical feature generation methods, which are described below.
3.1. Spike2Vec [21]
Spike2Vec generates the feature embedding by computing the k-mers of a sequence. As k-mers are known to preserve the ordering information of the sequence. K-mers represent a set of consecutive substrings of length k driven from a sequence. For s sequence with length N, the total number of its k-mers will be . This method devises the feature vector for a sequence by capturing the frequencies of its k-mers. To further deal with the curse of dimensionality issue, Spike2Vec uses random Fourier features (RFF) to map data to a randomized low-dimensional feature space. We use to obtain the embeddings.
3.2. PWM2Vec [22]
This method works by using the concept of
k-mers to obtain the numerical form of the biological sequences, however, rather than utilizing constant frequency values of the
k-mers, it assigns weights to each amino acid of the
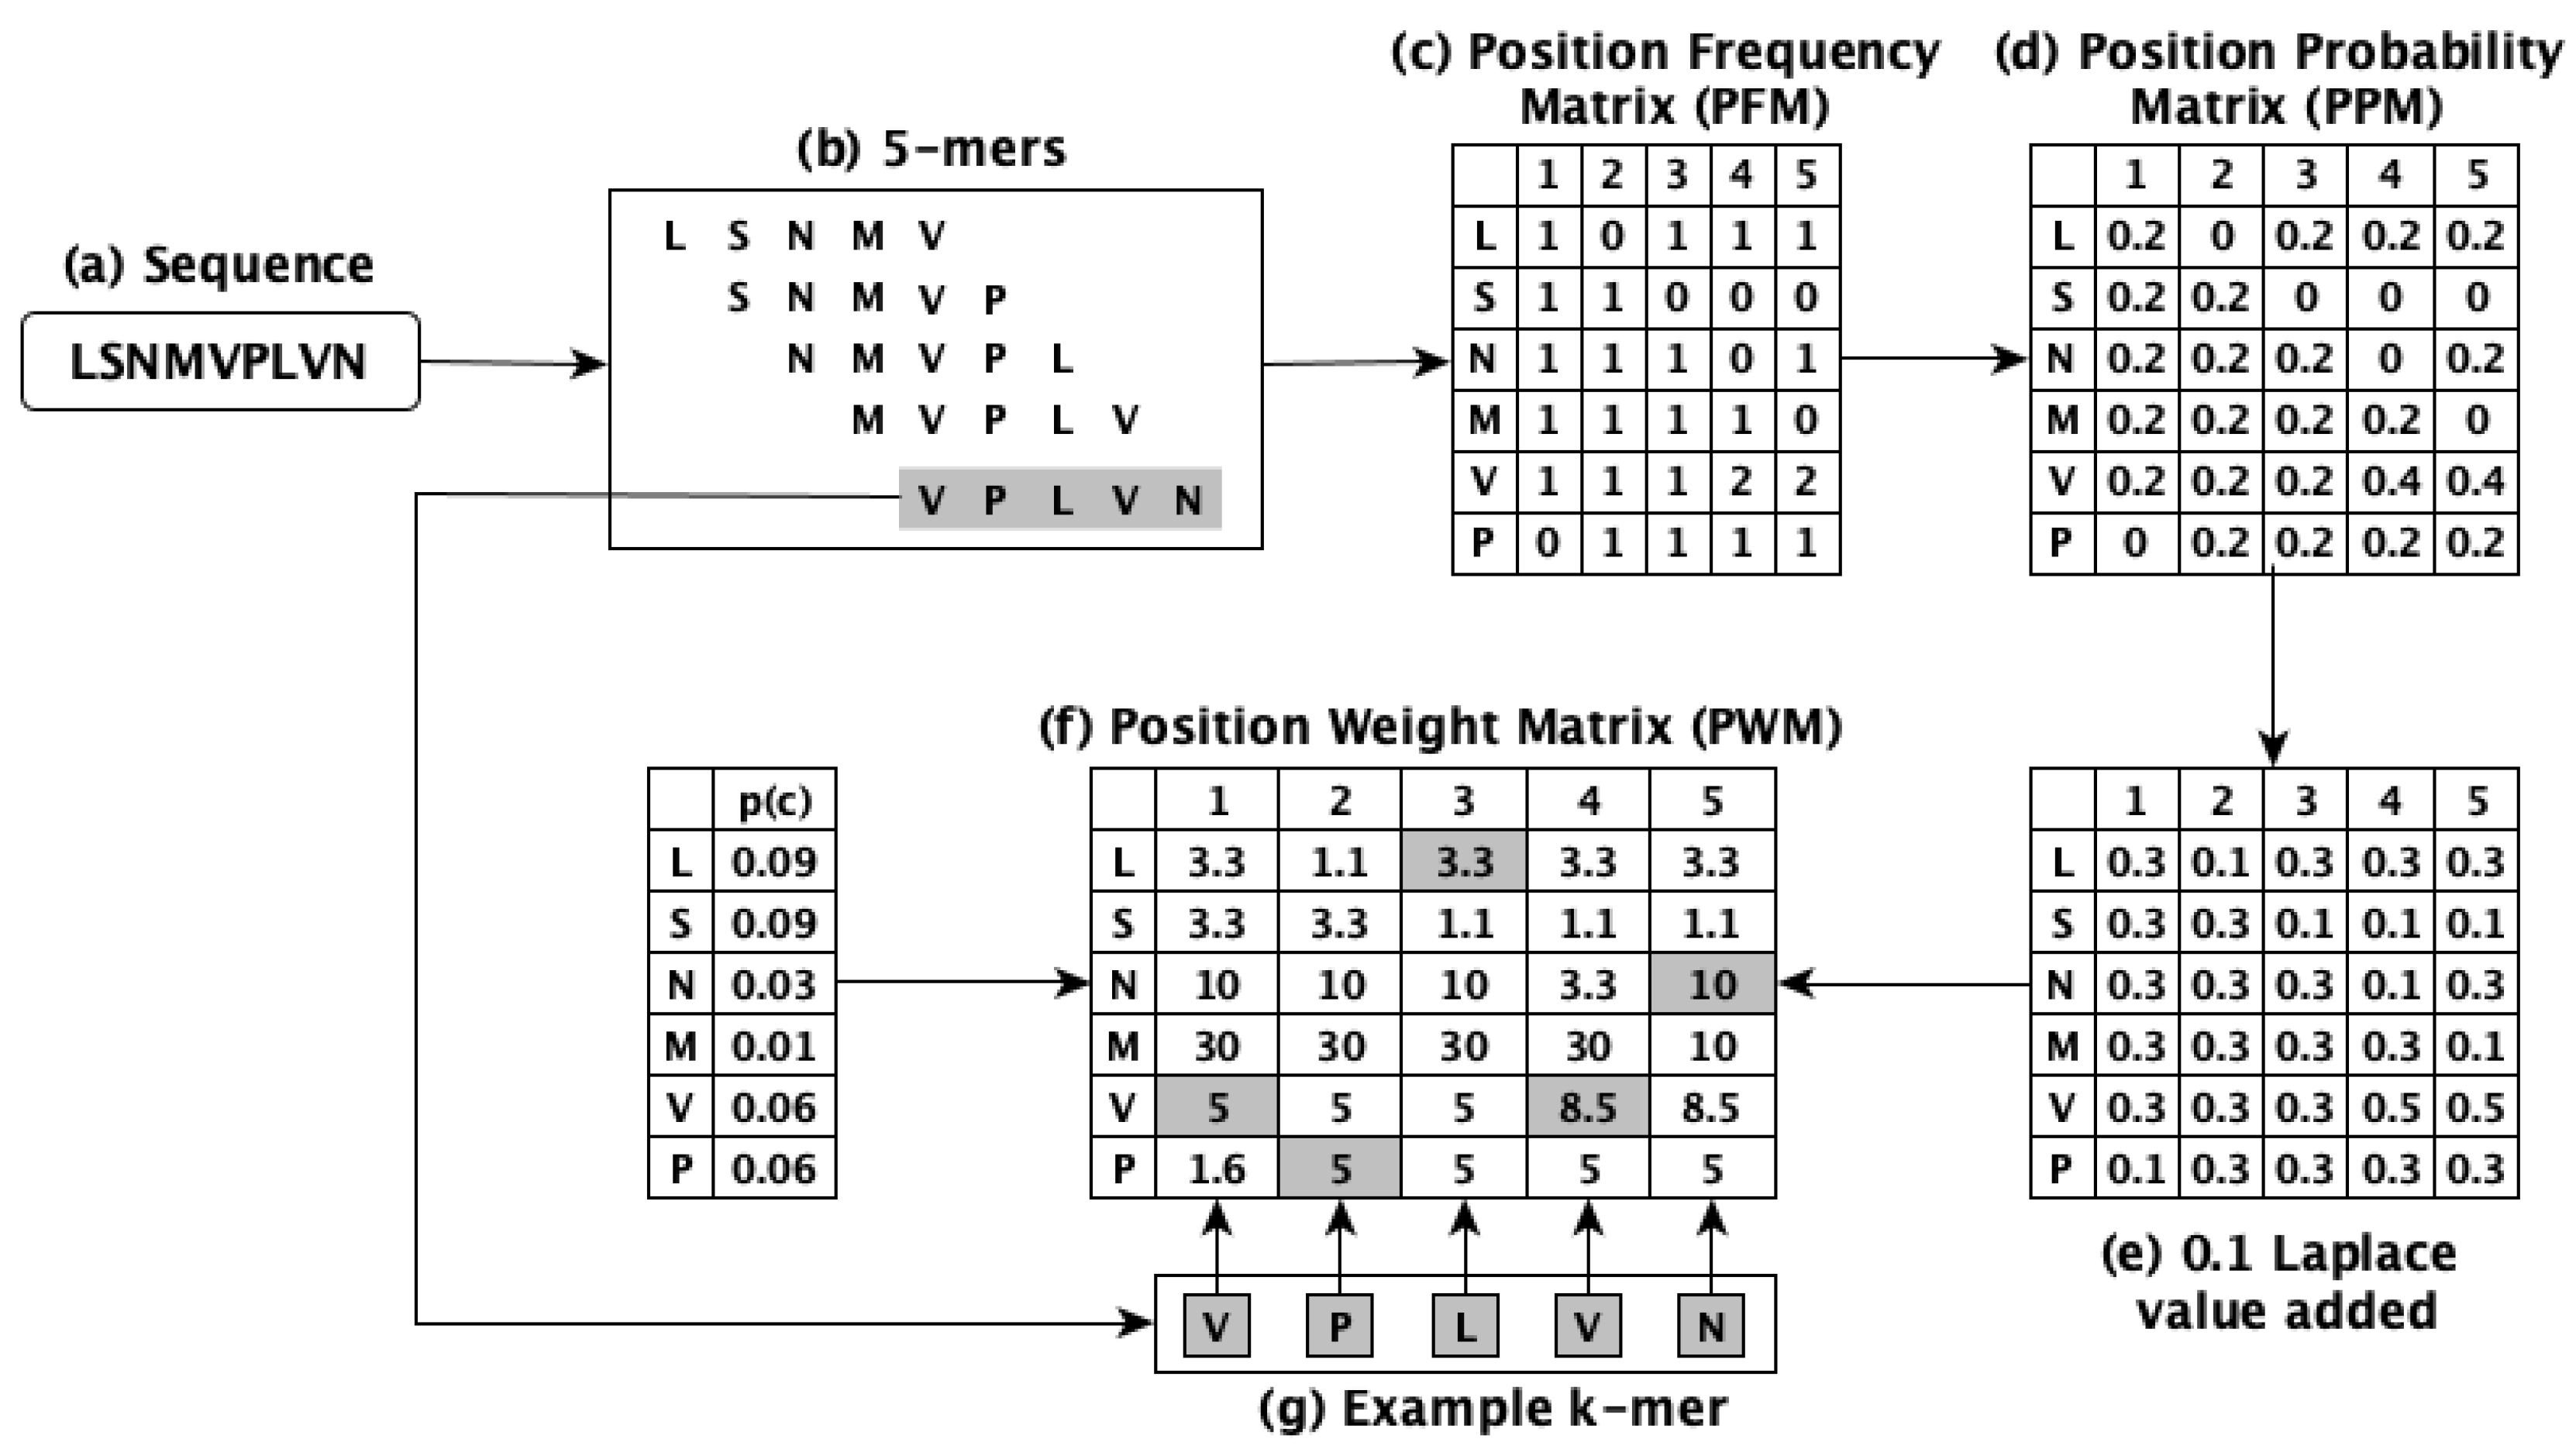
k-mers and employs these weights to generate the embeddings. The position weight matrix (PWM) is used to determine the weights. PWM2Vec considers the relative importance of amino acids along with preserving the ordering information. The workflow of this method is illustrated in
Figure 1 which uses
, while our experiments use
to obtain the embeddings for performing the classification tasks.
3.3. Minimizer
This approach is based on the utility of minimizers [
28] (
m-mer) to obtain the feature vectors of sequences. The minimizer is extracted from a
k-mer and it is a
m length lexicographically smallest (in both forward and backward order) substring of consecutive alphabets from the
k-mer. Note that
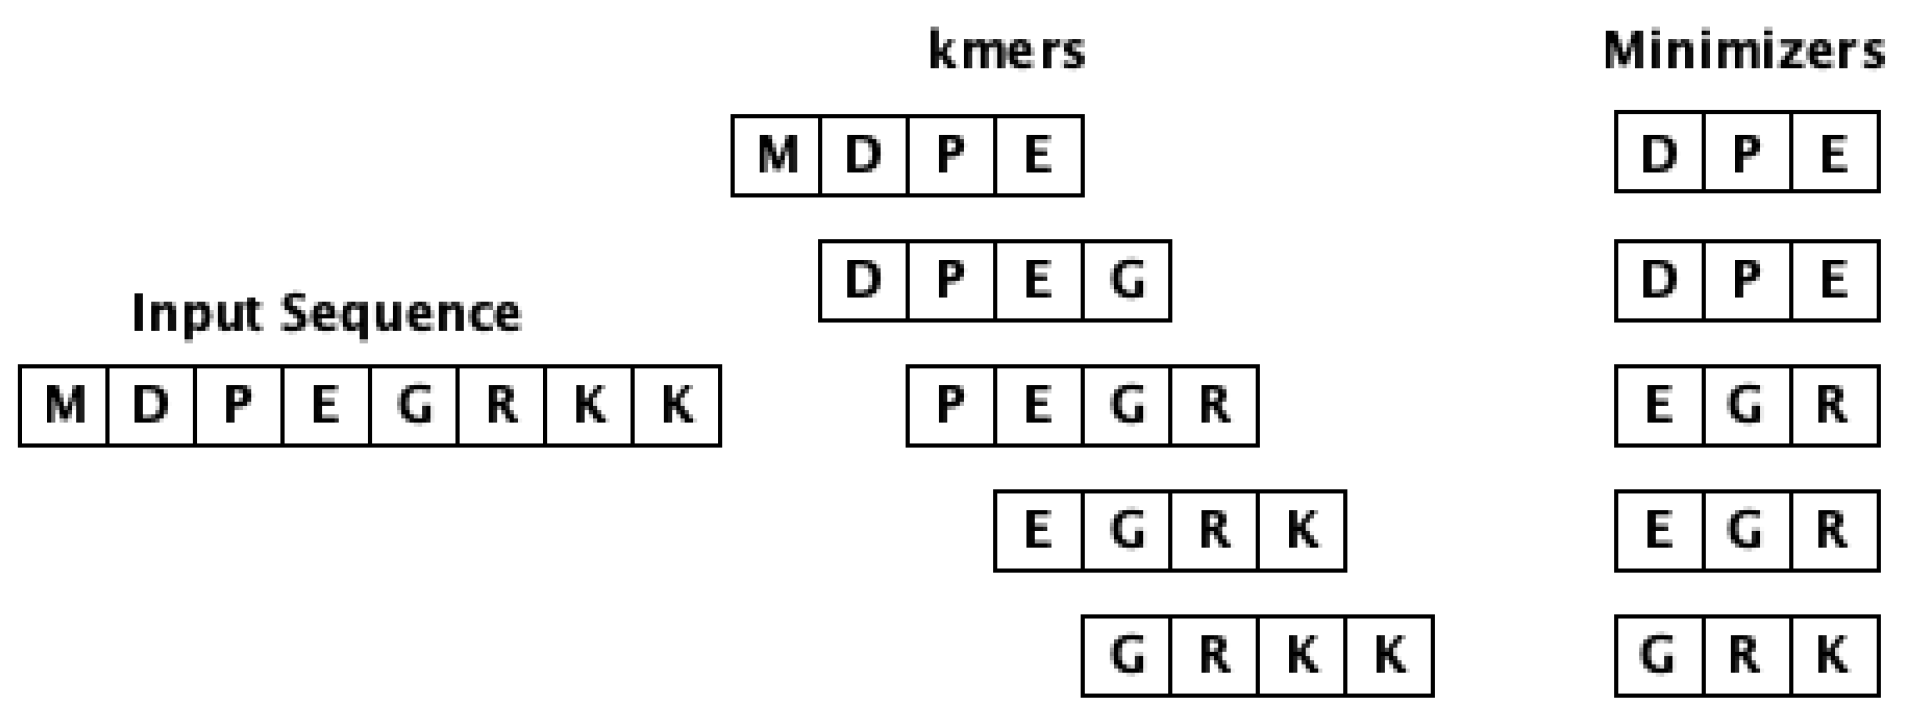
. The workflow of computing minimizers for a given input sequence is shown in
Figure 2. This approach intends to eliminate the redundancy issue associated with
k-mers, hence improving the storage and computation cost. Our experiments used
and
to generate the embeddings.
After obtaining the numerical embeddings of the biological sequences using the methods mentioned above, we further utilize these embeddings to train our GAN model. We utilize annotated groups as input to the GAN. This model has two parts, a generator model and a discriminator model. Each discriminator and generator model consists of two inner dense layers with ReLU activation functions (each followed by a batch-normalization layer) and a final dense layer. In the discriminator, the final dense layer has a Sigmoid activation function while the generator has a SoftMax activation function. The generator’s output has the same dimensions as the input data, as it synthesizes the data, while the discriminator yields a binary scalar value to indicate whether the generated data are fake or real.
The GAN model is trained using the cross-entropy loss function, ADAM optimizer, 32 batch size, and 1000 iterations. The steps followed to obtain the synthetic data after the training GAN model is illustrated in Algorithm 1. As given in the algorithm, first, the generator and discriminator models are created in steps 1–2. Then, the discriminator model is complied for training with cross-entropy loss and ADAM optimizer in step 3. After that, the count and length of synthetic sequences along with the number of training epochs and batch size are mentioned in steps 4–6. Then, the training of the models occurs in steps 7–12 , where each of the models is fine-tuned for the given number of iterations. Once the GAN model is trained, its generator part is employed to synthesize new embedding data which resemble real-world data. These synthesized data can eliminate the data imbalance problem, improving the analytical performance. Moreover, the overall workflow of training the GAN model is shown in
Figure 3. The figure illustrates the training procedure of the GAN model by fine-tuning the parameters of its generator and discriminator modules. It starts by obtaining the numerical embeddings of the input sequences and passing them to the discriminator part along with the synthetic data generated by the generator part. The discriminator model is trained in a way that it can identify whether the data are real or synthetic, and based on this information, we fine-tune the generator model. The overall goal is training the generator model to the extent that the synthetic data generated by it cannot be distinguished by the discriminator model anymore, which means that the synthetic data are very close to the real data.
| Algorithm 1 Training GAN model |
| Input: Set of Sequences S, |
| Output: GANs based sequences |
| 1: | ▹ generator model |
| 2: | ▹ discriminator model |
| 3: | |
| 4: | ▹ len of each sequence |
| 5: | |
| 6: | |
| 7: for i in do | |
| 8: | |
| 9: | ▹ get GAN sequences |
| 10: | ▹ fine-tune |
| 11: | ▹ fine-tune |
| 12: end for | |
| 13: return() | |
4. Experimental Setup
This section highlights the details of the datasets used to conduct the experiments along with the information about the classification models and their respective evaluation metrics to report the performance. All experiments were carried out on an Intel (R) Core i5 system with a 2.40 GHz processor and 32 GB memory. We use Python to run the experiments. Our code and preprocessed datasets are available online for reproducibility (
https://github.com/taslimmurad-gsu/GANs-Bio-Seqs/tree/main, accessed on 20 April 2023).
4.1. Dataset Statistics
We use 4 different datasets to evaluate our suggested method. A detailed description of each of the dataset is given as follows.
4.1.1. Influenza A Virus
We are using the influenza A virus sequence dataset belonging to two kinds of subtypes “H1N1” and “H3N2” extracted from [
29] website. These data contain
sequences in total with
sequences belonging to the H1N1 subtype and
to the H2N3 subtype. The detailed statistics for this dataset are shown in
Table 1. We use these two subtypes as labels to classify the Influenza A virus in our experiments.
4.1.2. PALMdb
The PALMdb [
6,
30] dataset consists of viral polymerase palmprint sequences, which can be classified species-wise. This dataset is created by mining the public sequence databases using the palmscan [
6] algorithm. It has 124,908 sequences corresponding to 18 different virus species. The distribution of these species is given in
Table 2 and more detailed statistics are shown in
Table 1. We use the species name as a label to do the classification of the PALMdb sequences.
4.1.3. VDjDB
VDJdb is a curated dataset of T-cell receptor (TCR) sequences with known antigen specificities [
31]. This dataset consists of 58,795 human TCRs and 3353 mouse TCRs. More than half of the examples are TRBs (
n = 36,462) with the remainder being TRAs (
n = 25,686). The T-cell receptor alpha chain (TRA) and T-cell receptor beta chain (TRB) refer to the chains that make up the T-cell receptor (TCR) complex. The TRB chain plays a crucial role in antigen recognition and is involved in T-cell immune responses. It has
total sequences belonging to 17 unique antigen species. The distribution of the sequence among the antigen species is shown in
Table 3 and further details of the dataset are given in
Table 1. We use these data to perform the antigen species classification.
4.1.4. Coronavirus Host
The host dataset consists of spike sequences of coronavirus corresponding to various infected hosts. These data are extracted from ViPR [
32] and GISAID [
33]. They contain 5558 total sequences belonging to 21 unique hosts and their detailed distribution is shown in
Table 4.
4.2. ML Classifiers and Evaluation Metrics
To perform classification tasks, we employed the following ML models: naive Bayes (NB), multilayer perceptron (MLP), k-nearest neighbor (k-NN) (where ), random forest (RF), logistic regression (LR), and decision tree (DT). For each classification task, the data are split into 30–70% train–test sets using stratified sampling to preserve the original data distribution. Furthermore, our experiments were conducted by averaging the performance results of 5 runs for each combination of dataset and classifier to obtain more stable results.
We evaluated the classifiers using the following performance metrics: accuracy, precision, recall, weighted F1, F1 macro, and ROC AUC macro. Since we are doing multi-class classification in some cases, we utilized the one-vs-rest approach for computing the ROC AUC score for them. Moreover, the reason for reporting many metrics is to obtain more insight into the classifiers’ performance, especially in the class imbalance scenario where reporting only accuracy does not provide sufficient performance information.
5. Results and Discussion
This section discusses the experimental results comprehensively. The subtype classification results of the Influenza A virus dataset are given in
Table 5, along with the results of the PALMdb dataset species-wise classification. The antigen species-wise classification results of VDjDB data and host-wise classification results of coronavirus host data are shown in
Table 6. The reported results represent the results achieved using the test set.
We have compared the classification performance of three embedding generation methods (Spike2Vec, PWM2Vec, Min2Vec) using four datasets (Influenza A virus, PALMdb, VDjDb, Host) under three different settings (without-GANs, with-GANs, only-GANs). Without-GANs indicate the scenario where the original embeddings from the three embedding generation methods are used to perform the classifications, while with-GANs show the performance achieved using the original embeddings with the addition of the GANs-based synthetic data for eliminating the class imbalance challenge. The only-GANs setting is utilized to illustrate the performance gained by using only the synthetic data without the original one. It provides an overview of the effectiveness of the synthetic data in terms of classification predictive performance.
In the with-GANs scenario, for each dataset, the classes with a lower number of instances combine their respective GANs-based synthetic data to increase their count to make them comparable with the most frequent classes. This addition removes the data imbalance issue and the newly created dataset is further utilized for performing the classification tasks. Note that the synthetic data are only added to the training set, while the test set contains the original data, so the test set has the actual imbalance data distribution. A further detailed discussion of the results for each embedding method with various combinations of datasets and setting scenarios are given below.
5.1. Performance of without-GANs Data
These results illustrate the classification performance achieved corresponding to the embeddings generated by Spike2Vec, PWM2Vec, and minimizer strategies for each dataset. We can observe that for the Influenza A virus dataset, Spike2Vec and minimizer are exhibiting similar performance for almost all the classifiers and are better than PWM2Vec. However, the NB model yields minimum predictive performance for all the embeddings. Similarly, the VDjDb dataset portrays similar performance for Spike2Vec and minimizer for all evaluation metrics, while its PWM2Vec has a very low predictive performance. Moreover, all the embeddings achieve the same performance in terms of all the evaluation metrics for every classifier on the PALMdb dataset. For the host dataset, all the three embeddings are yielding very similar results with NB exhibiting the lowest and RF exhibiting the highest performances.
5.2. Performance of with-GANs Data
To view the impact of GAN-based data on the predictive performance for all the datasets, we evaluate the performance using the original embeddings with GAN-based synthetic data added to them, respectively. These GANs-based data are used to train the classifiers, while only the original data are used as test data. For a dataset, to generate the GAN data corresponding to an embedding generation method, the GAN model is trained with the original embeddings first and then new data are synthesized for that embedding. Every label of the embedding will have a different count of synthetic data added to it depending on its count in the original embedding data. The aim is to make the class distribution balanced in a dataset.
For Influenza A virus data, the results show that in some cases the addition of GANs-based synthetic data improves the performance as compared to the performance on the original data, such as for the KNN, RF, and NB classifiers corresponding to PWM2Vec methods. Similarly, on the VDjDB dataset, the GAN-based improvement is also witnessed in some cases, such as for all the classifiers corresponding to the PWM2Vec method except NB. Moreover, as the performance of the PALMdb dataset on the original data is at its maximum already, the addition of GAN embeddings has retained that performance. Furthermore, the host dataset combining the synthetic data with the original data shows a performance improvement for some scenarios; for instance, PWM2Vec-based classification using NB, KNN, and RF classifiers, Spike2Vec- and Min2Vec-based classifications using NB and KNN classifiers.
Generally, we can observe that the inclusion of GAN synthetic data in the training set can improve the overall classification performance. This is because the training set size increases and the data imbalance issue is resolved by adding the respective synthetic data.
5.3. Performance of Only-GANs Data
We also studied the classification performance gain of using only GANs-based embeddings without the original data. The results depict that for all four datasets, this category has the lowest predictive performance for all the combinations of classifiers and embeddings as compared to the performance on original data and on original data with GANs. As only the synthetic data are employed to train the classifiers, they are tested on the original data, which is why the performance is low as compared to others.
5.4. Data Visualization
We visualize our datasets using the popular visualization technique,
t-SNE [
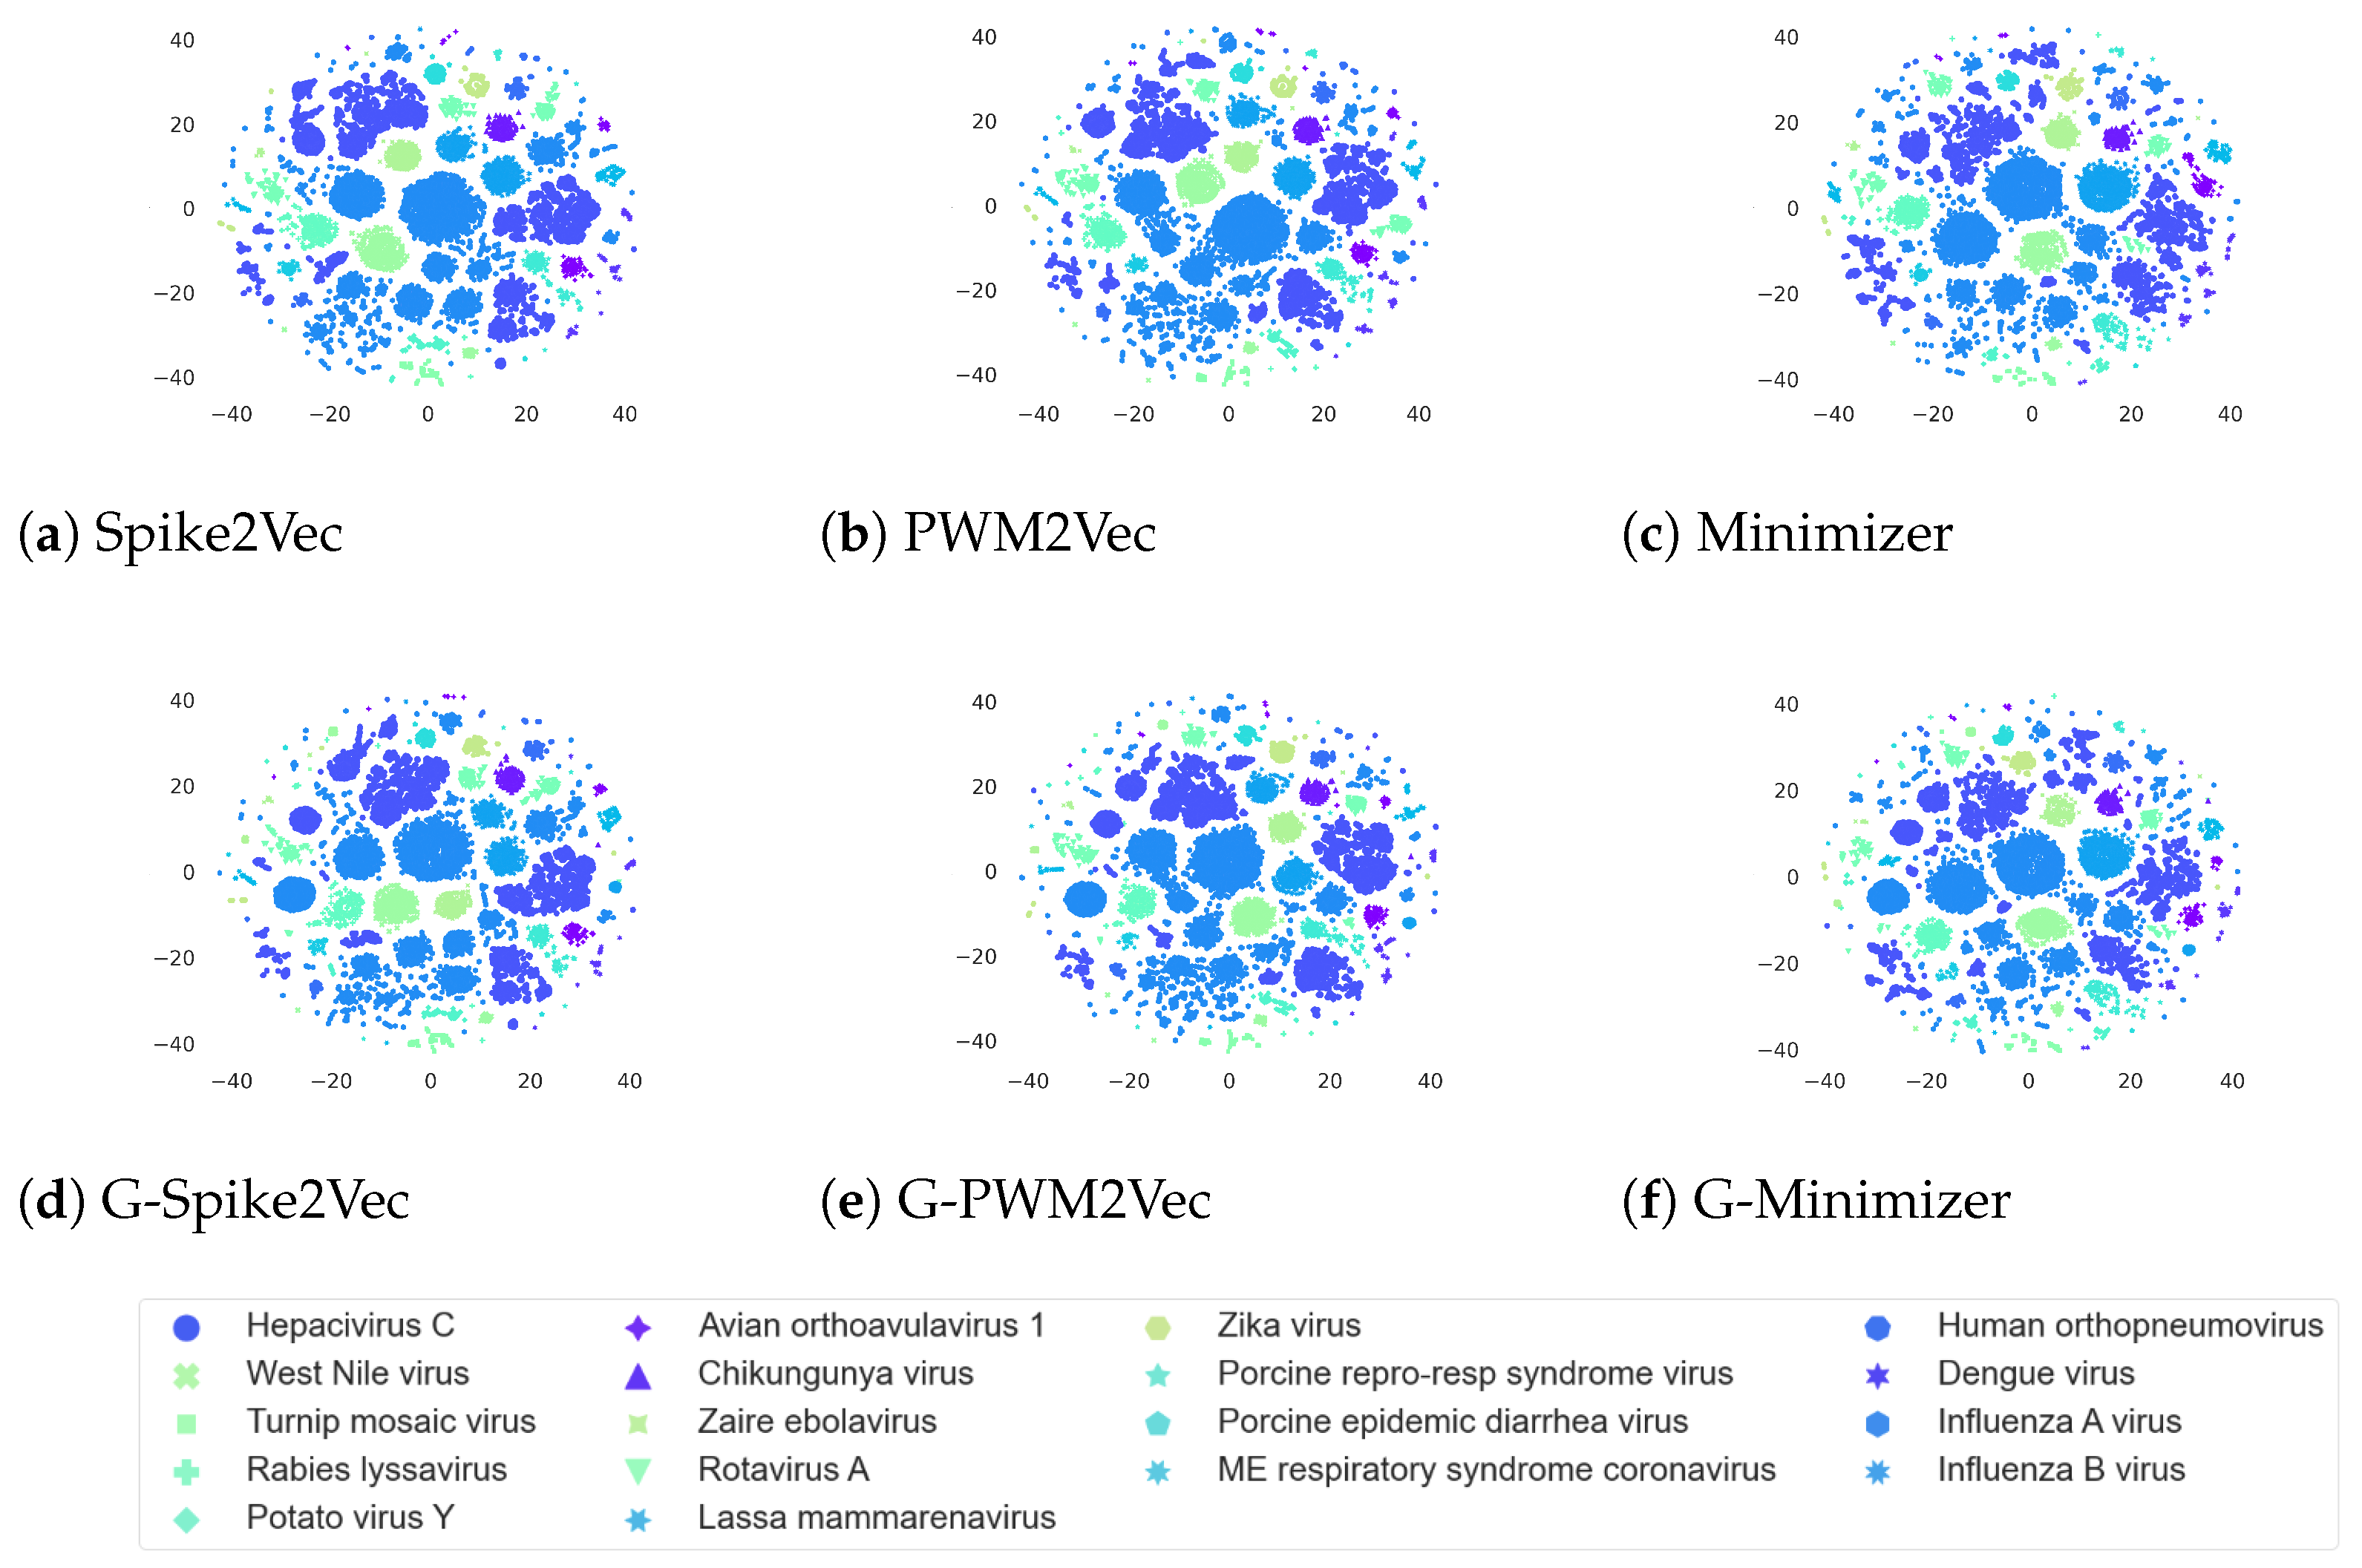
34], to view the internal structure of each dataset following various embeddings. The plots for the Influenza A virus dataset are reported in
Figure 4. We can observe that for Spike2Vec and minimizer-based plots, the addition of GAN-based features causes two big clusters along with the small scattered clusters for each, unlike their original
t-SNEs, which only consist of small scattered groups. However, the PWM2Vec-based plots for both with GANs and without GANs show similar structures; however, generally including GAN-based embeddings to the original ones can improve the
t-SNE structure.
Similarly, the
t-SNE plots for the PALMdb dataset corresponding to different embeddings are shown in
Figure 5. We can observe that this dataset shows similar kinds of cluster patterns corresponding to both without-GANs- and with-GANs-based embeddings. As the original dataset already shows clear and distinct clusters for various species, adding GAN-based embedding to it does not affect the cluster structure much.
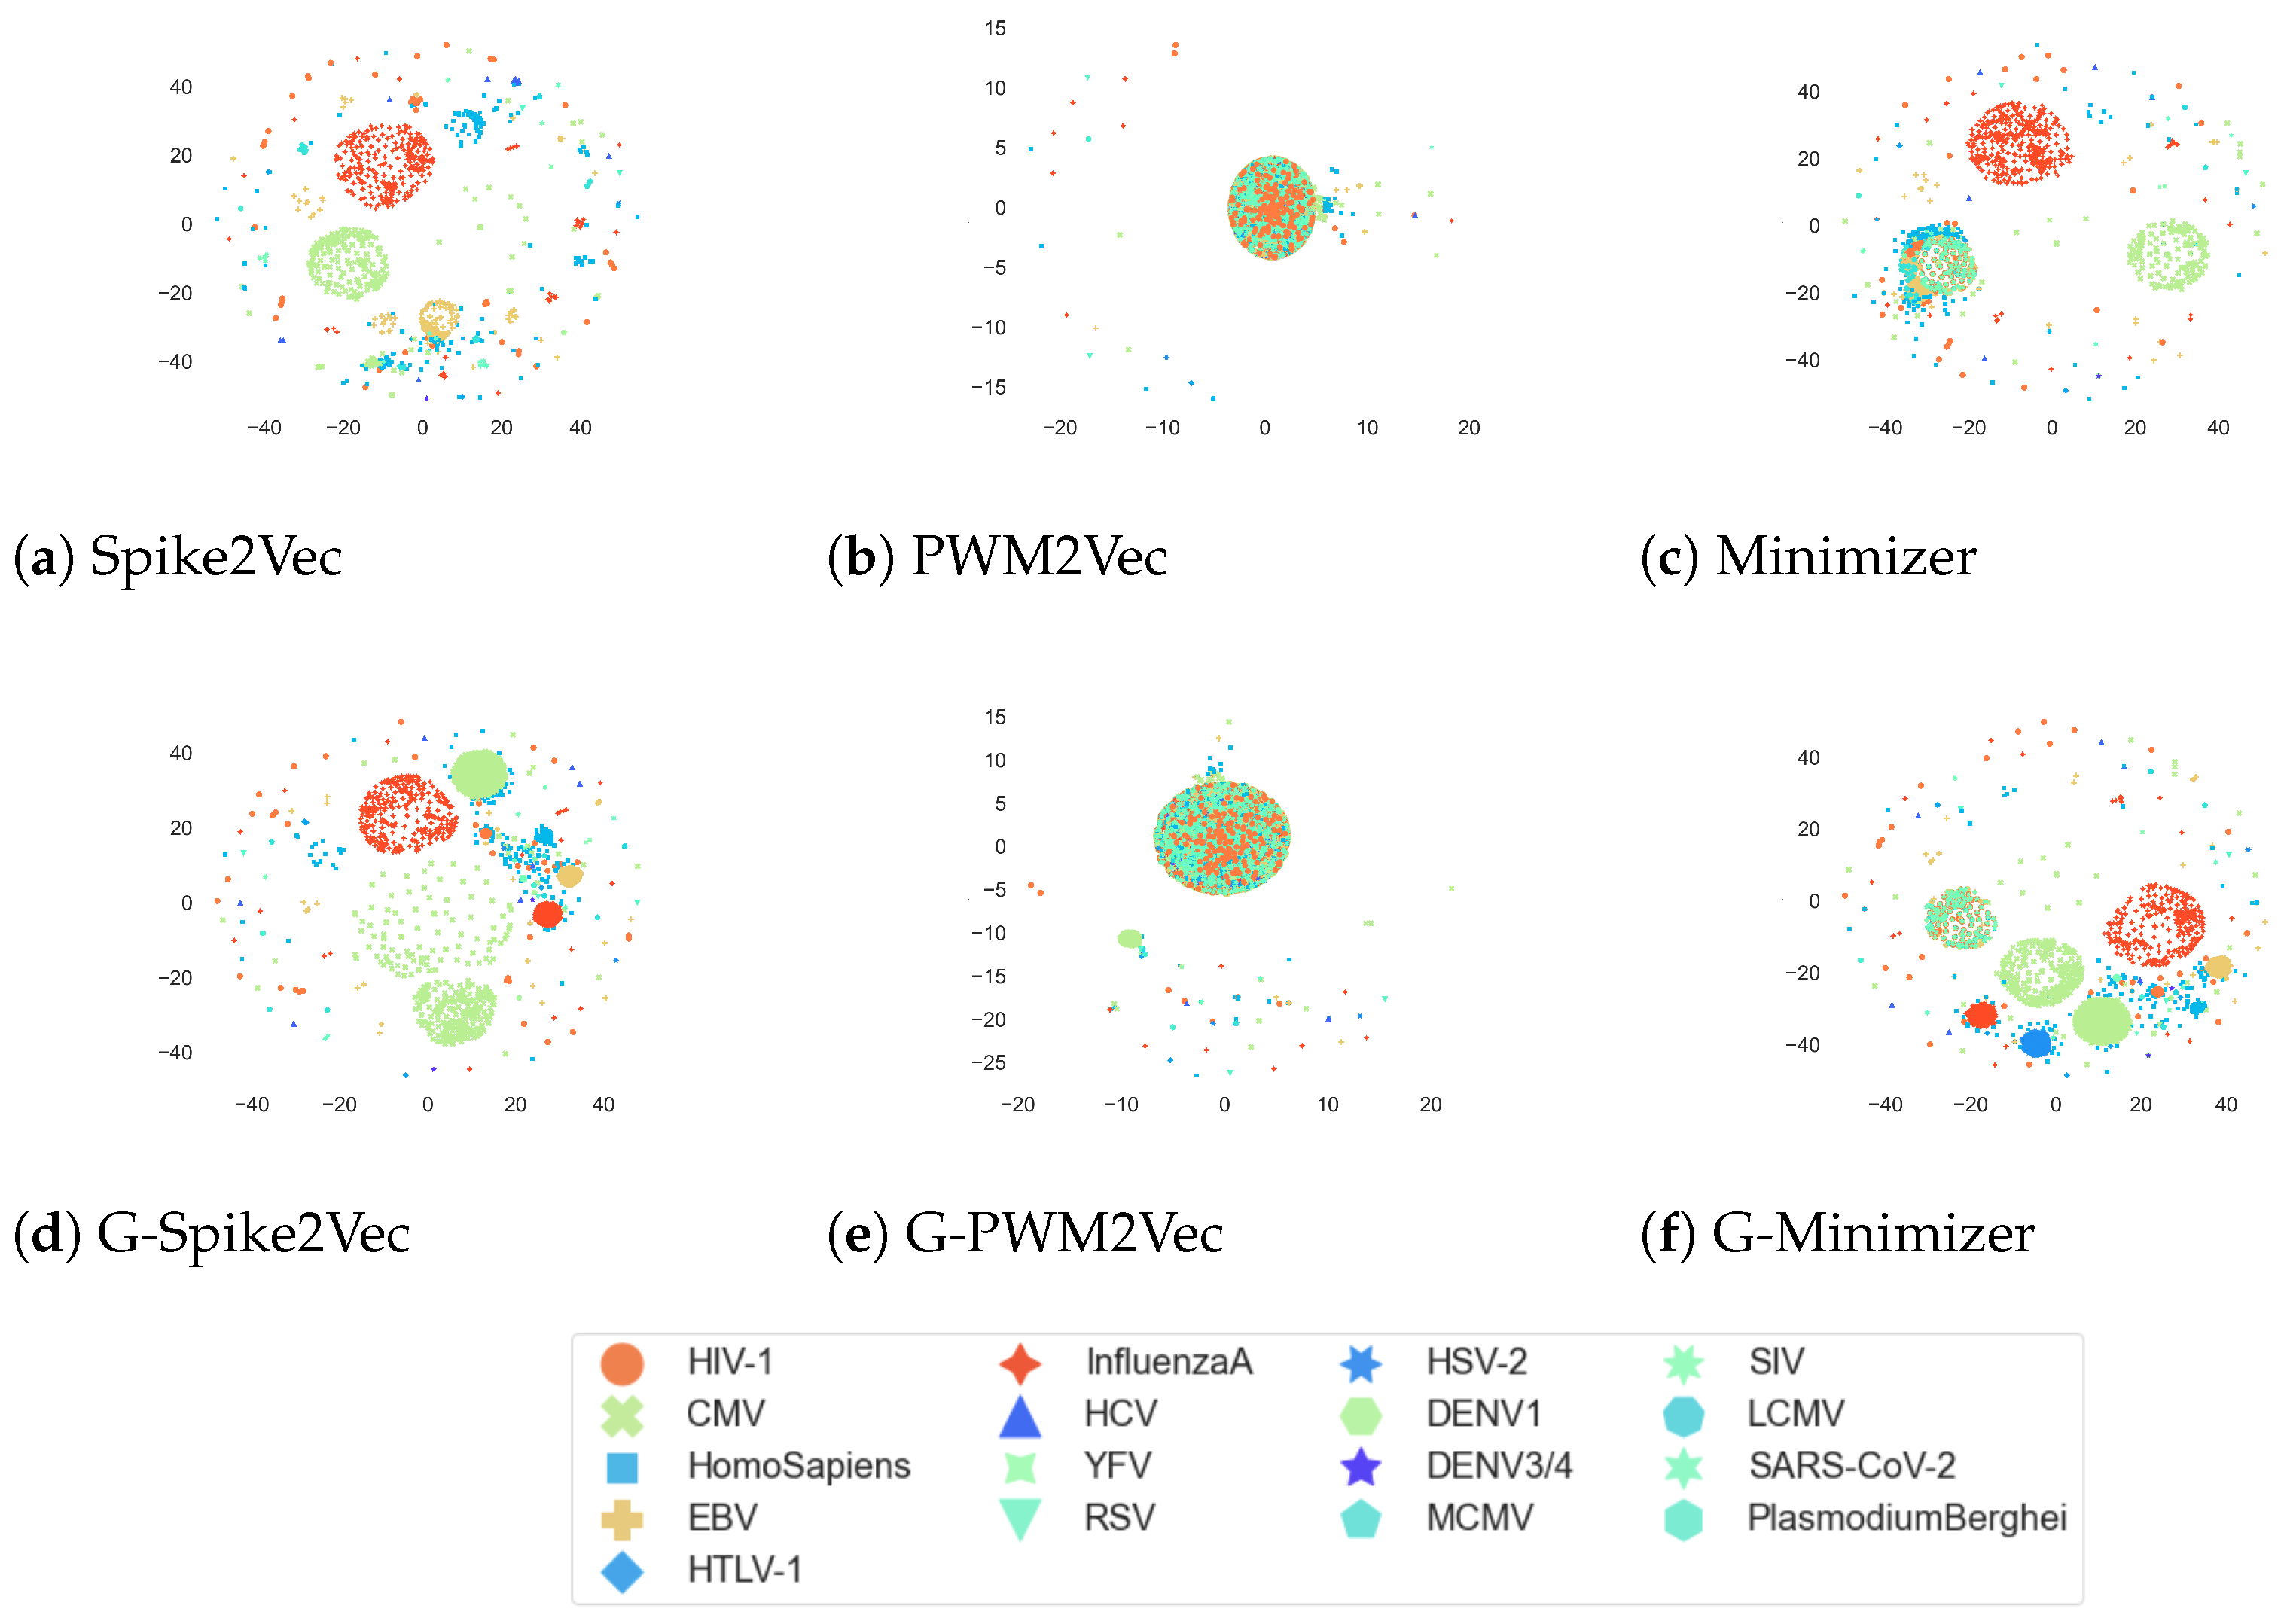
Moreover, the
t-SNE plots for the VDjDB dataset are given in
Figure 6. We can observe that the addition of GAN-based features to the minimizer-based embedding has yielded more clear and distinct clusters in the visualization. GAN-based spike2vec also portrays more clusters than the Spike2Vec one. However, the PWM2Vec shows similar patterns for both GAN-based and without GANs embeddings. Overall, it indicates that adding GANs-based features is enhancing the
t-SNE cluster structures.
Furthermore, the
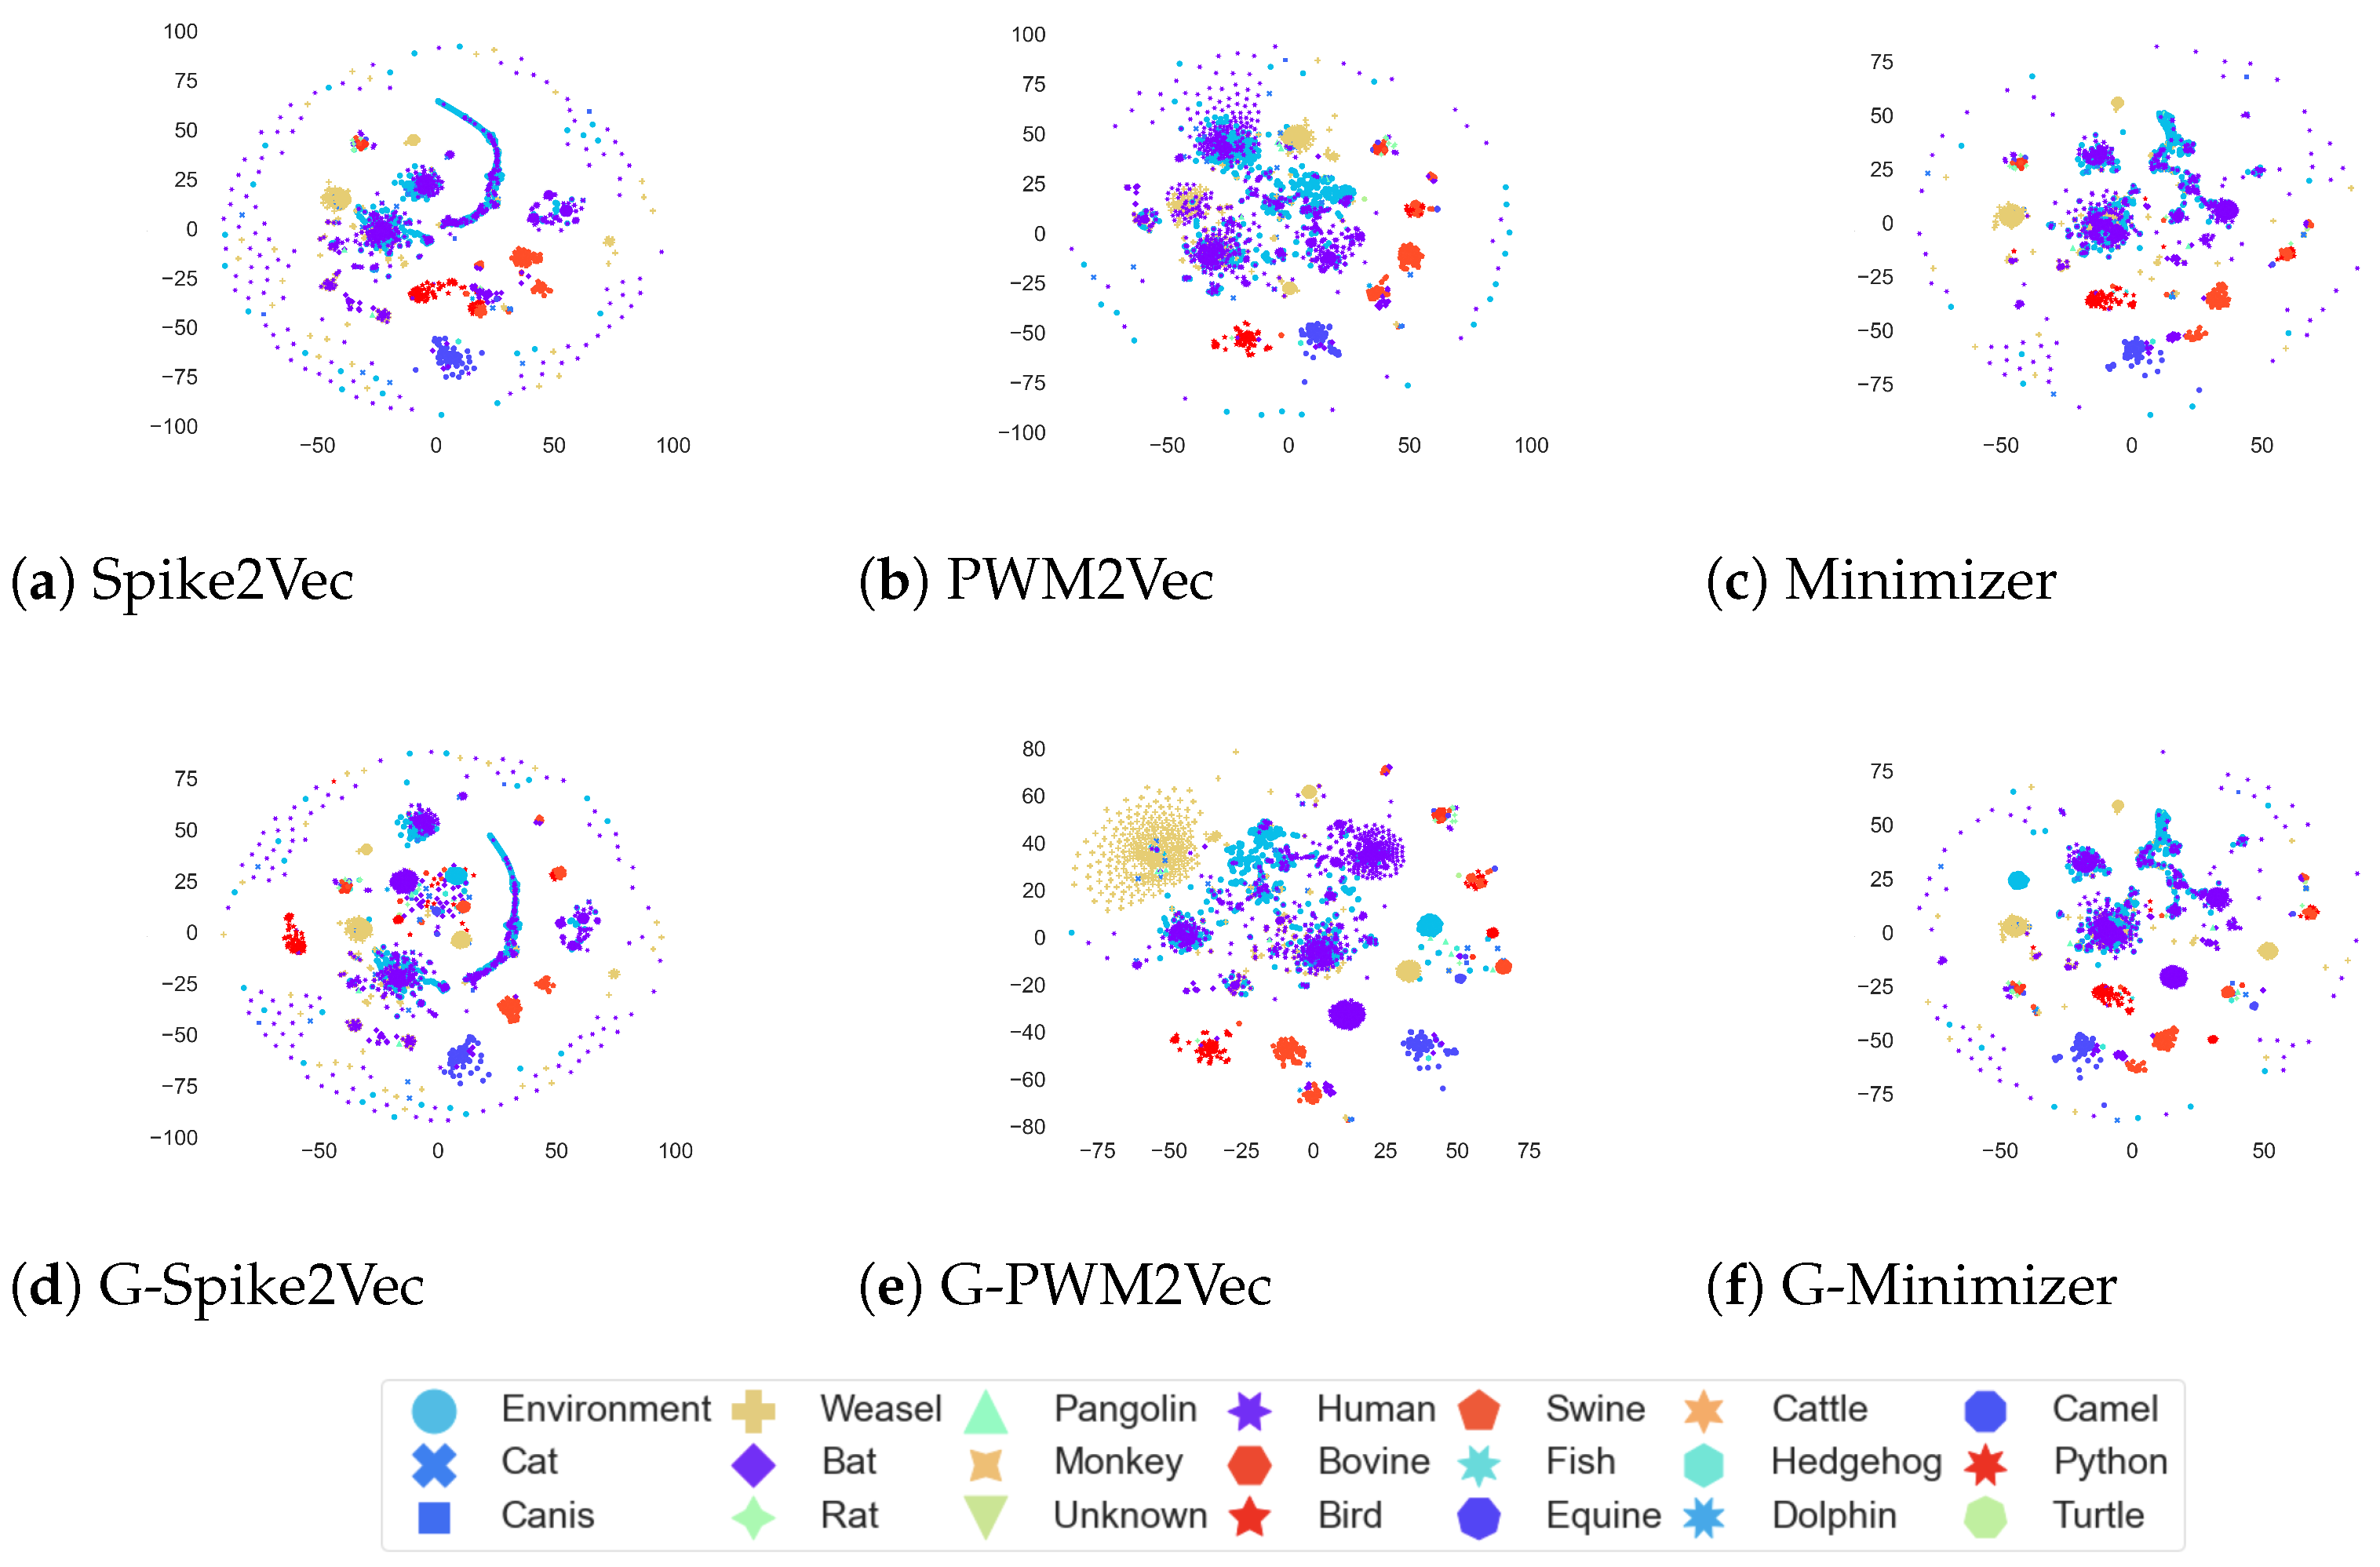
t-SNE plots for the host dataset are illustrated in
Figure 7. We can see that for PWM2Vec, the addition of GANs-based embeddings further refines the structure by reshaping the clusters, while the structures of Spike2Vec and Min2Vec seem to remain almost same for both with and without GANs.
We also investigated the
t-SNE structures generated by using only the GANs-based embeddings and
Figure 8 illustrates the results. It can be seen that for all the datasets only-GAN embeddings are yielding non-overlapping distinct clusters corresponding to each group with respect to the dataset. It is because, for each group, the only-GAN embeddings are synthesized after training the GAN model with the original data of the respective group. Note that for host data, some of the clusters are very tiny because of the corresponding number of instances in the dataset belonging to that group being very small.
