
Research on Space Occupancy, Activity Rhythm and Sexual Segregation of White-Lipped Deer (Cervus albirostris) in Forest Habitats of Jiacha Gorge on Yarlung Zangbo River Basin Based on Infrared Camera Technology


Abstract
Simple Summary
Abstract
1. Introduction
2. Materials and Methods
2.1. Study Area
2.2. Infrared Camera Setup
2.3. Site Occupancy Model
2.4. Activity Rhythm Analysis
2.5. Sexual Segregation Analysis
3. Results
3.1. Site Occupancy Model
3.2. Activity Rhythm
3.3. Sexual Segregation
4. Discussion
5. Conclusions
Author Contributions
Funding
Institutional Review Board Statement
Informed Consent Statement
Data Availability Statement
Acknowledgments
Conflicts of Interest
Appendix A

| January | February | March | April | May | June | July | August | September | October | November | December | |
|---|---|---|---|---|---|---|---|---|---|---|---|---|
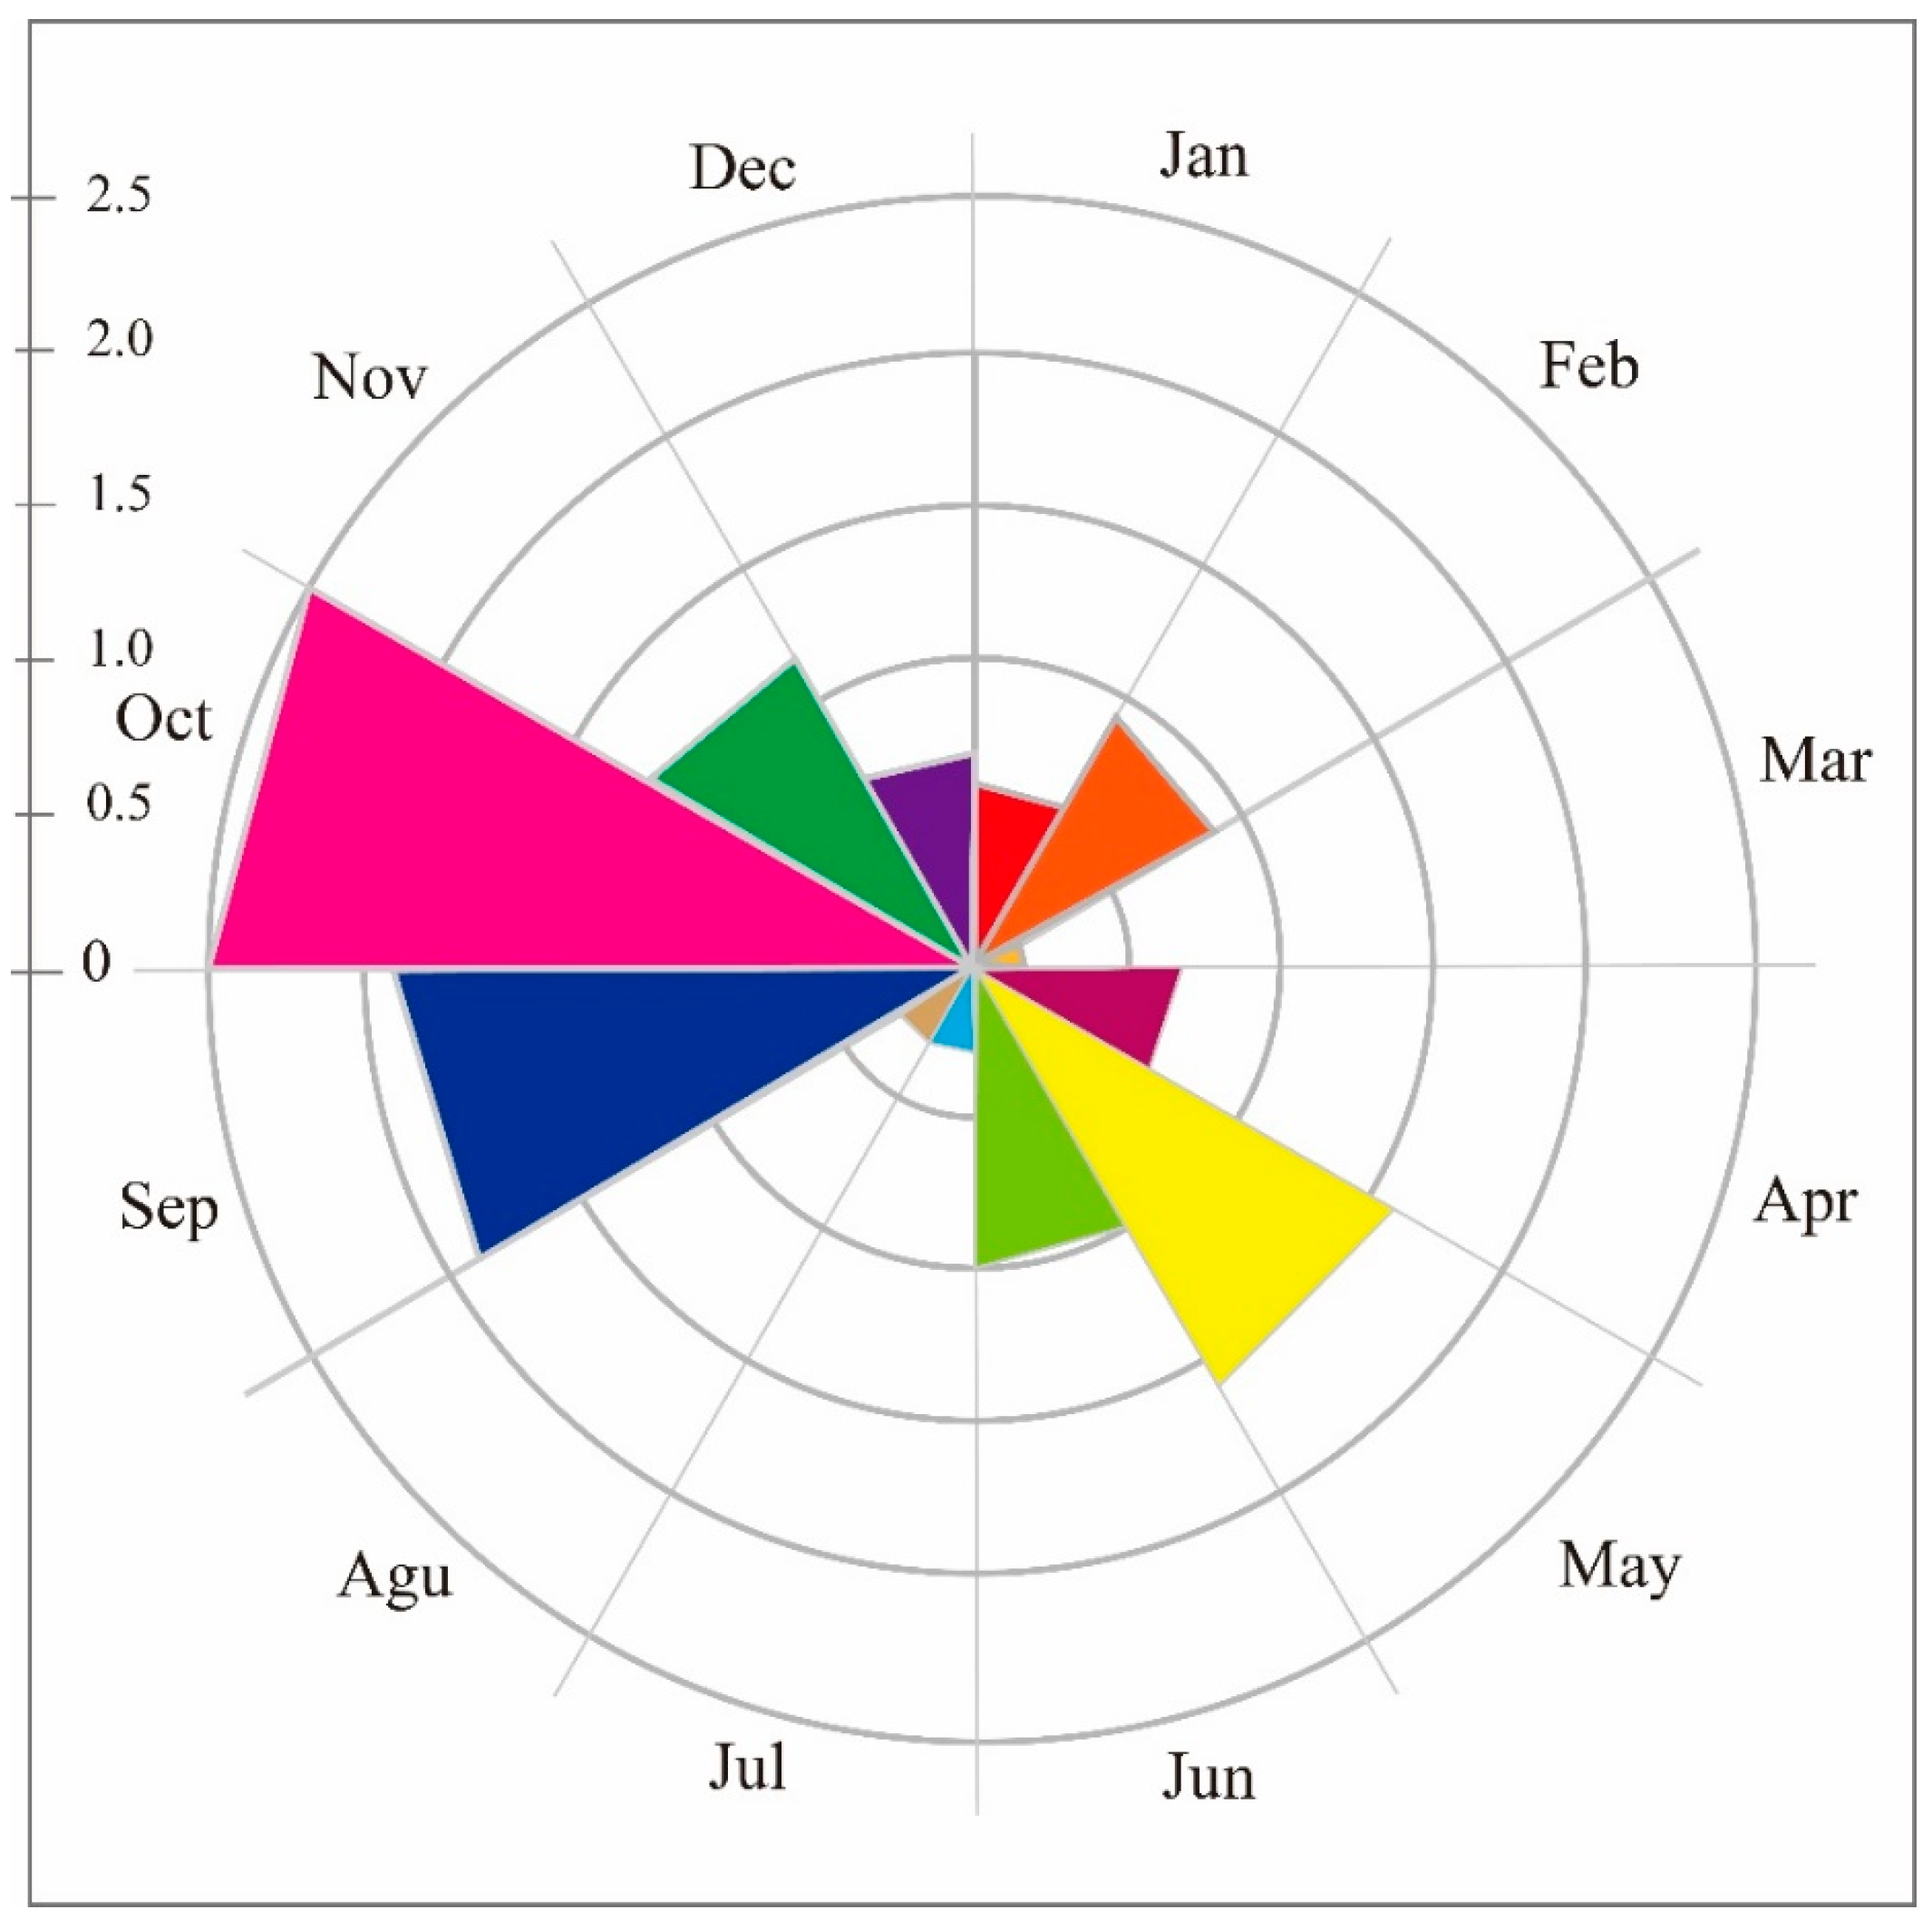
| Mean ± SD | 6.379 × 10⁻⁶ ± 1.155 × 10⁻⁵ | 8.720 × 10⁻⁶± 1.613 × 10⁻⁵ | 2.399 × 10⁻⁶ ± 6.621 × 10⁻⁶ | 7.432 × 10⁻⁶ ± 1.571 × 10⁻⁵ | 2.066 × 10⁻⁵ ± 3.097 × 10⁻⁵ | 9.714 × 10⁻⁶ ± 1.811 × 10⁻⁵ | 3.394 × 10⁻⁶ ± 8.654 × 10⁻⁶ | 2.692 × 10⁻⁶ ± 7.515 × 10⁻⁶ | 1.867 × 10⁻⁵ ± 5.022 × 10⁻⁵ | 2.452 × 10⁻⁵± 5.37 × 10⁻⁵ | 1.170 × 10⁻⁵ ± 2.210 × 10⁻⁵ | 6.671 × 10⁻⁶ ± 1.800 × 10⁻⁵ |
| January | F = 4.394, p = 0.3 | F = 15.704 p < 0.01 | F = 0.950 p = 0.634 | F = 37.629 p < 0.01 | F = 9.489 p = 0.167 | F = 6.593 p = 0.062 | F = 11.514 p < 0.05 | F = 20.988 p < 0.05 | F = 33.860 p < 0.01 | F = 7.170 p = 0.061 | F = 0.542 p = 0.917 | |
| February | F = 29.202 p < 0.01 | F = 0.790 p = 0.616 | F = 20.469 p < 0.01 | F = 0.951 p = 0.702 | F = 18.146 p < 0.05 | F = 24.451 p < 0.01 | F = 14.539 p = 0.094 | F = 25.280 p < 0.05 | F = 1.115 p = 0.333 | F = 0.754 p = 0.448 | ||
| March | F = 15.571 p < 0.01 | F = 67.282 p < 0.01 | F = 38.915 p < 0.01 | F = 1.554 p = 0.417 | F = 0.228 p = 0.788 | F = 30.923 p < 0.01 | F = 46.424 p < 0.01 | F = 24.578 p < 0.01 | F = 10.014 p < 0.05 | |||
| April | F = 25.562 p < 0.01 | F = 3.205 p = 0.392 | F = 8.756 p < 0.05 | F = 12.645 p < 0.05 | F = 17.116 p = 0.059 | F = 28.566 p < 0.01 | F = 2.997 p = 0.165 | F = 0.007 p = 0.768 | ||||
| May | F = 13.998 p < 0.01 | F = 56.489 p < 0.01 | F = 62.964 p < 0.01 | F = 1.500 p = 0.769 | F = 5.518 p = 0.576 | F = 9.880 p < 0.05 | F = 22.984 p < 0.01 | |||||
| June | F = 26.450 p < 0.01 | F = 33.625 p < 0.01 | F = 11.590 p = 0.138 | F = 21.256 p < 0.05 | F = 0.065 p = 0.547 | F = 2.802 p = 0.281 | ||||||
| July | F = 0.575 p = 0.592 | F = 27.723 p < 0.01 | F = 42.381 p < 0.01 | F = 17.818 p < 0.01 | F = 5.743 p = 0.144 | |||||||
| August | F = 29.724 p < 0.01 | F = 44.903 p < 0.01 | F = 21.815 p < 0.01 | F = 8.252 p < 0.05 | ||||||||
| September | F = 0.788 p = 0.480 | F = 9.962 p = 0.255 | F = 16.691 p < 0.05 | |||||||||
| October | F = 18.638 p = 0.051 | F = 27.740 p < 0.01 | ||||||||||
| November | F = 2.768, p = 0.117 | |||||||||||
| December |
| Spring | Summer | Autumn | Winter | |
|---|---|---|---|---|
| Spring | t = −0.208, p = 0.835 | t = 0.030, Sig = 0.762 | t = 0.131, Sig = 0.896 | |
| Summer | t = 0.075, Sig = 0.941 | t = 0.285, Sig = 0.775 | ||
| Autumn | t = 0.424, Sig = 0.672 | |||
| Winter | ||||
| Mean ± SD | 5.072 × 10⁻⁶ ± 1.505 × 10⁻⁴ | 5.170 × 10⁻⁶ ± 1.966 × 10⁻⁴ | 5.209 × 10⁻⁶ ± 1.670 × 10⁻⁴ | 5.010 × 10⁻⁶ ± 1.499 × 10⁻⁴ |
References
- Cutler, T.L.; Swann, D.E. Using remote photography in wildlife ecology: A review. Wildlife Soc. B. 1999, 27, 571–581. [Google Scholar]
- Rowcliffe, J.M.; Carbone, C. Surveys using camera traps: Are we looking to a brighter future? Anim. Conserv. 2010, 11, 185–186. [Google Scholar] [CrossRef]
- Feng, L.M.; Lin, L.; Zhang, L.T.; Wang, L.F.; Zhang, L. Evidence of Wild Tigers in Southwest China-A preliminary survey of the Xishuangbanna National Nature Reserve. Cat News 2008, 48, 4–6. [Google Scholar]
- Karanth, K.U.; Nichols, J.D. Estimation of tiger densities in India using photographic captures and recaptures. Ecology 1998, 79, 2852–2862. [Google Scholar] [CrossRef]
- Sollmann, R.; Mohamed, A.; Samejima, H.; Wilting, A. Risky business or simple solution-relative abundance indices from camera-trapping. Biol. Conserv. 2013, 159, 405–412. [Google Scholar] [CrossRef]
- Steenweg, R.; Mark, H.; Roland, K.; Jorge, A.; Jason, T.F.; Cole, B.; Susan, E.T.; Chris, C.; Marcus, R.J.; Jesse, W.; et al. Scaling-up camera traps: Monitoring the planet’s biodiversity with networks of remote sensors. Front. Ecol. Environ. 2017, 15, 26–34. [Google Scholar] [CrossRef]
- Wang, T.; Royle, J.A.; Smith, J.L.D.; Zou, L.; Lu, X.Y.; Li, T.; Yang, H.T.; Li, Z.L.; Feng, R.N.; Bian, Y.J.; et al. Living on the edge: Opportunities for Amur tiger recovery in China. Biol. Conserv. 2018, 217, 269–279. [Google Scholar] [CrossRef]
- MacKenzie, D.I.; Nichols, J.D.; Lachman, G.B.; Droege, S.; Royle, J.; Langtimm, C.A. Estimating site occupancy rates when detection probabilities are less than one. Ecology 2002, 83, 2248–2255. [Google Scholar] [CrossRef]
- Royle, J.A.; Link, W.A. Generalized occupation models allowing false positive and false negative errors. Ecology 2006, 87, 835–841. [Google Scholar] [CrossRef]
- Li, S.; McShea, W.; Wang, D.J.; Lu, Z.; Gu, X.D. Gauging the impact of management expertise on the distribution of large mammals across protected areas. Divers. Distrib. 2012, 18, 1166–1176. [Google Scholar] [CrossRef]
- Bu, H.L.; Wang, F.; McShea, W.; Lu, Z.; Wang, D.J.; Li, S. Spatial co-occurrence and activity patterns of Mesocarnivores in the Temperate Forests of southwest China. PLoS ONE 2017, 11, e0164271. [Google Scholar] [CrossRef] [PubMed]
- Kéry, M.; Guillera-Arroita, G.; Lahoz-Monfort, J. Analysing and mapping species range. dynamics using occupation models. J. Biogeogr. 2013, 40, 1463–1474. [Google Scholar] [CrossRef]
- Karanth, K.U.; Gopalaswamy, A.M.; Kumar, N.S.; Vaidyanathan, S.; Nichols, J.D.; MacKenzie, D.I. Monitoring carnivore populations at the landscape scale: Occupation modelling of tigers from sign surveys. J. Appl. Ecol. 2011, 48, 1048–1056. [Google Scholar] [CrossRef]
- Linkie, M.; Dinata, Y.; Nugroho, A.; Haidir, I. Estimating occupation of a data deficient mammalian species living in tropical rainforests: Sun bears in the Kerinci Seblat region, Sumatra. Biol. Conserv. 2007, 137, 20–27. [Google Scholar] [CrossRef]
- Miller, D.A.W.; Brehme, C.S.; Hines, J.E.; Nichols, J.D.; Fisher, R. Joint estimation of habitat dynamics and species interactions: Disturbance reduces co-occurrence of non-native predators with an endangered toad. J. Anim. Ecol. 2012, 81, 1288–1297. [Google Scholar] [CrossRef] [PubMed]
- Amstrup, S.C.; Beecham, J.J. Activity patterns of radio-collared black bears in Idaho. J Wildlife Manag. 1976, 40, 340–348. [Google Scholar] [CrossRef]
- Azevedo, F.C.; Lemos, F.G.; Freitas-Junior, M.C.; Rocha, D.G.; Azevedo, F.C.C. Puma activity patterns and temporal overlap with prey in a human-modified landscape at Southeastern Brazil. J. Zool. 2018, 305, 246–255. [Google Scholar] [CrossRef]
- Larrucea, E.S.; Brussard, P.F. Diel and seasonal activity patterns of Pygmy Rabbits (Brachylagus idahoensis). J. Mammal. 2009, 90, 1176–1183. [Google Scholar] [CrossRef]
- Zahoor, B.; Liu, X.H.; Wu, P.F.; Sun, W.L.; Jia, X.D.; Lv, Z.X.; Zhao, X.Y.; He, X.B.; He, B.S.; Cai, Q.; et al. Activity pattern study of Asiatic Black Bear (Ursus thibetanus) in the Qinling Mountains, China, by using infrared camera traps. Environ. Sci. Pollut. R. 2021, 28, 25179–25186. [Google Scholar] [CrossRef]
- Ruckstuhl, K.E.; Neuhaus, P. Sexual segregation in ungulates a new approach. Behaviour 2000, 137, 361–377. [Google Scholar] [CrossRef]
- Ruckstuhl, K.E.; Kokko, H. Modelling sexual segregation in ungulates: Effects of group size, activity budgets and synchrony. Anim. Behav. 2002, 64, 909–914. [Google Scholar] [CrossRef]
- Bowyer, R.; Kie, J. Effects of foraging activity on sexual segregation in Mule Deer. J. Mammal. 2004, 85, 498–504. [Google Scholar] [CrossRef]
- Ruckstuhl, K.E. Sexual segregation in vertebrates: Proximate and ultimate causes. Integr. Comp. Biol. 2007, 47, 245–257. [Google Scholar] [CrossRef]
- Zhang, Z.T.; Wang, F.; Xu, B.; Li, B.; Liang, C.B.; Gu, H.B. Research advances in conservation and management of endangered mammals on the Qinghai-Tibet Plateau. Acta Theriol. Sin. 2022, 42, 490–507. [Google Scholar]
- Kaji, K.; Ohtaishi, N.; Miura, S.; Wu, J.Y. Distribution and status of White-lipped Deer (Cervus albirostris) in the Qinghai-Xizang (Tibet) Plateau, China. Mammal Rev. 1989, 19, 35–44. [Google Scholar] [CrossRef]
- Takatsuki, S.; Ohtaishi, N.; Kaji, K.; Han, Y.; Jiayan, W.U. A note on fecal and rumen contents of White-lipped Deer on Eastern Qinghai-Tibet Plateau. J. Mammal. Soc. Jpn. 1988, 13, 133–137. [Google Scholar]
- Cai, G.Q.; Liu, Y.S. Group activities of the Cervus albirostris in the mating season. Acta Theriol. Sin. 1992, 12, 105–109. [Google Scholar]
- Jiang, F.M. Divine deer on the plateau-the White-Lipped Deer. China Today 2018, 67, 64–65. [Google Scholar]
- Wu, J.Y.; Pei, J.F. Present status of research of White-lipped Deer and its conservation strategy. Chin. J. Wildl. 2007, 5, 36–39. [Google Scholar]
- Wu, H.P.; Chu, H.J.; Wang, Y.; Ma, J.W.; Ge, Y.; Bu, L. Monitoring activity rhythms of Equus Hemionus at watering holes by camera traps in Mount Kalamaili Ungulate Nature Reserve, Xinjiang. Biodivers. Sci. 2014, 22, 752–757. [Google Scholar]
- Chang, D. Chang The Vegetation Zonation of the Tibetan Plateau. Mt. Res. Dev. 1981, 1, 29–48. [Google Scholar] [CrossRef]
- Miehe, G.; Miehe, S.; Bach, K.; Nölling, J.; Hanspach, J.; Reudenbach, C.; Kaiser, K.; Wesche, K.; Mosbrugger, V.; Yang, Y.P.; et al. Plant communities of central Tibetan pastures in the alpine steppe/Kobresia pygmaea ecotone. J. Arid. Environ. 2011, 75, 711–723. [Google Scholar] [CrossRef]
- Wang, X.L.; Peng, D.; Sheng, J.; Zhang, H.; Zhu, M.E.; Pan, B.K.; Zheng, H.W.; Zhou, J.; Li, D.Y. Population and conservation status of Tibetan macaques in Jiacha Gorge of Yarlung Zangbo River. J. Pu’er Univ. 2021, 37, 1–4. [Google Scholar]
- Zhu, G.; Zhao, X.T.; Wu, Z.H. Response of fluvial landform of the Gyaca Sector of the Yarlung Zangbo River to tectonic movement and climate. Acta Geosci. Sin. 2011, 32, 349–356. [Google Scholar]
- Xiao, W.H.; Su, Z.F.; Chen, L.J.; Yao, W.T.; Ma, Y.; Zhang, Y.M.; Xiao, Z.S. Using occupancy models in wildlife camera-trapping monitoring and the study case. Biodivers. Sci. 2019, 27, 249–256. [Google Scholar]
- Deng, S.B.; Chen, Q.J. Spectral Characteristics of Vegetation and Vegetation Index Summary. Chain Association of Remote Sensing Application. In Proceedings of 2010 Annual Conference and Regional Remote Sensing Development and Industry Forum, San Diego, CA, USA, 26–30 April 2010; Volume 9. [Google Scholar]
- Li, S.; Wang, D.J.; Xiao, Z.S.; Li, X.H.; Wang, T.M.; Feng, L.M.; Wang, Y. Camera-trapping in wildlife research and conservation in China: Review and outlook. Biodivers. Sci 2014, 22, 685–695. [Google Scholar]
- Li, S.; Wang, D.J.; Bu, H.L.; Liu, X.G.; Jin, T. Camera-trapping survey on the mammal diversity of the Laohegou Nature Reserve, Sichuan Province. Acta Theriol. Sin. 2016, 36, 282–291. [Google Scholar]
- MacKenzie, D.I.; Bailey, L.L. Assessing the fit of site-occupation models. J. Agr. Biol. Envir. St. 2004, 9, 300–318. [Google Scholar] [CrossRef]
- MacKenzie, D.I.; Bailey, L.L.; Nichols, J.D. Investigating species co-occurrence patterns when species are detected imperfectly. J. Anim. Ecol. 2004, 73, 546–555. [Google Scholar] [CrossRef]
- Chen, L.J.; Su, Z.F.; Xiao, Z.S. Application of camera-trapping data to study daily activity patterns of Galliformes in Guangdong Chebaling National Nature Reserve. Biodivers. Sci. 2019, 27, 266–272. [Google Scholar]
- Jia, X.D.; Liu, X.H.; Yang, X.Z.; Wu, P.F.; Songer, M.; Cai, Q.; He, X.B.; Zhu, Y. Seasonal activity patterns of ungulates in Qinling Mountains based on camera-trap data. Biodivers. Sci. 2014, 22, 737–745. [Google Scholar]
- Zhang, H.; Wang, J.Z.; Liu, Z.L. Autumn habitat selection by White-lipped deer in autumn in Tuole Mountain in Qinghai Province. J. Gansu Agric. Univ. 2020, 55, 160–165. [Google Scholar]
- Tang, Z.H.; Luo, H.L.; Wang, J.H.; Liu, J.L.; You, Z.Q. Potential suitable habitat and protection gap analysis of white-lipped deer (Cervus albirostris) based on GIS and Maxent model. Acta Ecol. Sin. 2022, 42, 9394–9403. [Google Scholar]
- You, Z.Q.; Tang, Z.H.; Yang, Y.B.; Yang, L.H.; Shi, H.Y.; Liu, H.; Gan, X.; Zheng, T.C.; JIiang, Z.G. Summer habitat selection by white-lipped deer (Cervus albirostris) in Chaqingsongduo White-lipped Deer National Nature Reserve. Acta Theriol. Sin. 2014, 34, 46–53. [Google Scholar]
- Sun, J.X.; Li, J.Q.; Wan, Y.Q.; Li, S.; Guan, T.P.; Wang, J.; Xia, W.C.; Xu, H.G. Study on the activity rhythms of nine ungulates in summer and autumn in Sichuan. J. Ecol. Rural Environ. 2018, 34, 1003–1009. [Google Scholar]
- Nives Pagon; Stefano Grignolio; Anna Pipia; Paolo Bong; Cristiano Bertolucci; Marco Apollonio. Seasonal variation of activity patterns in roe deer in a temperate forested area. Chronobiol. Int. 2013, 30, 772–785. [Google Scholar] [CrossRef]
- Zheng, S.W.; Wu, J.Y. Preliminary observation on food habits and reproduction of white-lipped deer. Acta Theriol. Sin. 1989, 2, 123–129. [Google Scholar]
- Han, Q.; Liang, T.; Zhang, M.Y.; Liu, M.M.; Wang, Z.Q.; Lu, C.H. Analysis of activity rhythm and habitat selection of water deer based on the infrared-triggered camera technology in autumn and winter in the Urban Forest Park. Chin. J. Ecol. 2022, 41, 963–972. [Google Scholar]
- Frey, S.; Fisher, J.T.; Burton, A.C.; Volpe, J.P. Investigating animal activity patterns and temporal niche partitioning using camera-trap data: Challenges and opportunities. Remote Sens. Ecol. Con. 2017, 3, 123–132. [Google Scholar] [CrossRef]
- Rahman, D.A.; Mardiastuti, A. Factors influencing the activity patterns of two deer species and their response to predators in two protected areas in Indonesia. Therya 2021, 12, 149–161. [Google Scholar] [CrossRef]
- Zheng, W.C.; Zheng, Z.H.; Liu, J.L.; Wang, Y.; Yang, X.J.; Huang, L.P.; Xiao, Y. Seasonal variation in diurnal activity rhythm and vertical migration of Black Muntjac in Zhejiang Jiulongshan National Nature Reserve. Chin. J. Wildl. 2023, 44, 290–296. [Google Scholar]
- Xiao, M.; He, F.; Yang, X. Activity rhythm and seasonal changes of Sichuan takin (Budorcas tibetanus) in Tangjiahe National Nature Reserve, Sichuan Province. J. Sichuan For. Sci. Technology. 2022, 43, 36–43. [Google Scholar]
- Cai, G.Q.; Liu, Y.S. Group activity during the mating season of white-lipped deer. Acta Theriol. Sin. 1992, 2, 105–109. [Google Scholar]
- Wang, K.B.; You, Z.Q.; Xie, H.X.; Zheng, T.C.; Li, Z.Q. Vigilance behavior of Cervus albirostris during breeding season in Chaqingsongduo White-lipped Deer National Nature Reserve. Sichuan J. Zool. 2018, 37, 305–310, 330. [Google Scholar]


| Seasons | Model | Npars | AIC | ∆AIC | AICwt | ψ | 95% Conf. Interval | p | 95% Conf. Interval |
|---|---|---|---|---|---|---|---|---|---|
| Spring | p (elevation, EVI) ψ (elevation) | 5 | 911.330 | 0.000 | 0.180 | 0.624 | 0.480–0.747 | 0.166 | 0.127–0.216 |
| p (EVI) ψ (elevation) | 4 | 911.410 | 0.083 | 0.170 | 0.618 | 0.478–0.739 | 0.111 | 0.091–0.135 | |
| p (elevation) ψ (elevation, EVI) | 5 | 911.530 | 0.202 | 0.160 | 0.618 | 0.452–0.761 | 0.171 | 0.136–0.214 | |
| Model average | 0.620 | 0.471–0.749 | 0.149 | 0.118–0.188 | |||||
| Summer | p (elevation) ψ (elevation) | 4 | 684.440 | 0.042 | 0.140 | 0.445 | 0.300–0.591 | 0.193 | 0.143–0.257 |
| p (elevation, EVI) ψ (elevation) | 5 | 684.740 | 0.345 | 0.120 | 0.447 | 0.273–0.626 | 0.201 | 0.139–0.281 | |
| p (elevation) ψ (elevation, EVI) | 5 | 685.700 | 1.306 | 0.070 | 0.45 | 0.301–0.597 | 0.193 | 0.142–0.258 | |
| Model average | 0.447 | 0.290–0.605 | 0.196 | 0.141–0.266 | |||||
| Autumn | p (elevation) ψ (human_interference_intensity) | 4 | 1051.410 | 0.000 | 0.190 | 0.551 | 0.429–0.685 | 0.356 | 0.306–0.408 |
| p (elevation) ψ (elevation, EVI) | 5 | 1051.500 | 0.096 | 0.180 | 0.552 | 0.416–0.679 | 0.356 | 0.306–0.408 | |
| p (elevation, EVI) ψ (human_interference_intensity) | 5 | 1051.770 | 0.369 | 0.160 | 0.551 | 0.429–0.685 | 0.347 | 0.285–0.414 | |
| Model average | 0.551 | 0.425–0.683 | 0.353 | 0.300–0.410 | |||||
| Winter | p (elevation) ψ (elevation) | 4 | 859.380 | 0.000 | 0.360 | 0.551 | 0.429–0.685 | 0.207 | 0.167–0.254 |
| p (elevation, EVI) ψ (elevation) | 5 | 859.800 | 0.420 | 0.290 | 0.551 | 0.381–0.713 | 0.205 | 0.152–0.257 | |
| p (elevation) ψ (elevation, EVI) | 5 | 860.890 | 1.510 | 0.170 | 0.553 | 0.407–0.687 | 0.207 | 0.167–0.254 | |
| Model average | 0.551 | 0.407–0.695 | 0.206 | 0.162–0.255 |
| Seasons | Model-Component | Covariates | Estimate | SE | p |
|---|---|---|---|---|---|
| Spring | Occupancy | Intercept | 0.746 | 0.324 | 0.021 |
| Elevation | 1.531 | 0.399 | <0.001 | ||
| EVI | 0.100 | 0.229 | 0.663 | ||
| Detection | Intercept | −1.609 | 0.115 | <0.001 | |
| Elevation | 0.146 | 0.105 | 0.164 | ||
| EVI | 0.089 | 0.109 | 0.412 | ||
| Summer | Occupancy | Intercept | −0.262 | 0.271 | 0.333 |
| Elevation | 1.114 | 0.353 | <0.001 | ||
| EVI | 0.049 | 0.158 | 0.758 | ||
| Detection | Intercept | −1.432 | 0.125 | <0.001 | |
| Elevation | −0.236 | 0.157 | 0.134 | ||
| EVI | −0.054 | 0.105 | 0.603 | ||
| Autumn | Occupancy | Intercept | 0.259 | 0.266 | 0.330 |
| Elevation | 1.213 | 0.324 | <0.001 | ||
| EVI | 0.426 | 0.357 | 0.232 | ||
| Detection | Intercept | −0.631 | 0.085 | <0.001 | |
| Elevation | −0.479 | 0.096 | <0.001 | ||
| EVI | 0.012 | 0.046 | 0.786 | ||
| Winter | Occupancy | Intercept | 0.260 | 0.262 | 0.321 |
| Elevation | 0.979 | 0.298 | 0.000 | ||
| EVI | 0.035 | 0.134 | 0.795 | ||
| Detection | Intercept | −1.372 | 0.099 | <0.001 | |
| Elevation | −0.287 | 0.102 | 0.004 | ||
| EVI | 0.046 | 0.092 | 0.615 |
Disclaimer/Publisher’s Note: The statements, opinions and data contained in all publications are solely those of the individual author(s) and contributor(s) and not of MDPI and/or the editor(s). MDPI and/or the editor(s) disclaim responsibility for any injury to people or property resulting from any ideas, methods, instructions or products referred to in the content. |
© 2023 by the authors. Licensee MDPI, Basel, Switzerland. This article is an open access article distributed under the terms and conditions of the Creative Commons Attribution (CC BY) license (https://creativecommons.org/licenses/by/4.0/).
Share and Cite
Liu, Y.; Huang, K.; Wang, X.; Krzton, A.; Xia, W.; Li, D. Research on Space Occupancy, Activity Rhythm and Sexual Segregation of White-Lipped Deer (Cervus albirostris) in Forest Habitats of Jiacha Gorge on Yarlung Zangbo River Basin Based on Infrared Camera Technology. Biology 2023, 12, 815. https://doi.org/10.3390/biology12060815
Liu Y, Huang K, Wang X, Krzton A, Xia W, Li D. Research on Space Occupancy, Activity Rhythm and Sexual Segregation of White-Lipped Deer (Cervus albirostris) in Forest Habitats of Jiacha Gorge on Yarlung Zangbo River Basin Based on Infrared Camera Technology. Biology. 2023; 12(6):815. https://doi.org/10.3390/biology12060815
Chicago/Turabian StyleLiu, Yujia, Kai Huang, Xueyu Wang, Ali Krzton, Wancai Xia, and Dayong Li. 2023. "Research on Space Occupancy, Activity Rhythm and Sexual Segregation of White-Lipped Deer (Cervus albirostris) in Forest Habitats of Jiacha Gorge on Yarlung Zangbo River Basin Based on Infrared Camera Technology" Biology 12, no. 6: 815. https://doi.org/10.3390/biology12060815
APA StyleLiu, Y., Huang, K., Wang, X., Krzton, A., Xia, W., & Li, D. (2023). Research on Space Occupancy, Activity Rhythm and Sexual Segregation of White-Lipped Deer (Cervus albirostris) in Forest Habitats of Jiacha Gorge on Yarlung Zangbo River Basin Based on Infrared Camera Technology. Biology, 12(6), 815. https://doi.org/10.3390/biology12060815