Simple Summary
Todarodes pacificus is an important cephalopod. This study analyzed the migration path and feeding ecology of T. pacificus by the stable isotope values of the proostracum of the gladius. This result showed that T. pacificus in the East China Sea migrated to low latitudes and nearshore areas during their life history, and the trophic level of their food exhibited no large changes during migration. T. pacificus in the Sea of Japan migrated to high latitudes and offshore areas during their life history, and the trophic level of their food decreased during migration. When the proostracum grew to 120 mm from the distal end, T. pacificus in both areas began to migrate. This study provides a scientific basis for further study on the fishery ecology and life history of T. pacificus.
Abstract
The Japanese flying squid (Todarodes pacificus) is an important cephalopod in the northwest Pacific Ocean. In this study, the proostracum of the gladius of T. pacificus samples collected by Chinese squid fishing vessels in the East China Sea and the Sea of Japan in August and December 2018 were continuously cut, and stable isotope values of the cut fragments were used to analyze the migration path and feeding ecology of T. pacificus. The results showed that when the proostracum grew to 120 mm from the distal end, T. pacificus began to migrate. In the East China Sea, T. pacificus migrated to low latitudes and nearshore areas, and the trophic level of their food showed no large changes during migration. In the Sea of Japan, T. pacificus migrated to high latitudes and offshore areas, and the trophic level of their food showed a decreasing trend during migration. There was no significant difference in migration or feeding ecology between females and males, but the competitive capacity of the females may be stronger than that of the males. The results provided a scientific basis for the scientific management and development of T. pacificus resources.
1. Introduction
The Japanese flying squid, Todarodes pacificus, is a warm–temperate oceanic cephalopod of the class Cephalopoda (Teuthoidea: Ommastrephidae) and genus Todarodes, which primarily inhabits the northwestern Pacific Ocean and the Gulf of Alaska in the eastern Pacific Ocean [1,2]. The distribution of T. pacificus is affected by ocean currents. The Sea of Japan, the Pacific coast of Japan, the East China Sea, and the Yellow Sea are all important fishing grounds for T. pacificus [3,4]. T. pacificus plays an important role in the marine ecosystem [5,6,7]. To date, national and international scholars have studied the resource distribution [5], age [8], population structure [9,10], and reproduction of T. pacificus [11,12]. Studies have shown that T. pacificus in the Sea of Japan migrates northward for feeding and then migrates southward for spawning, and the trophic level of feeding increases during migration [3,13], but the feeding ecology and migration path of T. pacificus in the East China Sea are less known.
Feeding analysis and stable isotope analysis (SIA) are the main research methods to analyze the feeding ecology and migration path of cephalopods [13]. Feeding analysis methods cannot reflect the long-term feeding habits of cephalopods, and this method only observes indigestible food, so the feeding analysis method has great uncertainty [14]. Stable isotope analysis can reflect the long-term and short-term feeding habits of cephalopods more quickly and objectively, so this method is widely used in studies on the feeding ecology and migration of cephalopods [15,16].
To date, national and international scholars have studied the biological characteristics of the hard tissues of cephalopods, such as beaks [17], statoliths [18], and gladii [19]. The gladius is a hard tissue composed of chitin and protein in the body of cephalopods, and the gladius records full information on the life history of cephalopods. The gladius is easy to obtain, preserve, and cut, so it is a good carrier to study the growth process of cephalopods [20,21,22]. In this study, the proostracum of the gladius of T. pacificus collected in the East China Sea and the Sea of Japan was cut, and then the carbon and nitrogen stable isotope ratios of the cut fragments were measured. Based on the stable isotopic values, this study analyzed the feeding ecology and migration path of T. pacificus in the East China Sea and the Sea of Japan.
2. Materials and Methods
2.1. Sampling
A total of 955 samples was randomly sampled by Chinese squid fishing vessels in the southern part of the East China Sea and the Sea of Japan in August and December 2018 (Figure 1). All samples were immediately frozen and transported to the Biological Laboratory of Shanghai Ocean University. After thawing the samples in the laboratory, the fishery biological data were measured, including mantle length (ML) and body weight (BW), and the sex and maturity stage were identified through visual examinations. The mantle length was measured accurately to 0.1 cm, and the body weight was measured to 0.1 g. Gonad maturity consisted of stages 1–5 according to the cephalopod gonad maturity stage proposed by Ehrhardt [23]; those with gonad maturity in stages 1–2 were defined as immature individuals, and those with gonad maturity in stages 3–5 were defined as mature individuals [23,24]. Considering the sample size, sex ratio, sampling time, and other factors, 24 samples of T. pacificus were selected as the research objects, including 8 samples from the East China Sea and 16 samples from the Sea of Japan. The samples from the East China Sea were labeled G1, G2, G3…G8, and samples from the Sea of Japan were labeled G9, G10, G11, …, G24.
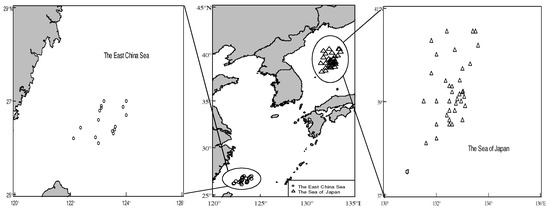
Figure 1.
Distribution of sampling stations. (The circles represent sampling stations of T. pacificus in the East China Sea, the triangles represent sampling stations of T. pacificus in the Sea of Japan.)
The gladius of T. pacificus consists of 3 morphological parts: rostrum, conus, and proostracum. The gladius was extracted from the back of the mantle cavity and cleaned in an ultrasonic cleaner for 10 min to remove residual soft tissue. Based on the growth direction of the proostracum, from the distal end to the proximal end, the proostracum was consecutively cut every 2 cm with acetone-washed fine scissors following the ‘V’ shape of the growth lines (Figure 2). A total of 63 segments was cut from T. pacificus of the East China Sea, and a total of 155 segments was cut from T. pacificus of the Sea of Japan. All segments were rinsed again with distilled water, freeze-dried at −55 °C for ≥24 h, and homogenized into a fine powder using a Mixer mill MM440 (Retsch, Haan, Germany) prior to SIA [25,26].
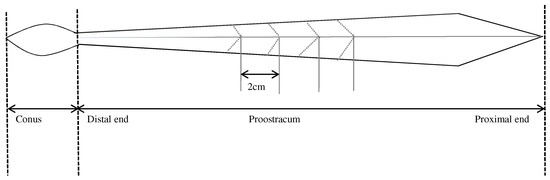
Figure 2.
Structure of the Todarodes pacificus gladius.
2.2. Stable Isotope Analysis
A total of 0.1 mg of powder from each segment of proostracum among individuals was pooled using a tin capsule, and then the powder’s stable isotope ratios were measured using an IsoPrime isotope ratio mass spectrometer (IsoPrime Corporation, Cheadle, UK) and Vario Macro Elemental Analyzer (Elementar Analysensysteme GmbH, Hanau, Germany). The isotopic compositions of the samples were expressed as δ13C and δ15N using the equation
where X is 13C or 15N, and Rsample and Rstandard are the corresponding ratios of 13C/12C or 15N/14N of the sample and the standard, respectively. To calibrate the system and compensate for drift, 3 standard items were placed for every 10 samples, and USGS 24 (−16.049‰v PDB) and USGS 26 (53.7‰v N2) were used to calibrate the δ13C and δ15N values, respectively. The analytical errors of δ13C and δ15N were approximately 0.05‰ and 0.06‰, respectively. Stable isotope analysis was conducted in the stable isotope laboratory of Shanghai Ocean University [25,26].
2.3. Statistical Analysis
Based on the stable isotopic values, this study drew a trophic niche plot and calculated the total area (TA) and standard ellipse corrected area (SEAC) of the East China Sea and the Sea of Japan. Linear regression analysis was used to analyze the relationships between the stable isotope values and the length of the gladius. A t-test was used to analyze the significant difference in the average δ13C and δ15N values, and the significance level was α = 0.05. This study used Excel (2010) and R Studio to plot the data and SPSS to analyze the data.
3. Results
3.1. Biological Parameters
In this study, the ranges of the ML and BW of the T. pacificus collected in the East China Sea were 18.7–23.0 cm and 142.4–270.7 g, respectively, and the ML and BW of the females were higher than those of the males (female: 22.0–23.0 cm and 240.3–270.7 g; male: 18.7–20.0 cm and 142.4–204.2 g).
The ranges of the ML and BW of the T. pacificus collected in the Sea of Japan were 22.0–25.8 cm and 275.3–377.2 g, respectively, and the ML and BW of the females and males were similar (female: 22.5–25.8 cm and 275.3–377.2 g; male: 22.0–25.5 cm and 279.3–372.1 g) (Table 1).

Table 1.
Biological parameters of T. pacificus samples.
3.2. Stable Isotopic Values
For the T. pacificus collected in the East China Sea, the ranges of δ13C and δ15N values were −19.38‰ to −17.62‰ and 7.10 to 10.19‰, respectively. The stable isotope values of the females and males both increased gradually with the growth of the proostracum, and the stable isotopic values of the females were higher than those of the males. The δ13C and δ15N values of the females were −19.38‰ to −17.62‰ and 7.10‰ to 10.19‰, respectively. The δ13C and δ15N values of the males were −18.68‰ to −17.82‰ and 7.17‰ to 8.93‰, respectively.
For the T. pacificus collected in the Sea of Japan, the ranges of δ13C and δ15N values were −18.68 to −20.67‰ and 7.64 to 6.57‰, respectively. The stable isotope values of the females and males both decreased gradually with the growth of the proostracum, and the stable isotopic values of the females were similar to those of the males. The δ13C and δ15N values of the females were −20.67‰ to −18.68‰ and 6.59‰ to 7.64‰, respectively; the δ13C and δ15N values of the males were −20.53‰ to −18.61‰ and 6.57‰ to 7.74‰, respectively (Table 2).
Table 2.
Stable isotope values of the gladius of T. pacificus.
3.3. Trophic Niche
According to the ontogenetic trophic niche research framework proposed by Hammerschlag-Peyer, the trophic niche plot was drawn using stable isotope values [27]. For T. pacificus collected in the East China Sea, the trophic niche area (SEAc) of the samples had significant differences, and the samples’ trophic niches did not overlap. Sample G6 had the largest SEAc. The trophic niches of G2 and G7 overlapped, and the trophic niches of G1, G3, G4, G5, and G8 overlapped. For T. pacificus collected in the Sea of Japan, the trophic niche areas (SEAc) of the samples were similar, and most samples’ trophic niches overlapped (Figure 3).
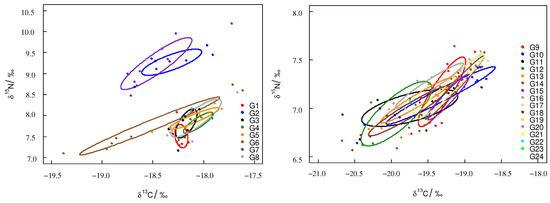
Figure 3.
Trophic niche of T. pacificus collected in the East China Sea and the Sea of Japan (circle plot: SEAc).
For T. pacificus collected in the East China Sea, the TA and SEAc were 3.11‰2 and 0.810‰2, respectively. For T. pacificus collected in the Sea of Japan, the TA and SEAc were 1.21‰2 and 0.213‰2, respectively. The SEAc of the T. pacificus collected in the East China Sea was larger than that in the Sea of Japan. The trophic niche did not overlap between the two areas. There were significant differences between the trophic niches of the two areas (Figure 4).
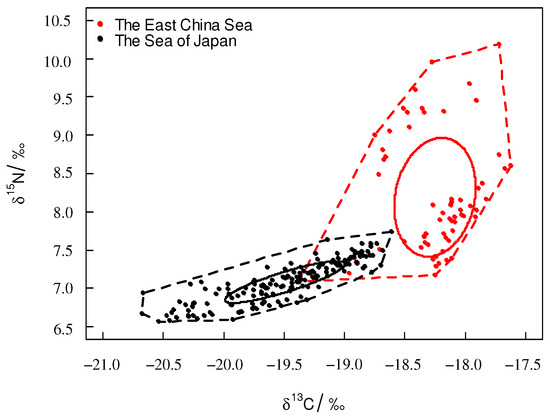
Figure 4.
Trophic niche of T. pacificus collected in the different areas (square plot: TA; circle plot: SEAc).
The trophic niche area (SEAc) of the females was larger than that of the males in both areas. For T. pacificus collected in the East China Sea, the SEAc of the females and males were 1.068‰2 and 0.48‰2, respectively. The overlapping SEAc was 0.239‰2 between females and males, and the overlapping rate was 18.3%. For T. pacificus collected in the Sea of Japan, the SEAc values of the females and males were 0.274‰2 and 0.139‰2, respectively. The overlapping SEAc was large between females and males, the overlapping SEAc was 0.126‰2, and the overlapping rate was 44.2% (Figure 5).
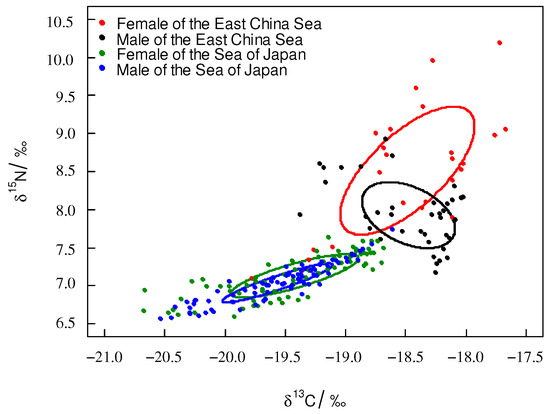
Figure 5.
Trophic niche of T. pacificus of females and males collected in the different areas (circle plot: SEAc).
3.4. Geographic Variation and Trophic Variation
With the growth of the proostracum, the stable isotope values showed a fluctuating trend. The stable isotope values of T. pacificus collected in the East China Sea increased gradually, but the stable isotope values of T. pacificus collected in the Sea of Japan decreased gradually. When the proostracum grew to 120 mm from the distal end, the δ13C and δ15N values of T. pacificus in the two areas began to change greatly (Figure 6 and Figure 7).
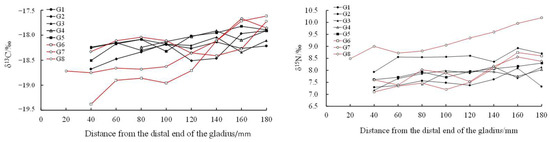
Figure 6.
Relationship between δ13C‰, δ15N‰, and the growth of the proostracum of T. pacificus collected in the East China Sea. (Black line represents males, and red line represents females.)
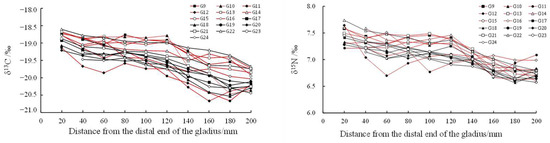
Figure 7.
Relationship between δ13C‰, δ15N‰, and the growth of the proostracum of T. pacificus collected in the Sea of Japan. (Black line represents males, and red line represents females.)
Linear regression analysis showed that for the T. pacificus collected in the East China Sea, there was a significant positive correlation between the average δ13C values and the growth of the proostracum (13C: r = 0.970, n = 9, p < 0.01), and there was no significant correlation between the average δ15N values and the growth of the proostracum (15N: r = 0.486, n = 9, p > 0.05). However, with the growth of the proostracum, the average δ15N values increased slightly. For the T. pacificus collected in the Sea of Japan, linear regression analysis showed that there was a significant negative correlation between the average δ13C values and the growth of the proostracum (13C: r = −0.977, n = 10, p < 0.01), and there was a significant negative correlation between the average δ15N values and the growth of the proostracum (15N: r = −0.961, n = 10, p < 0.01).
There was no significant difference in the average δ13C (samples in the East China Sea, 13C: F = 0.003, n = 9, p = 0.977 > 0.05; samples in the Sea of Japan, 13C: F = 0.150, n = 10, p = 0.483 > 0.05) and δ15N (samples in the East China Sea, 15N: F = 2.640, n = 9, p = 0.063 > 0.0; samples in the Sea of Japan, 15N: F = 0.008, n = 10, p = 0.446 > 0.05) values in both the East China Sea and the Sea of Japan (Figure 8).
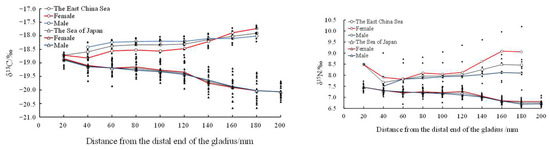
Figure 8.
Relationship between average δ13C‰ and δ15N‰ values and the growth of the proostracum of T. pacificus collected in the East China Sea and the Sea of Japan. (Black line represents males, and red line represents females.)
In addition, a t-test showed that there were significant differences in the stable isotopic values of T. pacificus between the East China Sea and the Sea of Japan (t-test, δ13C: F = 4.532, p = 0<0.01; δ15N: F = 1.164, p = 0<0.01). The stable isotopic values of T. pacificus in the East China Sea were significantly higher than those in the Sea of Japan (Figure 8).
4. Discussion
4.1. Trophic Niche
The trophic niche can reflect the trophic level of an organism in its ecosystem [16]. The relationship (overlap/independent) between trophic niche plots can reflect individuals’ or groups’ trophic niche relationships [27]. The trophic niche area can be used to analyze the competitive ability of individuals or groups; the larger the trophic niche area is, the stronger the competitive ability for resources [28]. In this study, for the T. pacificus samples collected in the East China Sea, the trophic niches of the G2, G6, and G7 samples did not overlap with those of the other samples, which may be because the G2, G6, and G7 samples came from different spawning grounds. The fact that there are multiple spawning grounds of T. pacificus in the East China Sea also supports this interpretation [29,30,31]. This phenomenon also occurred in other cephalopods. Gong [25] found that Dosidicus gigas samples collected from the coast of Peru had groups that came from different spawning grounds, and the trophic niches of samples that came from different spawning grounds did not overlap. The trophic niches of the G1, G3, G4, G5, and G8 samples overlapped with each other, indicating that these samples may come from the same spawning ground, and they have similar living environments. The migration paths and food of the samples were similar during their life history. Xie [32] found that Sthenoteuthis oualaniensis individuals with overlapping trophic niches have similar migration paths and food intake. In addition, the SEAc of the samples collected in the East China Sea were different, indicating that samples have different competitive abilities for resources. The different SEAc values may have been related to sex, mantle length, and living environment. The G6 sample had the largest SEAc, which may be related to the larger ML of G6. For the T. pacificus samples collected in the Sea of Japan, the trophic niches of the T. pacificus samples overlapped with each other, and the SEAc of the T. pacificus samples was similar, indicating that these samples came from the same spawning ground and preyed on food with similar trophic levels, and these samples had similar migration paths and feeding ecologies during their life history. The T. pacificus samples were collected in the northern part of the Sea of Japan, but the spawning ground of T. pacificus was mainly distributed in the southern part of the Sea of Japan [33]. Therefore, it is possible that the samples migrated northward during their life history.
This study analyzed the trophic niche between T. pacificus collected in the East China Sea and the Sea of Japan and found that the trophic niches of the two areas did not overlap. This result indicated that T. pacificus were spatially heterogeneous, so stable isotope values can be used to trace the different geographic regions of the T. pacificus group. Studies have shown that the different stable isotope values can trace the different groups of D. gigas, such as Chilean, Peruvian, and the central eastern Pacific [34]. In comparison to those in the Sea of Japan, T. pacificus samples collected in the East China Sea had a larger SEAc, which indicated that samples collected in the East China Sea occupied a higher position in the ecosystem. The trophic niches may have been related to factors such as latitude, feeding ecology, and living environment [35]. The larger SEAc of T. pacificus collected in the East China Sea was a result of the following factors: (1) The T. pacificus collected in the East China Sea had groups that came from different spawning grounds, so the T. pacificus collected in the East China Sea had a more complex feeding ecology and a larger SEAc. (2) The T. pacificus collected in the East China Sea had a higher stable isotope baseline. Studies have shown that there is a negative correlation between the stable isotopic baseline of phytoplankton and latitude, and the stable isotopic values decrease with increasing latitude [36]. This phenomenon also occurred in other cephalopods. For instance, Takai found that the δ13C value of S. oualaniensis muscle in low-latitude sea areas was higher than that in high-latitude sea areas [37]. The latitude of the East China Sea was lower than that of the Sea of Japan, so the T. pacificus collected in the East China Sea had a higher stable isotope baseline and a larger SEAc. (3) The T. pacificus collected in the East China Sea may prey on food at higher trophic levels. T. pacificus is an opportunistic predator, and it preys on different kinds of food in different areas [38]. Gong found that D. gigas in different areas prey on different kinds of food [34]. Currently, there are few studies on the feeding of T. pacificus, and the types of food consumed by T. pacificus in the East China Sea and the Sea of Japan are not clear. Further analysis can be carried out in combination with stomach content analysis.
In this study, for T. pacificus collected in the East China Sea and the Sea of Japan, there was significant overlap between the females and males. This result indicated that females and males had similar feeding ecologies and that there was strong competition between females and males. The trophic niche area of the females was larger than that of the males, which may indicate that females have a stronger competitive capacity than males. Females’ stronger competitive capacity may be caused by the fact that females prefer to prey on food of higher trophic level or larger size. Within the same population, females and males can reduce mutual competition and maintain functional status by distributing different habitats and food [39,40]. Females had higher energy requirements for individual and gonad development. Fang found that females of Ommastrephes bartramii have larger feeding organs, higher energy demands, and stronger feeding abilities [41]. This phenomenon also occurred in D. gigas [34]. Further analysis should be carried out in combination with a morphological analysis of feeding organs.
4.2. Geographic Variation and Trophic Variation
Stable isotope values in biological tissues can provide transitional information about matter and energy in food webs [21]. The value of δ13C (13C/12C) changes little with increasing trophic level, so δ13C can reflect the habitat of organisms and is mainly used to analyze the migration path of organisms. The value of δ15N (15N/14N) gradually increases with increasing trophic level, so δ15N can reflect the trophic level of organisms in an ecosystem, and δ15N can be used to analyze the feeding ecology of organisms [42].
The gladius is the hard tissue of cephalopods. Cephalopods can convert nutrients from food into chitin and protein, and then the chitin and protein form the new structure of the gladius. The growth of the gladius is irreversible and continues through the whole life history [21], so the gladius is a good carrier for recording life history information [14]. In this study, the δ13C and δ15N values of gladii were used to analyze the migration path and feeding ecology of T. pacificus. For the T. pacificus collected in the East China Sea, the δ13C and δ15N values of most samples increased with the growth of the proostracum. For the T. pacificus collected in the Sea of Japan, the δ13C and δ15N values of most samples decreased with the growth of the proostracum.
4.2.1. Geographic Variation
Cephalopods have obvious migratory behaviors [38]. Water temperature, light intensity, CO2, and other conditions vary in different areas, so the δ13C values vary in different areas, and the variation in δ13C values can reflect the geographic variation in organisms. In this study, the stable isotope values of T. pacificus in the East China Sea and the Sea of Japan fluctuated with the growth of the proostracum of the gladius, and the fluctuations were different among individuals of the two areas, indicating that the T. pacificus of the two areas have heterogeneity. This phenomenon has also occurred in other cephalopods, such as D. gigas [34], O. bartramii [43], and Sthenoteuthis pteropus [44].
In this study, the δ13C values in the East China Sea and the Sea of Japan began to change significantly when the proostracum grew to 120 mm from the distal end, indicating that migration occurred when the proostracum grew to 120 mm from the distal end. In this study, for T. pacificus samples collected in the East China Sea, although the samples may come from different spawning grounds in the East China Sea, there was a significant positive correlation between the δ13C values and the growth of the proostracum. The δ13C values were related to latitude. The higher the latitude was, the lower the δ13C value was [36]. In addition, the value of δ13C was also related to the distance from the shore. The nearshore sea area has sufficient light, continental runoff, and various nutrients, making the nearshore sea area productive and nutritious and having higher δ13C values [14]. Ruiz-Cooley et al. [45] found that the δ13C and δ15N values of oceanic cephalopod muscles had no fixed variation trend with latitude and mantle length, but the δ13C and δ15N values decreased with increasing offshore distance. Based on the above factors, it can be inferred that T. pacificus collected in the East China Sea gradually migrated to low-latitude and nearshore areas during its life history. For T. pacificus samples collected in the Sea of Japan, there was a significant negative correlation between the δ13C values and the growth of the proostracum, indicating that these samples migrated to high-latitude and offshore areas during their life history. Some studies have found that T. pacificus migrates northward to feed along both sides of the Japanese archipelago [38], which is consistent with the results of this study. In this study, for T. pacificus collected in the East China Sea and the Sea of Japan, there was no significant difference in δ13C values between females and males, indicating that there was no difference in migration paths between females and males. However, as the gladius grows, it lengthens and thickens, so the previous gladius may contain the growth increments of the subsequent long-term history. This phenomenon may influence the accuracy of the δ13C values and the migration path prediction, so further studies could be carried out in combination with stable isotopic values of biological tissues.
The migration path was greatly different between T. pacificus collected in the East China Sea and the Sea of Japan, and this phenomenon may have been caused by the fact that the two areas contain different populations of T. pacificus. Studies have shown that different populations have certain differences in morphology, spawning grounds, migration paths, and other characteristics [38]. According to molecular biological techniques, the results of the unweighted pair-group method with arithmetic means (UPGMA) showed that the population structure of T. pacificus mainly consisted of two clades, the autumn clade and the nonautumn clade [46]. This population division was mainly caused by geographical isolation [38], which was also consistent with the geographical differences in this study. Further studies could, thus, be carried out in combination with population division information.
4.2.2. Trophic Variation
The δ15N value is affected by the stable isotope baseline and feeding. The variation in the δ15N value can be used to analyze the trophic level of the feeding [42]. Lorstrain inferred the approximate period of the feeding transition of D. gigas based on the change in the δ15N value of the gladius [47]. In this study, T. pacificus collected in both the East China Sea and the Sea of Japan began to migrate when the proostracum grew to 120 mm from the distal end, and the δ15N value also began to change at this time. The variation in the δ15N value may be due to the following two reasons: One reason was migration in different areas with different stable isotopic baselines. Another reason was the changes in feeding during migration. In this study, for T. pacificus collected in the East China Sea, there was no correlation between the δ15N value and the growth of the proostracum. The δ15N values of most T. pacificus individuals did not significantly increase, indicating that the food trophic level of most individuals did not significantly change during migration. Ruiz-Cooley found that with the growth of D. gigas, the δ15N value of the gladius gradually increases, and the trophic level of the food prey increases significantly [48]. Some studies have also shown that the trophic level of the food preyed upon by T. pacificus will gradually increase with body growth [49]. However, this study’s result was contradictory to the above results, and the result of this study may be caused by La Niña events during the life history of T. pacificus collected in the East China Sea. According to the ONI index, La Niña events occurred in the spring of 2018. Some studies have shown that large-scale environmental changes can affect the migration and feeding of cephalopods [30]. The occurrence of La Niña was not conducive to the growth of T. pacificus and led to a reduction in the suitable spawning ground area and the abundance of the community resources of T. pacificus [50]. Ning also found that during the La Niña of 2018, the feeding stage of T. pacificus was lower and mainly in stages 0–2 [51]. Therefore, the occurrence of La Niña events may reduce the bait resources of T. pacificus, so the food trophic level of most T. pacificus individuals did not change. Further studies could be carried out in combination with the change in sea surface temperature (SST) caused by La Niña events.
For T. pacificus collected in the Sea of Japan, there was a significant negative correlation between the δ15N value and the growth of the proostracum. This indicates that the food trophic level of T. pacificus individuals decreased gradually during migration, which may be caused by the decrease in the trophic level of the food preyed upon by T. pacificus or the increase in the proportion of low-trophic level food preyed upon by T. pacificus during migration. Alegre [52] and Gong [34] also found that the food trophic level of D. gigas decreases during migration. T. pacificus is an opportunistic predator with no fixed feeding strategy, and it eats different kinds of food in different areas. Studies have shown that the main stomach contents of T. pacificus collected in the Sea of Japan in winter were small fish, but other studies have shown that mature T. pacificus mainly prey on fish and cephalopods [34]. Therefore, in this study, the decreased δ15N values of T. pacificus may be caused by the proportion of small fish being eaten increasing and the proportion of larger fish and cephalopods being eaten decreasing during migration. However, as mentioned above, as the gladius grows, it lengthens and thickens, so the previous gladius may contain the growth increments of the subsequent long-term history. This phenomenon may influence the accuracy of the δ15N values and the trophic variation prediction, so further studies could be carried out in combination with stable isotopic values of biological tissues. For T. pacificus collected in the East China Sea and the Sea of Japan, there was no significant difference in δ15N values between the females and males (p > 0.05), indicating that the trophic levels of food were similar between females and males.
5. Conclusions
In this study, the proostracum of T. pacificus was cut, and the stable isotope ratio of the cut fragments was measured. Based on the trophic niche and stable isotope ratio sequence, this study analyzed the geographic and trophic variations in T. pacificus collected in the southern part of the East China Sea and the Sea of Japan and analyzed the reasons for the difference in the geographic and trophic variations in T. pacificus in the two areas. The study showed that in the East China Sea, T. pacificus migrated to low latitudes and nearshore areas, and the trophic level of T. pacificus food showed no great changes during migration. In the Sea of Japan, T. pacificus migrated to high latitudes and offshore areas, and the trophic level of T. pacificus food showed a decreasing trend during migration. T. pacificus began to migrate when the proostracum grew to approximately 120 mm from the distal end. There was no significant difference in migration and feeding ecology between females and males, but the competitive capacity of the female group may be stronger than that of the male group. Future studies can combine age information, stomach content analysis, muscle stable isotope information, and environmental data to analyze the biological characteristics of T. pacificus.
Author Contributions
Conceptualization, H.L.; methodology, H.L.; software, M.Z.; validation, H.L., R.W. and J.C.; formal analysis, R.W.; investigation, J.C.; resources, H.L.; data curation, H.L.; writing—original draft preparation, R.W.; visualization, Y.O.; supervision, B.Z.; project administration, H.L.; funding acquisition, H.L. All authors have read and agreed to the published version of the manuscript.
Funding
This research was funded by National Key R&D Program of China (2019YFD090402) and the National Natural Science Foundation of China (41506184).
Institutional Review Board Statement
The study was conducted according to the guidelines of the Code of Ethics of the University Department of Marine Studies; we only used specimens obtained from the surveys that were already dead.
Informed Consent Statement
Not applicable.
Data Availability Statement
The datasets used and/or analyzed during the current study are available from the corresponding author upon reasonable request.
Acknowledgments
We thank observers who helped us with the collection and processing of samples. Thanks for the partial support of the National Key R&D Program of China (2019YFD090402) and the National Natural Science Foundation of China (41506184). Finally, we thank the editor and the anonymous reviewers whose comments greatly improved the manuscript.
Conflicts of Interest
The authors declare no conflict of interest.
References
- Chen, X.J.; Liu, B.L. Cephalopods in the World; Ocean Press: Beijing, China, 2009. [Google Scholar]
- Dong, Z.Z. On the present status and exploratory problems of Todarodes pacificus resource of in the Yellow Sea. Mar. Sci. 1996, 6, 34–38. [Google Scholar]
- Wang, G.Y.; Chen, X.J. The Resource and Biology of Economic Oceanic Squid in the World; Ocean Press: Beijing, China, 2005. [Google Scholar]
- Arkhipkin, A.I.; Rodhouse, P.G.; Pierce, G.J.; Sauer, W.; Sakai, M.; Allcock, L.; Arguelles, J.; Bower, J.R.; Castillo, G.; Ceriola, L.; et al. World squid fisheries. Rev. Fish. Sci. Aquac. 2015, 2, 92–252. [Google Scholar] [CrossRef]
- Sakural, Y.; Kidokoro, H.; Yamashita, N.; Yamamoto, J.; Uchikawa, K.; Takahara, H. Advances in Squid Biology, Ecology and Fisheries. Part II-Oegopsid Squid. In Todarodes pacificus, Japanese Flying Squid; Rosa, P.G., O’Dor, R., Eds.; Nova Science Publishers: New York, NY, USA, 2013; p. 262. [Google Scholar]
- Hamabe, M.; Shimizu, T. Ecological studies on the common squid, Todarodes pacificus teenstrup, mainly in the southwestern waters of the Japan Sea. Bull. Jpn. Sea Reg. Fish. Res. Lab. 1966, 16, 13–55. [Google Scholar]
- Okutani, T. Diet of the common squid, Ommastrephes sloani pacificus landed around Ito Port, Shizuoka Prefecture. Tokai Reg. Fish. Res. Lab. 1962, 32, 41–47. [Google Scholar]
- Sugawara, M.; Yamashita, N.; Sakaguchi, K.; Sato, T.; Sawamura, M.; Yasue, N.; Mori, K.; Fukuwaka, M.-A. Effects of hatch timing and sex on growth of the winter-spawning stock of Japanese common squid Todarodes pacificus migrating in the Pacific Ocean. Nippon Suisan Gakkaishi 2013, 5, 823–831. [Google Scholar] [CrossRef]
- Yang, L.L.; Jiang, Y.Z.; Liu, Z.L.; Lin, N.; Li, S.F.; Cheng, J.Y. Annual variability in population structure of Todarodes pacificus in the East China Sea in summer. J. Fish. Sci. China 2014, 21, 593–601. [Google Scholar]
- Boyle, P.R. Cephalopod Life Cycles, Volume 1. Species Accounts; Academic Press: London, UK, 1983; pp. 201–214. [Google Scholar]
- Ikeda, Y.; Sakurai, Y.; Shimazaki, K. Maturation process of Japanese common squid Todarodes pacificus in captivity. In Recent Advances in Cephalopod Fishery Biology; Okutani, T., O’Dor, R.K., Kubidera, T., Eds.; Tokai University Press: Tokyo, Japan, 1993; pp. 179–187. [Google Scholar]
- Sakurai, Y. How climate change might impact squid populations and ecosystems: A case study of the Japanese common squid, Todarodes pacificus. Glob. Ocean Ecosyst. Dyn. 2006, 24, 33–34. [Google Scholar]
- Okutani, T. Juvenile morphology. In Cephalopod Life Cycles. Volume II, Comparative Reviews; Boyle, P.R., Ed.; Academic Press: London, UK, 1987; pp. 33–44. [Google Scholar]
- Li, Y.K.; Gong, Y.; Chen, X.J. Applications of stable isotope analysis in the trophic ecology studies of cephalopods. Chin. J. Appl. Ecol. 2014, 5, 1541–1546. [Google Scholar]
- Rounick, J.S.; Winterbourn, M.J. Stable carbon isotopes and carbon flow in ecosystems. Bioscience 1986, 36, 171–177. [Google Scholar] [CrossRef]
- Post, D.M. Using stable isotopes to estimate trophic position: Models, method, and assumptions. Ecology 2002, 83, 703–718. [Google Scholar] [CrossRef]
- Cherel, Y.; Hobson, K.A. Stable isotopes, beaks and predators: A new tool to study the trophic ecology of cephalopods, including giant and colossal squids. Proceeding Res. Soc. Biol. 2005, 272, 1601–1607. [Google Scholar] [CrossRef]
- Landman, N.H.; Cochran, J.K.; Cerrato, R.; Mak, J.; Roper, C.F.E.; Lu, C.C. Habitat and age of the giant squid (Architeuthis sanctipauli) inferred from isotopic analyses. Mar. Biol. 2004, 144, 685–691. [Google Scholar] [CrossRef]
- Lukeneder, A.; Harzhauser, M.; Mullegger, S.; Piller, W.E. Stable isotopes (δ18O and δ13C) in Spirula spirula shells from three major oceans indicate developmental changes paralleling depth distributions. Mar. Biol. Lett. 2008, 154, 175–182. [Google Scholar] [CrossRef]
- Jackson, G.D.; Bustamante, P.; Cherel, Y.; Fulton, E.A.; Grist, E.P.M.; Jackson, C.H.; Nichols, P.D.; Pethybridge, H.; Phillips, K.; Ward, R.D.; et al. Applying new tools to cephalopod trophic dynamics and ecology: Perspectives from the Southern Ocean Cephalopod Workshop. Rev. Fish Biol. Fish. 2007, 17, 79–99. [Google Scholar] [CrossRef]
- Li, J.H.; Li, Y.K.; Chen, X.J.; Fang, Z.; Liu, B.L. Review on stable isotope in hard issues of cephalopods. J. Shanghai Ocean Univ. 2014, 23, 154–160. [Google Scholar]
- Koletzko, B.; Demmelmair, H.; Hartl, W.; Kindermann, A.; Koletzko, S.; Sauerwald, T.; Szitanyi, P. The use of stable isotope techniques for nutritional and metabolic research in paediatrics. Early Hum. Dev. 1998, 53, S77–S97. [Google Scholar] [CrossRef] [PubMed]
- Ehrhardt, N.M.; Jacquemin, P.; García, F.; Gonzáles, G.; Lὁpez, J.M.; Ortiz, J.; Solís, A. On the Fishery and Biology of the Giant Squid Dosidicus gigas in the Gulfof California, Mexico; FAO Fisheries Technical Papers; FAO: Rome, Italy, 1983; Volume 231, pp. 306–340. [Google Scholar]
- Yang, L.L.; Jiang, Y.Z.; Cheng, J.Y. Population structure and reproductive biology of Todarodes pacificus in Southern Yellow Sea. Chin. J. Ecol. 2010, 29, 1167–1174. [Google Scholar]
- Gong, Y.; Chen, X.J.; Li, Y.K. A study on feeding ecology and migration patterns of Dosidicus gigas off Peru using stable isotope analysis. Chin. J. Appl. Ecol. 2015, 26, 2874–2880. [Google Scholar]
- Gong, Y. The Study on Foraging Strategies and Migration Patterns of Jumbo Squid (Dosidicus gigas) off Peru Based on the Stable Isotopic Information in Gladius; Shanghai Ocean University: Shanghai, China, 2015. [Google Scholar]
- Hammerschlag-Peyer, C.M.; Yeager, L.A.; Araujo, M.S.; Layman, C.A. A Hypothesis-Testing Framework for Studies Investigating Ontogenetic Niche Shifts Using Stable Isotope Ratios. PLoS ONE 2011, 6, e27104. [Google Scholar] [CrossRef] [PubMed]
- Shi, Y. Seasonal Variation in Trophic Niche of Common Fish in the Min Estuary Based on Stable Isotope; Jimei University: Xiamen, China, 2018. [Google Scholar]
- Murata, M. Population assessment, management and fishery forecasting for the Japanese common squid, Todarodes pacificus. In Marine Invertebrate Fisheries: Their Assessment and Management; Caddy, J.F., Ed.; Wiley: New York, NY, USA, 1989; pp. 613–636. [Google Scholar]
- Sakurai, Y.; Kiyofuji, H.; Saitoh, S.; Goto, T.; Hiyama, Y. Changes in inferred spawning areas of Todarodes pacificus (Cephalopoda: Mmastrephidae) due to changing environmental conditions. J. Mar. Sci. 2000, 57, 24–30. [Google Scholar] [CrossRef]
- Song, H.T.; Ding, T.M.; Yu, K.J.; Shen, J.X.; Wang, X.Q.; Ruan, B. The distribution and migration of Todarodes pacificus in East China Sea. Ocean. Aquat. Sci. 1999, 18, 9–14. [Google Scholar]
- Xie, J.Y.; Zhang, L.Z.; Wu, W.X.; Zhou, B.H.; Chen, Q.J.; Zhao, C.X.; He, X.B.; Xu, J.; Yan, Y.R. Feeding habit and trophic niche of purpleback flying squid (Sthenoteuthis oualaniensis) in the Nansha Islands area, South China Sea. J. Fish. China 2021, 45, 1993–2002. [Google Scholar]
- Kidokoro, H.; Mori, K.; Goto, T.; Kinoshita, T. Stock assessment and management method for the Japanese common squid in Japan. Suisankanri Danwakaiho 2003, 30, 18–35. [Google Scholar]
- Gong, Y. Feeding Ecology of Jumbo Flying Squid (Dosidicus gigas) in the Eastern Pacific Ocean Inferred by Biochemical Tracers; Shanghai Ocean University: Shanghai, China, 2018. [Google Scholar]
- Fang, Z.; Thompson, K.; Jin, Y.; Chen, X.J.; Chen, Y. Preliminary analysis of beak stable isotopes (δ13C and δ15N) stock variation of neon flying squid, Ommastrephes bartramii, in the North Pacific Ocean. Fish. Res. 2016, 177, 153–163. [Google Scholar] [CrossRef]
- Rau, G.H.; Sweeney, R.E.; Kaplan, I.R. Plankton 13C: 12C ratio changes with latitude: Differences between northern and southern oceans. Deep Sea Res. Part A Oceanogr. Res. Pap. 1982, 29, 1035–1039. [Google Scholar] [CrossRef]
- Takai, N.; Onaka, S.; Ikeda, Y.; Yatsu, A.; Kidokoro, H.; Sakamoto, W. Geographical variations in carbon and nitrogen stable isotope ratios in squid. J. Mar. Biol. Assoc. United Kingd. 2000, 80, 675–684. [Google Scholar] [CrossRef]
- Fang, Z.; Chen, X.J. Review on fishery of Japanese flying squid Todarodes pacificus. Mar. Fish. 2018, 40, 102–116. [Google Scholar]
- Camphuysen, K. Differential foraging strategies and offshore habitat preferences of seabirds feeding on sand eels in the North Sea. Alauda 2005, 73, 220–221. [Google Scholar]
- Dayan, T.; Simberloff, D. Ecological and community-wide character displacement: The next generation. Ecol. Lett. 2005, 8, 875–894. [Google Scholar] [CrossRef]
- Fang, Z.; Chen, X.J.; Su, H.; Thompson, K.; Chen, Y. Evaluation of stock variation and sexual dimorphism of beak shape of neon flying squid, Ommastrephes bartramii, based on geometric morphometrics. Hydrobiologia 2017, 784, 367–380. [Google Scholar] [CrossRef]
- Hobson, K.A.; Welch, H.E. Determination of trophic relationships within a high Arctic marine food web using δ13C and δ15 N an alysis. Mar. Ecol. Prog. Ser. 1992, 84, 9–18. [Google Scholar] [CrossRef]
- Kato, Y.; Sakai, M.; Nishikawa, H.; Igarashi, H.; Ishikawa, Y.; Vijai, D.; Sakurai, Y.; Wakabayshi, T.; Awaji, T. Stable isotope analysis of the gladius to investigate migration and trophic patterns of the neon flying squid (Ommastrephes bartramii). Fish. Res. 2016, 173, 169–174. [Google Scholar] [CrossRef]
- Merten, V.; Christiansen, B.; Javidpour, J.; Piatkowski, U.; Puebla, O.; Gasca, R.; Hoving, H.-J.T. Diet and stable isotope analyses reveal the feeding ecology of the orangeback squid Sthenoteuthis pteropus (Steenstrup 1855) (Mollusca, Ommastrephidae) in the eastern tropical Atlantic. PLoS ONE 2017, 12, e0189691. [Google Scholar] [CrossRef] [PubMed]
- Ruiz-Cooley, R.; Gerrodette, T. Tracking large-scale latitudinal patterns of δ13C and δ15N along the E Pacific using epi-mesopelagic squid as indicators. Ecosphere 2012, 3, 1–17. [Google Scholar] [CrossRef]
- Katugin, O.N. Patterns of genetic variability and population structure in the North Pacific squids Ommastrephes bartramii, Todarodes pacificus, and Berryteuthis magister. Bull. Mar. Sci. 2002, 71, 383–420. [Google Scholar]
- Lorrain, A.; Argüelles, J.; Alegre, A.; Bertrand, A.; Munaron, J.M.; Richard, P.; Cherel, Y. Sequential isotopic signature along gladius highlights contrasted individual foraging strategies of jumbo squid (Dosidicus gigas). PLoS ONE 2011, 6, e22194. [Google Scholar] [CrossRef]
- Ruiz-Cooley, R.I.; Villa, E.C.; Gould, W.R. Ontogenetic variation of δ13 C and δ15 N recorded in the gladius of the jumbo squid Dosidicus gigas: Geographic differences. Mar. Ecol. Prog. Ser. 2010, 399, 187–198. [Google Scholar] [CrossRef]
- Kidokoro, H.; Uji, R. Estimation on the age of Japanese common squid Todarodes pacificus cannibalized by their own species. Bull. Jpn. Sea Natl. Fish. Res. Inst. 1999, 49, 123–127. [Google Scholar]
- Wu, S.N.; Yu, W.; Chen, X.J. Variations in environmental conditions on the spawning grounds of autumn cohort of Todarodes pacificus and their impacts on squid abundance. Mar. Fish. 2018, 40, 129–138. [Google Scholar]
- Ning, X.; Lu, H.J.; Liu, K.; Chen, Z.Y.; Chen, X.J. Fisheries biological characteristics of Japanese common squid (Todarodes pacificus) in spring in the La Niña year of 2018 in the East China Sea. J. Fish. China 2020, 44, 1676–1684. [Google Scholar]
- Alegre, A.; Ménard, F.; Tafur, R.; Espinoza, P.; Arguelles, J.; Maehara, V.; Flores, O.; Simier, M.; Bertrand, A. Comprehensive model of jumbo squid Dosidicus gigas trophic ecology in the northern Humboldt Current system. PLoS ONE 2014, 9, e85919. [Google Scholar] [CrossRef] [PubMed]
Disclaimer/Publisher’s Note: The statements, opinions and data contained in all publications are solely those of the individual author(s) and contributor(s) and not of MDPI and/or the editor(s). MDPI and/or the editor(s) disclaim responsibility for any injury to people or property resulting from any ideas, methods, instructions or products referred to in the content. |
© 2023 by the authors. Licensee MDPI, Basel, Switzerland. This article is an open access article distributed under the terms and conditions of the Creative Commons Attribution (CC BY) license (https://creativecommons.org/licenses/by/4.0/).