
Acetylcholine, Another Factor in Breast Cancer


Abstract
:Simple Summary
Abstract
1. Introduction
2. Materials and Methods
2.1. Chemical Reagents
2.2. Cell Culture
2.3. Quantitative Real-Time PCR (q-RT-PCR)
2.4. MTT Assay
2.5. Nuclear Protein Isolation
2.6. Western Blot
2.7. Immunofluorescence and Confocal Microscopy
2.8. Immunocytochemistry (ICC)
2.9. Ca+2 Influx Assay
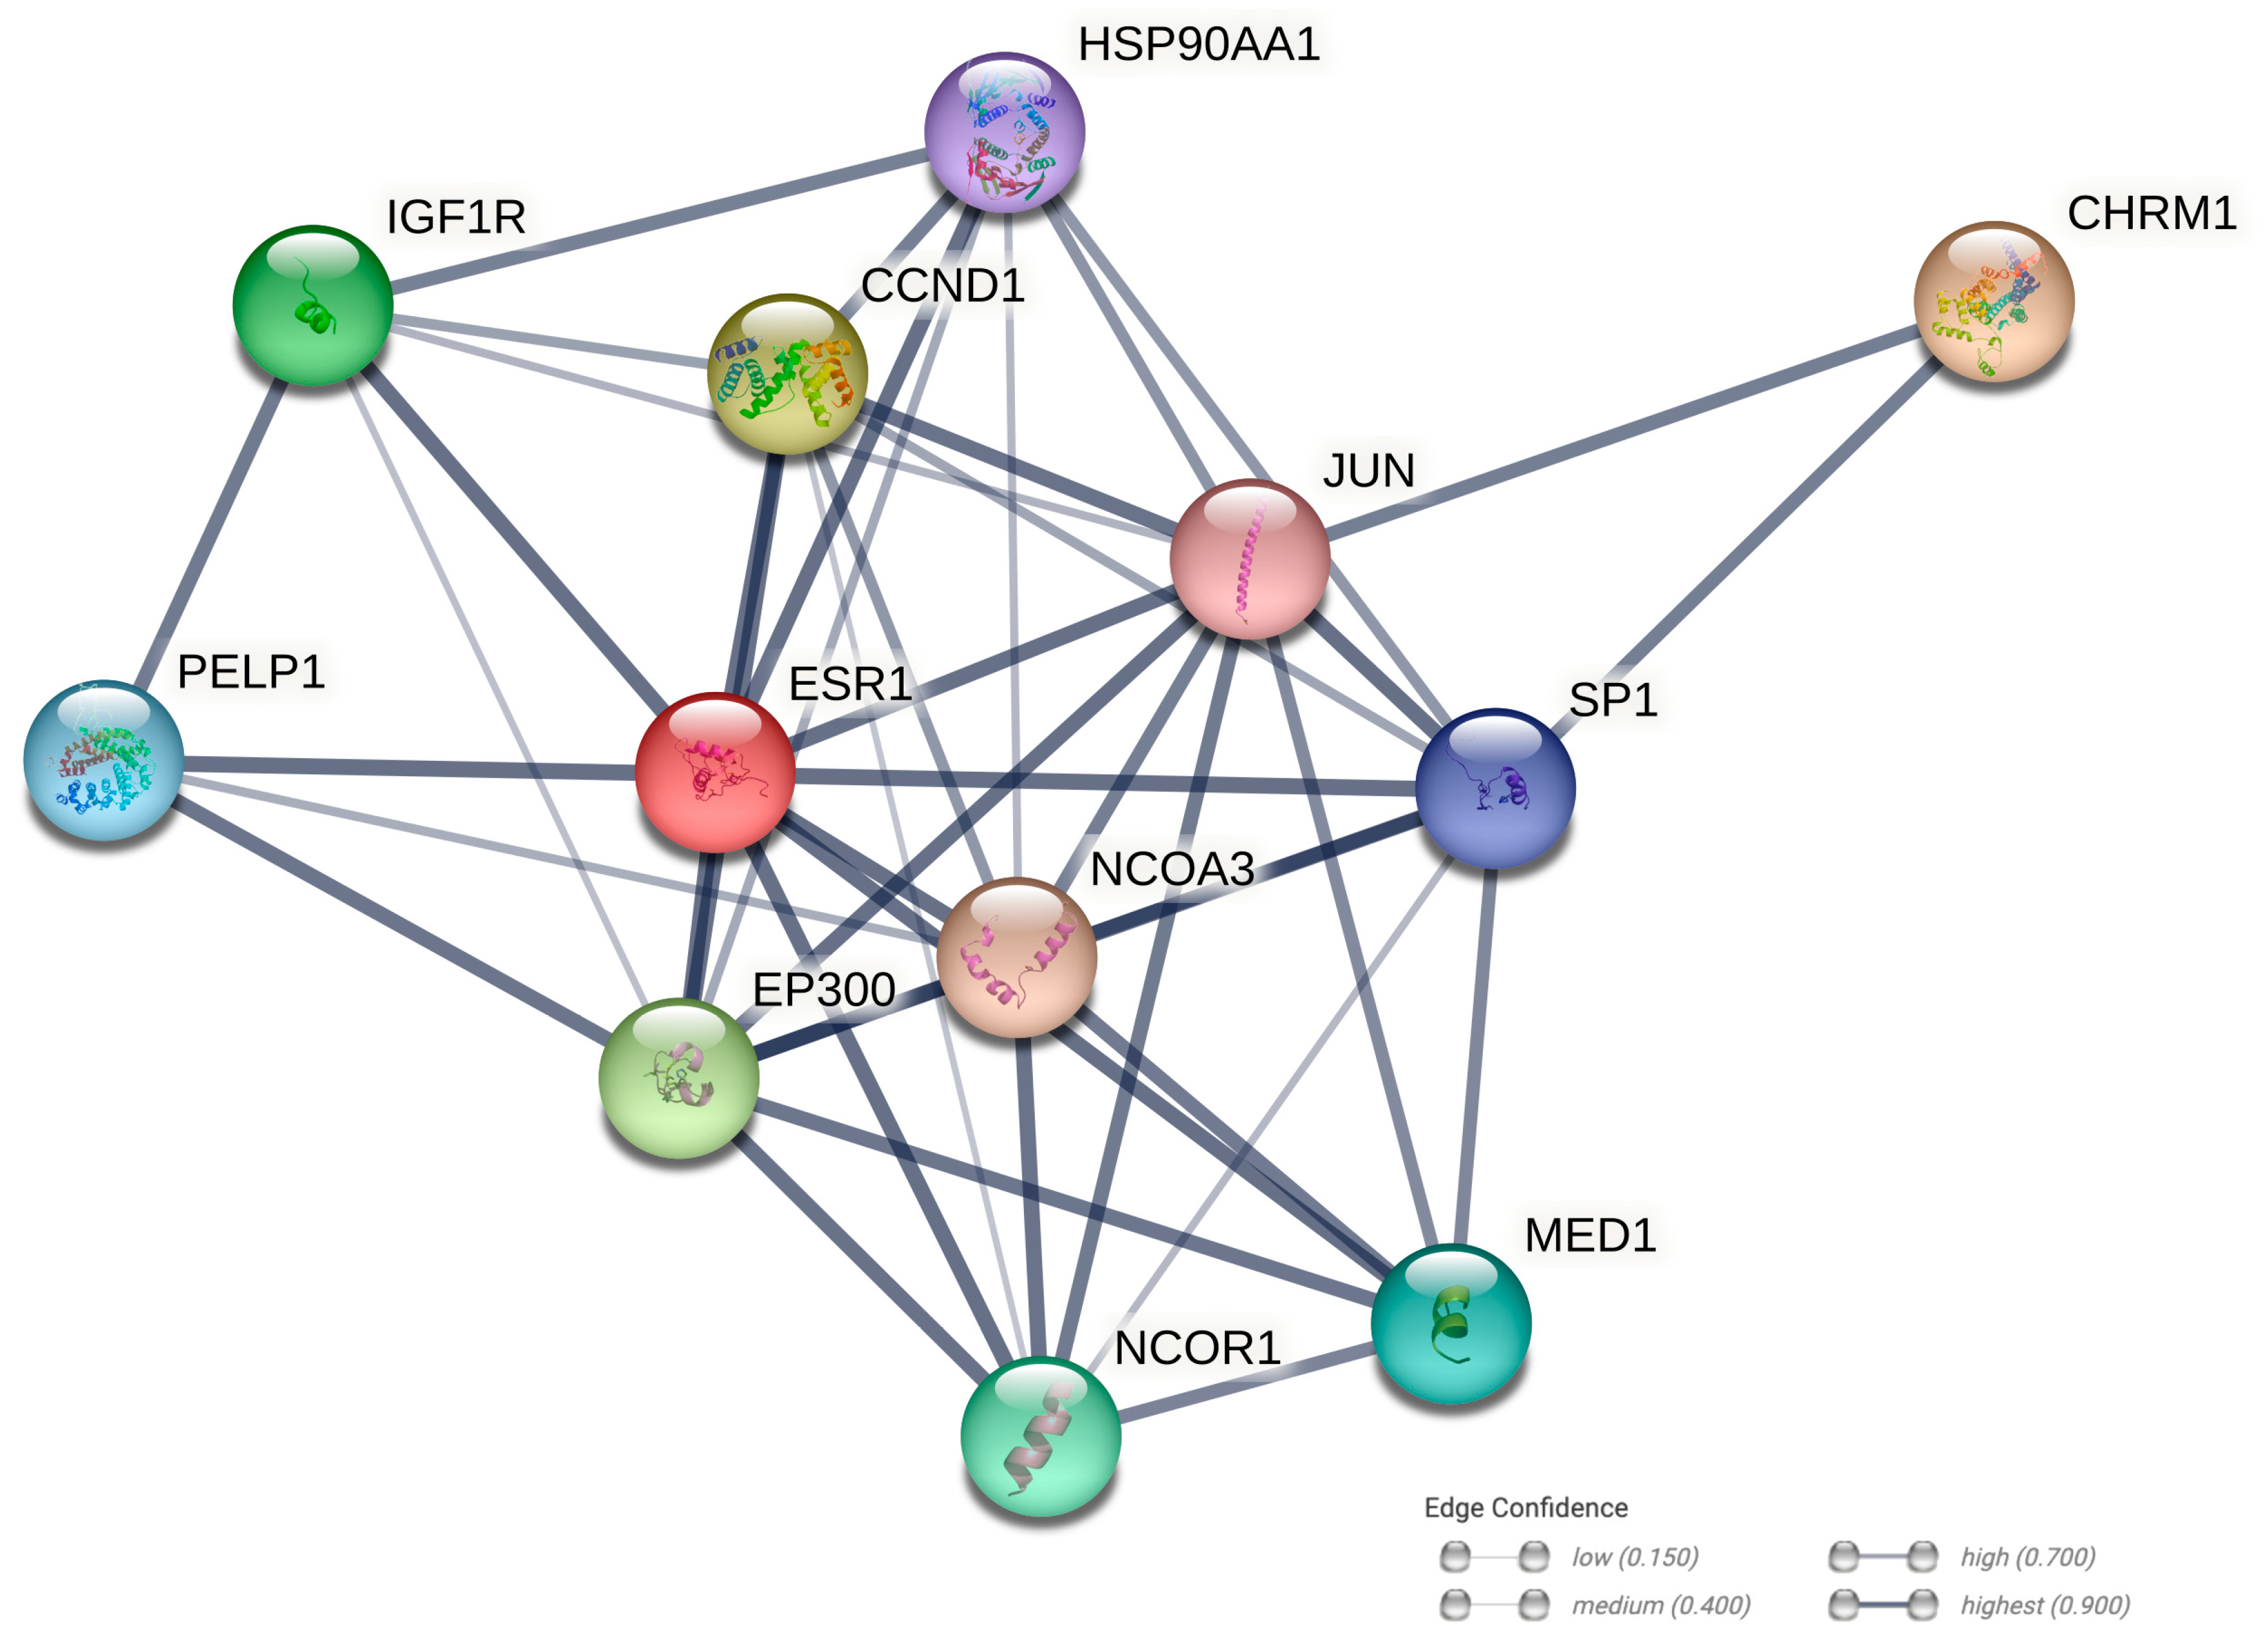
2.10. Protein–Protein Interaction Networks
2.11. Statistical Analysis
3. Results
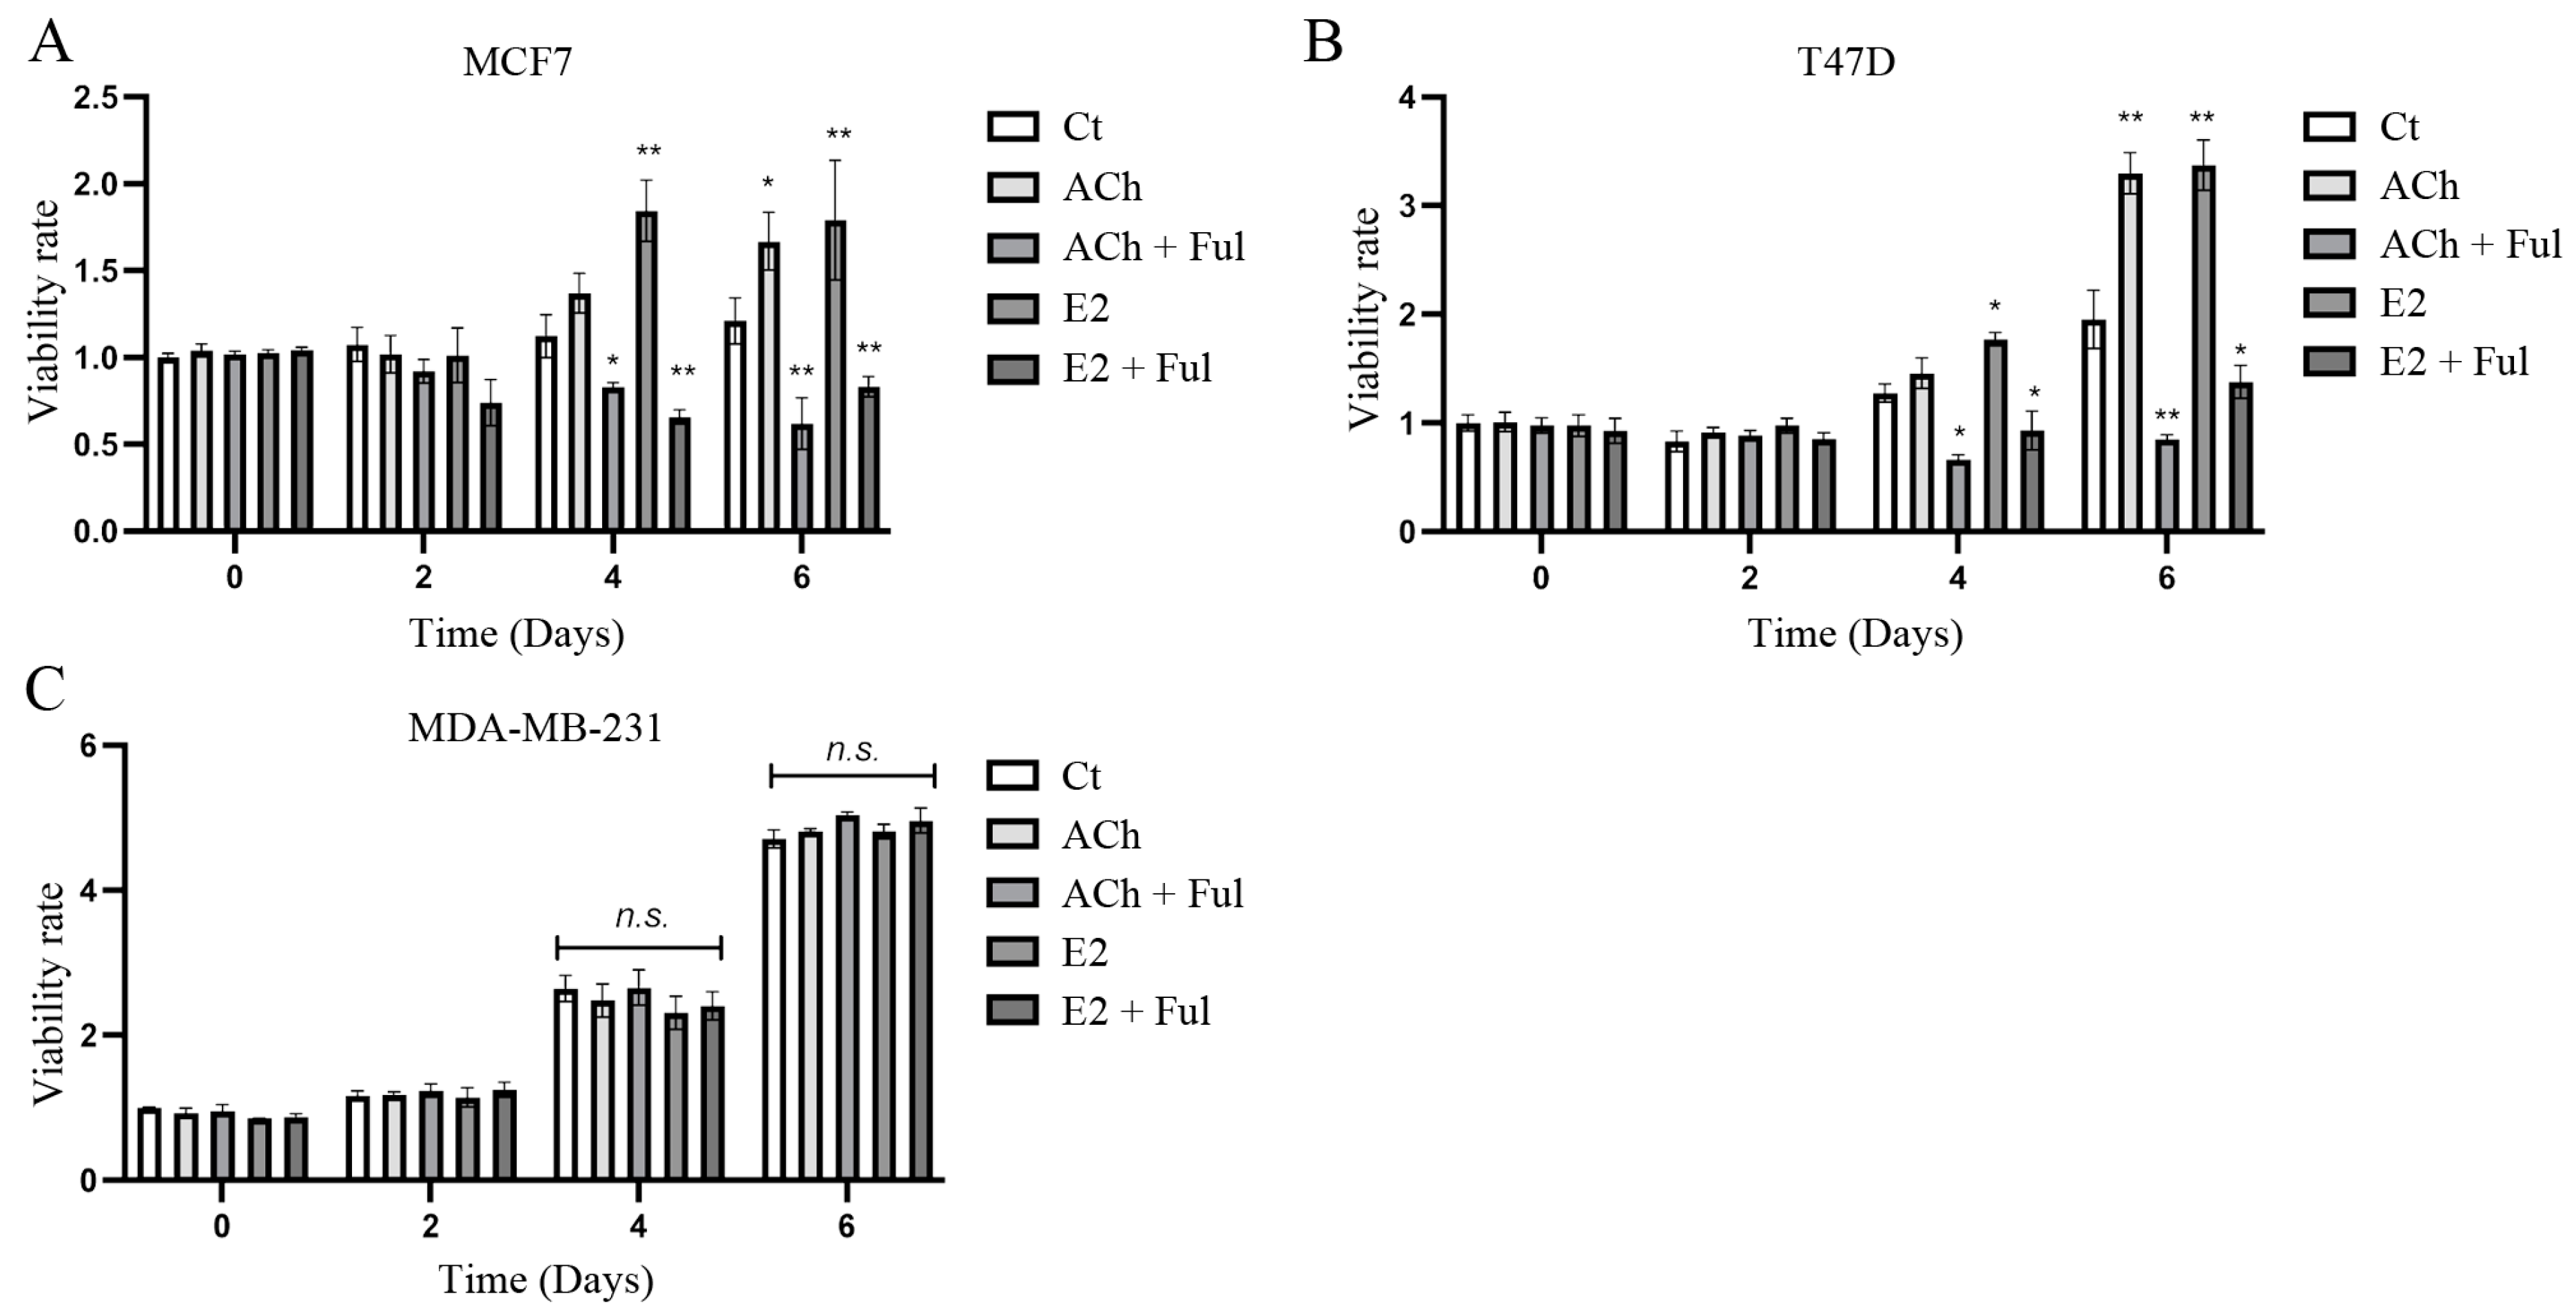
3.1. Cell Viability
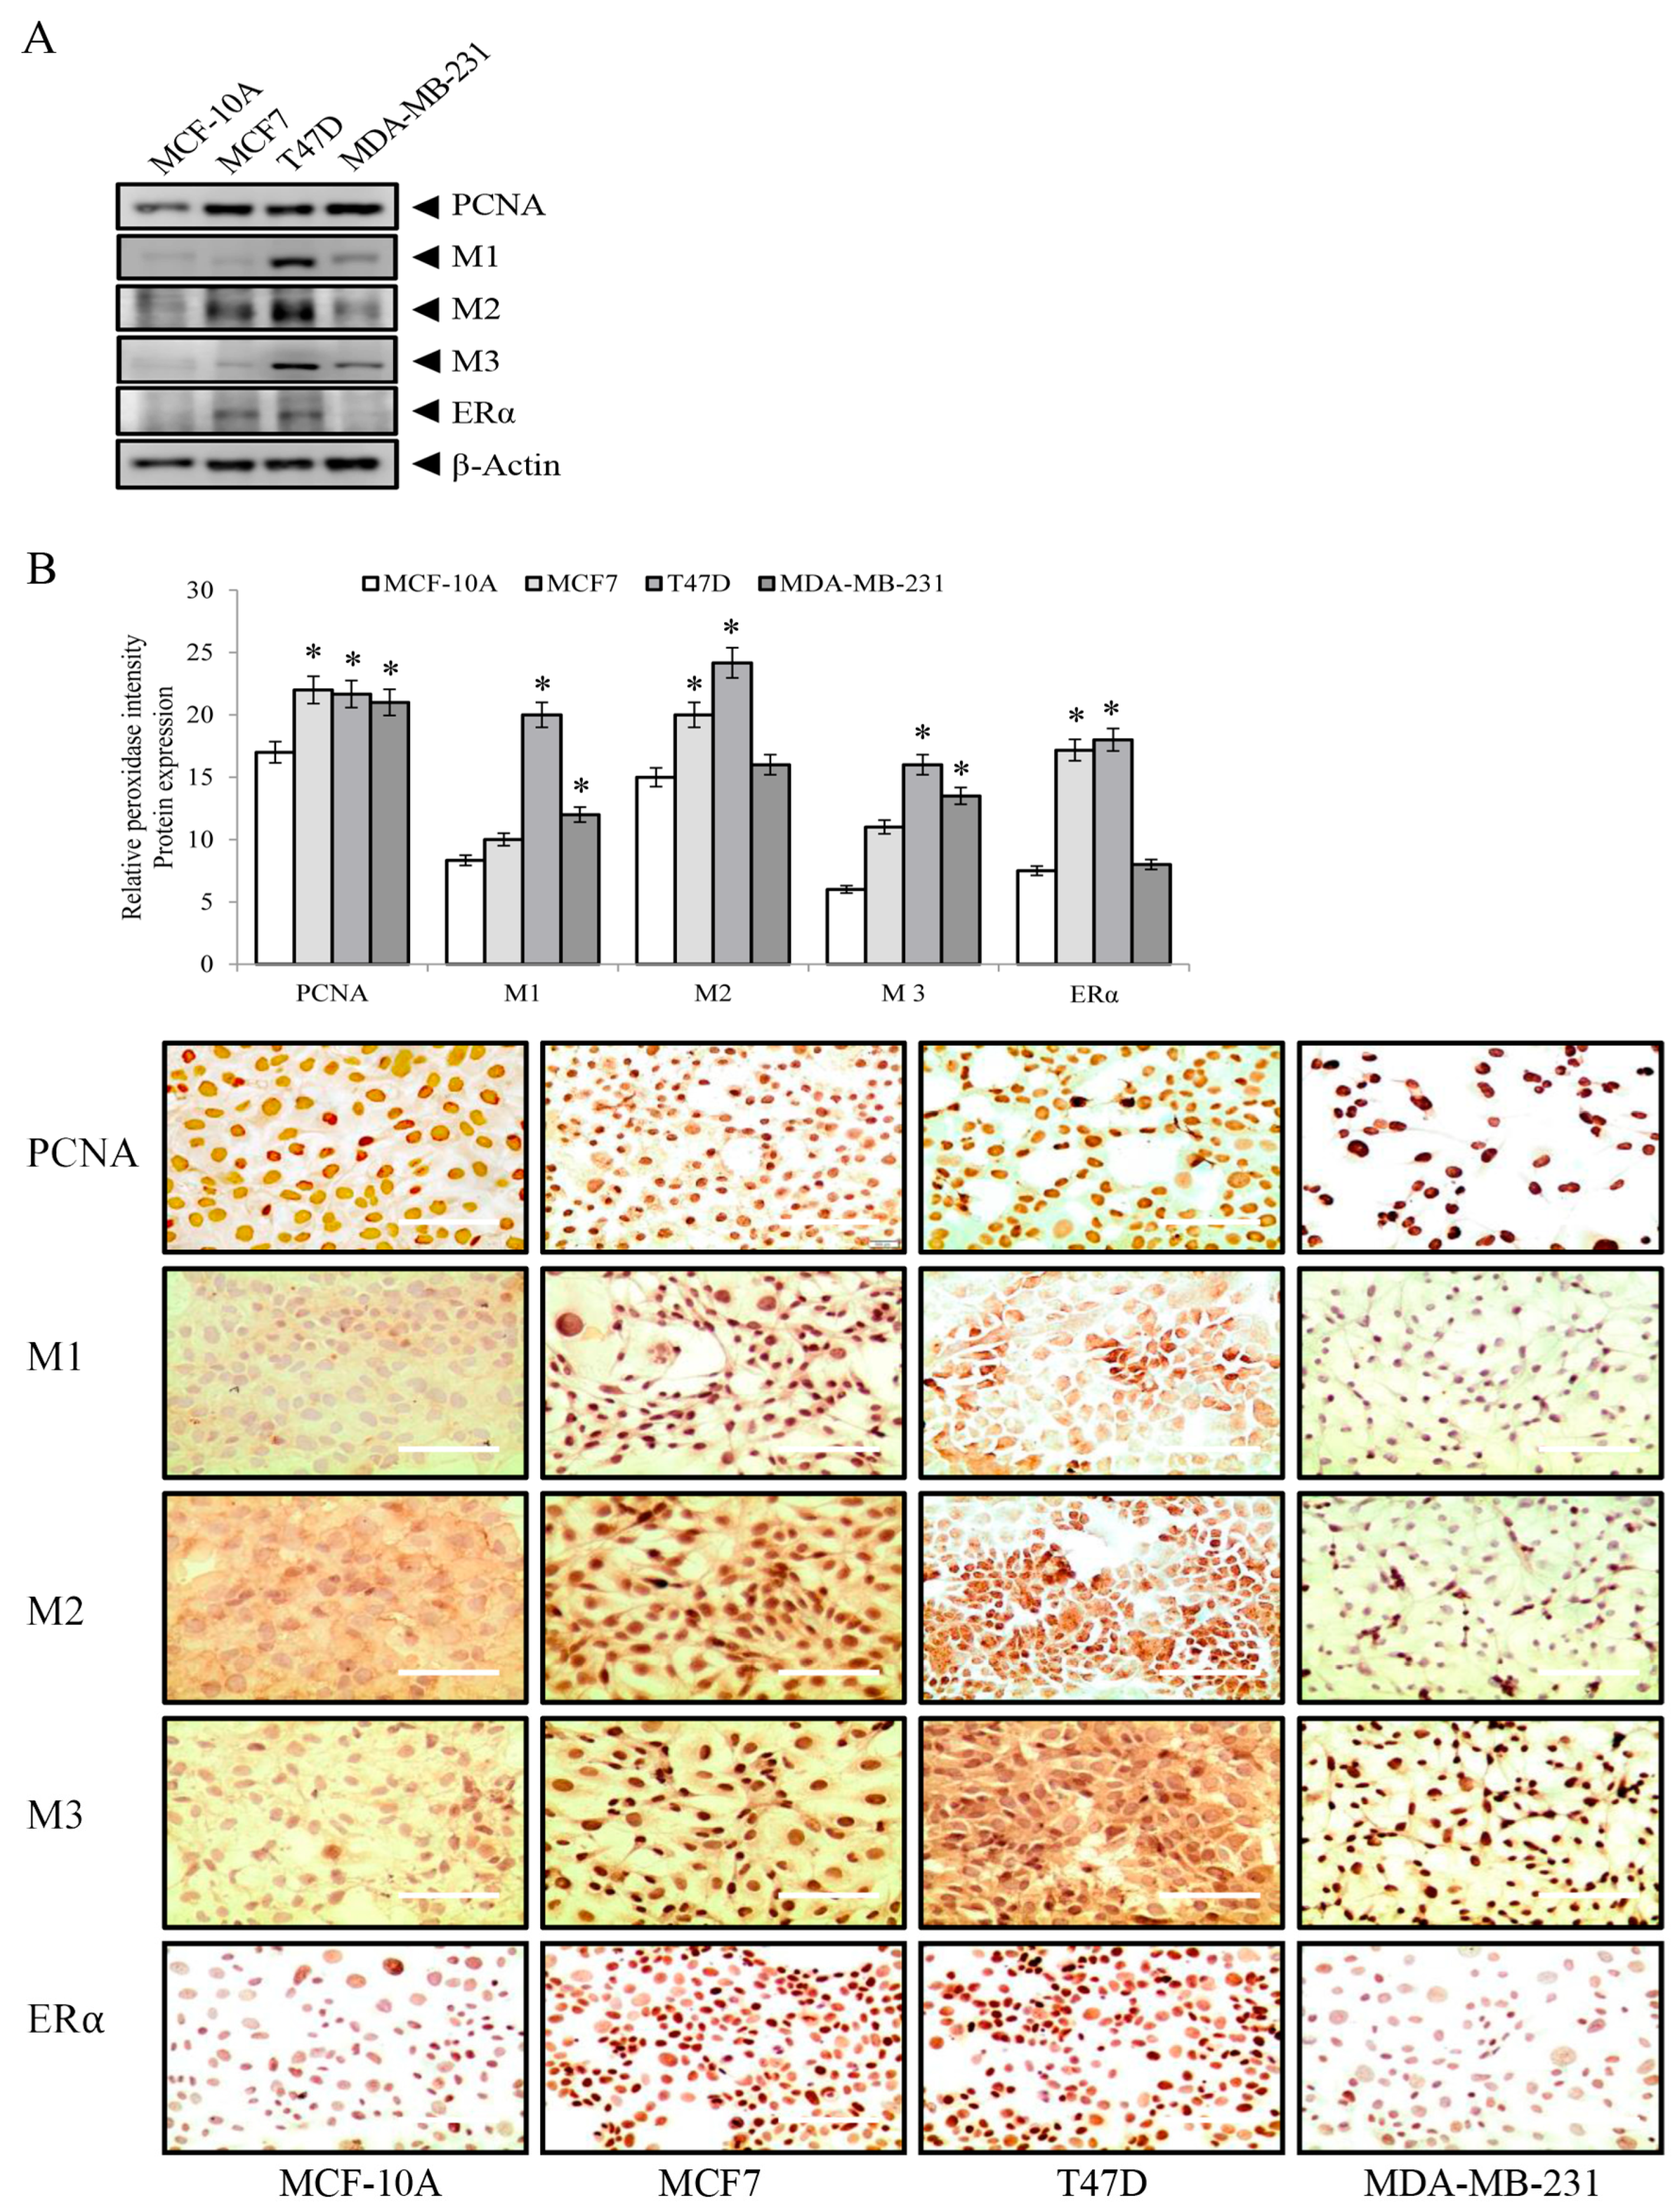
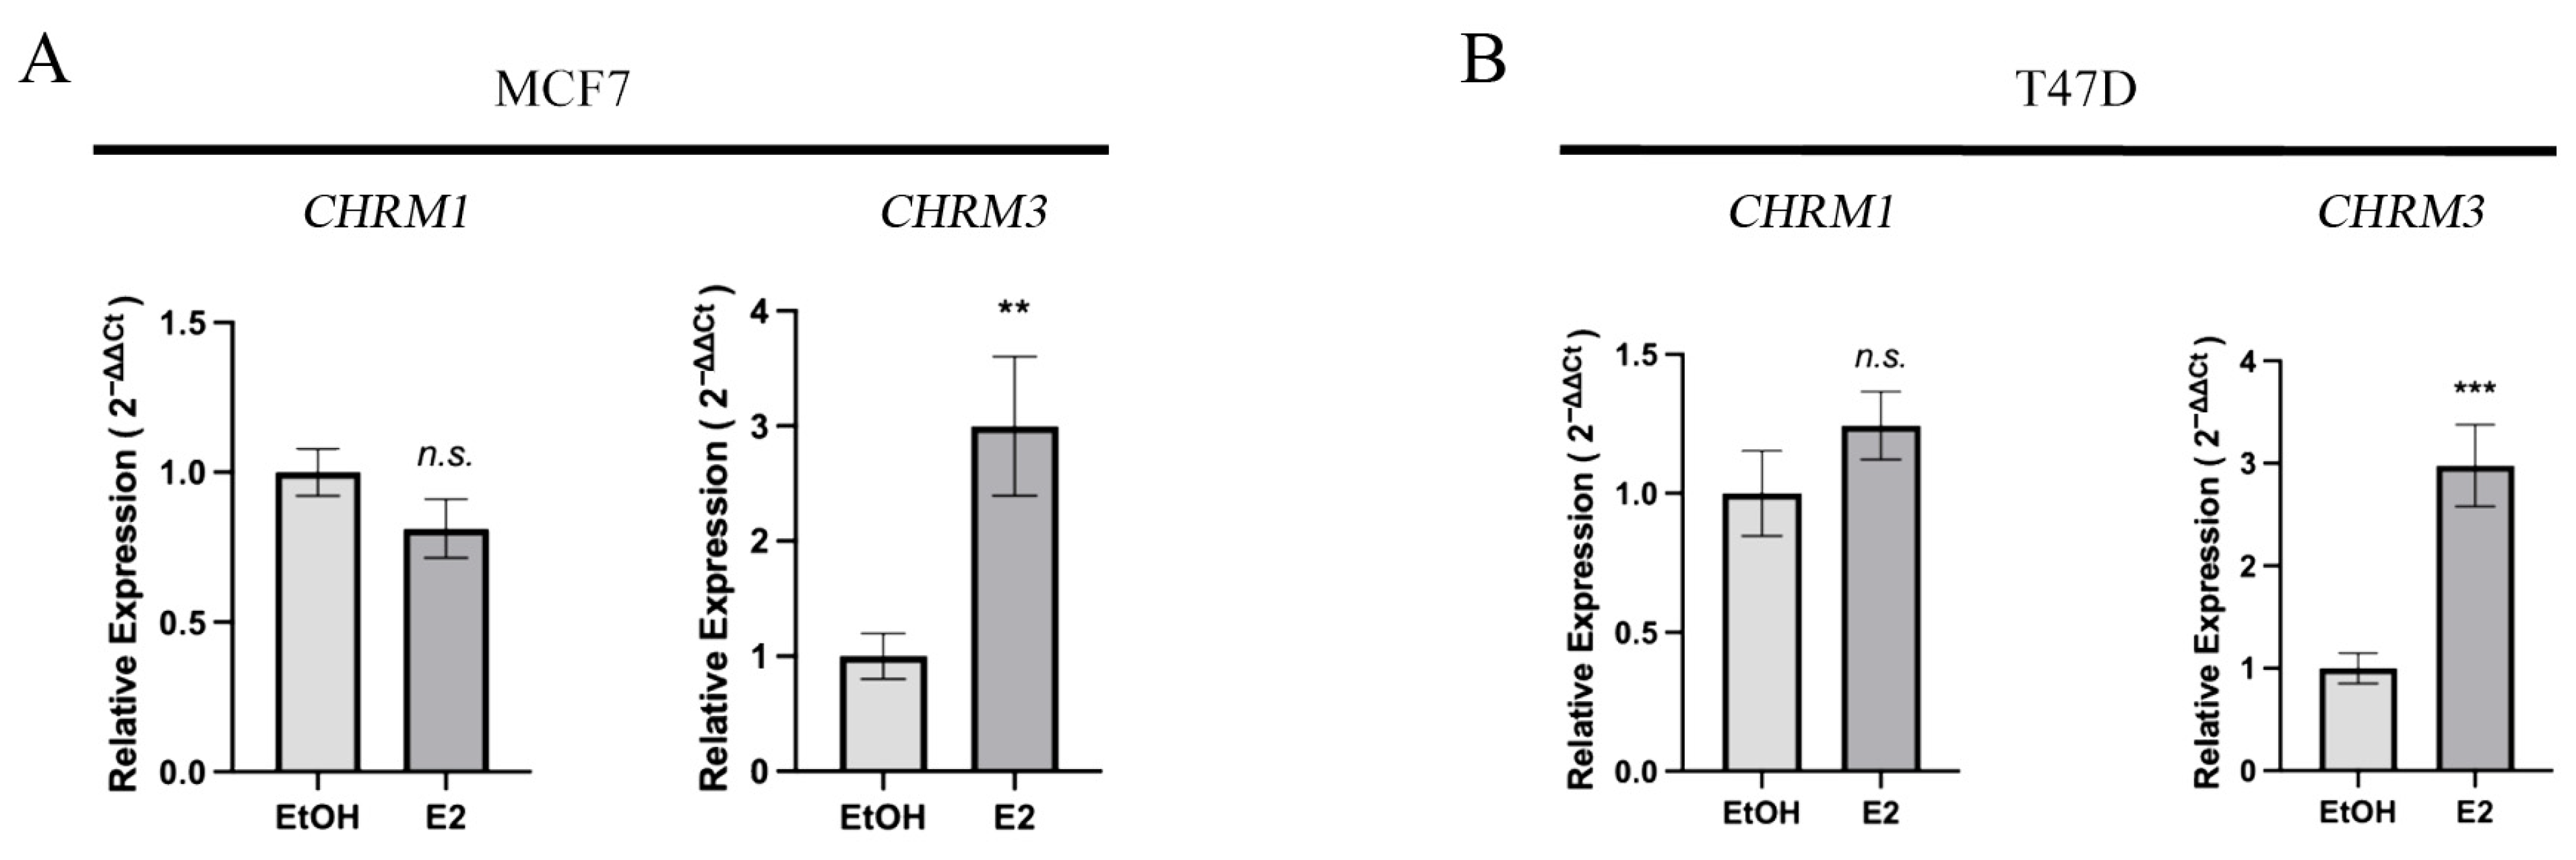
3.2. Proliferating Nuclear Antigen (PCNA), Muscarinic Receptors M1, M2, M3, and Estrogen Receptor Alpha (ERα) Protein Expression in Breast Cell Lines
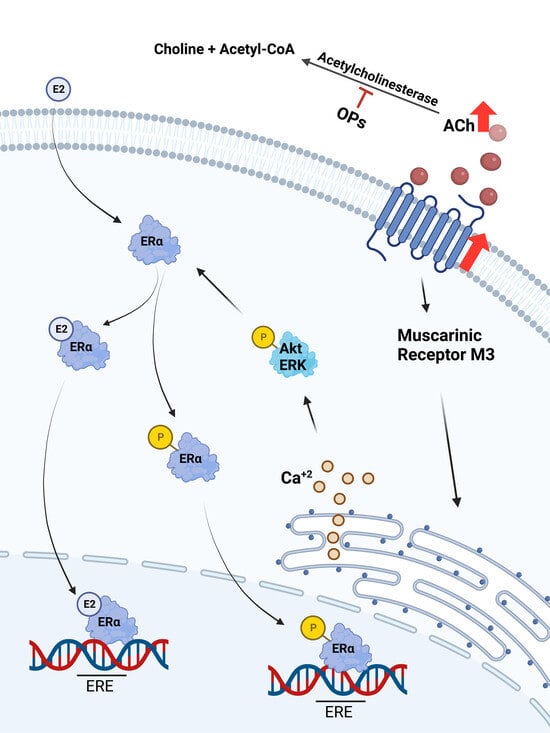
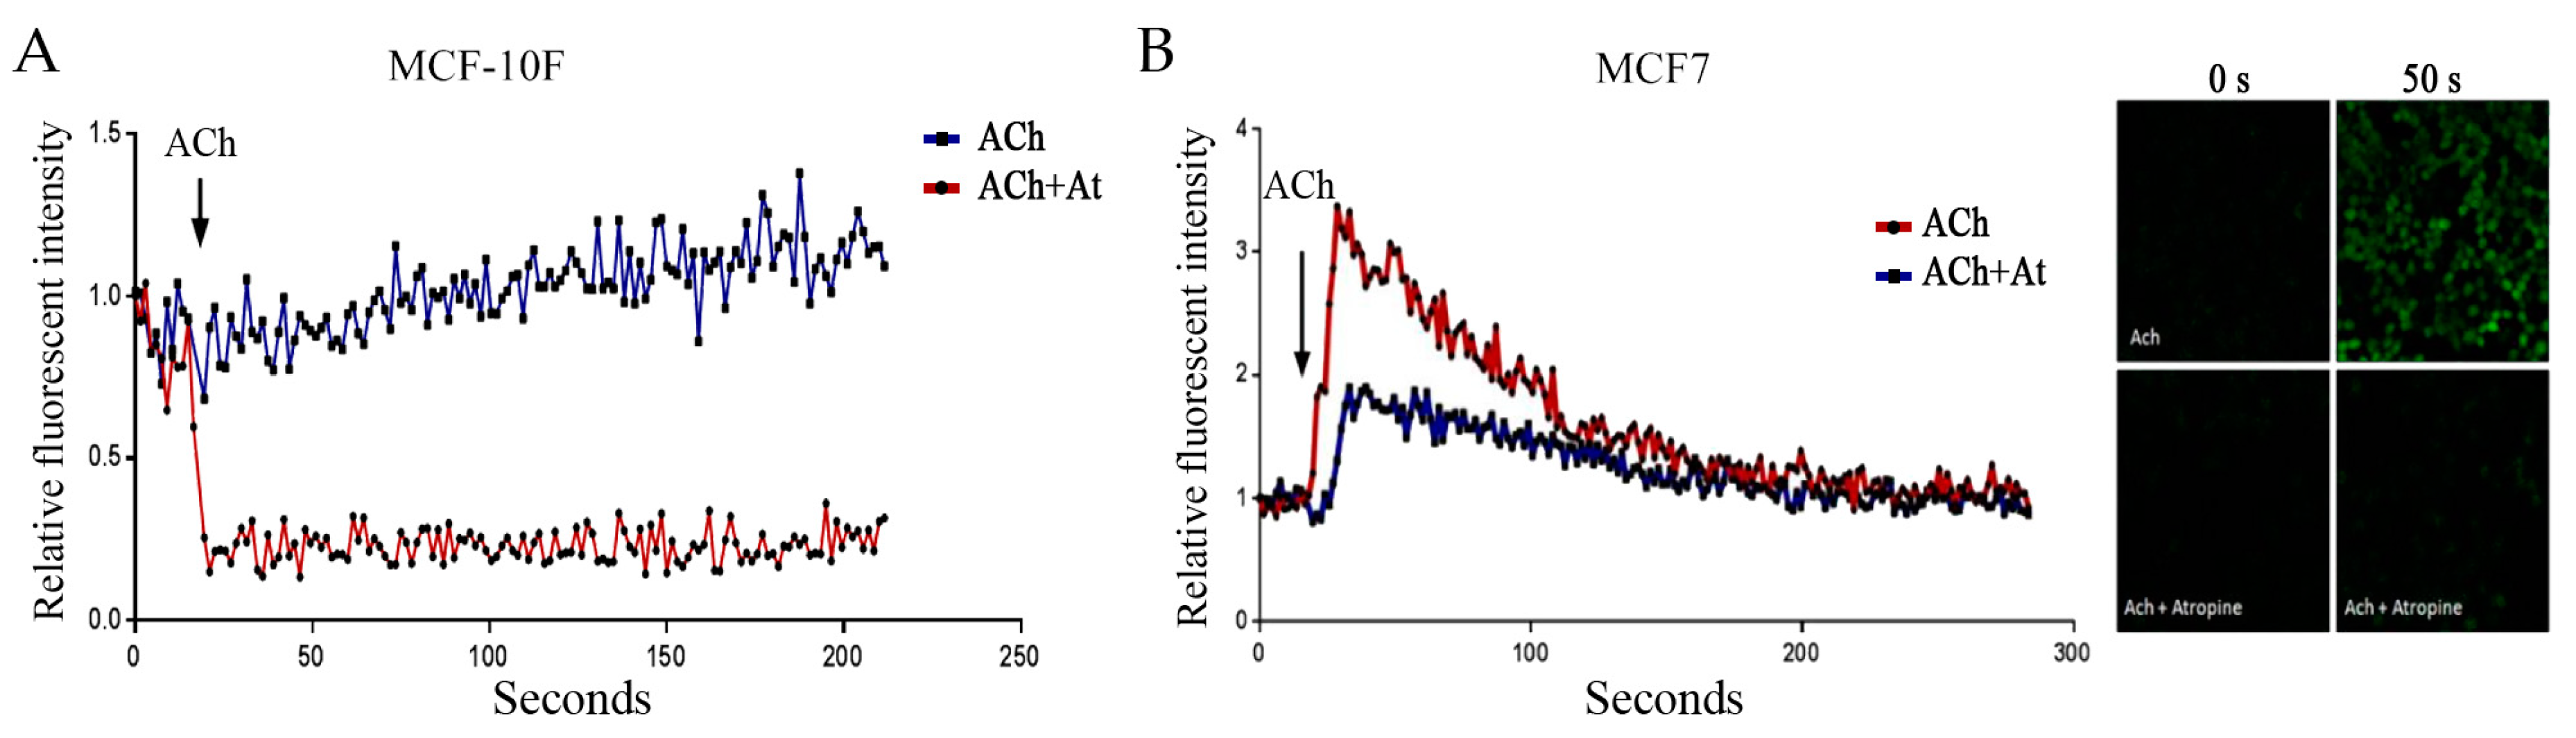
3.3. Acetylcholine and Calcium
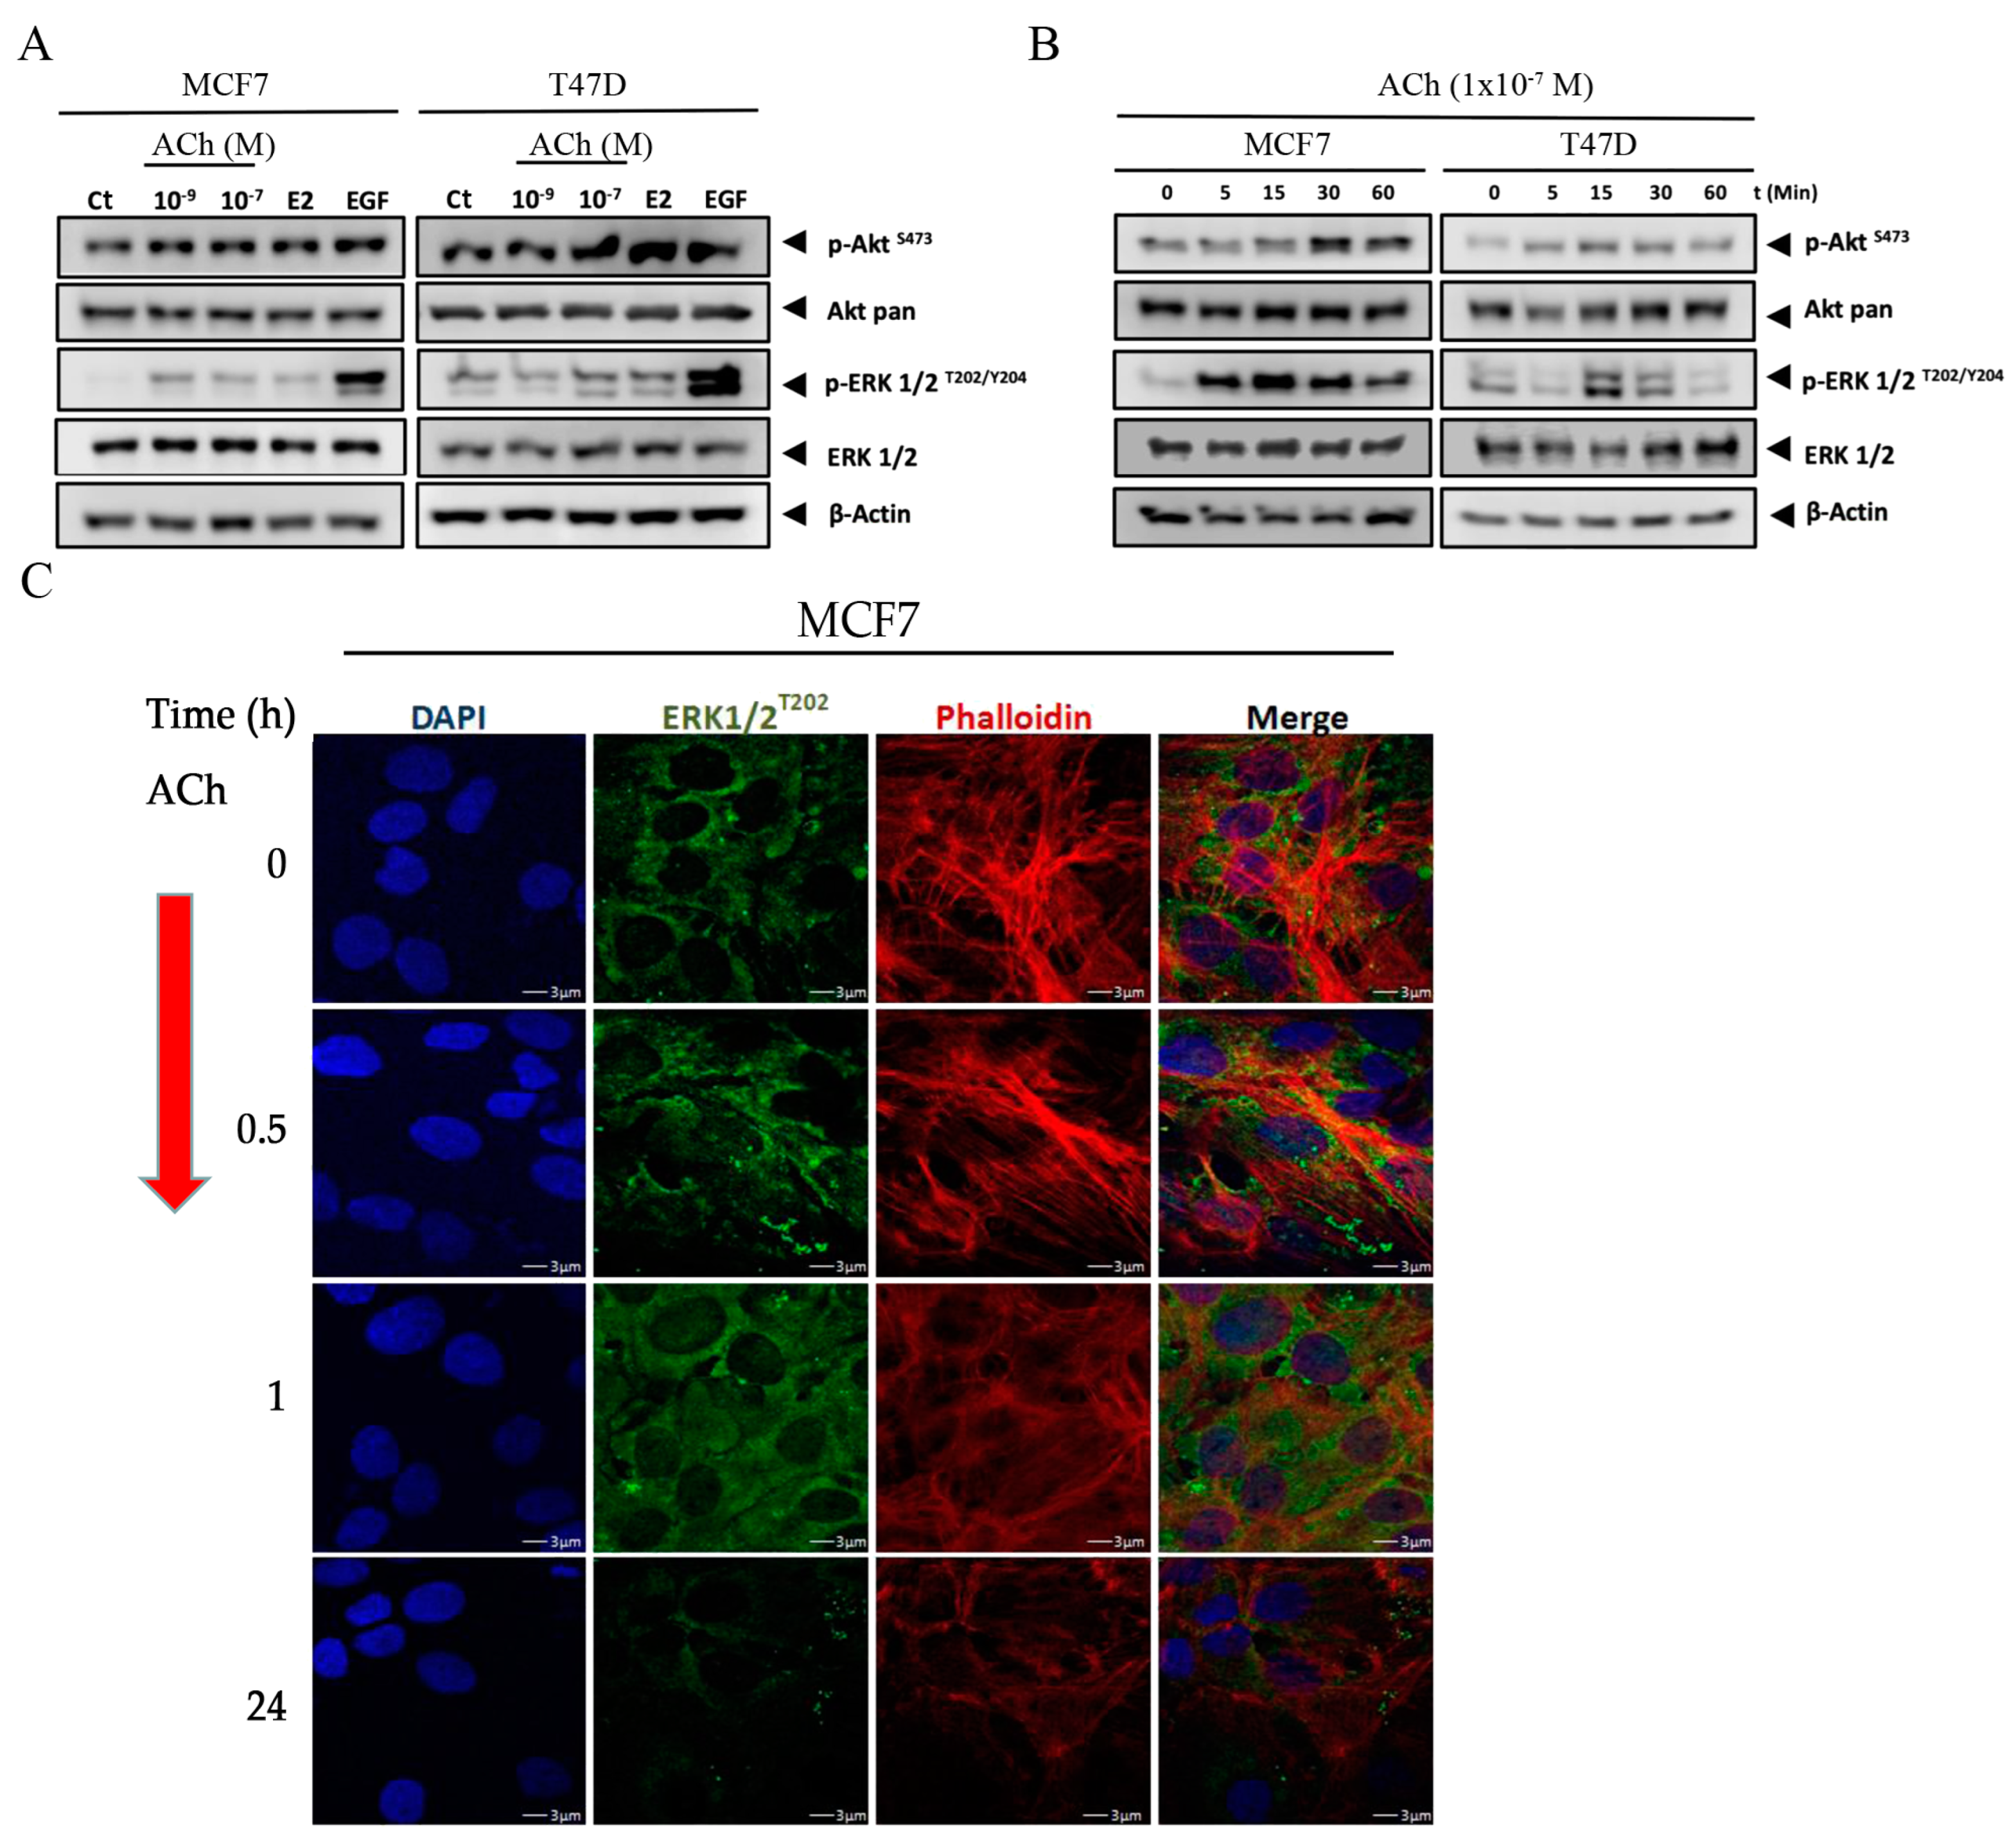
3.4. Acetylcholine Leads to Phosphorylation of Akt and ERK 1/2 in Breast Cell Lines
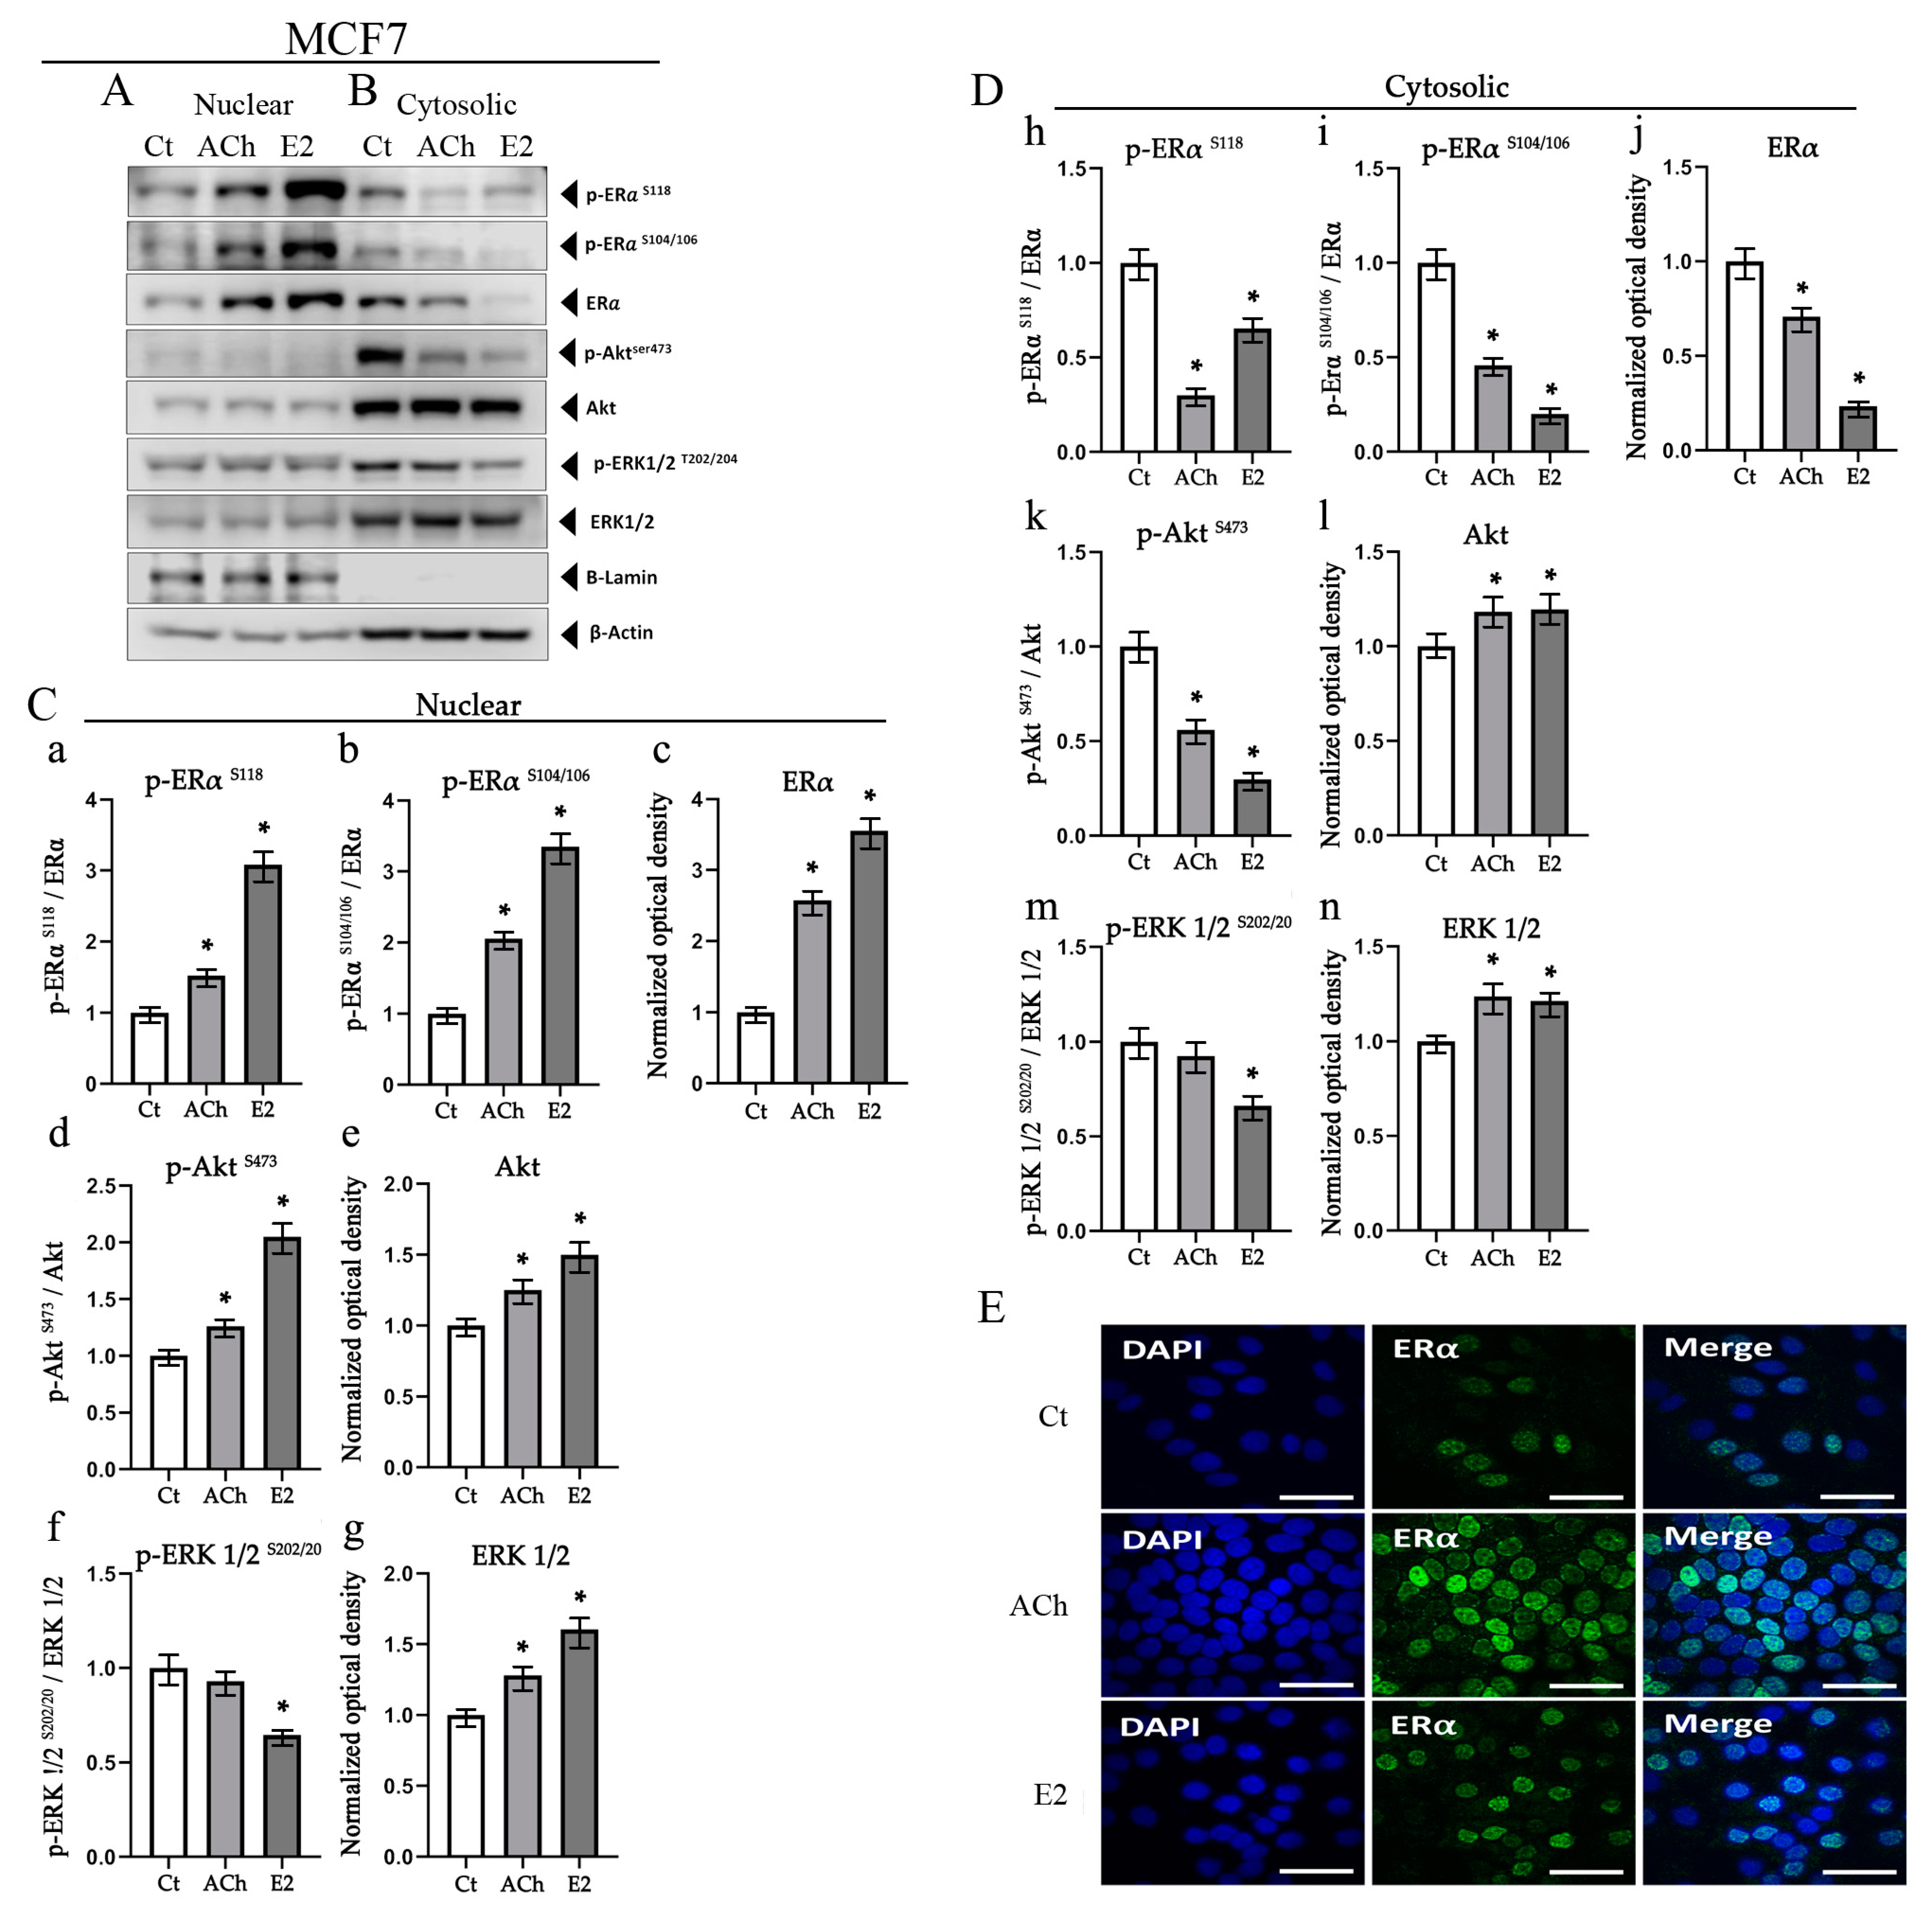
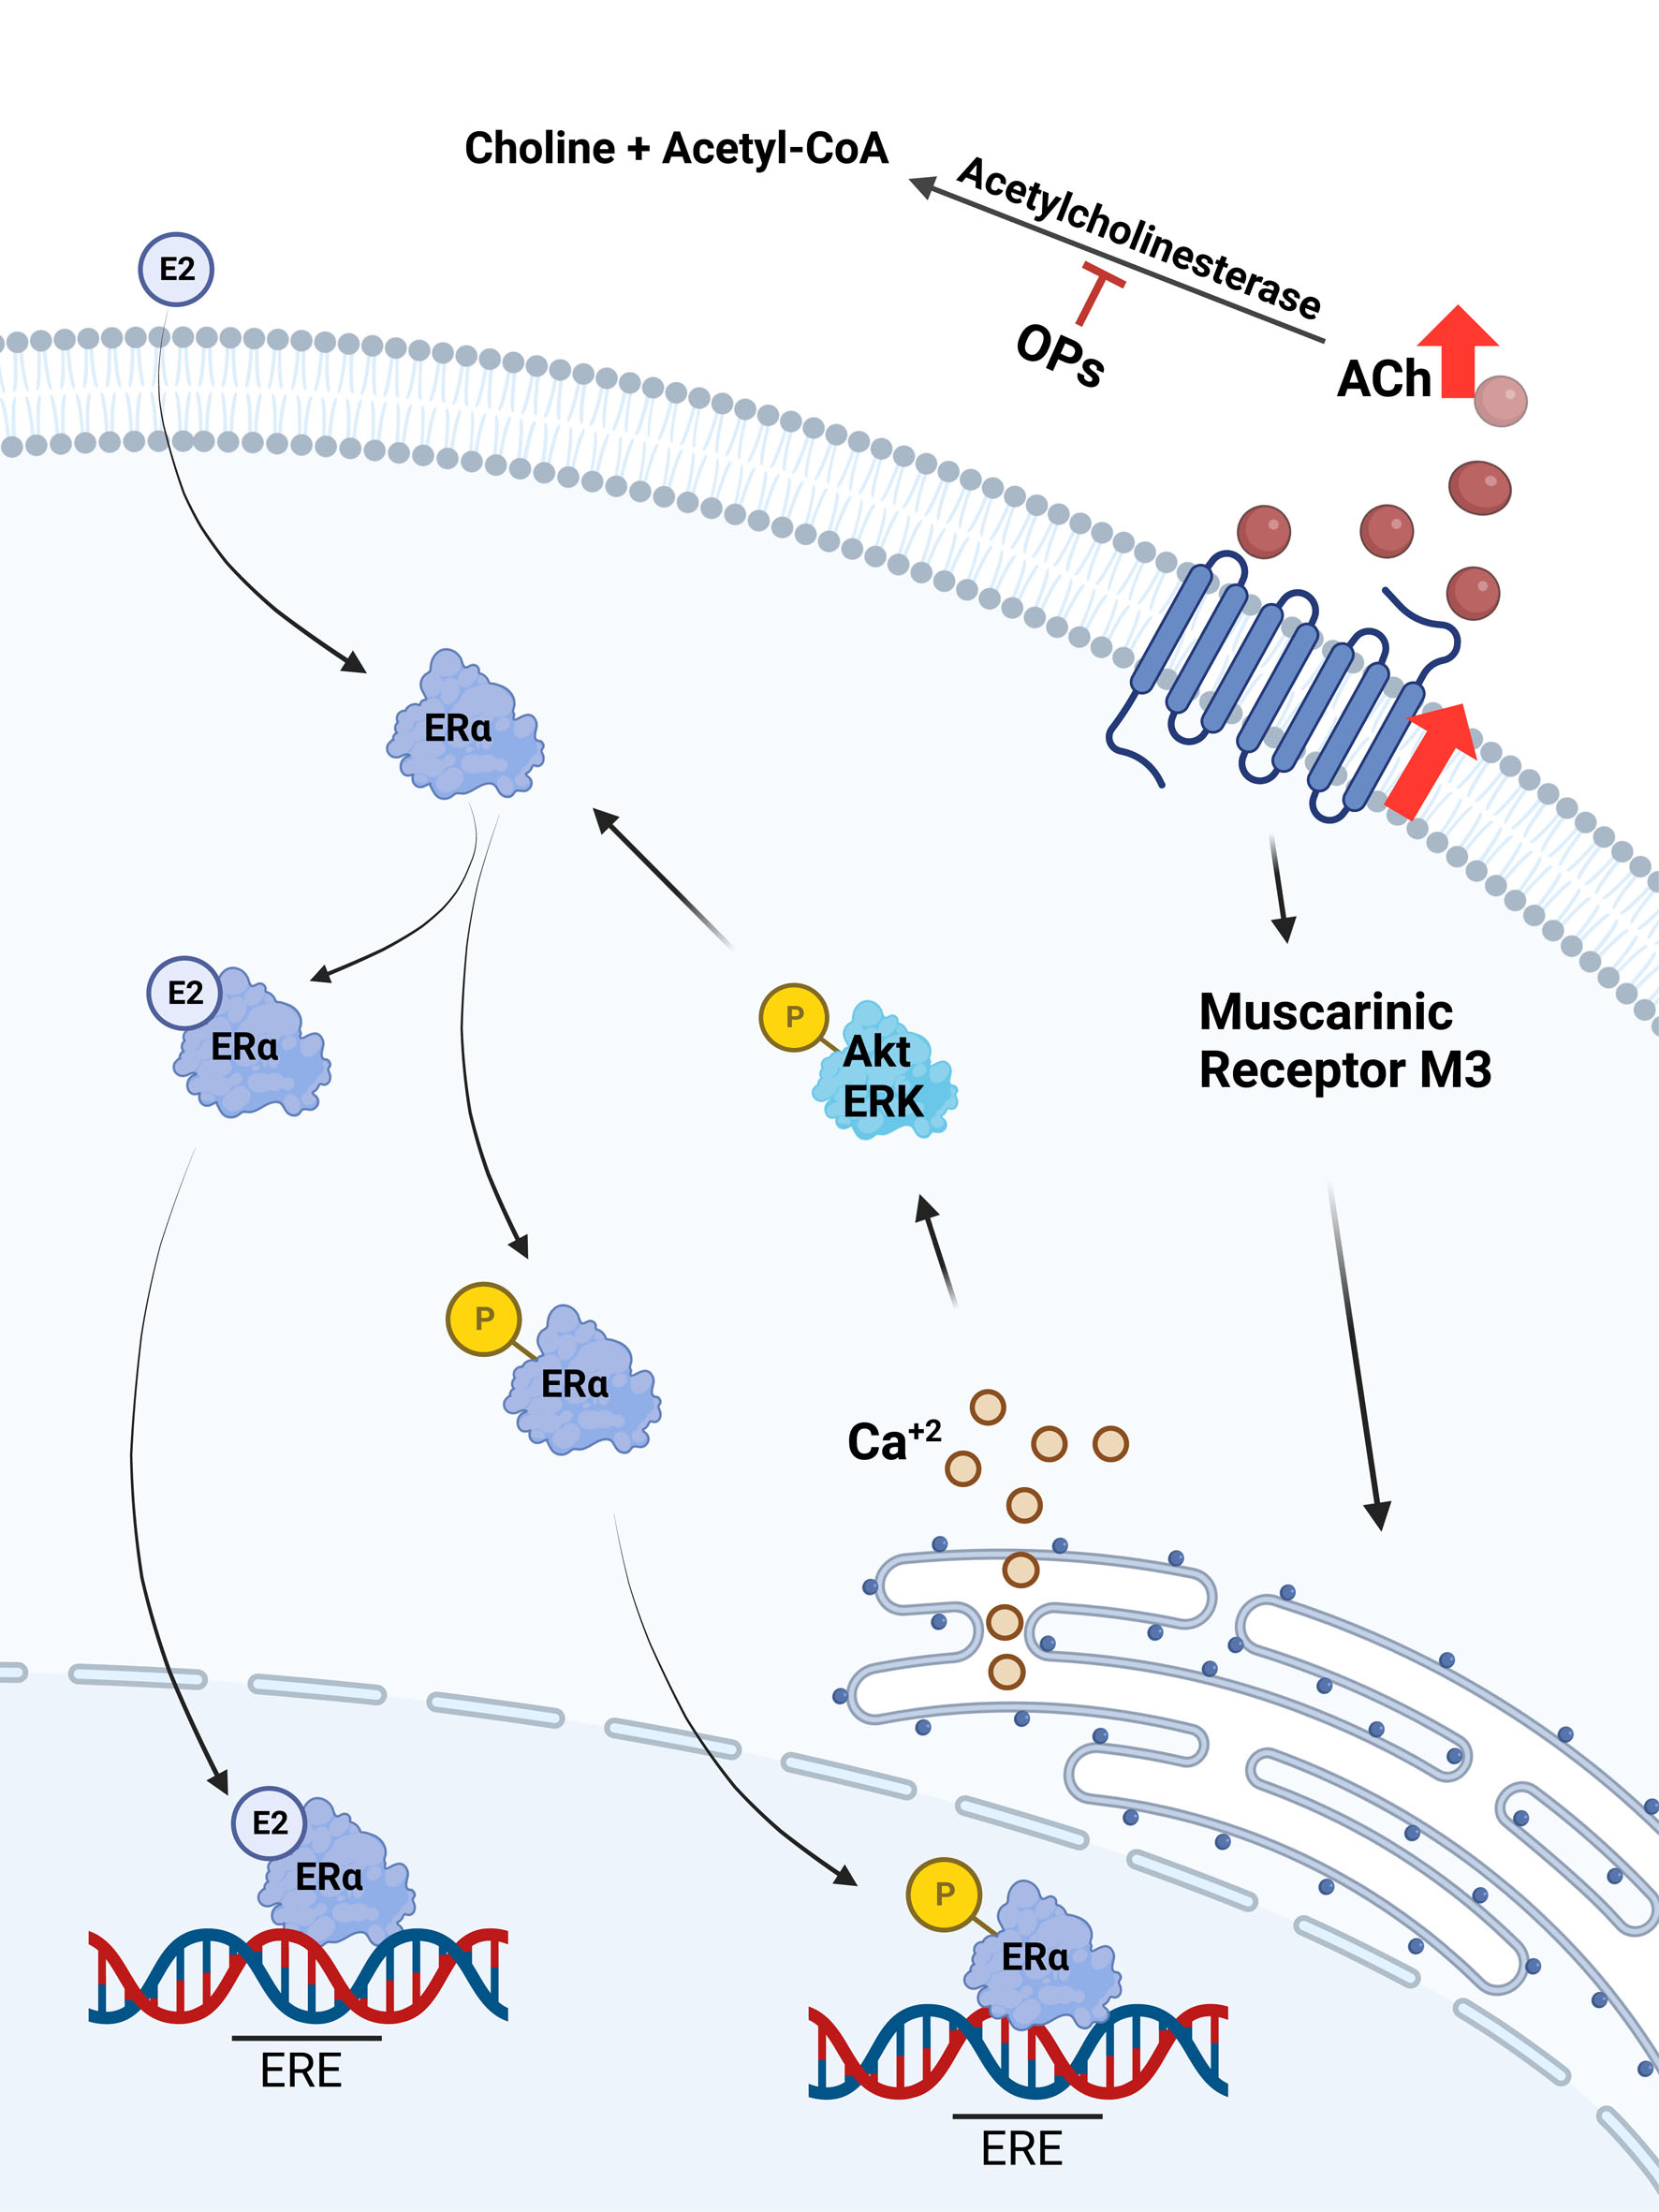
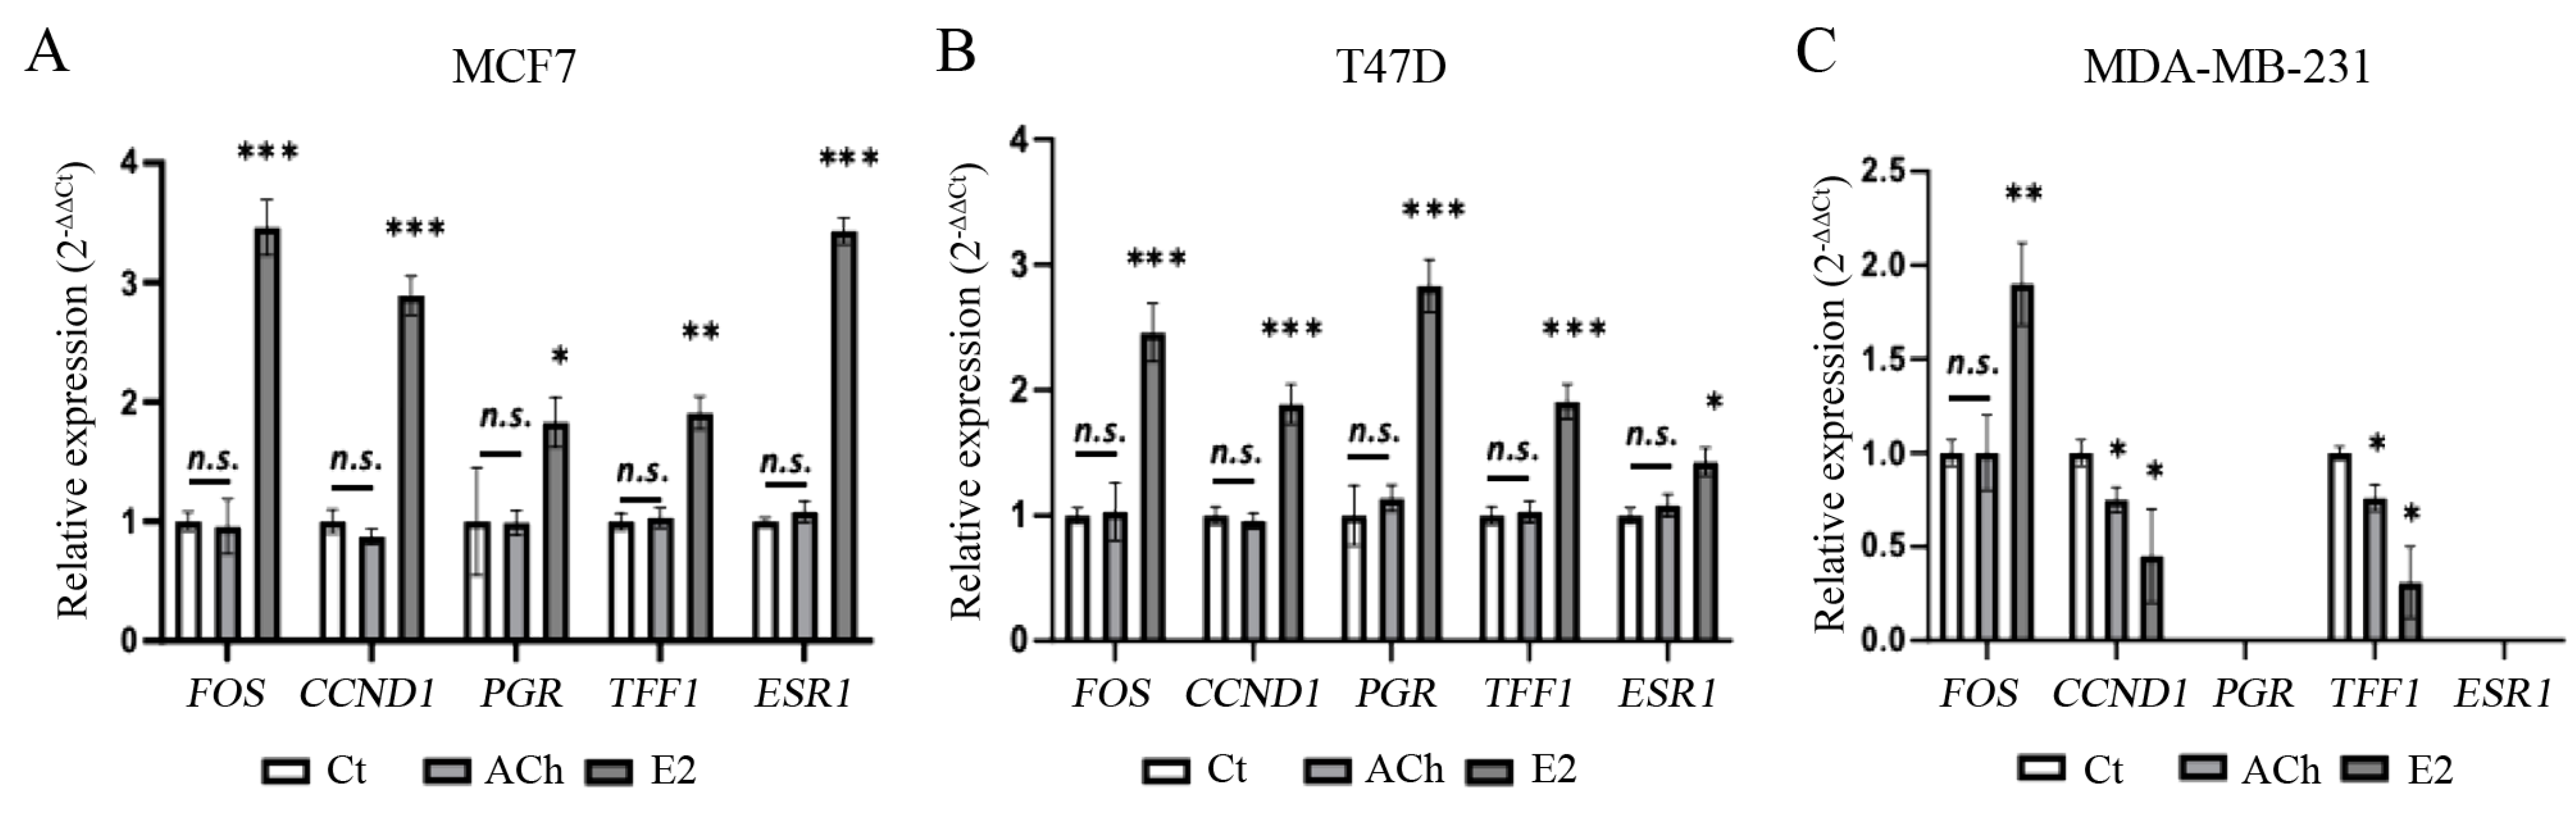
3.5. Acetylcholine and Estrogen Induction of ERα Phosphorylation and Nuclear Recruitment in MCF7 Cell Line
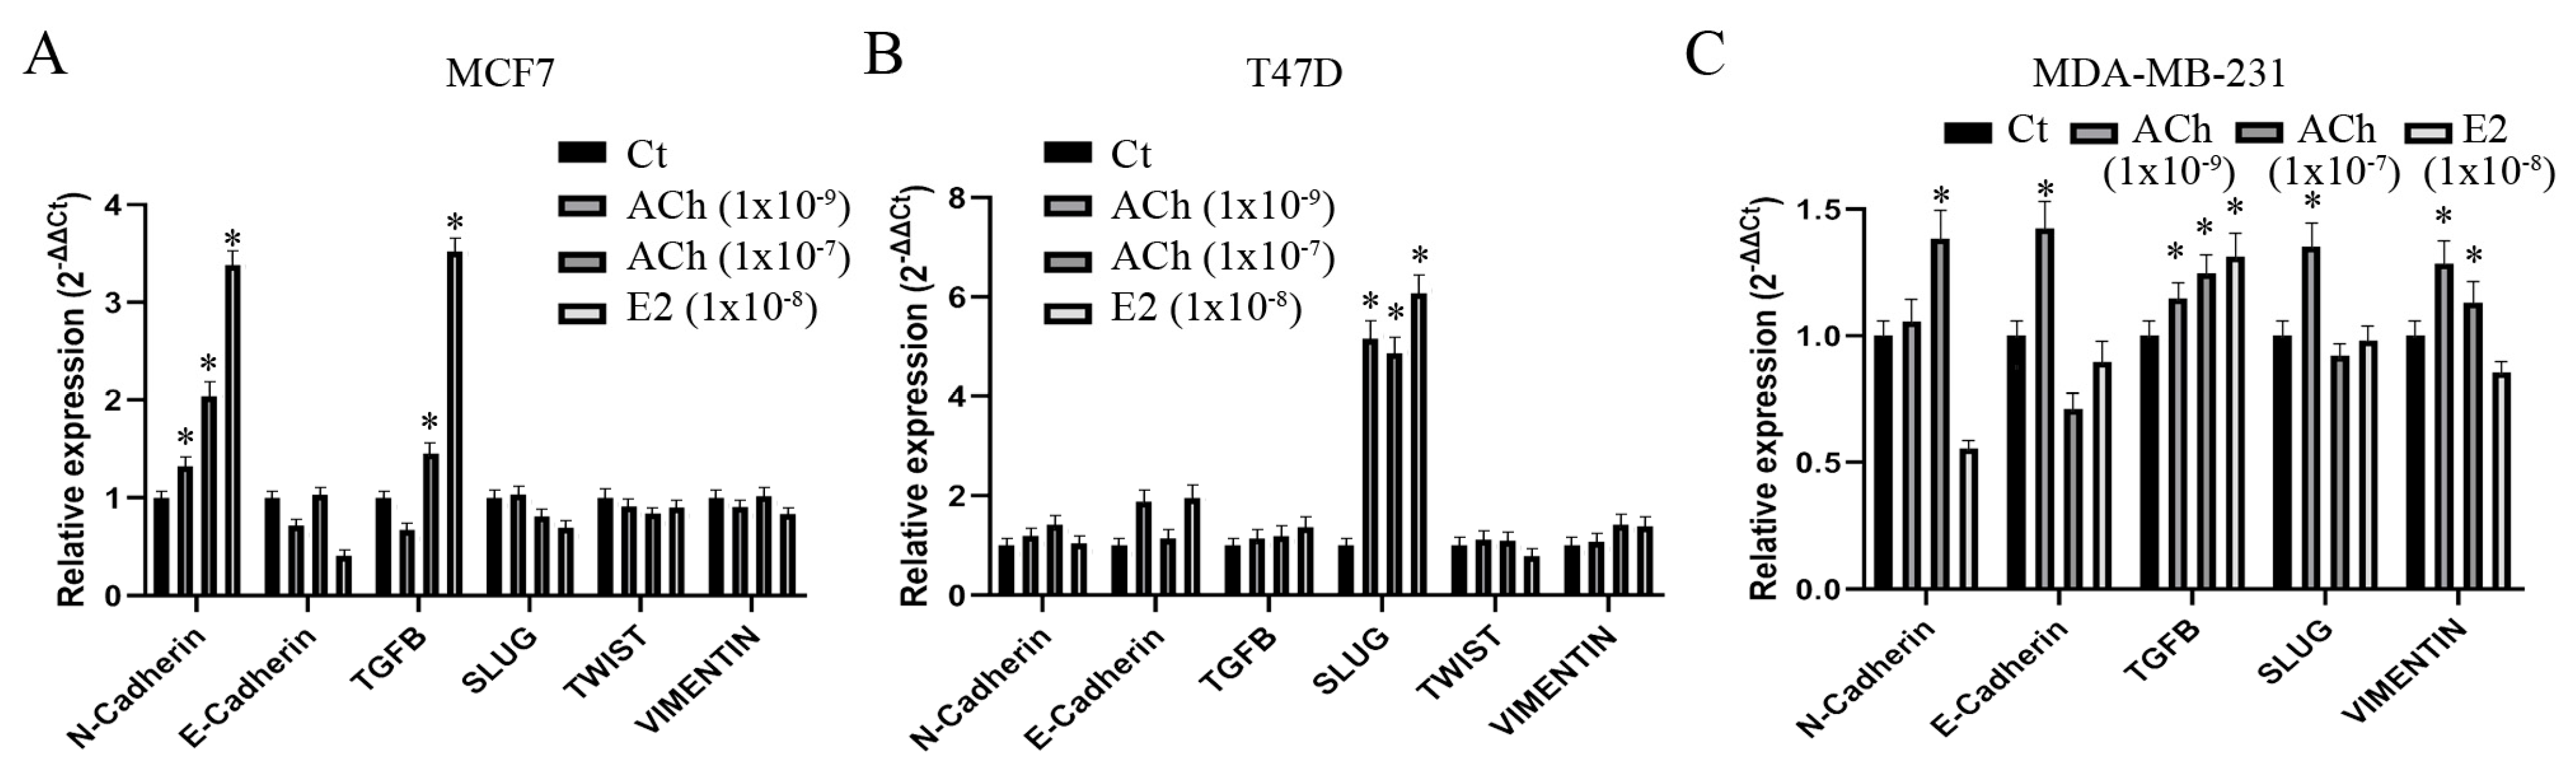
3.6. Acetylcholine and Estrogen on Epithelial–Mesenchymal Transition Gene Expression in Breast Cell Lines
4. Discussion
5. Conclusions
Supplementary Materials
Author Contributions
Funding
Institutional Review Board Statement
Informed Consent Statement
Data Availability Statement
Acknowledgments
Conflicts of Interest
References
- Siegel, R.L.; Miller, K.D.; Fuchs, H.E.; Jemal, A. Cancer statistics, 2022. CA A Cancer J. Clin. 2022, 72, 7–33. [Google Scholar] [CrossRef] [PubMed]
- Sung, H.; Ferlay, J.; Siegel, R.L.; Laversanne, M.; Soerjomataram, I.; Jemal, A.; Bray, F. Global Cancer Statistics 2020: GLOBOCAN Estimates of Incidence and Mortality Worldwide for 36 Cancers in 185 Countries. CA A Cancer J. Clin. 2021, 71, 209–249. [Google Scholar] [CrossRef] [PubMed]
- Tang, P.; Tse, G.M. Immunohistochemical Surrogates for Molecular Classification of Breast Carcinoma: A 2015 Update. Arch. Pathol. Lab. Med. 2016, 140, 806–814. [Google Scholar] [CrossRef] [PubMed]
- Johnson, K.S.; Conant, E.F.; Soo, M.S. Molecular Subtypes of Breast Cancer: A Review for Breast Radiologists. J. Breast Imaging 2020, 3, 12–24. [Google Scholar] [CrossRef]
- Lumachi, F.; Santeufemia, D.A.; Basso, S.M. Current medical treatment of estrogen receptor-positive breast cancer. World J. Biol. Chem. 2015, 6, 231–239. [Google Scholar] [CrossRef] [PubMed]
- Waks, A.G.; Winer, E.P. Breast Cancer Treatment: A Review. JAMA 2019, 321, 288–300. [Google Scholar] [CrossRef]
- Anbalagan, M.; Rowan, B.G. Estrogen receptor alpha phosphorylation and its functional impact in human breast cancer. Mol. Cell. Endocrinol. 2015, 418 Pt 3, 264–272. [Google Scholar] [CrossRef]
- Yasar, P.; Ayaz, G.; User, S.D.; Gupur, G.; Muyan, M. Molecular mechanism of estrogen-estrogen receptor signaling. Reprod. Med. Biol. 2017, 16, 4–20. [Google Scholar] [CrossRef]
- VanHook, A.M. Ligand-Independent ER Activation. Sci. Signal. 2010, 3, ec112. [Google Scholar] [CrossRef]
- Rudel, R.A.; Fenton, S.E.; Ackerman, J.M.; Euling, S.Y.; Makris, S.L. Environmental exposures and mammary gland development: State of the science, public health implications, and research recommendations. Environ. Health Perspect. 2011, 119, 1053–1061. [Google Scholar] [CrossRef]
- Cabello, G.; Valenzuela, M.; Vilaxa, A.; Duran, V.; Rudolph, I.; Hrepic, N.; Calaf, G. A rat mammary tumor model induced by the organophosphorous pesticides parathion and malathion, possibly through acetylcholinesterase inhibition. Environ. Health Perspect. 2001, 109, 471–479. [Google Scholar] [CrossRef] [PubMed]
- Calaf, G.M. Breast carcinogenesis induced by organophosphorous pesticides. Adv. Pharmacol. 2023, 96, 71–117. [Google Scholar] [CrossRef] [PubMed]
- Calaf, G.M. Role of organophosphorous pesticides and acetylcholine in breast carcinogenesis. Semin. Cancer Biol. 2021, 76, 206–217. [Google Scholar] [CrossRef] [PubMed]
- Calaf, G.M.; Echiburu-Chau, C.; Roy, D. Organophosphorous pesticides and estrogen induce transformation of breast cells affecting p53 and c-Ha-ras genes. Int. J. Oncol. 2009, 35, 1061–1068. [Google Scholar] [CrossRef] [PubMed]
- Bayer, G.; Wense, T. Über den Nachweis von Hormonen in einzelligen Tieren. Pflüger’s Arch. Gesamte Physiol. Menschen Tiere 1936, 237, 651–654. [Google Scholar] [CrossRef]
- Wessler, I.; Kirkpatrick, C.J.; Racke, K. Non-neuronal acetylcholine, a locally acting molecule, widely distributed in biological systems: Expression and function in humans. Pharmacol. Ther. 1998, 77, 59–79. [Google Scholar] [CrossRef]
- Spindel, E.R. Muscarinic receptor agonists and antagonists: Effects on cancer. In Handbook of Experimental Pharmacology; Springer: Berlin/Heidelberg, Germany, 2012; pp. 451–468. [Google Scholar] [CrossRef]
- Pettersson, A.; Nilsson, L.; Nylund, G.; Khorram-Manesh, A.; Nordgren, S.; Delbro, D.S. Is acetylcholine an autocrine/paracrine growth factor via the nicotinic alpha7-receptor subtype in the human colon cancer cell line HT-29? Eur. J. Pharmacol. 2009, 609, 27–33. [Google Scholar] [CrossRef]
- Spindel, E.R. Cholinergic Targets in Lung Cancer. Curr. Pharm. Des. 2016, 22, 2152–2159. [Google Scholar] [CrossRef]
- Cheng, K.; Samimi, R.; Xie, G.; Shant, J.; Drachenberg, C.; Wade, M.; Davis, R.J.; Nomikos, G.; Raufman, J.P. Acetylcholine release by human colon cancer cells mediates autocrine stimulation of cell proliferation. Am. J. Physiol. Gastrointest. Liver Physiol. 2008, 295, G591–G597. [Google Scholar] [CrossRef]
- Xu, R.; Shang, C.; Zhao, J.; Han, Y.; Liu, J.; Chen, K.; Shi, W. Activation of M3 muscarinic receptor by acetylcholine promotes non-small cell lung cancer cell proliferation and invasion via EGFR/PI3K/AKT pathway. Tumour Biol. J. Int. Soc. Oncodev. Biol. Med. 2015, 36, 4091–4100. [Google Scholar] [CrossRef]
- Yu, H.; Xia, H.; Tang, Q.; Xu, H.; Wei, G.; Chen, Y.; Dai, X.; Gong, Q.; Bi, F. Acetylcholine acts through M3 muscarinic receptor to activate the EGFR signaling and promotes gastric cancer cell proliferation. Sci. Rep. 2017, 7, 40802. [Google Scholar] [CrossRef]
- Eglen, R.M. Muscarinic receptor subtypes in neuronal and non-neuronal cholinergic function. Auton. Autacoid. Pharmacol. 2006, 26, 219–233. [Google Scholar] [CrossRef] [PubMed]
- Abrams, P.; Andersson, K.E.; Buccafusco, J.J.; Chapple, C.; de Groat, W.C.; Fryer, A.D.; Kay, G.; Laties, A.; Nathanson, N.M.; Pasricha, P.J.; et al. Muscarinic receptors: Their distribution and function in body systems, and the implications for treating overactive bladder. Br. J. Pharmacol. 2006, 148, 565–578. [Google Scholar] [CrossRef] [PubMed]
- Santiago, L.J.; Abrol, R. Understanding G Protein Selectivity of Muscarinic Acetylcholine Receptors Using Computational Methods. Int. J. Mol. Sci. 2019, 20, 5290. [Google Scholar] [CrossRef] [PubMed]
- Mehedinteanu, A.M.; Mirea, C.S.; Stovicek, P.O.; Schenker, M.; Stancu, M.I.; Ciurea, A.M.; Streba, L.; Istrate-Ofiteru, A.M.; Sas, T.N.; Vere, C.C. Expression of M3 muscarinic acetylcholine receptors in gastric cancer. Rom. J. Morphol. Embryol. 2021, 62, 1001–1010. [Google Scholar] [CrossRef]
- Lin, G.; Sun, L.; Wang, R.; Guo, Y.; Xie, C. Overexpression of muscarinic receptor 3 promotes metastasis and predicts poor prognosis in non-small-cell lung cancer. J. Thorac. Oncol. Off. Publ. Int. Assoc. Study Lung Cancer 2014, 9, 170–178. [Google Scholar] [CrossRef] [PubMed]
- Larabee, S.M.; Cheng, K.; Raufman, J.P.; Hu, S. Muscarinic receptor activation in colon cancer selectively augments pro-proliferative microRNA-21, microRNA-221 and microRNA-222 expression. PLoS ONE 2022, 17, e0269618. [Google Scholar] [CrossRef]
- Lombardi, M.G.; Negroni, M.P.; Pelegrina, L.T.; Castro, M.E.; Fiszman, G.L.; Azar, M.E.; Morgado, C.C.; Sales, M.E. Autoantibodies against muscarinic receptors in breast cancer: Their role in tumor angiogenesis. PLoS ONE 2013, 8, e57572. [Google Scholar] [CrossRef]
- Parnell, E.A.; Calleja-Macias, I.E.; Kalantari, M.; Grando, S.A.; Bernard, H.U. Muscarinic cholinergic signaling in cervical cancer cells affects cell motility via ERK1/2 signaling. Life Sci. 2012, 91, 1093–1098. [Google Scholar] [CrossRef]
- Cheng, K.; Shang, A.C.; Drachenberg, C.B.; Zhan, M.; Raufman, J.P. Differential expression of M3 muscarinic receptors in progressive colon neoplasia and metastasis. Oncotarget 2017, 8, 21106–21114. [Google Scholar] [CrossRef]
- Kuol, N.; Davidson, M.; Karakkat, J.; Filippone, R.T.; Veale, M.; Luwor, R.; Fraser, S.; Apostolopoulos, V.; Nurgali, K. Blocking Muscarinic Receptor 3 Attenuates Tumor Growth and Decreases Immunosuppressive and Cholinergic Markers in an Orthotopic Mouse Model of Colorectal Cancer. Int. J. Mol. Sci. 2022, 24, 596. [Google Scholar] [CrossRef] [PubMed]
- Espanol, A.J.; Salem, A.; Di Bari, M.; Cristofaro, I.; Sanchez, Y.; Tata, A.M.; Sales, M.E. The metronomic combination of paclitaxel with cholinergic agonists inhibits triple negative breast tumor progression. Participation of M2 receptor subtype. PLoS ONE 2020, 15, e0226450. [Google Scholar] [CrossRef] [PubMed]
- Jimenez, E.; Montiel, M. Activation of MAP kinase by muscarinic cholinergic receptors induces cell proliferation and protein synthesis in human breast cancer cells. J. Cell. Physiol. 2005, 204, 678–686. [Google Scholar] [CrossRef] [PubMed]
- Fiszman, G.L.; Middonno, M.C.; de la Torre, E.; Farina, M.; Espanol, A.J.; Sales, M.E. Activation of muscarinic cholinergic receptors induces MCF-7 cells proliferation and angiogenesis by stimulating nitric oxide synthase activity. Cancer Biol. Ther. 2007, 6, 1106–1113. [Google Scholar] [CrossRef] [PubMed]
- Ahmed, E.A.; Alkuwayti, M.A.; Ibrahim, H.M. Atropine Is a Suppressor of Epithelial-Mesenchymal Transition (EMT) That Reduces Stemness in Drug-Resistant Breast Cancer Cells. Int. J. Mol. Sci. 2022, 23, 9849. [Google Scholar] [CrossRef]
- Sales, M.E. Muscarinic Receptors as Targets for Metronomic Therapy in Breast Cancer. Curr. Pharm. Des. 2016, 22, 2170–2177. [Google Scholar] [CrossRef]
- Espanol, A.J.; Salem, A.; Rojo, D.; Sales, M.E. Participation of non-neuronal muscarinic receptors in the effect of carbachol with paclitaxel on human breast adenocarcinoma cells. Roles of nitric oxide synthase and arginase. Int. Immunopharmacol. 2015, 29, 87–92. [Google Scholar] [CrossRef]
- Calaf, G.M.; Crispin, L.A.; Munoz, J.P.; Aguayo, F.; Bleak, T.C. Muscarinic Receptors Associated with Cancer. Cancers 2022, 14, 2322. [Google Scholar] [CrossRef]
- Cardoso, C.C.; Ricardo, V.P.; Frussa-Filho, R.; Porto, C.S.; Abdalla, F.M. Effects of 17 beta-estradiol on expression of muscarinic acetylcholine receptor subtypes and estrogen receptor alpha in rat hippocampus. Eur. J. Pharmacol. 2010, 634, 192–200. [Google Scholar] [CrossRef]
- Long, C.Y.; Hsu, C.S.; Shao, P.L.; Liu, C.M.; Su, J.H.; Tsai, E.M. Effect of ovariectomy on the gene expression of detrusor muscarinic receptors in female rats. Fertil. Steril. 2009, 92, 1147–1149. [Google Scholar] [CrossRef]
- Rodgers, S.P.; Bohacek, J.; Daniel, J.M. Transient estradiol exposure during middle age in ovariectomized rats exerts lasting effects on cognitive function and the hippocampus. Endocrinology 2010, 151, 1194–1203. [Google Scholar] [CrossRef] [PubMed]
- Matucci, R.; Bianchi, B.; Mantelli, L.; Ghelardini, C.; Vannelli, G.B.; Maggi, M. Influence of oestrogens on muscarinic receptor density and contractile response in the guinea-pig uterus. J. Reprod. Fertil. 1996, 107, 153–160. [Google Scholar] [CrossRef] [PubMed]
- Abdalla, F.M.; Marostica, E.; Picarelli, Z.P.; Abreu, L.C.; Avellar, M.C.; Porto, C.S. Effect of estrogen on muscarinic acetylcholine receptor expression in rat myometrium. Mol. Cell. Endocrinol. 2004, 213, 139–148. [Google Scholar] [CrossRef]
- Munoz, J.P.; Araya-Osorio, R.; Mera-Adasme, R.; Calaf, G.M. Glyphosate mimics 17beta-estradiol effects promoting estrogen receptor alpha activity in breast cancer cells. Chemosphere 2023, 313, 137201. [Google Scholar] [CrossRef] [PubMed]
- Livak, K.J.; Schmittgen, T.D. Analysis of relative gene expression data using real-time quantitative PCR and the 2(-Delta Delta C(T)) Method. Methods 2001, 25, 402–408. [Google Scholar] [CrossRef] [PubMed]
- Calaf, G.M.; Roy, D.; Hei, T.K. Immunochemical analysis of protein expression in breast epithelial cells transformed by estrogens and high linear energy transfer (LET) radiation. Histochem. Cell Biol. 2005, 124, 261–274. [Google Scholar] [CrossRef]
- Gee, K.R.; Brown, K.A.; Chen, W.N.; Bishop-Stewart, J.; Gray, D.; Johnson, I. Chemical and physiological characterization of fluo-4 Ca2+-indicator dyes. Cell Calcium 2000, 27, 97–106. [Google Scholar] [CrossRef]
- Volpicelli, L.A.; Levey, A.I. Muscarinic acetylcholine receptor subtypes in cerebral cortex and hippocampus. Prog. Brain Res. 2004, 145, 59–66. [Google Scholar] [CrossRef]
- Gomez, A.; Martos, F.; Bellido, I.; Marquez, E.; Garcia, A.J.; Pavia, J.; Sanchez de la Cuesta, F. Muscarinic receptor subtypes in human and rat colon smooth muscle. Biochem. Pharmacol. 1992, 43, 2413–2419. [Google Scholar] [CrossRef]
- Uchiyama, T.; Chess-Williams, R. Muscarinic receptor subtypes of the bladder and gastrointestinal tract. J. Smooth Muscle Res. 2004, 40, 237–247. [Google Scholar] [CrossRef]
- Hegde, S.S.; Eglen, R.M. Muscarinic receptor subtypes modulating smooth muscle contractility in the urinary bladder. Life Sci. 1999, 64, 419–428. [Google Scholar] [CrossRef] [PubMed]
- Wang, Z.; Shi, H.; Wang, H. Functional M3 muscarinic acetylcholine receptors in mammalian hearts. Br. J. Pharmacol. 2004, 142, 395–408. [Google Scholar] [CrossRef] [PubMed]
- Minette, P.A.; Barnes, P.J. Muscarinic receptor subtypes in lung. Clinical implications. Am. Rev. Respir. Dis. 1990, 141, S162–S165. [Google Scholar] [CrossRef] [PubMed]
- Nietgen, G.W.; Schmidt, J.; Hesse, L.; Honemann, C.W.; Durieux, M.E. Muscarinic receptor functioning and distribution in the eye: Molecular basis and implications for clinical diagnosis and therapy. Eye 1999, 13 Pt 3a, 285–300. [Google Scholar] [CrossRef] [PubMed]
- Walch, L.; Brink, C.; Norel, X. The muscarinic receptor subtypes in human blood vessels. Therapie 2001, 56, 223–226. [Google Scholar]
- Español, A.J.; Sales, M.E. Different muscarinc receptors are involved in the proliferation of murine mammary adenocarcinoma cell lines. Int. J. Mol. Med. 2004, 13, 311–317. [Google Scholar] [CrossRef]
- Hösli, E.; Hösli, L. Cellular localization of estrogen receptors on neurones in various regions of cultured rat CNS: Coexistence with cholinergic and galanin receptors. Int. J. Dev. Neurosci. 1999, 17, 317–330. [Google Scholar] [CrossRef]
- Cardoso, C.C.; Pereira, R.T.; Koyama, C.A.; Porto, C.S.; Abdalla, F.M. Effects of estrogen on muscarinic acetylcholine receptors in the rat hippocampus. Neuroendocrinology 2004, 80, 379–386. [Google Scholar] [CrossRef]
- Liu, H.M.; Ma, L.L.; Li, C.; Cao, B.; Jiang, Y.; Han, L.; Xu, R.; Lin, J.; Zhang, D. The molecular mechanism of chronic stress affecting the occurrence and development of breast cancer and potential drug therapy. Transl. Oncol. 2022, 15, 101281. [Google Scholar] [CrossRef]
- Bennesch, M.A.; Picard, D. Minireview: Tipping the balance: Ligand-independent activation of steroid receptors. Mol. Endocrinol. 2015, 29, 349–363. [Google Scholar] [CrossRef]
- Fuentes, N.; Silveyra, P. Estrogen receptor signaling mechanisms. Adv. Protein Chem. Struct. Biol. 2019, 116, 135–170. [Google Scholar] [CrossRef] [PubMed]


| Gene Name | Primer Sequence a |
|---|---|
| CCND1 | F: AATGACCCCGCACGATTTCA R: TGAGGCGGTAGTAGGACAGG |
| E-Cadherin | F: AGTGGGCACAGATGGTGTGA R: TAGGTGGAGTCCCAGGCGTA |
| ESR1 | F: TGATTGGTCTCGTCTGGCG R: CATGCCCTCTACACATTTTCCC |
| FOS | F: AAGGAGAATCCGAAGGGAAAGG R: GGCAATCTCGGTCTGCAAAG |
| N-Cadherin | F: TCG ATT GGT TTG ACC ACG G R: GAC GGT TCG CCA TCC AGA C |
| PGR | F: AGGTCTACCCGCCCTATCTC R: AGTAGTTGTGCTGCCCTTCC |
| SLUG | F: GACCCTGGTTGCTTCAAGGA R: TGTTGCAGTGAGGGCAAGAA |
| TFF1 | F: TTCTATCCTAATACCATCGACG R: TTTGAGTAGTCAAAGTCAGAGC |
| TWIST | F: TCCGCGTCCCACTAGCA R: AGTTATCCAGCTCCAGAGTCTCTAGAC |
| VIMENTIN | F: TGTCCAAATCGATGTGGATGTTTC R: TTGTACCATTCTTCTGCCTCCTG |
| ß-actin | F: TGCCGACAGGATGCAGAAG R: GCCGATCCACACGGAGTACT |
Disclaimer/Publisher’s Note: The statements, opinions and data contained in all publications are solely those of the individual author(s) and contributor(s) and not of MDPI and/or the editor(s). MDPI and/or the editor(s) disclaim responsibility for any injury to people or property resulting from any ideas, methods, instructions or products referred to in the content. |
© 2023 by the authors. Licensee MDPI, Basel, Switzerland. This article is an open access article distributed under the terms and conditions of the Creative Commons Attribution (CC BY) license (https://creativecommons.org/licenses/by/4.0/).
Share and Cite
Muñoz, J.P.; Calaf, G.M. Acetylcholine, Another Factor in Breast Cancer. Biology 2023, 12, 1418. https://doi.org/10.3390/biology12111418
Muñoz JP, Calaf GM. Acetylcholine, Another Factor in Breast Cancer. Biology. 2023; 12(11):1418. https://doi.org/10.3390/biology12111418
Chicago/Turabian StyleMuñoz, Juan P., and Gloria M. Calaf. 2023. "Acetylcholine, Another Factor in Breast Cancer" Biology 12, no. 11: 1418. https://doi.org/10.3390/biology12111418
APA StyleMuñoz, J. P., & Calaf, G. M. (2023). Acetylcholine, Another Factor in Breast Cancer. Biology, 12(11), 1418. https://doi.org/10.3390/biology12111418