Article

The Ecological-Health Risks of Potentially Toxic Metals in the Surface Sediments and Leaves of Salt-Secreting Avicennia officinalis as Potential Phytoremediators: A Field-Based Biomonitoring Study from Klang Mangrove Area

by
Chee Kong Yap
1,* and
Khalid Awadh Al-Mutairi
2
1
Department of Biology, Faculty of Science, Universiti Putra Malaysia, Serdang 43400, Malaysia
2
Department of Biology, Faculty of Science, University of Tabuk, Tabuk P.O. Box 741, Saudi Arabia
*
Author to whom correspondence should be addressed.
Biology 2023, 12(1), 43; https://doi.org/10.3390/biology12010043
Submission received: 26 November 2022 / Revised: 21 December 2022 / Accepted: 23 December 2022 / Published: 26 December 2022
(This article belongs to the Section Conservation Biology and Biodiversity)

Abstract

:

Simple Summary

This study evaluated the capacity for the phytoremediation of mangrove Avicennia, sampled from the Klang mangrove ecosystem, and analysed the ecological-health concerns of potentially toxic metals in the surface sediments. All of the hazard index values of the surface sediments for Cu, Ni, Pb, and Zn, based on a combination of three pathways, indicated 1.00, suggesting that the four metals are not carcinogenic. The lamina has more potential as a phytoremediator of vital Cu, Zn, and Fe, according to the bio-concentration factor values. As a phytoremediator of non-essential Pb and Ni, midrib plus petiole has greater potential. The data presented in this study can be used to monitor and provide ecological-health hazards of potentially toxic metals in the Klang mangrove ecosystem to lessen the threats to the ecosystem. Using the current findings to manage the Klang mangrove ecosystem, a water-energy-food framework can be proposed.

Abstract

This study aimed to evaluate the ecological-health risks of potentially toxic metals in the surface sediments on the Klang mangrove ecosystem and assessed the phytoremediation potential of Avicennia officinalis collected from the area. The results showed that the concentrations (mg/kg dry weight) of Cu, Ni, Pb and Zn in the surface sediments ranged between 5.30–63.8, 14.2–32.7, 30.3–62.3, and 46.4–269, respectively. The ecological risk values of the surface sediments indicated that Ni, Pb and Zn were all classified as ‘low potential ecological risk’, while the Cu ecological risk ranged between ‘low potential ecological risk’ and ‘considerable potential ecological risk’. For the health risks on the sediments, all of the values of hazard index for Cu, Ni, Pb and Zn, based on a combination of three pathways, indicated < 1.00, showing that the four metals are non-carcinogenic. Based on the bioconcentration factor values, it can be concluded that the lamina has better potential as a phytoremediator of essential Cu, Zn and Fe. In contrast, midrib plus petiole has better potential as a phytoremediator of non-essential Pb and Ni. To mitigate the threats to the Klang mangrove ecosystem, the information offered in the present study can be employed in the monitoring and provision of the ecological-health risks of potentially toxic metals in the Klang mangrove ecosystem. Hence, the present findings can be employed for developing a water-energy-food framework for managing the Klang mangrove ecosystem.

1. Introduction

Mangrove ecosystems are significant intertidal estuarine wetlands along tropical and subtropical coasts [1,2,3]. Mangroves are a form of woody plant community and are regarded as distinct halophytes, which are an uncommon variety of evergreen trees [4]. The mangrove plants are precious to marine species as habitats, food sources, and refuges. However, the mangrove ecosystem may suffer due to anthropogenic pressure caused by population expansion. Potentially toxic metals (PTM)s are one of the factors causing a considerable detrimental effect on the ecological quality of mangroves [5,6,7]. At present, PTM contamination brought on by human activity linked to growing urbanisation and industrialisation poses a severe threat to these intertidal communities [8]. The destruction of mangroves has been linked to increased PTM concentrations in surface sediments from mangrove wetlands worldwide [9]. This destruction is usually caused by agro-based industries, industrial effluents, sewage treatment plants’ agricultural runoff, and leaching from residential rubbish dumps [4,5,7,10,11].
The mangrove ecosystem contributes to the sequestration of carbon and the prevention of coastal erosion and provides suitable feeding grounds for migratory birds. The mangrove sediment plays a significant role in limiting the movement of PTMs in estuarine ecosystems [12]. This causes the mangrove forests operate as a natural filter of wastewater from the land, helping to keep marine ecosystems in good health [13,14]. The Avicennia species are thought to have accumulative qualities to several PTMs and more robust tolerance [11,14,15]. Due to these distinguishing characteristics, those concerned with issues pertaining to conservation have recently begun to pay more attention to the contamination of mangrove ecosystems [16,17]. As a result, developing or enhancing conservation tactics for mangrove ecosystems is now a priority [18].
In Malaysia, Avicennia officinalis (Family: Avicenniaceae) is an intertidal open coast-riverine mangrove [19]. It starts flowering in January, with a decreasing population trend and is under the ‘Least concern’ conservation status [20]. The mobility of Na+ ions is higher in salt-secreting species (such as Avicennia spp.), and their concentrations in xylem sap are roughly one-tenth that of saltwater, with salt glands lowering the overall concentration of Na in leaves [21]. In addition to the processes that control Na influx/transport, mangroves likely achieve metal influx and transport regulation by many other routes.
According to Omar and Misman [22], mangrove areas in Peninsular Malaysia have been documented as 116,746, 114,353, and 110,953 ha in the years 1990, 2000 and 2017, respectively. The mangrove area in Selangor for 2017 has been estimated as 20,853 ha [22]. Therefore, there is little doubt that the KME is expected to decline in area size and quality due to many developmental activities [23].
The introduction of many contaminants, including PTMs, into the Klang mangrove ecosystem (KME) may be justified due to the effects of industrial activities and the expansion of human settlement [24]. Human activities such as logging, fisheries and tourism are among the culprits of environmental degradation in KME [17,25]. Being a highly urbanised area, the KME is also close to the busiest maritime centre in Selangor [26,27].
Although there have been some studies on the assessment of PTM levels in KME [18,28,29,30,31,32], there is little information on the ecological-health risk assessment of PTM contamination in mangrove environments or on the capacity of mangroves to accumulate and translocate PTMs within their various compartments at KME.
There have been no reported studies on the PTM in the surface sediments collected in 2007 in the KME in the literature. The present PTM data, based on the 2007 samples, are important for conducting a baseline comparison before any rehabilitation project to clean the river has been conducted after 2007. However, there is a strong possibility that the KME could be polluted to an even higher rate due to human expansion and industrialization [17,25]. Therefore, the 2007 data on KME could lead to more comprehensive environmental management in order to understand the condition of its ecosystem in 2007 and to provide the data for future monitoring. Thus, the objectives of this study were to: (1) evaluate the ecological-health risks of PTMs in the surface sediments on the KME; and (2) assess the phytoremediation potential of PTMs in A. officinalis collected from the KME.

2. Materials and Methods

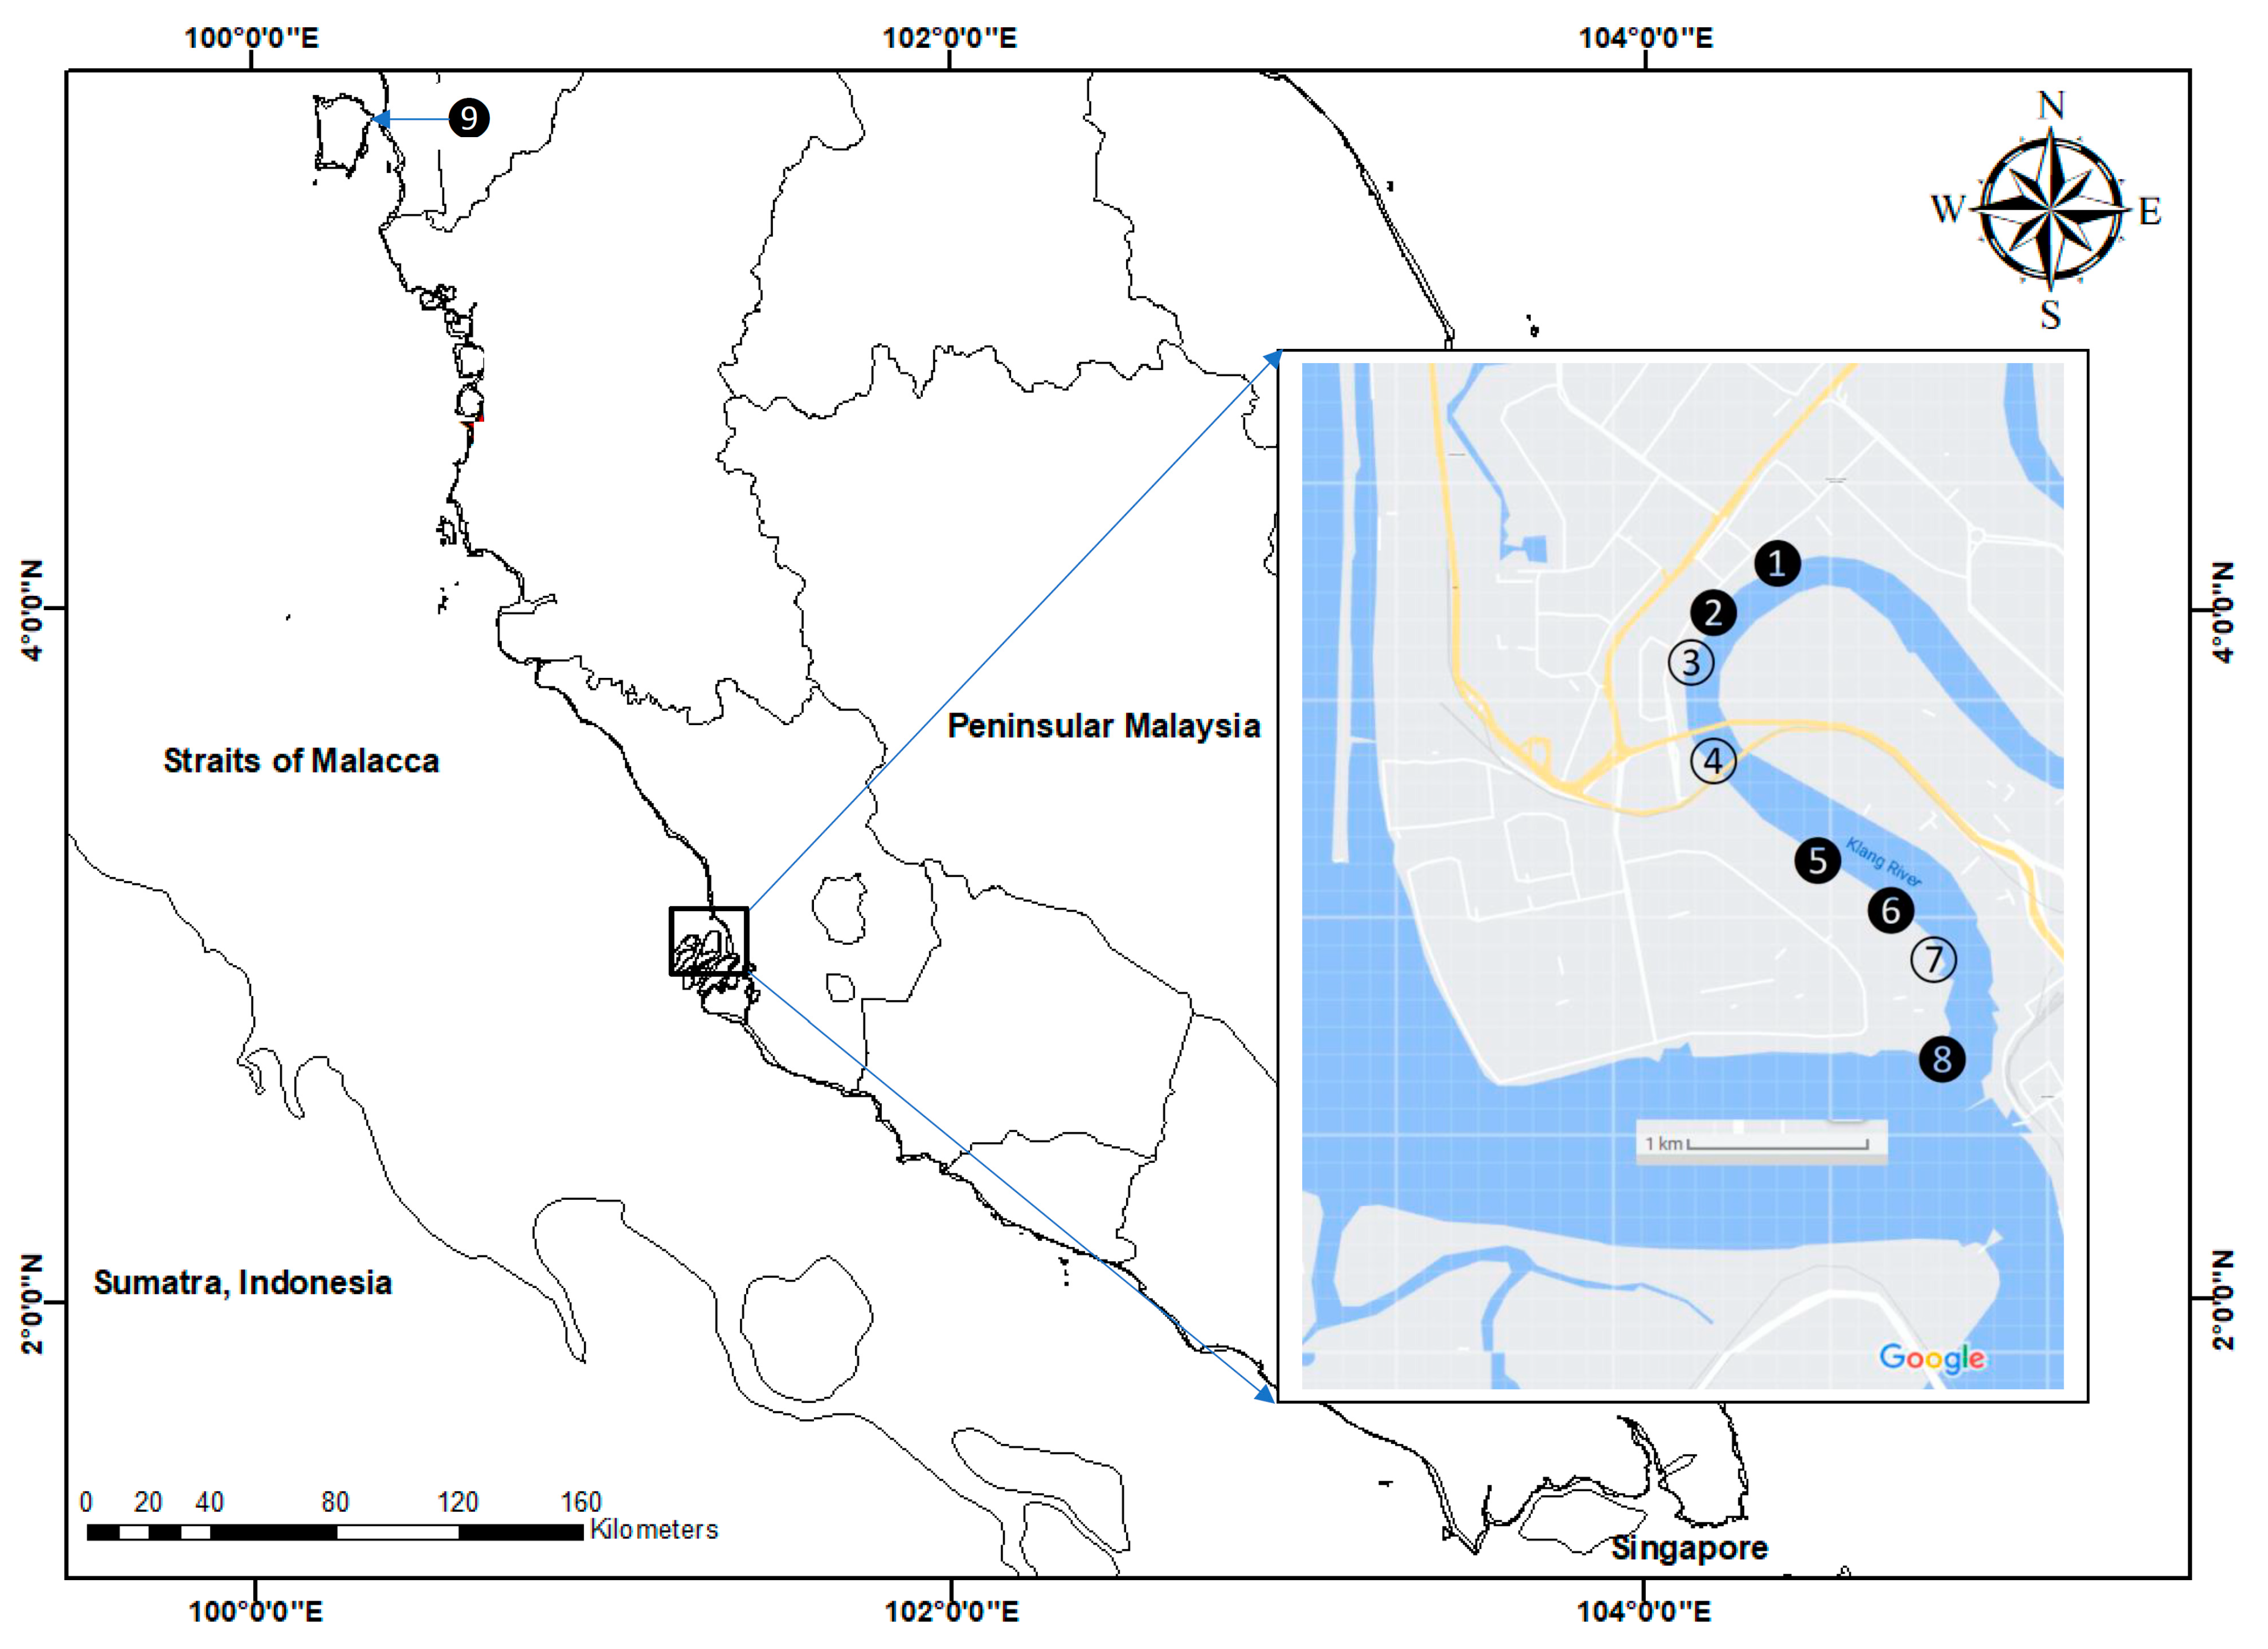
2.1. Sampling Site Descriptions

The sediment samplings were conducted in the estuary section of the Klang River with the mangrove ecosystem (S1–S8) on 2 December 2007, while sediment samplings from the site at Juru mangrove (S9) were collected on 8 December 2007, as can be seen in Figure 1 (Table S1). The sampling site at Juru (S9) was selected because it was the previously reported known polluted site [33]. Hence, it is important for reference purposes. In all of the sampling sites (S1–S9), three subsamples of surface sediments in the mangrove area were collected using a clean plastic scoop. However, the leaves of mangrove Avicennia were hand-collected at 6 sites (S1, S2, S5, S6, S8 and S9) (Figure 1). At every sampling site, 20 old leaves from three different trees of Avicennia were collected. Upon collection, the samples were transferred to the laboratory in zipped-lock polyethylene bags.
All of the samples were brought to the laboratory and oven-dried at 80 °C for 72 h to constant dry weight. All of the dried sediments were passed through a 63 µm sieve. The leaves samples were separated into the lamina and the midrib plus petiole (MP). The dried leaves were ground to homogenize using a pestle and mortar.

2.2. Metal Analysis

For the oven-dried plant samples, 5 mL of concentrated nitric acid (HNO3, AnalaR grade, BDH 69%) was added to the samples [34]. For the oven-dried sediments, each sample was digested using a combination of concentrated nitric acid (HNO3, AnalaR grade, BDH 69%) and perchloric acid (HClO4, AnalaR grade, BDH 60%) in the ratio 4:1 (10 mL) [35,36,37]. The digestion tubes with samples were put into a digestion block at 40 °C for 1 h, and then at 140 °C for 3 h [35,36,37]. They were then diluted to 40 mL with double de-ionised water. Later, the diluted samples were filtered through Whatman No. 1 (filter speed: medium) filter paper into acid-washed pillboxes until metal determination.
The sediment samples were fractionated into four fractions, namely: (i) ‘Easily, freely, leachable, or exchangeable’ (F1); (ii) ‘Acid-reducible’ (F2), (iii) ‘Oxidisable-organic’ (F3); and (iv) ‘Resistant’ (F4), according to Badri and Aston [38]. The total concentrations are the summation (SUM) of all the above four geochemical fractions.
All of the samples were analysed for Zn, Ni, Fe, Pb and Cu using an air-acetylene flame atomic absorption spectrophotometer (FAAS, Perkin Elmer Model AAnalyst 800; Perkin Elmer LLC, CT, USA). Standard solutions were prepared from the stock solution provided by MERCK Titrisol for the five metals, and the data were presented on an mg/kg dry weight basis.
For quality control and quality assurance, all glassware and non-metal apparatuses used in this study were soaked in an acid bath (5% HNO3) for 72 h after being washed with laboratory-grade detergent (Decon 90) to avoid possible contamination. The apparatuses were washed and soaked in laboratory-grade detergent (Decon 90) for at least 3 h before the analysis. Procedural blanks were employed, and the quality control samples were made by diluting the standard solutions of the metals to be tested. These standard solutions were analysed after every 5–10 samples to check the accuracy of the analysed samples.
Four types of Certified Reference Materials (CRMs) were checked with the samples to ensure the accuracy of the FAAS measurements. These CRMs included Dogfish Liver-DOLT-3 (National Research Council Canada), Lagarosiphon major (NR.60), and NSC DC 73,319 (soil), and marine sediments-(MESS-3, National Research Council Canada, Beaufort Sea), Their recoveries were mostly acceptable (between 70–120%) (Table S2). The detection limits for Fe, Cu, Ni, Pb, and Zn were 0.010, 0.010, 0.010, 0.009, and 0.007 mg/L, respectively.

2.3. Ecological Risk Assessments

2.3.1. Geoaccumulation Index

The geoaccumulation index (Igeo) was used to determine the degree of metal pollution in the area. The calculation of Igeo was based on Equation (1) [39].
I geo = log 2 Sample 1.5 × Background
where ample is the concentration measured; the background is the background concentrations in the present study, based on the concentrations (mg/kg dry weight (dw)): 9.48, 3.55, 7.31, and 13.16 for Pb [40], Cu [41], Ni [42], and Zn [43], respectively, based on the intertidal area of Peninsular Malaysia (Table S3).
The value (1.5) is the correction factor to mitigate the lithogenic effluents. There are six established classifications of pollution that are well described by Muller [39].

2.3.2. Ecological Risk Index

Firstly, the contamination factor (CF) calculation was based on the pollution of a single metal factor in Equation (2).
CF = C s C B
where Cs is the concentration of PTM in the surface sediments; CB is the background values based on the intertidal area of Peninsular Malaysia, as mentioned above.
Later, the ecological risk (ER), the potential ER of a single element, was calculated based on Equation (3).
ER = T R × Cf
where TR is the toxic response factor of a single element. The TR values used in the present study are Cu = 5.00, Ni = 5.00, Pb = 5.00, and Zn = 1.00 [44]. CF is the contamination factor calculated, as described in Equation (1). There are 5 classifications of ER based on Hakanson [44].

2.4. Human Health Risk Assessment

The human health risk assessment (HHRA) of the surface sediments is calculated to determine the non-carcinogenic risk (NCR) to humans by using exposure pathways through inhalation, ingestion, and dermal contact. The estimation of the HHRA followed the public-domain guidelines in the Exposure Factors Handbook of the US Environmental Protection Agency [45,46,47,48]. The average daily doses (ADDs) (mg/kg day) of PTMs through inhalation (ADDinh), ingestion (ADDing), and dermal contact (ADDder) for both children and adults were calculated by using Equations (4)–(6), as follows:
ADD inh = C sediment ( InghR   × EF   × ED PEF   ×   BW   ×   AT )  
ADD ing = C sediment ( IngR   × EF   × ED BW   ×   AT ) × 10
ADD der = C sediment ( SA   × AF   ×   ABS   × EF   × ED BW   ×   AT ) × 10
where ADDinh, ADDing, and ADDder are the daily amounts of exposure to metals (mg/kg day) through inhalation, ingestion, and dermal contact, respectively. The definition, reference values, and exposure factors employed to estimate the intake values and health risks of PTMs in sediments are given in Table S4.
In this study, the NCR of PTMs was assessed through the hazard quotient (HQ) and hazard index (HI), as used in the literature [49,50]. The HQ is the proportion of the ADD of a metal to its reference dose (RfD) for similar exposure pathway(s) [35,48]. The RfD (mg/kg day) values of all metals used in the present study are given in Table S4.
The NCR is assessed by HI, which is the summation of the HQs in the three exposure pathways [51,52,53,54]. The HI was calculated according to Equation (7).
HI = HQ i = ( ADD i RfD i )

2.5. Calculation of Bioconcentration Factor

The plant’s capacity to absorb and tolerate PTMs was calculated using the bioconcentration factor (BCF). This indicator is frequently used to assess whether plants would make effective phytoremediators [55,56]. The plant’s capacity to bioaccumulate metals from sediments is assessed using BCF, in which the metal concentrations in the sediments are represented by F1, F2, F3, F4, and SUM, while the metal concentrations in the mangrove leaves are MP or lamina. Therefore, in the present study, five BCF values are used, as defined in the following Equations (8)–(12):
BCF 1 = Plant Sediment F 1
BCF 2 = Plant Sediment F 2
BCF 3 = Plant Sediment F 3
BCF 4 = Plant Sediment F 4
BCF 5 = Plant Sediment SUM

2.6. Statistical Analysis

The graphical histograms and overall statistics of the present data were obtained using Kaleida Graphs, version 5.0 (1986–2022 by Synergy Software, Eden Prairie, MN, USA). Although there are alternative methods for confirming normality, the Shapiro-Wilk test was chosen because it is the most popular and extensively used method and has a higher sensitivity to detect non-normality when the sample size is small (N < 50) [57,58,59].
All of the data were determined to have significant values for the Shapiro-Wilk Test <0.05, according to the Shapiro-Wilk normality test, suggesting that the data deviated considerably from a normal distribution. Prior to conducting multiple linear (forward) stepwise regression analysis (MLSRA) and cluster analysis, they were converted using the log10[value + 1] formula (CA). This log10-transformation was used to stabilise the variance and the lack of normality to produce a frequency distribution that was more akin to a normal distribution and to satisfy the need of normality for the regression model [60,61]. The MLSRA and CA were performed using STATISTICA (Version 10; StatSoft. Inc., Tulsa, OK, USA, 1984–2011). This has been shown by many studies on relationships between a dependent variable and independent variables [62,63,64,65,66].
For CA, the clustering patterns of the eight sampling sites of Cu, Ni, Pb and Zn in the sediments based on Igeo, CF, and ER, and the geochemical fractions of the sediments (F1, F2, F3, F4 and SUM) were performed.
For the MLSRA based on the sediments, the HI and ER acted as the dependent variables, while the pathways of HQing, HQinh, and HQder, and the ecological indexes (Igeo, CF, and ER) and geochemical fractions (F1, F2, F3, F4, SUM) of the sediments acted as the independent variables. For the MLSRA based on the Avicennia leaves, the lamina and MP acted as the dependent variables, while BCF1, BCF2, BCF3, BCF4, BCF5, and the sedimentary geochemical fractions (F1, F1, F3, F4 and SUM) acted as the independent variables.

3. Results

3.1. Ecological-Health Risk Assessments of Surface Sediments

3.1.1. Total Concentrations of PTM and Ecological Risks Indices

The mean concentrations of Cu, Ni, Pb and Zn in the surface sediments of the mangrove ecosystem in the Klang River estuary and a site in the Juru estuary are presented in Figure 2, while the overall statistics are presented in Table 1, and their geochemical fractions are given in Table S5.
The total Zn concentrations in the surface sediments ranged between 46.4 and 269 mg/kg dry weight. In comparison to the SGQ values (Table S3), all of the maximum Zn levels at Juru were below those by Long et al. [67] for ERM, Macdonald et al. [68] for PEL, and Chapman et al. [69] for ISQV-high, but higher than those of Long et al. [67] for ERL, Macdonald et al. [68] for TEL, and Chapman et al. [69] for ISQV-low. However, all of the sites of KME recorded values below the SGV values. When compared these results to the reference background values (Table S3), the maximum Zn level at the Juru site recorded higher values than those of all of the SGQ values, including the background value of Zn from the west coast of Peninsular Malaysia (WCPM) [43] and the mangrove sediment from the WCPM [34]. However, the sites from the Klang mangrove generally recorded values lower than, or equal to, those of all the reference background values.
The total Fe concentrations in the surface sediments ranged between 22,121 and 27,906 mg/kg dry weight. When comparing to the SGQ values (Table S3), the Fe ranges were within the only UCC level reported by Wedepohl [70].
The total Pb concentrations in the surface sediments ranged between 30.3 and 62.2 mg/kg dry weight. In comparison to the SGQ values (Table S3), all of the maximum Pb levels at Juru were higher than those by Long et al. [67] for ERL, and Macdonald et al. [68] for TEL, but lower than those of Long et al. [67] for ERM, Macdonald et al. [68] for PEL, and Chapman et al. [69] for both ISQV-low and ISQV-high. However, all of the sites of KME recorded values below the Pb SGV values. When compared to the reference background values (Table S3), the maximum Zn level at the Juru site recorded values higher than those of the pre-industrial reference level by Hakanson [44], but higher than all of the SGQ values, including the background value of Zn from the WCPM [40] and within those of the mangrove sediment from the WCPM [34]. However, the sites from KME generally recorded lower or within those of all of the reference background values of Pb.
The total Cu concentrations in the surface sediments ranged between 5.29 and 63.8 mg/kg dry weight. In comparison to the SGQ values (Table S3), all of the maximum Cu levels at Juru ere higher those by Long et al. [67] for ERL, and Macdonald et al. [68] for PEL, and Chapman et al. [69] for both ISQV-low and ISQV-high. However, all of the sites of KME recorded values below the Cu SGV values. When compared to the reference background values (Table S3), the maximum Cu level at the Juru site recorded values higher than the SGQ values, including the background value of Cu from the WCPM [41] and the mangrove sediment from the WCPM [34]. However, the sites from KME generally recorded lower or within the Cu reference background values (Table S3).
The total Ni concentrations in the surface sediments ranged between 14.2 and 32.7 mg/kg dry weight. In comparison to the SGQ values (Table S3), all of the maximum Ni levels at Juru were higher than those by Long et al. [67] for ERL, and Macdonald et al. [68] for TEL, but lower than those by Chapman et al. [69] for ISQV-low, Long et al. [67] for ERM, and Macdonald et al. [68] for PEL. However, all of the sites of KME recorded values below or within the Ni SGV values. When compared to the reference background values (Table S3), the maximum Ni level at the Juru site recorded values higher than those of UCC by Wedepohl [70], the background value of Ni from the WCPM [42] and the mangrove sediment from the WCPM [34]. However, the sites from KME generally recorded values lower or within those of all the Ni reference background values (Table S3).
The overall values of Igeo, CF, and ER for Cu, Ni, Pb and Zn, in the surface sediments from the Klang River estuary and the site in the Juru estuary, based on the background levels of the metals as reference a metal or normalizer that were reported from Peninsular Malaysia, are presented in Table 2 (Table S6), and the mean values are presented in Figure 2.
The Igeo values of Cu, Ni, Pb and Zn ranged between −0.01 and 3.58, 0.36 and 1.60, 0.05 to 1.09, and 1.23 and 3.77, respectively (Table 2). This indicated that the classifications of Cu and Zn ranged between ‘practically unpolluted’ (<0)’ and ‘strongly polluted’ (3–4), while Ni and Fe are classified between ‘unpolluted’ (0–1), and ‘moderately polluted’ (1–2), based on Muller [39].
The CF values of Cu, Ni, Pb and Zn ranged between 1.49 and 18.0, 1.93 and 4.54, 1.55 and 3.20, and 3.53 and 20.5, respectively (Table 2). The ER values of Cu, Ni, Pb and Zn ranged between 7.45 and 89.9, 9.64 and 22.7, 7.77 and 16.0, and 3.53 and 20.5, respectively (Table 2). The ER values indicate that Ni, Pb and Zn were classified as ‘low potential ecological risk’ (ER < 40)’, while Cu ranged between ‘low potential ecological risk’ (ER < 40)’ and ‘considerable potential ecological risk’ (80 ≤ ER < 160)’, according to Hakanson [44].
The clustering patterns of the nine sampling sites of Cu, Ni, Pb and Zn in the sediments based on Igeo, CF, and ER, and the geochemical fractions of the sediments, are given in Figure 3. It was found that S8 was clustered as a single major entity from the other subclusters for Cu, Pb and Zn due to the levels of the three metals being significantly lower than the other eight sites. However, the significantly higher levels of Ni in S9 resulted in S8 being clustered as a major entity. Although the highest levels of Cu and Zn were found in S9, this site was not significantly higher than the other sites.
The outputs of the multiple stepwise regression analytical outputs, based on ER as a dependent variable and independent variables, are the hazard quotient pathways and geochemical fractions of the sediments, and are presented in Table 3. CF and HI-A were selected as the influential factors for the Cu ER. Three variables (CF, HQder-C and F2) were selected as the influential factors for the Pb ER. Five variables (F1, F2, F3, F4 and SUM) were selected as the influential factors for the Zn ER. CF and HQing-C were selected as the influential factors for the Ni ER (Table 3).

3.1.2. Health Risk Assessments of Surface Sediments

The values of HQ and HI in the three exposure routes of Ni in the Klang River estuary and the site in the Juru estuary are presented in Table S7, while their overall values are given in Table 4 The Ni HI values for children and adults are 9.16 × 10⁻³ to 2.16 × 10⁻² and 1.77 × 10⁻³ to 4.18 × 10⁻³, respectively. All of these HI values indicated < 1.00, showing non-carcinogenic risks of Ni.
The values of HQ and HI in the three exposure routes of Cu in the Klang River estuary and the site in the Juru estuary are presented in Table S8, while their overall values are given in Table 5. The Cu HI values for children and adults are 1.74 × 10⁻³ to 2.10 × 10⁻² and 2.56 × 10⁻⁴ to 3.09 × 10⁻³, respectively. All of these HI values indicated < 1.00, showing non-carcinogenic risks of Cu.
The values of HQ and HI in the three exposure routes of Pb in the Klang River estuary and the site in the Juru estuary are presented in Table S9, while their overall values are given in Table 6. The Pb HI values for children and adults are 1.13 × 10⁻¹ to 2.33 × 10⁻¹ and 1.81 × 10⁻² to 3.73 × 10⁻², respectively. All of these HI values indicated < 1.00, showing non-carcinogenic risks of Pb.
The values of HQ and HI in the three exposure routes of Zn in the Klang River estuary and the site in the Juru estuary are presented in Table S10, while their overall values are given in Table 7. The Zn HI values for children and adults are 2.04 × 10⁻³ to 1.19 × 10⁻² and 3.14 × 10⁻⁴ to 1.82 × 10⁻³, respectively. All of these HI values indicated < 1.00, showing non-carcinogenic risks of Zn.
The outputs of the MLSRA outputs based on HI as the dependent variable and independent variables are the hazard quotient pathways and geochemical fractions of the sediments; these are also presented in Table 3. For Cu, two (HQing-C and F2) and three (HQinh-A, Igeo and CF) variables were selected as influential factors in the HI-C and Hl-A, respectively. For Pb, seven (HQing-C, SUM, F1, F3, F2, Igeo and F4) and three (HQing-A, ER and F1) variables were selected as influential factors in the HI-C and Hl-A, respectively. For Zn, four (HQing-C, F4, F1 and Igeo) and two (HQinh-A and F1) variables were selected as influential factors in the HI-C and Hl-A, respectively. For Ni, two variables (HQder-C and Igeo) and HQder-A were selected as influential factors in the HI-C and Hl-A, respectively.

3.2. Phytoextraction Potentials of Mangrove Leaves

3.2.1. Zinc

The Zn levels (mg/kg dry weight) in the MP and lamina are 16.4–36.2 and 17.6–41.1, respectively (Table 8; Table S11). The mean Zn values indicated that the Zn lamina (26.9) is significantly (p < 0.05) higher than that (22.9) in the MP.
The overall mean values in the MP for BCF1, BCF2, BCF3, BCF4, and BCF5 are 1.10, 0.68, 0.53, 0.43, and 0.15, respectively (Table 8; Table S11). These BCF values are lower than those in lamina, in which their values of BCF1, BCF2, BCF3, BCF4, and BCF5 are 1.37, 0.82, 0.62, 0.51, and 0.18, respectively. This indicated that lamina has a better potential as a phytoremediator of Zn.
The outputs of the MLSRA outputs based on lamina and MP as dependent variables and independent variables are the bioconcentration factors and sedimentary geochemical fractions, as presented in Table 9. For Zn, BCF4 and F1 were similarly selected as influential parameters for the Zn accumulation of both lamina and MP. However, there are four variables (F4, BCF5, BCF1 and BCF2) were selected for lamina only, while only F3 was selected for MP.

3.2.2. Iron

The Fe levels (mg/kg dry weight) in MP and lamina are 45.8–193, and 92.9–244, respectively (Table 10; Table S11). The mean Fe values indicated that the Fe lamina (166) is significantly (p < 0.05) higher than that (117) in MP.
The overall mean values in the MP for BCF1, BCF2, BCF3, BCF4, and BCF5 are 0.463, 0.117, 0.050, 0.005, and 0.004, respectively (Table 10; Table S11). These BCF values are lower than those in lamina, in which their values of BCF1, BCF2, BCF3, BCF4, and BCF5 are 0.647, 0.163, 0.073, 0.007, and 0.006, respectively. This indicated that lamina has a better potential as a phytoremediator of Fe.
For Fe, it was found that BCF5 and F4 are selected as the influential variables for the Fe accumulation of both lamina and MP. However, only BCF2 was selected for lamina while F2, BCF4 and SUMM were selected for MP.

3.2.3. Lead

The Pb levels (mg/kg dry weight) in MP and lamina are 6.17–23.7, and 3.39–20.6, respectively (Table 11; Table S11). The mean Pb values indicated that the Pb lamina (10.9) is lower than that (11.92) in MP.
The overall mean values in the MP for BCF1, BCF2, BCF3, BCF4, and BCF5 are 12.8, 15.8, 0.62, 1.26, and 0.32, respectively (Table 11; Table S11). These BCF values are comparable to those in lamina, in which their values of BCF1, BCF2, BCF3, BCF4, and BCF5 are 11.4, 13.5, 0.58, 1.61, and 0.32, respectively.
For Pb, six variables (BCF3, F3, F1, BCF5, BCF1 and SUM) were similarly selected as influential parameters for the Pb accumulation of both lamina and MP. However, only BCF4 and F4 were selected for lamina, while F2 and BCF2 were selected for MP.

3.2.4. Copper

The Cu levels (mg/kg dry weight) in MP and lamina are 3.77–11.6, and 5.56–11.9, respectively (Table 12; Table S11). The mean Cu values indicated that the Cu lamina (7.76) is significantly (p < 0.05) higher than that (6.88) in MP.
The overall mean values in the MP for BCF1, BCF2, BCF3, BCF4, and BCF5 are 7.33, 317, 63.4, 0.26, and 0.21, respectively (Table 12; Table S11). These BCF values are lower than those in lamina, in which their values of BCF1, BCF2, BCF3, BCF4, and BCF5 are 10.1, 381, 125, 0.35, and 0.30, respectively. This indicated that lamina has a better potential as a phytoremediator of Cu.
For Cu, three variables (F1, BCF1 and F3) were similarly selected as influential parameters for the Cu accumulation of both lamina and MP. However, only F4 was selected for lamina, while four variables (BCF4, BCF2, BCF5 and F2) were selected only for MP.

3.2.5. Nickel

The Ni levels (mg/kg dry weight) in MP and lamina are 0.21–4.09, and 0.13–2.86, respectively (Table 13; Table S11). The mean Ni values indicated that the Ni lamina (1.74) is significantly (p < 0.05) lower than that (2.07) in MP.
The mean values in the MP for BCF1, BCF2, BCF3, BCF4, and BCF5 are 3.59, 1.70, 0.32, 0.25, and 0.13, respectively (Table 13; Table S11). These BCF values are higher than those in lamina, in which the values of BCF1, BCF2, BCF3, BCF4, and BCF5 are 2.84, 1.41, 0.27, 0.21, and 0.10, respectively. This indicated that MP has a better potential as a phytoremediator of Ni.
For Ni, three variables (BCF3, BCF1 and BCF4) were similarly selected as influential parameters for the Ni accumulation of both lamina and MP. However, four variables (BCF5, BCF2, F2, and F1) were selected for lamina only, while F3, F4 and SUM were selected only for MP.

4. Discussion

4.1. Mangrove Leaves of Avicennia Officinalis Have Low Metal Concentrations

The low level of detected metal accumulation in the mangrove leaves could be explained by a variety of different mechanisms, as indicated in the differences in the influential parameters selected for the accumulation of metals between lamina and MP. In estuarine environments, the initial bioavailability of sediment metals is frequently poor. Metals frequently precipitate as insoluble sulphides in sediments because sediments are typically anoxic, waterlogged, and have a low pH [71]. Metals may be integrated into the lattice structure of clay, adsorbed on the ion exchange sites of fine silts and/or clays, or adsorbed inside iron and manganese colloidal oxide complexes [72]. Detritus-rich sediments’ high organic content promotes complexation with refractory organics, which significantly lowers metal availability [73]. High salinity also promotes the development of metal-chloride complexes, which are less bioavailable for absorption than free metals [74].
Processes in the root’s rhizosphere are among the physiological systems that may be of the cause of the variation in the uptake and translocation at the root level. The absence of these adaptations in some species and the adaption of aerial root structures in others, such as pneumatophores with lenticels for gaseous exchange, may account for the small-scale variations in uptake within families and genera. Higher concentrations of some trace metals in the exchangeable form may come from an oxidised rhizosphere’s ability to diminish the stability of iron plaques and reduce complexing sulphides in anoxic soil environments [75,76]. In fact, trends toward increased root BCFs appear to be specific to species that have pneumatophores of Avicennia.
The present survey’s findings of the restricted translocation of Cu, Zn, and particularly Pb between species and the accumulation of Cu, Pb, and Zn by roots (root BCFs 1) are consistent with the patterns of accumulation and distribution discovered in A. marina’s laboratory experiments. Cu, Pb, and Zn were discovered in A. marina roots at quantities equivalent to the sediment loadings reported by MacFarlane and Burchett [15,77]. The metals could be primarily concentrated in cell walls, such as apoplastic transport implicated through cationic exchange with cell wall-associated carboxylic groups. The endodermis prevented the entry of Cu, Pb, and Zn into the stele, while the epidermal layers served as a barrier to reduce the transfer of Pb.
It was reported by MacFarlane and Burchett [15,77] that Pb transfer to leaves in A. marina was minimal. The Pb accumulation in the root was mainly immobile, cell wall bound, and/or sequestered in the epidermal layers. Zinc and Cu were translocated to the leaf tissue; however, the concentrations were much lower than in roots (TF < 0.1) and it is likely that they were chelated with organic acids. Despite the variations in the salt management mechanisms, these patterns of translocation do in fact largely replicate the cross-species trends. The secretion of metals does not significantly change the overall distribution patterns of metals in leaf tissue among families, or when comparing secretors to non-secretors, despite the fact that mangroves have been shown to excrete metals (Cu and Zn) in A. marina [15].
The BCF values in mangroves are relatively modest when compared to well-established hyperaccumulators, such as the fern Pteris vittata [78], which has As BCF levels greater than 100. Other hyperaccumulating terrestrial plant species, such as Thlaspi caerulescens, have leaf BCFs for Zn that are up to 40, which are lower than those for As [79]. These results are typically shown as absolute values rather than as BCF or TF. According to Brooks [55], plants that accumulate more than 500 mg/kg of copper or 10,000 mg/kg of zinc in their tissue are categorised as hyperaccumulators. Brassica juncea, a Pb hyperaccumulator, has been found to accumulate 18.8 mg/kg of Pb in its shoots [80]. Mangroves demonstrate metal uptake and translocation at rates that are significantly lower than those of established hyperaccumulators. As long-term sinks for metallic pollutants, mangroves are therefore perhaps best used in cleanup efforts as phytostabilizers [81]. Not only can mangrove sediments decrease numerous metals in anoxic sediments, limiting their bioavailability and mobility, but mangrove trees also physically stabilise the sediments, preventing the export of sedimentary metals to nearby waterways.
Based on the mangroves in Sundarban, Chakraborty et al. [56] reported the concentration (mg/kg) of Zn was 18.54–28.2 in the leaves, that of Cu was 6.76–11.9 in the leaves, and that of Pb was 3.26–4.57 in the leaves of A. officinalis in Jharkhali (India), They concluded that the mangrove leaves had the phytoremediation capacity of the PTMs. Ghosh et al. [82] found significant correlations between the antioxidative enzyme activity, photosynthetic pigments and PTM levels. This indicated the active functioning of the PTM detoxification mechanism in Avicennia officinalis. Later, Ghosh et al. [83] found that low BCF in the mangrove rhizosphere observed in the river Hooghly might be due to a barrier to hypodermal structures and/or any prevailing saturation mechanism of HMs. Kholoud et al. [84] found the metal concentrations in the leaves of A. marina at three sites along Tubli Bay were in the following order: Fe > Zn > Cu > Ni.

4.2. The Mangrove of Avicennia Officinalis to Act as a Potential Phytoremediator of Potentially Toxic Metals

There are two points to support the above statement. Firstly, the PTMs in the habitat surface sediments of A. officinalis had low ER; secondly, there are no non-carcinogenic risks of Ni, Cu, Pb and Zn in the surface sediments regarding the differences of the influential parameters selected for the PTMs’ HI values in the sediments between children and adults. In general, Cu and Cr had the greatest BCF values across all of the sites that were studied, indicating that these two metals were significantly bio-accumulated in A. marina and had higher mobility than the other metals that were also under investigation.
The low bioavailability of metals in sediments and/or preventing metal uptake by mangroves can account for the lowest BCF values found in highly metal-contaminated sediments. It has been hypothesised that by complexing with organic matter and/or precipitating sulphides under decreasing conditions, mangrove sediments can immobilise metals in inaccessible forms [73,85]. Therefore, more research is needed on speciation and the readily accessible metal components in mangrove sediments. Usman et al. [2] found that the majority of these BCF values were deemed to be excessive (>1), indicating that A. marina may be a highly effective plant for the bioaccumulation of PTMs.

4.3. The Lamina Has a Better Potential as a Phytoremediator of Essential Cu, Zn and Fe, While the Midrib plus Petiole has a Better Potential as a Phytoremediator of non-essential Pb and Ni

The essential metals (Cu and Zn; leaf BCFs of 0.47 and 0.51, respectively) demonstrated better mobility than the non-essential metals, according to a review by MacFarlane et al. [18] (Pb; leaf BCF of 0.11). Mangroves generally act as regulators of necessary metals, such as Cu and Zn, and exclude species for non-essential metals, such as Pb [86]. The results of the MLSR with all of the differences in the influential variables being selected for the accumulations of Cu, Zn, Fe, Pb and Ni clearly indicated that the phytoremediation strategies for the five metals were dissimilar.
Cu and Zn, two important elements, saw a decline in leaf BCF when the environmental concentrations rose. These patterns may indicate that plants move metal from their roots to their shoots to meet their metabolic needs at low metal concentrations, while at higher concentrations, metal translocation is controlled to prevent toxicity [86]. Regardless of environmental concentrations, non-essential elements such as Pb are not present in the leaf tissue.
Arumugam et al. [87] reported that the concentration of heavy metals in the samples of A. marina collected from the Muthupet mangrove forest had increased, particularly non-essential metals such as Cd and Pb. Compared to non-essential metals, essential elements, such as Cu and Zn, were more abundant in the sediment of the rhizosphere of A. marina. As a result, the plant was using Cu and Zn for their active metabolism. Alzahrani et al. [3] collected twenty-one sets of sediment samples and pieces of mangroves along the Red Sea coast of Saudi Arabia to evaluate the concentration PTMs and found that Cu > Ni > Pb where the metals with the highest mean concentrations in the sediments. The BCF values were > 1, indicating that A. marina can accumulate PTMs, particularly Pb. Based on A. marina L. collected from Rabigh lagoon, Aljahdali and Alhassan [9] found that all of the metals had a BCF of >1.00, and antioxidants and Pb had a positive connection. This could be due to A. marina’s capacity to exclude or detoxify Pb through its mechanism of exclusion or detoxification.
Souza et al. [88] evaluated the accumulation and translocation of metals in Avicennia schaueriana from the sediment to the roots and leaves. Plants thriving in less contaminated environments had the highest BCF values. In contrast, plants from the most polluted areas are had the highest translocation factors, showing that A. schaueriana could stand the unfavourable circumstances. In other words, when exposed to high amounts of metals in the environment, the roots’ ability to absorb metals is reduced; instead, plants appear to improve their metal translocation to lower the concentration of harmful metals in the roots. They suggested that A. marina may be categorised as a potential phytoextraction agent for Cu.
According to Usman et al. [2], the amount of PTM accumulation varied depending on the type of metals and the sections of A. marina. In the order Cu > Zn > Cr > Ni > Cd, rather high levels of PTMs were found in mangroves. The highest levels of Cu in A. marina are correlated with the highest levels of Cu in the nearby sediments. The fact that Cu and Zn are crucial trace elements for plants may help to explain the high amounts of these two metals.
Similar to our findings, earlier research conducted with A. marina revealed that Pb showed little absorption and minimal movement, while Cu and Zn had the largest accumulation [15]. The lower Pb accumulation in mangrove leaves could be due to Pb having a limited solubility and is extremely immobile, at pH levels above 5. Phosphates, hydroxides, carbonates, clays, and organic materials can all react with soluble Pb to reduce the solubility of the metal in the soil and, as a result, the amount of Pb that is available to plants is limited [89].

4.4. Comparative Levels of Metals with Reported Studies

The PTM levels in the MP and lamina of the present study were comparable to most of the metal levels in the mangrove leaves reported in the literature (Table 14), including those found in nine species of mangroves from Hainan Island, China [1], and in mangrove leaf collected from Punta Mala Bay (Pacific Panama) [5]. The comparatively higher metal levels in the mangrove leaves by those reported by MacFarlane et al. [73], MacFarlane and Burchett [15], and Peng et al. [11] would imply that Avicennia could be due to excessive metal deposition and PTM pollution.
According to Kabata-Pendias and Pendias [93], the general PTM concentration for plants was based on the amounts of PTMs that were measured in the plant tissues. The most mobile metal was discovered to be Zn, followed by Cu and Pb in the leaf tissue. The spatial distribution and bio-accumulation of Cu, Ni, Pb, and Zn in marine sediments and A. marina at Yanbu Red Sea, Saudi Arabia, were evaluated by Alharbi et al. [94]. They reported that the Cu, Ni, Pb, and Zn concentrations (mg/kg dry weight) in the sediments were 17.2–217.2, 27.3–241.8, 11.5–111.3, and 48.8–511.5, respectively, while the concentrations (mg/kg dry weight) in the leaves were 18.1–40.2, 16.1–56.3, 2.3–9.9, and 36.8–84.9, respectively.
Bakshi et al. [95] reported the significant association between the metal concentration in A. officinalis leaves and the sediment metals, and suggests that extensive bioaccumulation had occurred. Chaudhuri et al. [13] reported that A. marina accumulated significant amounts of PTMs with a strong positive correlation of metals between the mangrove and sediments (both total and bio-available fractions). Ghasemi et al. [96] reported the phytomanagement of PTMs in mangrove sediments of Hormozgan, Iran, using A. marina. In addition, using greenhouse and field tests, Kaewtubtim et al. [97] assessed the uptake and accumulation of PTMs by Pluchea indica and A. marina and concluded that the mangrove had the potential for phytoremediation.
Using both species-level analyses and a phylogenetic approach, MacFarlane et al. [18] conducted a comparative analysis assessing the patterns of accumulation and partitioning of Cu, Pb and Zn in mangroves from the existing field-based studies to date. Avicennia mangroves have several adaptive mechanisms for overcoming the difficulty of saline and extremely anoxic conditions. Although they are different species of mangrove, the metal accumulation and partitioning for Cu, Pb, and Zn were discovered to be comparable across the Avicennia genera and vast geographical ecosystems. They concluded that, regardless of ambient quantities, the non-essential metal Pb was not found in the leaf tissue. As a result, mangroves are a species that exclude non-essential metals and regulate vital metals. Mangrove habitats are arguably the best phytostabilizers in terms of their phytoremediation efforts, with the ability to help with the retention of PTMs to reduce transmission to nearby estuarine and marine systems.
Nath et al. [98] reported that the TF values of essential metals such as Cu and Zn were higher than those of non-essential Pb. This implies that Avicennia selectively exclude non-essential metals, while regulating essential metals. This could help reduce the PTM toxicity to plants. This also suggests that A. marina could act as phytostabilizers that could help the aquatic ecosystem avoid direct or indirect sources of PTM contamination.

4.5. The Need for Conservation at Klang Mangrove Ecosystem

The results of the current study supported the fact that there is extensive anthropogenic activity there. This agrees with Naji and Ismail [29], who showed that the highest concentrations of metals were found in stations with high anthropogenic discharge based on the sediments of Klang Estuary. El Turk et al. [17] concluded that future environmental policies towards a sustainable development in the KME require the public awareness to mitigate the pollution problem.
The KME needs further long-term management and conservation measures to be protected. These findings give accurate and reliable data on the accumulation and translocation of PTMs in rhizosphere sediment to plant tissues of A. apiculata from the mangrove ecosystem. The study can enhance coastal management and environmental protection initiatives by providing decision-makers with a clear understanding of the existing pollution state of this stressed estuarine environment. The emphasis of the current study was on the potential for developing a framework for managing the KME. In order to mitigate the existing threats to the KME, the information offered in the present study can be employed in the monitoring and detection of PTM pollution in the KME.
The current ecological-health risks of PTMs in the KME are based on an informed and risk-based assessment of the current conditions and potential future scenarios, which can be more likely to be effective and sustainable if the goal is to gather the best information to identify nexus issues. This study can also aid in the ability to evaluate resource availability, current demand, known consequences, development opportunities, and possible climate change implications in the KME. The most significant aspect of the knowledge at hand is risk assessment and climate resilience building, which can benefit the water, energy, and food nexus. Risk evaluations in the industries, mangrove eco-tourism, natural services, and economy resources sectors should take into account the interrelationships between water, energy, and food, as well as the challenges posed by climate change.
Since mangrove forest ecosystem management plans and efforts have been proposed in Malaysia [20,99], the present ecological-health risk of PTM in the KME can be an assert (substantial background information) in formulating the Nexus thinking approach [100] to connect the food-energy-water integration to cater to the ever-growing expansion of new ideas, such as a circular and green economy [101], ‘Good health and well-being’ under the United Nation’s Sustainability Development Goals [102] and One Health concept. There is little question about the need to connect economic, social, and environmental perspectives for the holistic solution using the Nexus approach that was proposed in Cyprus [103].

5. Conclusions

This study aimed to evaluate the ecological-health risks of PTMs in the surface sediments collected from the KME, and to assess the phytoremediation potential of Avicennia officinalis collected from the KME. The ER values indicated that Ni, Pb and Zn were classified as ‘low potential ecological risk’ (ER < 40)’, while Cu ranged from ‘low potential ecological risk’ to ‘considerable potential ecological risk’. In terms of the health risks of the sediments, all of the HI values of Cu, Ni, Pb and Zn based on the combination of three pathways indicated <1.00, showing that the four metals are non-carcinogenic. Based on the BCF values, it can be concluded that the lamina has a better potential as a phytoremediator of essential Cu, Zn and Fe, while MP has a better potential as a phytoremediator of non-essential Pb and Ni.
Future research should concentrate on tracking the changes in the metal concentrations in sediments and mangrove plants throughout time. It is important to look into the speciation and readily accessible portions of PTMs in sediment. Further research is needed to determine how mangrove systems might reduce PTM contamination using phytoextraction and phytostabilization techniques in terms of the environmental restoration and management of the KME.

Supplementary Materials

The following supporting information can be downloaded at: https://www.mdpi.com/article/10.3390/biology12010043/s1, Table S1: Sampling information in the mangrove of Klang River (K1-K8) and Juru estuary (J1). Samplings were conducted on 2 December 2007 while Juru estuary on 8 December 2007, Table S2: Heavy metals analysis recovery percentages of the certified reference materials (CRM), Table S3: Comparisons of concentrations (mg/kg dry weight) of Zn, Cu and Zn between surface sediments from this study with those cited from sediment quality guidelines, and reference values, Table S4: Definition, exposure factors, and reference values were used to estimate the intake values and health risks of potentially toxic metals in sediments used in the present study, Table S5: Concentrations (mg/kg dry weight) of Cu, Ni, Fe, Pb and Zn in the geochemical fractions of surface sediments in Klang River estuary (S1–S8) and a site in Juru estuary (S9), Table S6: Values of geoaccumulation index (Igeo), contamination factor (CF), ecological risk (ER) for Cu, Ni, Pb and Zn, and potentially ecological risk index (PERI) of surface sediments in Klang River estuary (S1–S8) and a site in Juru estuary (S9), based on background levels of the metals that were reported from Peninsular Malaysia, Table S7: Values of hazard quotient (HQ), and hazard index (HI), in the three exposure routes of Ni in Klang River estuary (S1–S8) and a site in Juru estuary (S9), Table S8: Values of hazard quotient (HQ), and hazard index (HI), in the three exposure routes of Cu in in Klang River estuary (S1–S8) and a site in Juru estuary (S9), Table S9: Values of hazard quotient (HQ), and hazard index (HI), in the three exposure routes of Pb in in Klang River estuary (S1–S8) and a site in Juru estuary (S9), Table S10: Values of hazard quotient (HQ), and hazard index (HI), in the three exposure routes of Zn in Klang River estuary (S1–S8) and a site in Juru estuary (S9), Table S11: Mean concentrations (mg/kg dry weight) of Cu, Fe and Pb in the leaf parts (lamina (L), midrib plus petiole (M + P)) of Avicennia officinalis and total concentrations of their habitat surface sediments in in the mangrove of Klang estuary (S1, S2, S5, S6 and S8) and Juru estuary (S9) [34,40,41,42,43,44,46,48,49,50,54,67,68,69,70,104,105,106,107,108].

Author Contributions

Conceptualisation, C.K.Y. and K.A.A.-M.; methodology and validation, C.K.Y. and K.A.A.-M.; formal analysis, C.K.Y.; investigation, C.K.Y.; resources, K.A.A.-M.; data curation, C.K.Y.; writing—original draft preparation, C.K.Y.; writing—review and editing, C.K.Y. and K.A.A.-M. All authors have read and agreed to the published version of the manuscript.

Funding

This research received no external funding.

Institutional Review Board Statement

Not applicable.

Informed Consent Statement

Not applicable.

Data Availability Statement

Not applicable.

Acknowledgments

The authors would like to thank undergraduate students, namely, Dzul Khairool Mohamad and Pairul Iruan Mohd Rejab for the laboratory analysis of the heavy metal data presented in this paper.

Conflicts of Interest

The authors declare no conflict of interest.

References

  1. Qiu, Y.-W.; Yu, K.-F.; Zhang, G.; Wang, W.-X. Accumulation and partitioning of seven trace metals in mangroves and sediment cores from three estuarine wetlands of Hainan Island, China. J. Hazard. Mater. 2011, 190, 631–638. [Google Scholar] [CrossRef] [PubMed]
  2. Usman, A.R.A.; Alkredaa, R.S.; Al-Wabel, M.I. Heavy metal contamination in sediments and mangroves from the coast of Red Sea: Avicennia marina as potential metal bioaccumulator. Ecotox. Environ. Saf. 2013, 97, 263–270. [Google Scholar] [CrossRef] [PubMed]
  3. Alzahrani, D.A.; El-Metwally, M.S.; Mohsen, M.E. Ecological assessment of heavy metals in the grey mangrove (Avicennia marina) and associated sediments along the Red Sea coast of Saudi Arabia. Oceanologia 2018, 60, 513–526. [Google Scholar] [CrossRef]
  4. Fernandes, L.; Nayak, G.N.; Ilangovan, D. Geochemical assessment of metal concentrations in mangrove sediments along Mumbai Coast, India. World Acad. Sci. Eng. Technol. 2012, 61, 258–263. [Google Scholar]
  5. Defew, L.H.; Mair, J.M.; Guzman, H.M. An assessment of metal contamination in mangrove sediments and leaves from Punta Mala Bay, Pacific Panama. Mar. Pollut. Bull. 2005, 50, 547–552. [Google Scholar] [CrossRef] [PubMed]
  6. Yim, M.W.; Tam, N.F.Y. Effects of wastewater-borne heavy metals on mangrove plants and soil microbial activities. Mar. Pollut. Bull. 1999, 39, 179–186. [Google Scholar] [CrossRef]
  7. Bodin, N.; N′Gom-Kâ, R.; Kâ, S.; Thiaw, O.T.; Tito de Morais, L.; Le Loc′h, F.; Rozuel-Chartier, E.; Auger, D.; Chiffoleau, J.F. Assessment of trace metal contamination in mangrove ecosystems from Senegal West Africa. Chemosphere 2013, 90, 150–157. [Google Scholar] [CrossRef]
  8. Nath, B.; Birch, G.; Chaudhuri, P. Assessment of sediment quality in Avicennia marina-dominated embayments of Sydney Estuary: The potential use of pneumatophores (aerial roots) as a bio-indicator of trace metal contamination. Sci. Total Environ. 2014, 15, 1010–1022. [Google Scholar] [CrossRef]
  9. Aljahdali, M.O.; Alhassan, A.B. Ecological risk assessment of heavy metal contamination in mangrove habitats, using biochemical markers and pollution indices: A case study of Avicennia marina L. in the Rabigh lagoon, Red Sea. Saudi J. Biol. Sci. 2020, 27, 1174–1184. [Google Scholar] [CrossRef]
  10. Parvaresh, H.; Abedi, Z.; Farshchi, P.; Karami, M.; Khorasani, N.; Karbassi, A. Bioavailability and concentration of heavy metals in the sediments and leaves of grey mangrove, Avicennia marina (Forsk.) Vierh, in Sirik Azini Creek, Iran. Biol. Trace Elem. Res. 2011, 143, 1121–1130. [Google Scholar] [CrossRef]
  11. Peng, L.; Wenjian, Z.; Zhenji, L. Distribution and accumulation of heavy metals in Avicennia marina community in Shenzhen, China. J. Environ. Sci. 1997, 9, 472–479. [Google Scholar]
  12. Marchand, C.; Fernandez, J.M.; Moreton, B.; Landi, L.; Lallier-Vergès, E.; Baltzer, F. The partitioning of transitional metals (Fe, Mn, Ni, Cr) in mangrove sediments downstream of a ferralitized ultramafic watershed (New Caledonia). Chem. Geol. 2012, 300–301, 70–80. [Google Scholar] [CrossRef]
  13. Chaudhuri, P.; Nath, B.; Birch, G. Accumulation of trace metals in grey mangrove Avicennia marina fine nutritive roots: The role of rhizosphere processes. Mar. Poll. Bull. 2014, 79, 284–292. [Google Scholar] [CrossRef] [PubMed]
  14. Thomas, C.; Eong, O.J. Effects of the heavy metals Zn and Pb on R. mucronata and A. alba seedlings. In Research and Management, Proceedings of the Asian Symposium on Mangroves and Environment, Kuala Lumpur, Malaysia, 25–29 August 1980; Soepadmo, E., Rao, A.M., MacIntosh, M.D., Eds.; ISME: Kuala Lumpur, Malaysia, 1984; pp. 568–574. [Google Scholar]
  15. MacFarlane, G.R.; Burchett, M.D. Toxicity, growth and accumulation relationships of copper, lead and zinc in the Grey Mangrove Avicennia marina (Forsk.) Veirh. Mar. Environ. Res. 2002, 54, 65–84. [Google Scholar] [CrossRef] [PubMed]
  16. Omar, T.F.T.; Aris, A.Z.; Yusoff, F.M.; Mustafa, S. Occurrence, distribution, and sources of emerging organic contaminants in tropical coastal sediments of anthropogenically impacted Klang River estuary, Malaysia. Mar. Pollut. Bull. 2018, 131, 284–293. [Google Scholar] [CrossRef] [Green Version]
  17. EL Turk, M.; Abdullah, R.; Mohamad Zakaria, R.; Abu Bakar, N.K. Heavy metal contamination in mangrove sediments in Klang estuary, Malaysia: Implication of risk assessment. Estuar. Coast. Shelf Sci. 2019, 226, 106266. [Google Scholar] [CrossRef]
  18. MacFarlane, G.F.; Koller, C.E.; Blomberg, S.P. Accumulation and partitioning of heavy metals in mangroves: A synthesis of field-based studies. Chemosphere 2007, 69, 1454–1464. [Google Scholar] [CrossRef]
  19. Zakaria, M.H.; Sidik Bujang, J. Mangroves of Sungai Pulai Estuary, Johor. In Status of Mangrove in Malaysia; Omar, H., Husin, T.M., Parlan, I., Eds.; FRIM Special Publication No. 50; Forest Research Institute Malaysia, Ministry of Energy and Natural Resources: Selangor, Malaysia, 2020; Chapter 7; pp. 110–124. [Google Scholar]
  20. Alias, N.; Mansor, M.; Hussin, M.A.; Husin, T.M.; Azman, N.Z.N.; Hassan, N.A. Phenological Study of Mangrove Species on the West Coast Area of Peninsular Malaysia. In Status of Mangrove in Malaysia; Omar, H., Husin, T.M., Parlan, I., Eds.; FRIM Special Publication No. 50; Forest Research Institute Malaysia, Ministry of Energy and Natural Resources: Selangor, Malaysia, 2020; Chapter 5; pp. 86–93. [Google Scholar]
  21. Tomlinson, P.B. The Botany of Mangroves; Cambridge University Press: Cambridge, UK, 1986; 413p. [Google Scholar]
  22. Omar, H.; Misman, M.A. Extents and Distribution of Mangroves in Malaysia. In Status of Mangrove in Malaysia; Omar, H., Husin, T.M., Parlan, I., Eds.; FRIM Special Publication No. 50; Forest Research Institute Malaysia and Ministry of Energy and Natural Resources: Selangor, Malaysia, 2020; Chapter 1; pp. 1–42. [Google Scholar]
  23. Norhayati, A.; Shukor, M.N.; Juliana, S.; Wan Juliana, W. A Mangrove Flora and Fauna of Klang Islands Mangrove Forest Reserves, Selangor, Malaysia. Malays. J. Sci. 2009, 28, 275–288. [Google Scholar]
  24. Hattam, C.; Goh, H.C.; Then, A.Y.; Edwards-Jones, A.; Nabilah Ruslan, N.F.; Yap, J.S.E.; Moh, H.H. Using nexus thinking to identify opportunities for mangrove management in the Klang Islands, Malaysia. Estuar. Coast. Shelf Sci. 2020, 247, 106917. [Google Scholar] [CrossRef]
  25. Sany, S.B.T.; Salleh, A.; Rezayi, M.; Saadati, N.; Narimany, L.; Tehrani, G.M. Distribution and contamination of heavy metal in the coastal sediments of Port Klang, Selangor, Malaysia. Water Air Soil Pollut. 2013, 224, 1476. [Google Scholar] [CrossRef]
  26. Zaki, M.R.M.; Ying, P.X.; Zainuddin, A.H.; Razak, M.R.; Aris, A.Z. Occurrence, abundance, and distribution of microplastics pollution: An evidence in surface tropical water of Klang River estuary, Malaysia. Environ. Geochem. Health 2021, 43, 3733–3748. [Google Scholar] [CrossRef] [PubMed]
  27. Zaki, M.R.M.; Zaid, S.H.M.; Zainuddin, A.H.; Aris, A.Z. Microplastic pollution in tropical estuary gastropods: Abundance, distribution and potential sources of Klang River estuary, Malaysia. Mar. Pollut. Bull. 2021, 162, 111866. [Google Scholar] [CrossRef] [PubMed]
  28. Yap, C.K.; Mohd Ruszaidi, S.; Cheng, W.H.; Tan, S.G. Heavy-metal concentrations in the mangrove snail, Nerita lineata and surface sediments collected from klang river estuary, Selangor, Malaysia. J. Sustain. Sci. Manag. 2010, 5, 1–12. [Google Scholar]
  29. Naji, A.; Ismail, A. Sediment quality assessment of Klang Estuary, Malaysia. Aquat. Ecosyst. Health Manag. 2012, 15, 287–293. [Google Scholar] [CrossRef]
  30. Haris, H.; Aris, A.Z. Distribution of metals and quality of intertidal surface sediment near commercial ports and estuaries of urbanized rivers in Port Klang, Malaysia. Environ. Earth Sci. 2015, 73, 7205–7218. [Google Scholar] [CrossRef]
  31. Omar, T.F.T.; Aris, A.Z.; Yusoff, F.M.; Mustafa, S. Occurrence and level of emerging organic contaminant in fish and mollusk from Klang River estuary, Malaysia and assessment on human health risk. Environ. Pollut. 2019, 248, 763–773. [Google Scholar] [CrossRef]
  32. Omar, T.F.T.; Aris, A.Z.; Yusoff, F.M.; Mustafa, S. Risk assessment of pharmaceutically active compounds (PhACs) in the Klang River estuary, Malaysia. Environ. Geochem. Health 2019, 41, 211–223. [Google Scholar] [CrossRef]
  33. Yap, C.K.; Ismail, A.; Tan, S.G. Cd and Zn in the straits of Malacca and intertidal sediments of the west coast of Peninsular Malaysia. Mar. Pollut. Bull. 2003, 46, 1348–1353. [Google Scholar] [CrossRef]
  34. Cheng, W.H.; Yap, C.K. Potential human health risks from toxic metals via mangrove snail consumption and their ecological risk assessments in the habitat sediment from Peninsular Malaysia. Chemosphere 2015, 135, 156–165. [Google Scholar] [CrossRef]
  35. Yap, C.K.; Pang, B.H. Assessment of Cu, Pb, and Zn Contamination in Sediment of North Western Peninsular Malaysia by Using Sediment Quality Values and Different Geochemical Indices. Environ. Monit. Assess. 2011, 183, 23–39. [Google Scholar] [CrossRef]
  36. Yap, C.K.; Wong, C.H. Assessment Cu, Ni and Zn Pollution in the Surface Sediments in the Southern Peninsular Malaysia Using Cluster Analysis, Ratios of Geochemical Nonresistant to Resistant Fractions, and Geochemical Indices. Environ. Asia 2011, 4, 53–61. [Google Scholar] [CrossRef]
  37. Yap, C.K.; Pang, B.H. Anthropogenic Concentrations of Cd, Ni and Zn in the Intertidal, River and Drainage Sediments Collected from North Western Peninsular Malaysia. Pertanika J. Sci. Technol. 2011, 19, 93–107. [Google Scholar]
  38. Badri, M.A.; Aston, S.R. Observation on heavy metal geochemical associations in polluted and non-polluted estuarine sediments. Environ. Pollut. Ser. B Chem. Phys. 1983, 6, 181–193. [Google Scholar] [CrossRef]
  39. Muller, G. Index of Geoaccumulation in Sediments of the Rhine River. Geojournal 1969, 2, 108–118. [Google Scholar]
  40. Yap, C.K.; Noorhaidah, A. Gill and Digestive Caecum of Telescopium telescopium as Biomonitors of Pb Bioavailability and Contamination by Pb in the Tropical Intertidal Area. Sains Malays. 2011, 40, 175–1085. [Google Scholar]
  41. Yap, C.K.; Arifin, N.; Tan, S.G. Relationships of Copper Concentrations between the Different Soft Tissues of Telescopium telescopium and the Surface Sediments Collected from Tropical Intertidal Areas. Int. J. Chem. 2013, 5, 8–19. [Google Scholar] [CrossRef]
  42. Yap, C.K.; Noorhaidah, A.; Tan, S.G. Digestive Cecum and Tissue Redistribution in Gills of Telescopium telescopium as Indicators of Ni Bioavailabilities and Contamination in Tropical Intertidal Areas. Water. Air. Soil Pollut. 2012, 223, 2891–2905. [Google Scholar] [CrossRef]
  43. Yap, C.K.; Noorhaidah, A.; Tan, S.G. Zn Concentrations in the Different Soft Tissues of Telescopium telescopium and Their Relationships with Zn Speciation by Sequential Extraction in Surface Sediments: A Statistical Multiple Linear Stepwise Regression Analysis. In Gastropods: Diversity, Habitat, and Genetics; Branchi, A.M., Fields, J.N., Eds.; Nova Science Publishers Inc.: New York, NY, USA, 2011; pp. 127–148. ISBN 978-1-61324-695-5. [Google Scholar]
  44. Hakanson, L. An Ecological Risk Index for Aquatic Pollution Control. A Sedimentological Approach. Water Res. 1980, 14, 975–1001. [Google Scholar] [CrossRef]
  45. USEPA. Superfund Public Health Evaluation Manual; U.S. Environmental Protection Agency: Washington, DC, USA, 1986; pp. 1–86.
  46. USEPA. Human Health Evaluation Manual. In Risk Assessment Guidance for Superfund; EPA/540/1-89/002; Office of Emergency and Remedial Response, U.S. Environmental Protection Agency: Washington, DC, USA, 1989; Volume 1. [Google Scholar]
  47. USEPA. Exposure Factors Handbook; EPA/600/P-95/002F; National Center for Environmental Assessment, US EPA Office of Research and Development: Washington, DC, USA, 1997.
  48. USEPA. Baseline Human Health Risk Assessment Vasquez Boulevard and I-70 Superfund Site Demver, Co; U.S. Environmental Protection Agency: Washington, DC, USA, 2001.
  49. Chabukdhara, M.; Nema, A.K. Heavy Metals Assessment in Urban Soil around Industrial Clusters in Ghaziabad, India: Probabilistic Health Risk Approach. Ecotoxicol. Environ. Saf. 2013, 87, 57–64. [Google Scholar] [CrossRef]
  50. Qing, X.; Yutong, Z.; Shenggao, L. Assessment of Heavy Metal Pollution and Human Health Risk in Urban Soils of Steel Industrial City (Anshan), Liaoning, Northeast China. Ecotoxicol. Environ. Saf. 2015, 120, 377–385. [Google Scholar] [CrossRef]
  51. Ferreira-Baptista, L.; De Miguel, E. Geochemistry and Risk Assessment of Street Dust in Luanda, Angola: A Tropical Urban Environment. Atmos. Environ. 2005, 39, 4501–4512. [Google Scholar] [CrossRef] [Green Version]
  52. Hu, X.; Zhang, Y.; Luo, J.; Wang, T.; Lian, H.; Ding, Z. Bioaccessibility and Health Risk of Arsenic, Mercury and Other Metals in Urban Street Dusts from a Mega-City, Nanjing, China. Environ. Pollut. 2011, 159, 1215–1221. [Google Scholar] [CrossRef] [PubMed]
  53. Kelepertzis, E. Investigating the Sources and Potential Health Risks of Environmental Contaminants in the Soils and Drinking Waters from the Rural Clusters in Thiva Area (Greece). Ecotoxicol. Environ. Saf. 2014, 100, 258–265. [Google Scholar] [CrossRef] [PubMed]
  54. Li, Z.; Ma, Z.; van der Kuijp, T.J.; Yuan, Z.; Huang, L. A Review of Soil Heavy Metal Pollution from Mines in China: Pollution and Health Risk Assessment. Sci. Total Environ. 2014, 468, 843–853. [Google Scholar] [CrossRef]
  55. Brooks, R.R. Geobotany and hyperaccumulators. In Plants that Hyperaccumulate Heavy Metals; Brooks, R.R., Ed.; University Press: Cambridge, UK, 1998; pp. 55–94. [Google Scholar]
  56. Chakraborty, D.; Bhar, S.; Majumdar, J.; Santra, S.C. Heavy metal pollution and Phytoremediation potential of Avicennia officinalis L. in the southern coast of the Hoogly estuarine system. Int. J. Environ. Sci. 2013, 3, 2291–2303. [Google Scholar]
  57. Shapiro, S.S.; Wilk, M.B. An Analysis of Variance Test for Normality (Complete Samples). Biometrika 1965, 52, 591–611. [Google Scholar] [CrossRef]
  58. Ghasemi, A.; Zahediasl, S. Normality tests for statistical analysis: A guide for non-statisticians. Int. J. Endocrinol. Metab. 2012, 10, 486–489. [Google Scholar] [CrossRef] [Green Version]
  59. Mishra, P.; Pandey, C.M.; Singh, U.; Gupta, A.; Sahu, C.; Keshri, A. Descriptive statistics and normality tests for statistical data. Ann. Card. Anaesth. 2019, 22, 67–72. [Google Scholar] [CrossRef]
  60. Zar, J.H. Biostatistical Analysis, 3rd ed.; Prentice-Hall International: Upper Saddle River, NJ, USA, 1996. [Google Scholar]
  61. Manly, B.F.J. Multivariate Statistical Methods: A Primer, 2nd ed.; Chapman and Hall: London, UK, 1997. [Google Scholar]
  62. Yap, C.K.; Rahim Ismail, A.; Ismail, A.; Tan, S.G. Analysis of heavy metal level data (Cd, Cu, Pb and Zn) in different geochemical fractions of the surface sediments in the Straits of Malacca by the use of correlation and multiple linear stepwise regression analyses. Malays. Appl. Biol. 2005, 34, 51–59. [Google Scholar]
  63. Yap, C.K.; Edward, F.B.; Tan, S.G. Similarities and differences of metal distributions in the tissues of molluscs by using multivariate analyses. Environ. Monitor. Assess. 2010, 165, 39–53. [Google Scholar] [CrossRef]
  64. Noorhaidah, A.; Yap, C.K. Correlations between speciation of Zn in sediment and their concentrations in different soft tissue of Telescopium telescopium from the intertidal area of Peninsular Malaysia. Pertanika J. Trop. Agric. Sci. 2010, 33, 79–90. [Google Scholar]
  65. Yap, C.K.; Rahim Ismail, A. Relationships of distribution of macrobenthic invertebrates and the physico-chemical parameters from Semenyih River by using correlation and multiple linear stepwise regression analyses. Pertanika J. Trop. Agric. Sci. 2011, 34, 229–245. [Google Scholar]
  66. Yap, C.K.; Rahim Ismail, A.; Ismail, A.; Tan, S.G. Studies on heavy metal accumulations in green-lipped mussel Perna viridis by using multiple linear stepwise regression analysis. Pertanika J. Sci. Technol. 2003, 11, 43–55. [Google Scholar]
  67. Long, E.R.; MacDonald, D.D.; Smith, S.L.; Calder, F.D. Incidence of adverse biological effects within ranges of chemical concentrations in marine and estuarine sediments. Environ. Manag. 1995, 19, 81–97. [Google Scholar] [CrossRef]
  68. Macdonald, D.D.; Carr, R.S.; Calder, F.D.; Long, E.R.; Ingersoll, C.G. Development and evaluation of sediment quality guidelines for Florida coastal waters. Ecotoxicology 1996, 5, 253–278. [Google Scholar] [CrossRef] [PubMed]
  69. Chapman, P.M.; Allard, P.J.; Vigers, G.A. Development of Sediment Quality Values for Hong Kong Special Administrative Region: A Possible Model for Other Jurisdictions. Mar. Pollut. Bull. 1999, 38, 161–169. [Google Scholar] [CrossRef]
  70. Wedepohl, K.H. The Composition of the Continental Crust. Geochim. Cosmochim. Acta 1995, 59, 1217–1232. [Google Scholar] [CrossRef]
  71. Lacerda, L.D. Trace metals in mangrove plants: Why such low concentrations? In Mangrove Ecosystem Studies in Latin America and Africa; Kjerfve, B., Lacerda, L.D., Diop, H.S., Eds.; UNESCO: Paris, France, 1997; pp. 171–178. [Google Scholar]
  72. Harbison, P. Mangrove muds—A sink and a source for trace metals. Mar. Pollut. Bull. 1986, 17, 246–250. [Google Scholar] [CrossRef]
  73. MacFarlane, G.R.; Pulkownik, A.; Burchett, M.D. Accumulation and distribution of heavy metals in the grey mangrove, Avicennia marina (Forsk.)Vierh.: Biological indication potential. Environ. Pollut. 2003, 123, 139–151. [Google Scholar] [CrossRef]
  74. Greger, M. Metal availability, uptake, transport and accumulation in plants. In Heavy Metal Stress in Plants: From Biomolecules to Ecosystems; Prasad, M.N.V., Ed.; Springer: Berlin, Germany, 2004; pp. 1–27. [Google Scholar]
  75. Lacerda, L.D.; Abrao, J.J. Heavy metal accumulation by mangrove and saltmarsh intertidal sediments. Rev. Bras. Biol. 1984, 7, 49–52. [Google Scholar]
  76. Lacerda, L.D. The biogeochemistry and trace metal distribution of mangrove rhizospheres. Biotropica 1993, 25, 252. [Google Scholar] [CrossRef]
  77. MacFarlane, G.R.; Burchett, M.D. Cellular distribution of copper, lead and zinc in the grey mangrove, Avicennia marina (Forsk.) Vierh. Aquat. Bot. 2000, 68, 45–59. [Google Scholar] [CrossRef]
  78. Ma, L.Q.; Komar, K.M.; Tu, C.; Zhang, W.; Cai, Y.; Kennelley, E.D. A fern that hyperaccumulates arsenic. Nature 2001, 409, 579. [Google Scholar] [CrossRef] [PubMed]
  79. Zhao, F.J.; Lombi, E.; McGrath, S.P. Assessing the potential for zinc and cadmium phytoremediation with the hyperaccumulator Thlaspi caerulescens. Plant Soil 2003, 249, 37–43. [Google Scholar] [CrossRef]
  80. McGrath, S.P. Phytoextraction for soil remediation. In Plants that Hyperaccumulate Heavy Metals; Brooks, R.R., Ed.; University Press: Cambridge, UK, 1998; pp. 261–287. [Google Scholar]
  81. Salt, D.E.; Blaylock, M.; Kumar, P.B.A.N.; Dushenko, V.; Ensley, B.D.; Chet, I.; Raskin, I. Phytoremediation: A novel strategy for the removal of toxic metals from the environment using plants. Bio Technol. 1995, 13, 468–474. [Google Scholar] [CrossRef]
  82. Ghosh, S.; Bakshi, M.; Mahanty, S.; Chaudhuri, P. Understanding potentially toxic metal (PTM) induced biotic response in two riparian mangrove species Sonneratia caseolaris and Avicennia officinalis along river Hooghly, India: Implications for sustainable sediment quality management. Mar. Environ. Res. 2021, 172, 105486. [Google Scholar] [CrossRef]
  83. Ghosh, S.; Bakshi, M.; Mahanty, S.; Chaudhuri, P. Assessment of role of rhizosphere process in bioaccumulation of heavy metals in fine nutritive roots of riparian mangrove species in river Hooghly: Implications to global anthropogenic environmental changes. Mar. Poll. Bull. 2022, 174, 113157. [Google Scholar] [CrossRef]
  84. Kholoud, A.S.; Mohammad, S.A.; Ahmed, A.S.; Asma, A. Assessing Heavy Metals Accumulation in the Leaves and Sediments of Urban Mangroves (Avicennia marina (Forsk.) Vierh.) in Bahrain. Int. J. Ecol. 2017, 2017, 3978216. [Google Scholar] [CrossRef] [Green Version]
  85. Violintzis, C.; Arditsoglou, A.; Voutsa, D. Elemental composition of suspended particulate matter and sediments in the coastal environment of Thermaikos Bay, Greece: Delineating the impact of inland waters and wastewaters. J. Hazard. Mater. 2009, 166, 1250–1260. [Google Scholar] [CrossRef]
  86. Baker, A.J.M. Accumulators and excluders: Strategies in the response of plants to heavy metals. J. Plant Nutr. 1981, 3, 643–656. [Google Scholar] [CrossRef]
  87. Arumugam, G.; Rajendran, R.; Ganesan, A.; Sethu, R. Bioaccumulation and translocation of heavy metals in mangrove rhizosphere sediments to tissues of Avicenia marina—A field study from tropical mangrove forest. Environ. Nanotechnol. Monitor. Manag. 2018, 10, 272–279. [Google Scholar] [CrossRef]
  88. Souza, I.C.; Rocha, L.D.; Morozesk, M.; Bonomo, M.M.; Arrivabene, H.P.; Duarte, I.D.; Furlan, L.M.; Monferrán, M.V.; Mazik, K.; Elliott, M.; et al. Changes in bioaccumulation and translocation patterns between root and leafs of Avicennia schaueriana as adaptive response to different levels of metals in mangrove system. Mar. Poll. Bull. 2015, 94, 176–184. [Google Scholar] [CrossRef] [PubMed]
  89. McLean, J.E.; Bledsoe, B.E. Behaviour of Metals in Soils. EPA Ground Water Issue, EPA 540-S-92-018:25pp; Environmental Protection Agency: Washington, DC, USA, 1992; 25p.
  90. Sarangi, R.K.; Kathiresan, K.; Subramanian, A.N. Metal concentrations in five mangrove species of the Bhitarkanika, Orissa, east coast of India. Indian J. Mar. Sci. 2002, 31, 251–253. [Google Scholar]
  91. Thomas, G.; Fernandez, T.V. Incidence of heavy metals in the mangrove flora and sediments in Kerala, India. Hydrobiologia 1997, 352, 77–87. [Google Scholar] [CrossRef]
  92. Tam, N.F.Y.; Wong, Y.S. Spatial variation of heavy metals in surface sediments of Hong Kong mangrove swamps. Environ. Pollut. 2000, 110, 195–205. [Google Scholar] [CrossRef]
  93. Kabata-Pendias, A.; Pendias, H. Trace Elements in Soils and Plants, 2nd ed.; CRC Press Inc.: Boca Raton, FL, USA, 1992. [Google Scholar]
  94. Alharbi, O.M.L.; Khattab, R.A.; Ali, I.; Binnaser, Y.S.; Aqeel, A. Assessment of heavy metals contamination in the sediments and mangroves (Avicennia marina) at Yanbu coast, Red Sea, Saudi Arabia. Mar. Pollut. Bull. 2019, 149, 110669. [Google Scholar] [CrossRef]
  95. Bakshi, M.; Ghosh, S.; Chakraborty, D.; Hazra, S.; Chaudhuri, P. Assessment of potentially toxic metal (PTM) pollution in mangrove habitats using biochemical markers: A case study on Avicennia officinalis L. in and around Sundarban, India. Mar. Pollut. Bull. 2018, 133, 157–172. [Google Scholar] [CrossRef]
  96. Ghasemi, S.; Siavash, M.S.; Rahimi, A.; Damalas, C.A.; Naji, A. Phytomanagement of trace metals in mangrove sediments of Hormozgan, Iran, using gray mangrove (Avicennia marina). Environ. Sci. Pollut. Res. 2018, 25, 28195–28205. [Google Scholar] [CrossRef]
  97. Kaewtubtim, P.; Meeinkuirt, W.; Seepom, S.; Pichtel, J. Phytomanagement of radionuclides and heavy metals in mangrove sediments of Pattani Bay, Thailand using Avicennia marina and Pluchea indica. Mar. Pollut. Bull. 2018, 127, 320–333. [Google Scholar] [CrossRef]
  98. Nath, B.; Chaudhuri, P.; Birch, G. Assessment of biotic response to heavy metal contamination in Avicennia marina mangrove ecosystems in Sydney Estuary, Australia. Ecotoxicol. Environ. Saf. 2014, 107, 284–290. [Google Scholar] [CrossRef]
  99. Hashim, R.; Kamali, B.; Tamin, N.M.; Zakaria, R. An integrated approach to coastal rehabilitation: Mangrove restoration in Sungai Haji Dorani, Malaysia. Estuar. Coast. Shelf Sci. 2010, 86, 118–124. [Google Scholar] [CrossRef] [Green Version]
  100. Reynolds, J.; Cranston, G. Nexus Thinking: Can it Slow the Great Acceleration. Nexus Network Think Piece (November 2014). Available online: https://www.cisl.cam.ac.uk/business-action/business-nature/natural-capital-impact-group/pdfs/nexus-thinking-can-it-slow-the-great-acceleration/view (accessed on 20 November 2022).
  101. Allouche, J.; Middletone, C.; Gyawali, D. The Water-Food-Energy Nexus: Power, Politics and Justice; Routledge: New York, NY, USA, 2019. [Google Scholar]
  102. Benson, D.; Gain, A.K.; Rouillard, J.J. Water governance in a comparative perspective: From IWRM to a ’nexus’ approach? Water Altern. 2015, 8, 756–773. [Google Scholar]
  103. Halbe, J.; Pahl-Wostl, C.; Lange, M.A.; Velonis, C. Governance of transitions towards sustainable development—The water–energy–food nexus in Cyprus. Water Int. 2015, 40, 877. [Google Scholar] [CrossRef]
  104. Taylor, S.R.; McLennan, S.M. The Geochemical Evolution of the Continental Crust. Rev. Geophys. 1995, 33, 241–265. [Google Scholar] [CrossRef]
  105. Rudnick, R.L.; Gao, S. 3.01—Composition of the Continental Crust. In Treatise on Geochemistry; Holland, H.D., Turekian, K.K., Eds.; Pergamon: Oxford, MS, USA, 2003; pp. 1–64. ISBN 978-0-08-043751-4. [Google Scholar]
  106. Cheng, W.H.; Yap, C.K.; Ismail, A.; Abdul Rahim, I. Distribution and concentrations of Ni in tissues of the gastropod Nerita lineata collected from intertidal areas of Peninsular Malaysia. Pertanika J. Trop. Agric. Sci. 2012, 35, 723–736. [Google Scholar]
  107. DB11/T 656-2009 2009; BQTSB (Beijing Quality and Technology Supervision Bureau) Environmental Site Assessment Guideline. BQTSB: Bejing, China, 2009.
  108. Barnes, D.G.; Dourson, M.; Dourson, M.; Preuss, P.; Barnes, D.G.; Bellin, J.; Derosa, C.; Engler, R.; Erdreich, L.; Farber, T.; et al. Reference Dose (RfD): Description and Use in Health Risk Assessments. Regul. Toxicol. Pharmacol. 1988, 8, 471–486. [Google Scholar] [CrossRef]
Figure 1. Sampling sites for surface sediments in the Klang mangrove ecosystem (S1–S8) and Juru mangrove ecosystem (S9) from the present study. Leaves of mangrove Avicennia were collected at the blacken circles (S1, S2, S5, S6, S8 and S9).
Biology 12 00043 g001
Figure 2. Total concentrations (mean ± standard error, mg/kg dry weight), values of geoaccumulation index (Igeo), contamination factor (CF), and ecological risk (ER) for Cu, Ni, Pb and Zn, of surface sediments in Klang mangrove ecosystem (S1–S8) and Juru mangrove (S9), based on background concentrations (mg/kg dry weight) of the metals that were reported from Peninsular Malaysia, namely: 9.48, 3.55, 7.31, and 13.16 for Pb [40], Cu [41], Ni [42], and Zn [43], respectively.
Biology 12 00043 g002aBiology 12 00043 g002bBiology 12 00043 g002c
Figure 3. Clustering patterns of the nine sampling sites of Cu, Ni, Pb and Zn in the sediments based on Igeo, CF, and ER, and the geochemical fractions of the sediments (F1, F2, F3, F4 and SUM). All values have been log10 (value + 1) before cluster analysis; Sampling sites’ information followed those in Table S1.
Biology 12 00043 g003aBiology 12 00043 g003b
Table 1. Overall values of concentrations (mg/kg dry weight) for Cu, Fe, Ni, Pb and Zn, of surface sediments in Klang River estuary (8 sites) and a site in Juru estuary (1 site). N = 9.
Cu TotalTotal FeNi TotalPb TotalZn Total
Minimum5.3022,12113.9030.3046.40
Maximum63.8027,90632.7062.30269.00
Mean38.2423,73518.2246.94163.60
Median37.9022,93115.9045.90168.00
SD17.2921675.759.8761.39
SE5.768851.923.2920.46
Skewness−0.451.3911.98−0.03−0.25
Kurtosis−0.300.4222.73−0.750.16
Table 2. Overall values of geoaccumulation index (Igeo), contamination factor (CF), ecological risk (ER) for Cu, Ni, Pb and Zn, of surface sediments in Klang River estuary and a site in Juru estuary, based on background levels of the metals that were reported from Peninsular Malaysia. N = 9.
Cu IgeoNi IgeoPb IgeoZn IgeoCu CFNi CFPb CFZn CFCu ERNi ERPb ERZn ER
Minimum−0.010.360.051.231.491.931.553.537.459.647.773.53
Maximum3.581.601.093.7718.04.543.2020.589.922.716.020.5
Mean2.600.700.652.9210.82.532.4112.453.912.612.112.4
Median2.830.560.653.0910.682.212.3512.7953.4111.0511.7712.79
SD1.070.370.320.724.870.800.514.6724.354.002.534.67
SE0.360.120.110.241.620.270.171.568.121.330.841.56
Skewness−1.771.62−0.44−1.48−0.451.98−0.03−0.24−0.451.98−0.03−0.24
Kurtosis2.191.81−0.401.67−0.292.72−0.750.16−0.292.74−0.750.16
Note: The values of Igeo, CF and ER for Fe were not determined because the toxic response factor for Fe is not available.
Table 3. Multiple stepwise regression analytical outputs based on hazard index (HI) and ecological risk (ER) as dependent variables and independent variables are the hazard quotient pathways and geochemical fractions of the sediments.
CuInterceptCFHI-A Fdf
ER0.4161951.130−0.140 93,2542.24
CuInterceptHQing-CF2 Fdf
HI-C1.53 × 10−61.000−0.001 2,661,9482.24
CuInterceptHQinh-AIgeoCF Fdf
HI-A−1.8 × 10−50.988−0.0200.030 430,7553.23
PbInterceptCFHQder-CF2 Fdf
ER0.3137041.340−0.3400.004 197,9073.23
PbInterceptHQing-CSUMF1F3F2IgeoF4Fdf
HI-C1.42 × 10−31.010−0.0200.012−0.001−0.010−0.0200.034536,8107.19
PbInterceptHQing-AERF1 Fdf
HI-A−5.9 × 10−40.9670.0330.003 680,0783.23
ZnInterceptF1F2F3F4SUM Fdf
ER−2.50988−0.46−0.64−0.88−1.24.06 30775.21
ZnInterceptHQing-CF4F1Igeo Fdf
HI-C−2.6 × 10−50.9990.0030.002−0.001 16,179,1004.22
ZnInterceptHQinh-AF1 Fdf
HI-A−7.4 × 10−60.9870.013 336,6802.24
NiInterceptCFHQing-C Fdf
ER0.3573761.25−0.26 229,9312.24
NiInterceptHQder-CIgeo Fdf
HI-C4.47 × 10−50.980.17 1,594,9262.24
NiInterceptHQder-A Fdf
HI-A1.6 × 10−61.00 1,647,7691.25
Note: The independent variables included the pathways of HQing, HQinh, and HQder, and ecological indexes (Igeo, CF, and ER) and geochemical fractions (F1, F2, F3, F4, SUM) of sediments; -C= Children; -A= Adults; All values have been log10 (value+1) prior to multiple linear (forward) stepwise regression analysis; All R values in all equations are 0.999; p values in all equations are 0.000; All equations’ N = 27.
Table 4. Overall values of hazard quotient (HQ), and hazard index (HI), in the three exposure routes of Ni for children (C) and adults (A) in Klang River estuary and a site in Juru estuary. N = 9.
HQing-CHQing-AHQinh-CHQinh-AHQder-CHQder-AHI-CHI-A
Minimum9.11 × 10−31.22 × 10−22.42 × 10−74.36 × 10−75.40 × 10−55.51 × 10−49.16 × 10−31.77 × 10⁻³
Maximum2.15 × 10−22.88 × 10−25.70 × 10−71.03 × 10−61.27 × 10−51.30 × 10−32.16 × 10−24.18 × 10⁻³
Mean1.19 × 10−21.60 × 10−23.17 × 10−75.72 × 10−77.08 × 10−57.23 × 10−41.20 × 10−22.33 × 10⁻³
Median1.04 × 10−21.40 × 10−22.78 × 10−75.00 × 10−76.19 × 10−56.32 × 10−41.05 × 10−22.03 × 10⁻³
SD3.80 × 10−35.08 × 10−41.00 × 10−71.82 × 10−72.23 × 10−52.29 × 10−43.81 × 10−37.37 × 10⁻⁴
SE1.27 × 10−31.69 × 10−43.35 × 10−86.06 × 10−87.45 × 10−67.64 × 10−51.27 × 10−32.46 × 10⁻⁴
Skewness1.981.981.991.991.981.991.971.98
Kurtosis2.742.742.742.762.732.752.712.73
Note: SD = standard deviation; SE = standard error.
Table 5. Overall values of hazard quotient (HQ), and hazard index (HI), in the three exposure routes of Cu for children (C) and adults (A) in in Klang River estuary and a site in Juru estuary. N= 9.
HQing-CHQing-AHQinh-CHQinh-AHQder-CHQder-AHI-CHI-A
Minimum1.73 × 10−32.33 × 10−44.72 × 10−82.12 × 10−89.25 × 10−62.36 × 10−51.74 × 10−32.56 × 10⁻⁴
Maximum2.09 × 10−22.81 × 10−35.69 × 10−72.56 × 10−71.12 × 10−42.85 × 10−42.10 × 10−23.09 × 10⁻³
Mean1.25 × 10−21.68 × 10−33.41 × 10−71.54 × 10−76.69 × 10−51.71 × 10−41.26 × 10−21.85 × 10⁻³
Median1.24 × 10−21.67 × 10−33.38 × 10−71.52 × 10−76.63 × 10−51.69 × 10−41.25 × 10−21.84 × 10⁻³
SD5.67 × 10−37.60 × 10−41.54 × 10−76.94 × 10−83.03 × 10−57.72 × 10−55.70 × 10−38.39 × 10⁻⁴
SE1.89 × 10−32.53 × 10−45.14 × 10−82.31 × 10−81.01 × 10−52.57 × 10−51.90 × 10−32.80 × 10⁻⁴
Skewness−0.45−0.44−0.45−0.45−0.43−0.45−0.45−0.45
Kurtosis−0.30−0.29−0.29−0.29−0.29−0.29−0.29−0.31
Note: SD = standard deviation; SE = standard error.
Table 6. Overall values of hazard quotient (HQ), and hazard index (HI), in the three exposure routes of Pb for children (C) and adults (A) in in Klang River estuary and a site in Juru estuary. N= 9.
HQing-CHQing-AHQinh-CHQinh-AHQder-CHQder-AHI-CHI-A
Minimum1.12 × 10−11.50 × 10−23.09 × 10−61.39 × 10−61.21 × 10−33.09 × 10−31.13 × 10−11.81 × 10⁻²
Maxim um2.31 × 10−13.10 × 10−26.35 × 10−62.86 × 10−62.49 × 10−36.36 × 10−32.33 × 10−13.73 × 10⁻²
Mean1.74 × 10−12.33 × 10−24.78 × 10−62.15 × 10−61.87 × 10−34.79 × 10−31.76 × 10−12.81 × 10⁻²
Median1.70 × 10−12.28 × 10−24.67 × 10−62.10 × 10−61.83 × 10−34.68 × 10−31.72 × 10−12.75 × 10⁻²
SD3.65 × 10−24.93 × 10−31.00 × 10−64.53 × 10−73.95 × 10−41.01 × 10−33.69 × 10−25.91 × 10⁻³
SE1.22 × 10−21.64 × 10−33.35 × 10−71.51 × 10−71.32 × 10−43.36 × 10−41.23 × 10−21.97 × 10⁻³
Skewness−0.03−0.03−0.02−0.02−0.02−0.02−0.04−0.04
Kurtosis−0.73−0.75−0.75−0.75−0.76−0.75−0.74−0.74
Note: SD= standard deviation; SE= standard error.
Table 7. Overall values of hazard quotient (HQ), and hazard index (HI), in the three exposure routes of Zn for children (C) and adults (A) in Klang River estuary and a site in Juru estuary. N = 9.
HQing-CHQing-AHQinh-CHQinh-AHQder-CHQder-AHI-CHI-A
Minimum2.03 × 10−32.72 × 10−45.55 × 10−82.50 × 10−81.62 × 10−54.14 × 10−52.04 × 10−33.14 × 10⁻⁴
Maximum1.18 × 10−21.58 × 10−33.22 × 10−71.45 × 10−79.42 × 10−52.41 × 10−41.19 × 10−21.82 × 10⁻³
Mean7.15 × 10−39.59 × 10−41.96 × 10−78.80 × 10−85.72 × 10−51.46 × 10−47.21 × 10−31.11 × 10⁻³
Median7.35 × 10−39.86 × 10−42.01 × 10−79.06 × 10−85.88 × 10−51.50 × 10−47.41 × 10−31.14 × 10⁻³
SD2.69 × 10−33.60 × 10−47.34 × 10−83.31 × 10−82.15 × 10−55.50 × 10−52.72 × 10−34.16 × 10⁻⁴
SE8.97 × 10−41.20 × 10−42.45 × 10−81.10 × 10−87.17 × 10−61.83 × 10−59.06 × 10−41.39 × 10⁻⁴
Skewness−0.23−0.24−0.25−0.24−0.24−0.24−0.23−0.24
Kurtosis0.170.170.170.170.160.180.160.15
Note: SD = standard deviation; SE = standard error.
Table 8. Overall statistics of zinc (Zn) concentrations (mg/kg dry weight) in the midrib plus petiole (MP), and lamina of Avicennia officinalis, and their bioconcentration factors (BCF) values, collected from 6 sampling sites in the mangrove areas of west coast of Peninsular Malaysia.
MPPlantBCF1BCF2BCF3BCF4BCF5
Minimum16.40.510.320.370.250.08
Maximum36.23.021.891.100.910.35
Mean22.91.100.680.530.430.15
Median21.20.750.440.430.320.11
SD6.790.960.600.280.250.10
SE2.770.390.240.120.100.04
Skewness1.401.631.711.731.351.68
Kurtosis0.660.901.061.100.261.02
LaminaPlantBCF1BCF2BCF3BCF4BCF5
Minimum17.570.560.350.340.260.09
Maximum41.113.652.291.331.100.42
Mean26.921.370.820.620.510.18
Median24.050.680.510.460.430.13
SD9.911.270.750.380.320.13
SE4.050.520.310.150.130.05
Skewness0.501.131.521.291.181.36
Kurtosis−1.37−0.340.660.130.080.32
Note: BCF1 = leave/F1; BCF2 = leave/F2; BCF3 = leave/F3; BCF4 = leave/F4; BCF5 = leave/SUM.
Table 9. Multiple linear stepwise regression analytical outputs based on Avicennia leaves (lamina (L); midrib plus petiole (M)) as dependent variables and independent variables are the bioconcentration factors and sedimentary geochemical fractions.
FeInterceptBCF5BCF2F4 RFdf
Lamina0.648013050.6210.2690.226 0.9954273.14
FeInterceptBCF5F2F4BCF4SUM RFdf
MP0.99750357−1.400−0.2100.9041.91−0.36 0.9962935.12
PbInterceptBCF3BCF1BCF5BCF4F3SUMF1F4RFdf
Lamina0.11027971−0.0401.050−0.1200.248−0.190.2010.0990.0880.9994,788,6598.9
PbInterceptBCF3F3F2F1BCF5BCF1BCF2SUMRFdf
MP0.365423−0.260−0.310−0.1500.4010.1121.37−0.320.1980.99941,2528.9
NiInterceptBCF3BCF5BCF2BCF4F2F1BCF1 RFdf
Lamina−0.101379130.577−1.7002.7700.461.36−0.150−0.300 0.99934,3147.10
NiInterceptBCF3F3F4SUMBCF1BCF4 RFdf
MP0.46776381.0400.8270.877−1.600.913−1 0.99922686.11
CuInterceptF1BCF1F3F4 RFdf
Lamina0.429262631.4101.9602.480−1.80 0.9911864.13
CuInterceptF3BCF4BCF2F1BCF5F2BCF1 RFdf
MP−0.023090050.8682.3100.578−0.07−1.600.418−0.49 0.99910197.10
ZnInterceptBCF4F4BCF5BCF1F1BCF2 RFdf
Lamina0.707906070.620−1.700−1.3005.593.41−2.900 0.9973416.11
ZnInterceptF3BCF4F1 RFdf
MP0.111505330.9991.0000.183 0.9821313.23
Note: The independent variables included BCF1, BCF2, BCF3, BCF4, BCF5, and sedimentary geochemical fractions (F1, F1, F3, F4 and SUM). All values have been log10 (value + 1) prior to multiple (forward) stepwise regression analysis. All p values in all equations are 0.000; All equations’ N = 18.
Table 10. Overall statistics of iron (Fe) concentrations (mg/kg dry weight) in the midrib plus petiole (MP), and lamina of Avicennia officinalis, and their bioconcentration factors (BCF) values, collected from 6 sampling sites in the mangrove areas of west coast of Peninsular Malaysia.
MPPlantBCF1BCF2BCF3BCF4BCF5
Minimum45.80.1700.0200.0040.0030.002
Maximum1930.9700.2400.0980.0080.007
Mean1170.4630.1170.0500.0050.004
Median1180.3400.1000.0490.0050.004
SD57.50.3140.0870.0350.0020.002
SE23.50.1280.0360.0140.0010.001
Skewness0.0360.7210.3620.0590.4660.287
Kurtosis−1.481−1.000−1.325−1.277−1.283−1.180
LaminaPlantBCF1BCF2BCF3BCF4BCF5
Minimum92.90.3400.0400.0090.0060.004
Maximum2441.2300.3000.1420.0100.009
Mean1660.6470.1630.0730.0070.006
Median1720.4950.1600.0720.0070.006
SD53.60.3400.1050.0480.0020.002
SE21.90.1390.0430.0200.0010.001
Skewness0.010.9230.0880.1260.9270.689
Kurtosis−0.96−0.659−1.568−1.160−0.332−0.656
Note: BCF1 = leave/F1; BCF2 = leave/F2; BCF3 = leave/F3; BCF4 = leave/F4; BCF5 = leave/SUM.
Table 11. Overall statistics of lead (Pb) concentrations (mg/kg dry weight) in the midrib plus petiole (MP), and lamina of Avicennia officinalis, and their bioconcentration factors (BCF) values, collected from 6 sampling sites in the mangrove areas of west coast of Peninsular Malaysia.
MPPlantBCF1BCF2BCF3BCF4BCF5
Minimum6.176.9310.640.340.190.12
Maximum23.6722.7629.961.234.900.62
Mean11.9112.7815.780.621.260.32
Median10.5412.7513.700.520.550.23
SD6.705.497.100.361.820.22
SE2.742.242.900.150.740.09
Skewness0.880.961.610.781.650.60
Kurtosis−0.450.000.90−0.700.95−1.43
LaminaPlantBCF1BCF2BCF3BCF4BCF5
Minimum3.393.815.840.180.100.07
Maximum20.5819.9822.571.237.620.96
Mean10.9211.413.50.581.610.32
Median10.1611.5611.990.480.480.21
SD7.496.516.920.442.960.34
SE3.062.662.830.181.210.14
Skewness0.170.030.340.451.751.28
Kurtosis−1.64−1.41−1.45−1.331.140.22
Note: BCF1 = leave/F1; BCF2 = leave/F2; BCF3 = leave/F3; BCF4 = leave/F4; BCF5 = leave/SUM.
Table 12. Overall statistics of copper (Cu) concentrations (mg/kg dry weight) in the midrib plus petiole (MP), and lamina of Avicennia officinalis, and their bioconcentration factors (BCF) values, collected from 6 sampling sites in the mangrove areas of west coast of Peninsular Malaysia.
MPPlantBCF1BCF2BCF3BCF4BCF5
Minimum3.772.7866.10.390.120.09
Maximum11.615.76013770.530.51
Mean6.887.3331763.40.260.21
Median6.316.303330.720.200.16
SD2.614.441831540.150.15
SE1.061.8174.662.70.060.06
Skewness0.871.200.201.791.121.50
Kurtosis−0.020.33−0.691.20−0.070.68
LaminaPlantBCF1BCF2BCF3BCF4BCF5
Minimum5.562.8166.80.400.120.09
Maximum11.931.17467461.041.00
Mean7.7610.13811250.350.30
Median7.437.13335.000.740.220.17
SD2.2010.43239.48304.280.340.35
SE0.904.2697.77124.220.140.14
Skewness1.311.670.321.791.631.72
Kurtosis0.531.01−0.901.200.901.07
Note: BCF1 = leave/F1; BCF2 = leave/F2; BCF3 = leave/F3; BCF4 = leave/F4; BCF5 = leave/SUM.
Table 13. Overall statistics of nickel (Ni) concentrations (mg/kg dry weight) in the midrib plus petiole (MP), and lamina of Avicennia officinalis, and their bioconcentration factors (BCF) values, collected from 6 sampling sites in the mangrove areas of the west coast of Peninsular Malaysia.
MPPlantBCF1BCF2BCF3BCF4BCF5
Minimum0.210.090.060.010.010.01
Maximum4.0912.784.490.640.660.30
Mean2.073.591.700.320.250.13
Median1.992.161.100.330.210.11
SD1.374.611.580.220.220.10
SE0.561.880.650.090.090.04
Skewness0.161.600.940.041.020.84
Kurtosis−0.930.88−0.35−0.830.09−0.19
LaminaPlantBCF1BCF2BCF3BCF4BCF5
Minimum0.130.050.040.010.010.00
Maximum2.868.943.140.450.460.21
Mean1.742.841.410.270.210.10
Median1.862.111.230.280.210.10
SD0.933.101.070.150.150.07
SE0.381.270.440.060.060.03
Skewness−0.691.480.45−0.730.510.15
Kurtosis−0.360.74−0.70−0.07−0.15−0.24
Note: BCF1 = leave/F1; BCF2 = leave/F2; BCF3 = leave/F3; BCF4 = leave/F4; BCF5 = leave/SUM.
Table 14. Comparison of concentrations (mg/kg dry weight) of Zn, Pb, and Cu in the leaves of Avicennia officinalis and their bioconcentration factor (BCF) values.
Location ZnZn BCFPbPb BCFCuCu BCFReference
Klang and
Juru mangrove
MP16.4–36.20.08–0.356.17–23.70.12–0.623.77–11.60.09–0.51This study
Lamina17.6–41.10.09–0.423.39–20.60.07–0.965.56–11.90.09–1.00
SED46.4–269-30.3–62.2-5.29–63.8-
East IndiaLeaf1.200.80NA-2.90.46Sarangi et al. [90]
SED1.50-NA-6.3-
IndiaLeaf1200.161680.111020.34Thomas and Fernandez [91]
SED764-1484-303-
IndiaLeaf120-168-102-Tam and Wong [92]
IndiaLeaf18.5–28.3-3.26–4.57-6.76–11.9-Chakraborty et al. [56]
SED56.4–61.5-28.8–36.8-34.3–40.7-
Note: SED = sediment; NA = not available.
Disclaimer/Publisher’s Note: The statements, opinions and data contained in all publications are solely those of the individual author(s) and contributor(s) and not of MDPI and/or the editor(s). MDPI and/or the editor(s) disclaim responsibility for any injury to people or property resulting from any ideas, methods, instructions or products referred to in the content.

