
Database of Potential Promoter Sequences in the Capsicum annuum Genome


Simple Summary
Abstract
1. Introduction
2. Materials and Methods
2.1. Selection and Filtering of Promoter Sequences
2.2. Construction of Promoter Sequence Classes
2.3. Search for PPSs in the C. annuum Genome
3. Results
3.1. Promoter Sequence Classes in the C. annuum Genome
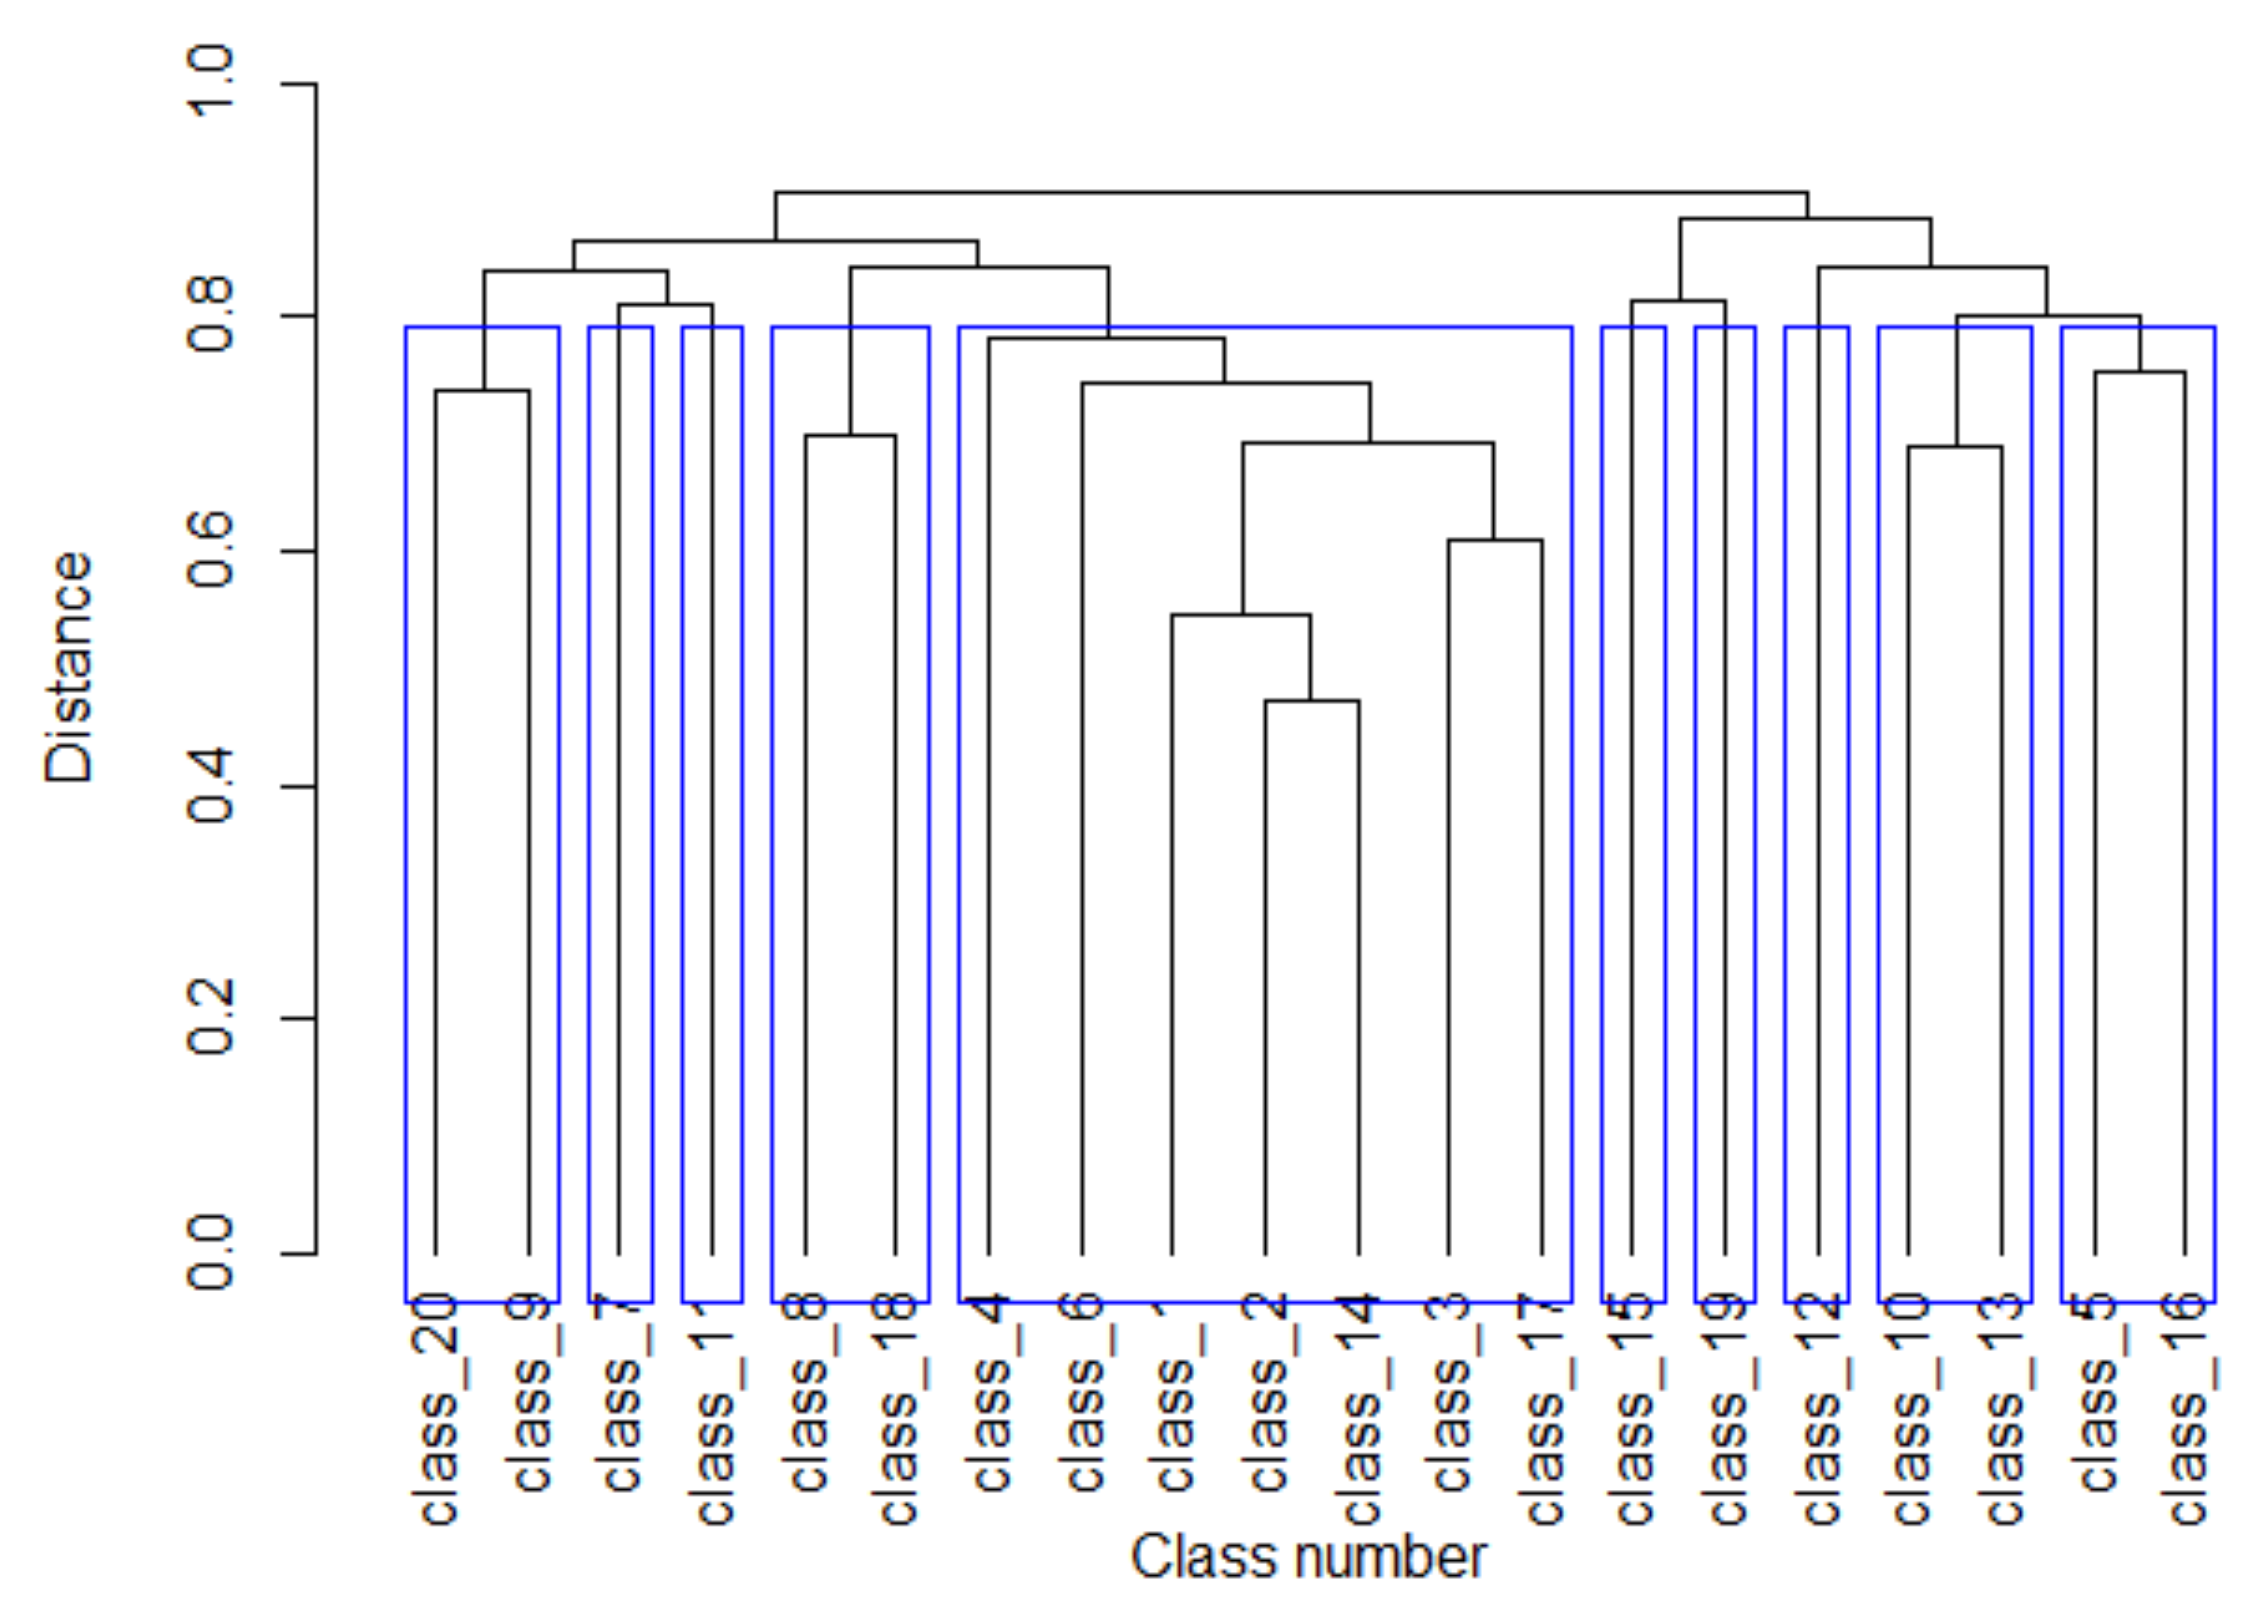
3.2. Clustering of Promoter Classes
3.3. Search for Potential Promoter Sequences in the C. annuum Genome
3.4. Identification of PPSs in the C. annuum Genome Using TSSFinder
3.5. Search for Intersections of PPSs and Short Interspersed Nuclear Elements (SINEs) in the C. annuum Genome
3.6. PPS Database
4. Discussion
Supplementary Materials
Author Contributions
Funding
Institutional Review Board Statement
Informed Consent Statement
Data Availability Statement
Conflicts of Interest
References
- Tiwary, B.K. Biological Databases. In Bioinformatics and Computational Biology: A Primer for Biologists; Springer: Singapore, 2022; pp. 11–31. ISBN 978-981-16-4241-8. [Google Scholar]
- Hernández-Pérez, T.; Gómez-García, M.d.R.; Valverde, M.E.; Paredes-López, O. Capsicum Annuum (Hot Pepper): An Ancient Latin-American Crop with Outstanding Bioactive Compounds and Nutraceutical Potential. A Review. Compr. Rev. Food Sci. Food Saf. 2020, 19, 2972–2993. [Google Scholar] [CrossRef] [PubMed]
- Qin, C.; Yu, C.; Shen, Y.; Fang, X.; Chen, L.; Min, J.; Cheng, J.; Zhao, S.; Xu, M.; Luo, Y.; et al. Whole-Genome Sequencing of Cultivated and Wild Peppers Provides Insights into Capsicum Domestication and Specialization. Proc. Natl. Acad. Sci. USA 2014, 111, 5135–5140. [Google Scholar] [CrossRef] [PubMed]
- Smale, S.T.; Kadonaga, J.T. The RNA Polymerase II Core Promoter. Annu. Rev. Biochem. 2003, 72, 449–479. [Google Scholar] [CrossRef] [PubMed]
- Juven-Gershon, T.; Kadonaga, J.T. Regulation of Gene Expression via the Core Promoter and the Basal Transcriptional Machinery. Dev. Biol. 2010, 339, 225–229. [Google Scholar] [CrossRef]
- Banerjee, S.; Bhandary, P.; Woodhouse, M.; Sen, T.Z.; Wise, R.P.; Andorf, C.M. FINDER: An Automated Software Package to Annotate Eukaryotic Genes from RNA-Seq Data and Associated Protein Sequences. BMC Bioinform. 2021, 22, 205. [Google Scholar] [CrossRef]
- Martin, R.G.; Gillette, W.K.; Rosner, J.L. Promoter Discrimination by the Related Transcriptional Activators MarA and SoxS: Differential Regulation by Differential Binding. Mol. Microbiol. 2000, 35, 623–634. [Google Scholar] [CrossRef]
- Shir-Shapira, H.; Sloutskin, A.; Adato, O.; Ovadia-Shochat, A.; Ideses, D.; Zehavi, Y.; Kassavetis, G.; Kadonaga, J.T.; Unger, R.; Juven-Gershon, T. Identification of Evolutionarily Conserved Downstream Core Promoter Elements Required for the Transcriptional Regulation of Fushi Tarazu Target Genes. PLoS ONE 2019, 14, e0215695. [Google Scholar] [CrossRef]
- Lightbody, G.; Haberland, V.; Browne, F.; Taggart, L.; Zheng, H.; Parkes, E.; Blayney, J.K. Review of Applications of High-Throughput Sequencing in Personalized Medicine: Barriers and Facilitators of Future Progress in Research and Clinical Application. Brief. Bioinform. 2019, 20, 1795–1811. [Google Scholar] [CrossRef]
- Georgakilas, G.K.; Perdikopanis, N.; Hatzigeorgiou, A. Solving the Transcription Start Site Identification Problem with ADAPT-CAGE: A Machine Learning Algorithm for the Analysis of CAGE Data. Sci. Rep. 2020, 10, 877. [Google Scholar] [CrossRef]
- Valen, E.; Pascarella, G.; Chalk, A.; Maeda, N.; Kojima, M.; Kawazu, C.; Murata, M.; Nishiyori, H.; Lazarevic, D.; Motti, D.; et al. Genome-Wide Detection and Analysis of Hippocampus Core Promoters Using DeepCAGE. Genome Res. 2009, 19, 255–265. [Google Scholar] [CrossRef]
- Cassiano, M.H.A.; Silva-Rocha, R. Benchmarking Bacterial Promoter Prediction Tools: Potentialities and Limitations. mSystems 2020, 5, e00439-20. [Google Scholar] [CrossRef]
- Périer, R.C.; Junier, T.; Bucher, P. The Eukaryotic Promoter Database EPD. Nucleic Acids Res. 1998, 26, 353–357. [Google Scholar] [CrossRef]
- Dreos, R.R.; Ambrosini, G.; Groux, R.; Cavin Périer, R.; Bucher, P.; Perier, R.C.; Bucher, P. The Eukaryotic Promoter Database in Its 30th Year: Focus on Non-Vertebrate Organisms. Nucleic Acids Res. 2017, 45, D51–D55. [Google Scholar] [CrossRef]
- Oubounyt, M.; Louadi, Z.; Tayara, H.; To Chong, K. Deepromoter: Robust Promoter Predictor Using Deep Learning. Front. Genet. 2019, 10, 286. [Google Scholar] [CrossRef]
- Datta, S.; Mukhopadhyay, S. A Composite Method Based on Formal Grammar and DNA Structural Features in Detecting Human Polymerase II Promoter Region. PLoS ONE 2013, 8, e0054843. [Google Scholar] [CrossRef]
- Amin, R.; Rahman, C.R.; Ahmed, S.; Sifat, M.H.R.; Liton, M.N.K.; Rahman, M.M.; Khan, M.Z.H.; Shatabda, S.; Ahmed, S. IPromoter-BnCNN: A Novel Branched CNN-Based Predictor for Identifying and Classifying Sigma Promoters. Bioinformatics 2020, 36, 4869–4875. [Google Scholar] [CrossRef]
- Shujaat, M.; Wahab, A.; Tayara, H.; Chong, K.T. PcPromoter-CNN: A CNN-Based Prediction and Classification of Promoters. Genes 2020, 11, 1529. [Google Scholar] [CrossRef]
- Solovyev, V.V.; Shahmuradov, I.A.; Salamov, A.A. Identification of Promoter Regions and Regulatory Sites. Methods Mol. Biol. 2010, 674, 57–83. [Google Scholar] [CrossRef]
- De Jong, A.; Pietersma, H.; Cordes, M.; Kuipers, O.P.; Kok, J. PePPER: A Webserver for Prediction of Prokaryote Promoter Elements and Regulons. BMC Genom. 2012, 13, 299. [Google Scholar] [CrossRef]
- Di Salvo, M.; Pinatel, E.; Talà, A.; Fondi, M.; Peano, C.; Alifano, P. G4PromFinder: An Algorithm for Predicting Transcription Promoters in GC-Rich Bacterial Genomes Based on AT-Rich Elements and G-Quadruplex Motifs. BMC Bioinform. 2018, 19, 36. [Google Scholar] [CrossRef]
- Umarov, R.; Kuwahara, H.; Li, Y.; Gao, X.; Solovyev, V.; Hancock, J. Promoter Analysis and Prediction in the Human Genome Using Sequence-Based Deep Learning Models. Bioinformatics 2019, 35, 2730–2737. [Google Scholar] [CrossRef]
- Wang, S.; Cheng, X.; Li, Y.; Wu, M.; Zhao, Y. Image-Based Promoter Prediction: A Promoter Prediction Method Based on Evolutionarily Generated Patterns. Sci. Rep. 2018, 8, 17695. [Google Scholar] [CrossRef]
- De Medeiros Oliveira, M.; Bonadio, I.; Lie De Melo, A.; Mendes Souza, G.; Durham, A.M. TSSFinder-Fast and Accurate Ab Initio Prediction of the Core Promoter in Eukaryotic Genomes. Brief. Bioinform. 2021, 22, bbab198. [Google Scholar] [CrossRef]
- Bondar, E.I.; Troukhan, M.E.; Krutovsky, K.V.; Tatarinova, T.V. Genome-Wide Prediction of Transcription Start Sites in Conifers. Int. J. Mol. Sci. 2022, 23, 1735. [Google Scholar] [CrossRef]
- Korotkov, E.V.; Suvorova, Y.M.; Kostenko, D.O.; Korotkova, M.A. Multiple Alignment of Promoter Sequences from the Arabidopsis Thaliana l. Genome. Genes 2021, 12, 135. [Google Scholar] [CrossRef]
- Korotkov, E.V.; Suvorova, Y.M.; Nezhdanova, A.V.; Gaidukova, S.E.; Yakovleva, I.V.; Kamionskaya, A.M.; Korotkova, M.A. Mathematical Algorithm for Identification of Eukaryotic Promoter Sequences. Symmetry 2021, 13, 917. [Google Scholar] [CrossRef]
- Pugacheva, V.; Korotkov, A.; Korotkov, E. Search of Latent Periodicity in Amino Acid Sequences by Means of Genetic Algorithm and Dynamic Programming. Stat. Appl. Genet. Mol. Biol. 2016, 15, 381–400. [Google Scholar] [CrossRef]
- Trinklein, N.D.; Force Aldred, S.; Hartman, S.J.; Schroeder, D.I.; Otillar, R.P.; Myers, R.M. An Abundance of Bidirectional Promoters in the Human Genome. Genome Res. 2004, 14, 62–66. [Google Scholar] [CrossRef]
- Shahmuradov, I.A.; Umarov, R.K.; Solovyev, V.V. TSSPlant: A New Tool for Prediction of Plant Pol II Promoters. Nucleic Acids Res. 2017, 45, e65. [Google Scholar] [CrossRef]
- Mahadevan, I.; Ghosh, I. Analysis of E.Coli Promoter Structures Using Neural Networks. Nucleic Acids Res. 1994, 22, 2158–2165. [Google Scholar] [CrossRef]
- Lin, H.; Li, Q.Z. Eukaryotic and Prokaryotic Promoter Prediction Using Hybrid Approach. Theory Biosci. 2011, 130, 91–100. [Google Scholar] [CrossRef] [PubMed]
- Reese, M.G.; MG, R.; Reese, M.G. Application of a Time-Delay Neural Network to Promoter Annotation in the Drosophila Melanogaster Genome. Comput. Chem. 2001, 26, 51–56. [Google Scholar] [CrossRef]
- Zhu, Y.; Li, F.; Xiang, D.; Akutsu, T.; Song, J.; Jia, C. Computational Identification of Eukaryotic Promoters Based on Cascaded Deep Capsule Neural Networks. Brief. Bioinform. 2021, 22, bbaa299. [Google Scholar] [CrossRef] [PubMed]
- Prestridge, D.S. Predicting Pol II Promoter Sequences Using Transcription Factor Binding Sites. J. Mol. Biol. 1995, 249, 923–932. [Google Scholar] [CrossRef]
- Xiao, X.; Xu, Z.C.; Qiu, W.R.; Wang, P.; Ge, H.T.; Chou, K.C. IPSW(2L)-PseKNC: A Two-Layer Predictor for Identifying Promoters and Their Strength by Hybrid Features via Pseudo K-Tuple Nucleotide Composition. Genomics 2019, 111, 1785–1793. [Google Scholar] [CrossRef]
- Petrovskaya, O.V.; Petrovskiy, E.D.; Lavrik, I.N.; Ivanisenko, V.A. A Study of Structural Properties of Gene Network Graphs for Mathematical Modeling of Integrated Mosaic Gene Networks. J. Bioinform. Comput. Biol. 2017, 15, 1650045. [Google Scholar] [CrossRef]
- Gmurman, V. Fundamentals of Probability Theory and Mathematical Statistics; American Elsevier Publishing Co.: New York, NY, USA, 1968; ISBN 0592039315. [Google Scholar]
- Mahpour, A.; Scruggs, B.S.; Smiraglia, D.; Ouchi, T.; Gelman, I.H. A Methyl-Sensitive Element Induces Bidirectional Transcription in TATA-Less CpG Island-Associated Promoters. PLoS ONE 2018, 13, e0205608. [Google Scholar] [CrossRef]
- Frenkel, F.E.; Korotkov, E.V. Using Triplet Periodicity of Nucleotide Sequences for Finding Potential Reading Frame Shifts in Genes. DNA Res. 2009, 16, 105–114. [Google Scholar] [CrossRef]
- Zhou, X.; Ruan, J.; Wang, G.; Zhang, W. Characterization and Identification of MicroRNA Core Promoters in Four Model Species. Comput. Chem. 2007, 3, e37. [Google Scholar] [CrossRef]
- Alles, J.; Fehlmann, T.; Fischer, U.; Backes, C.; Galata, V.; Minet, M.; Hart, M.; Abu-Halima, M.; Grässer, F.A.; Lenhof, H.P.; et al. An Estimate of the Total Number of True Human MiRNAs. Nucleic Acids Res. 2019, 47, 3353–3364. [Google Scholar] [CrossRef]
- Manuweera, B.; Reynolds, G.; Kahanda, I. Computational Methods for the Ab Initio Identification of Novel Micro RNA in Plants: A Systematic Review. PeerJ Comput. Sci. 2019, 2019, e233. [Google Scholar] [CrossRef]
- Yona, A.H.; Alm, E.J.; Gore, J. Random Sequences Rapidly Evolve into de Novo Promoters. Nat. Commun. 2018, 9, 1530. [Google Scholar] [CrossRef]
- Van Oss, S.B.; Carvunis, A.R. De Novo Gene Birth. PLoS Genet. 2019, 15, e1008160. [Google Scholar] [CrossRef]
- McLysaght, A.; Guerzoni, D. New Genes from Non-Coding Sequence: The Role of de Novo Protein-Coding Genes in Eukaryotic Evolutionary Innovation. Philos. Trans. R. Soc. B Biol. Sci. 2015, 370, 20140332. [Google Scholar] [CrossRef]


| Class № | Number of Elements | Class № | Number of Elements |
|---|---|---|---|
| 1 | 5402 | 11 | 203 |
| 2 | 1976 | 12 | 176 |
| 3 | 993 | 13 | 171 |
| 4 | 695 | 14 | 159 |
| 5 | 515 | 15 | 141 |
| 6 | 400 | 16 | 129 |
| 7 | 390 | 17 | 118 |
| 8 | 321 | 18 | 118 |
| 9 | 230 | 19 | 117 |
| 10 | 214 | 20 | 106 |
| Results | Z Level | ||||
|---|---|---|---|---|---|
| ≥ 5.0 | ≥ 5.5 | ≥ 6.0 | ≥ 6.5 | ≥ 7.0 | |
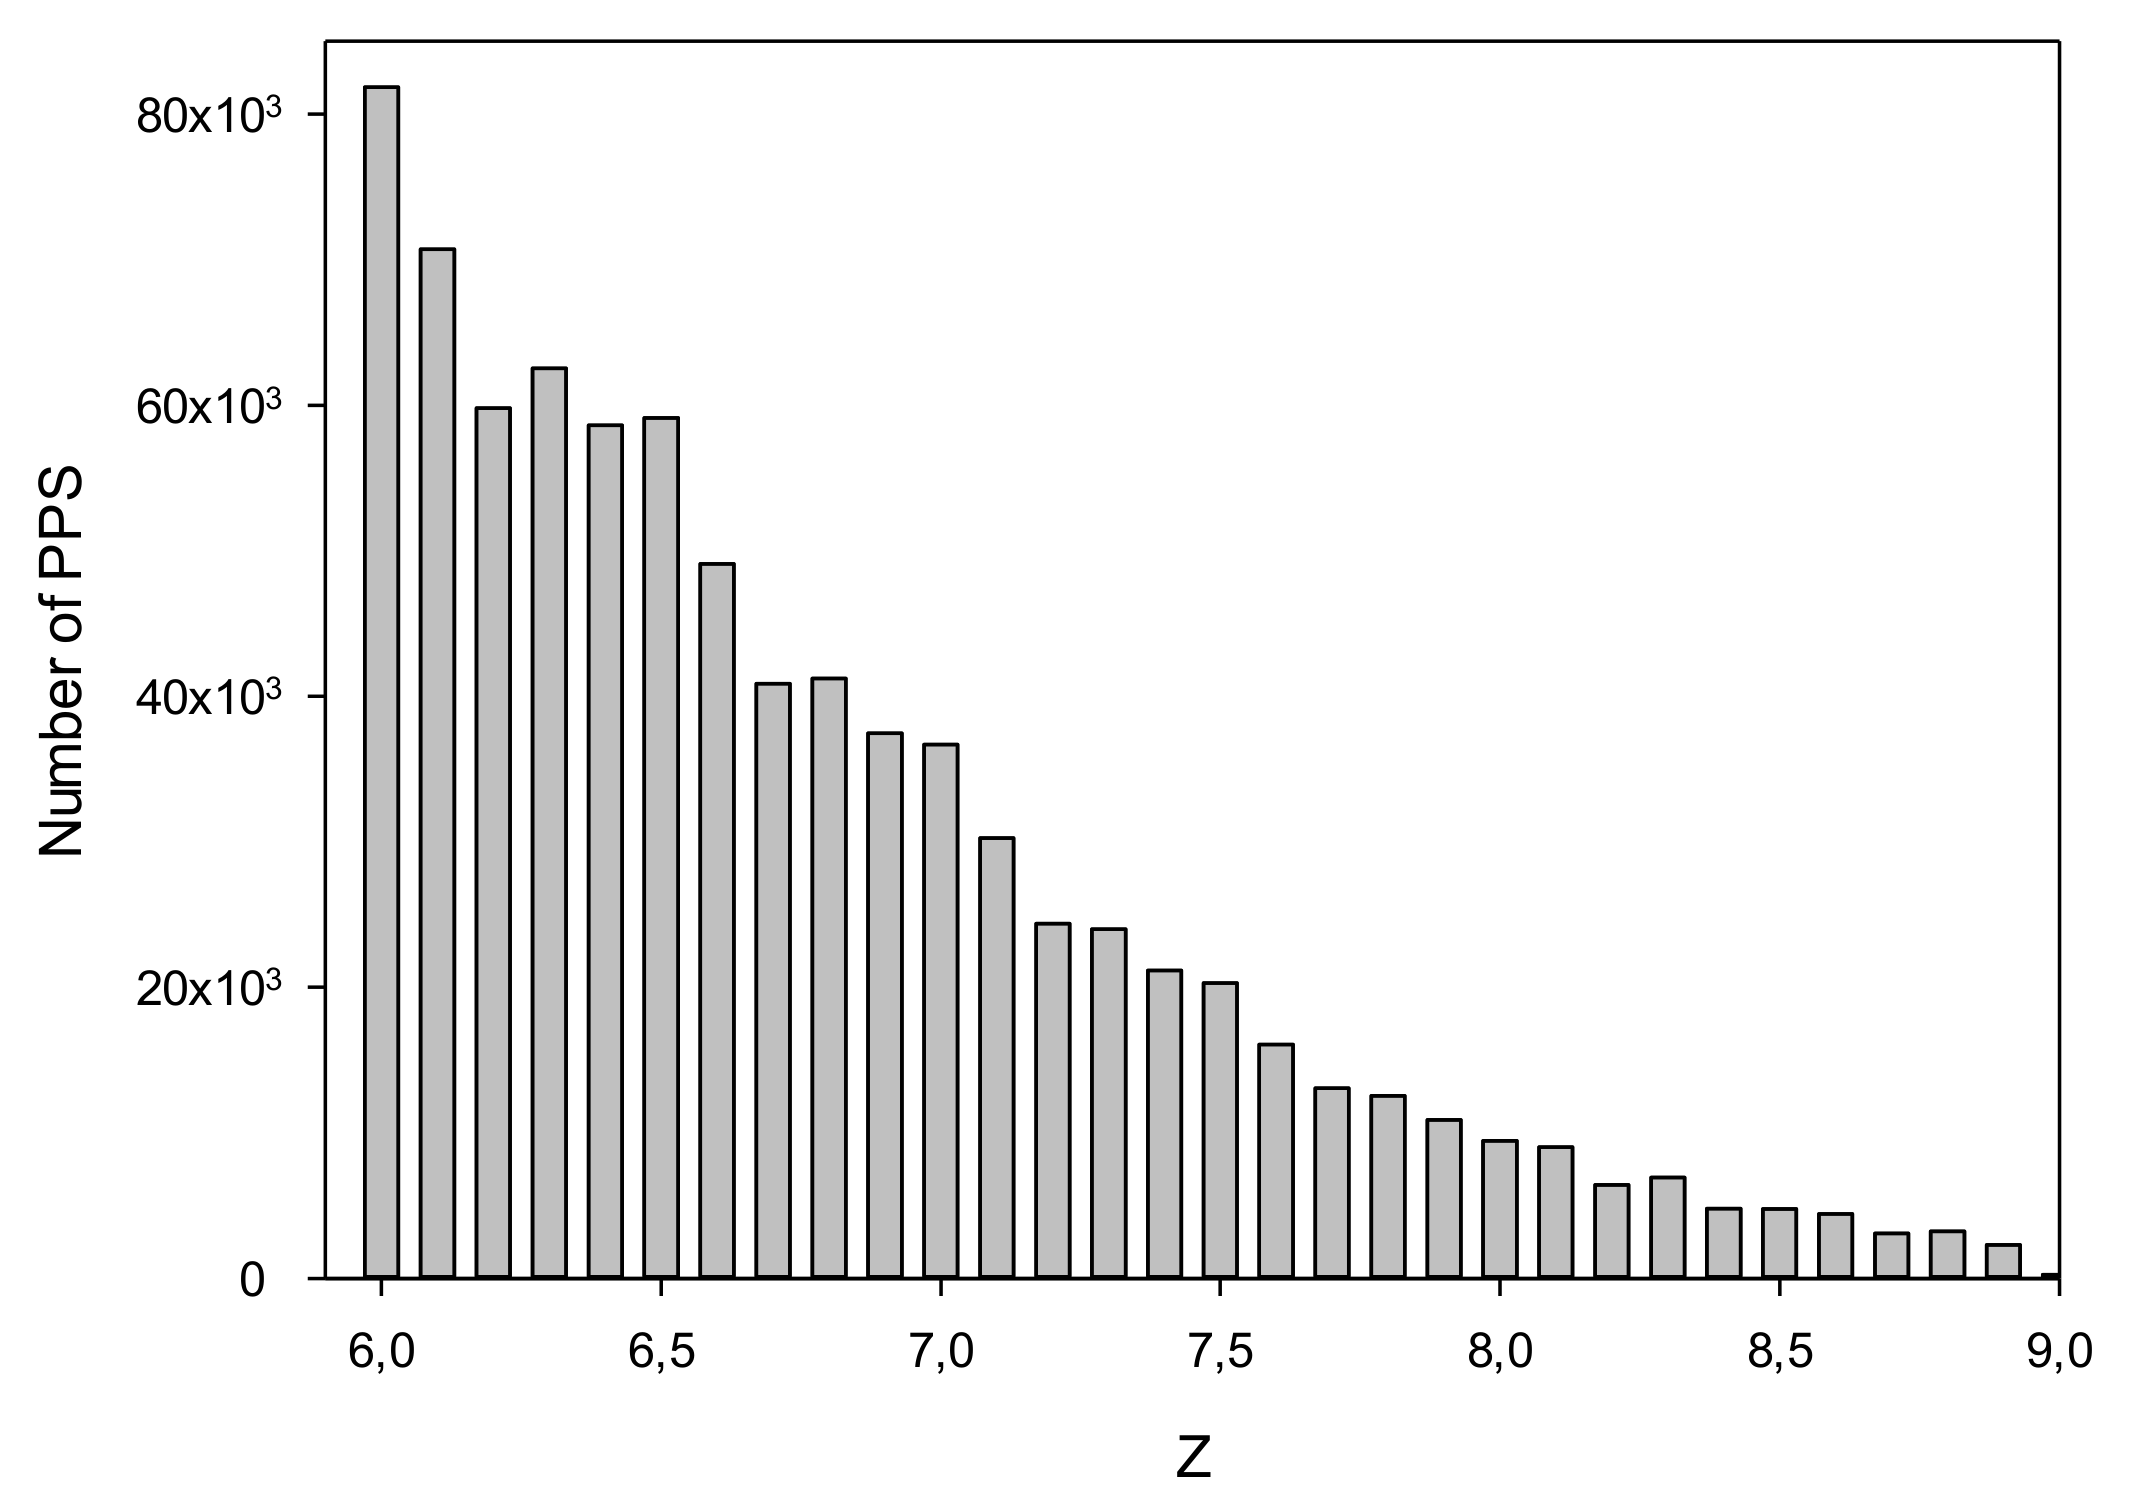
| Real sequences | 1,679,534 | 1,242,664 | 825,136 | 491,647 | 263,864 |
| Random sequences | 20,490 | 5064 | 1068 | 221 | 44 |
| FDR | 1.21% | 0.41% | 0.13% | 0.04% | 0.02% |
| Chromosome № | Annotated Genes (n) | Matches in the Strands of Annotated Promoters and PPSs (n) * | Total Matches (n) | % of Matches | |||
|---|---|---|---|---|---|---|---|
| ++ | −− | +− | −+ | ||||
| 1 | 2161 | 431 | 387 | 53 | 38 | 909 | 42% |
| 2 | 1759 | 294 | 420 | 56 | 25 | 795 | 45% |
| 3 | 1988 | 426 | 325 | 21 | 50 | 822 | 41% |
| 4 | 1269 | 220 | 286 | 31 | 29 | 566 | 45% |
| 5 | 1054 | 240 | 145 | 11 | 32 | 428 | 41% |
| 6 | 1555 | 425 | 185 | 14 | 110 | 734 | 47% |
| 7 | 1231 | 223 | 223 | 22 | 28 | 496 | 40% |
| 8 | 649 | 113 | 124 | 9 | 15 | 261 | 40% |
| 9 | 1104 | 187 | 241 | 58 | 14 | 500 | 45% |
| 10 | 1075 | 223 | 180 | 19 | 49 | 471 | 44% |
| 11 | 1166 | 187 | 198 | 22 | 30 | 437 | 37% |
| 12 | 1274 | 215 | 222 | 26 | 31 | 494 | 39% |
| Total | 16,285 | 3184 | 2936 | 342 | 451 | 6913 | 42% |
| Chromosome № | A. thaliana | O. sativa | H. sapiens | |||
|---|---|---|---|---|---|---|
| All PSSs | TATA-Containing PSSs | All PSSs | TATA-Containing PSSs | All PSSs | TATA-Containing PSSs | |
| 1 | 46 | 9 | 8 | 0 | 16 | 0 |
| 2 | 38 | 3 | 7 | 0 | 15 | 0 |
| 3 | 60 | 13 | 17 | 0 | 12 | 0 |
| 4 | 37 | 8 | 6 | 0 | 15 | 0 |
| 5 | 61 | 13 | 13 | 0 | 21 | 0 |
| 6 | 72 | 18 | 11 | 0 | 16 | 0 |
| 7 | 49 | 10 | 13 | 0 | 19 | 0 |
| 8 | 60 | 10 | 10 | 0 | 18 | 0 |
| 9 | 41 | 4 | 7 | 0 | 21 | 0 |
| 10 | 65 | 9 | 10 | 0 | 25 | 0 |
| 11 | 52 | 7 | 13 | 0 | 15 | 0 |
| 12 | 48 | 11 | 10 | 0 | 20 | 0 |
| Total | 629 | 115 | 125 | 0 | 213 | 0 |
Publisher’s Note: MDPI stays neutral with regard to jurisdictional claims in published maps and institutional affiliations. |
© 2022 by the authors. Licensee MDPI, Basel, Switzerland. This article is an open access article distributed under the terms and conditions of the Creative Commons Attribution (CC BY) license (https://creativecommons.org/licenses/by/4.0/).
Share and Cite
Rudenko, V.; Korotkov, E. Database of Potential Promoter Sequences in the Capsicum annuum Genome. Biology 2022, 11, 1117. https://doi.org/10.3390/biology11081117
Rudenko V, Korotkov E. Database of Potential Promoter Sequences in the Capsicum annuum Genome. Biology. 2022; 11(8):1117. https://doi.org/10.3390/biology11081117
Chicago/Turabian StyleRudenko, Valentina, and Eugene Korotkov. 2022. "Database of Potential Promoter Sequences in the Capsicum annuum Genome" Biology 11, no. 8: 1117. https://doi.org/10.3390/biology11081117
APA StyleRudenko, V., & Korotkov, E. (2022). Database of Potential Promoter Sequences in the Capsicum annuum Genome. Biology, 11(8), 1117. https://doi.org/10.3390/biology11081117