
Temporal Skin Temperature as an Indicator of Cardiorespiratory Fitness Assessed with Selected Methods


Abstract
:Simple Summary
Abstract
1. Introduction
2. Material and Methods
2.1. Participants
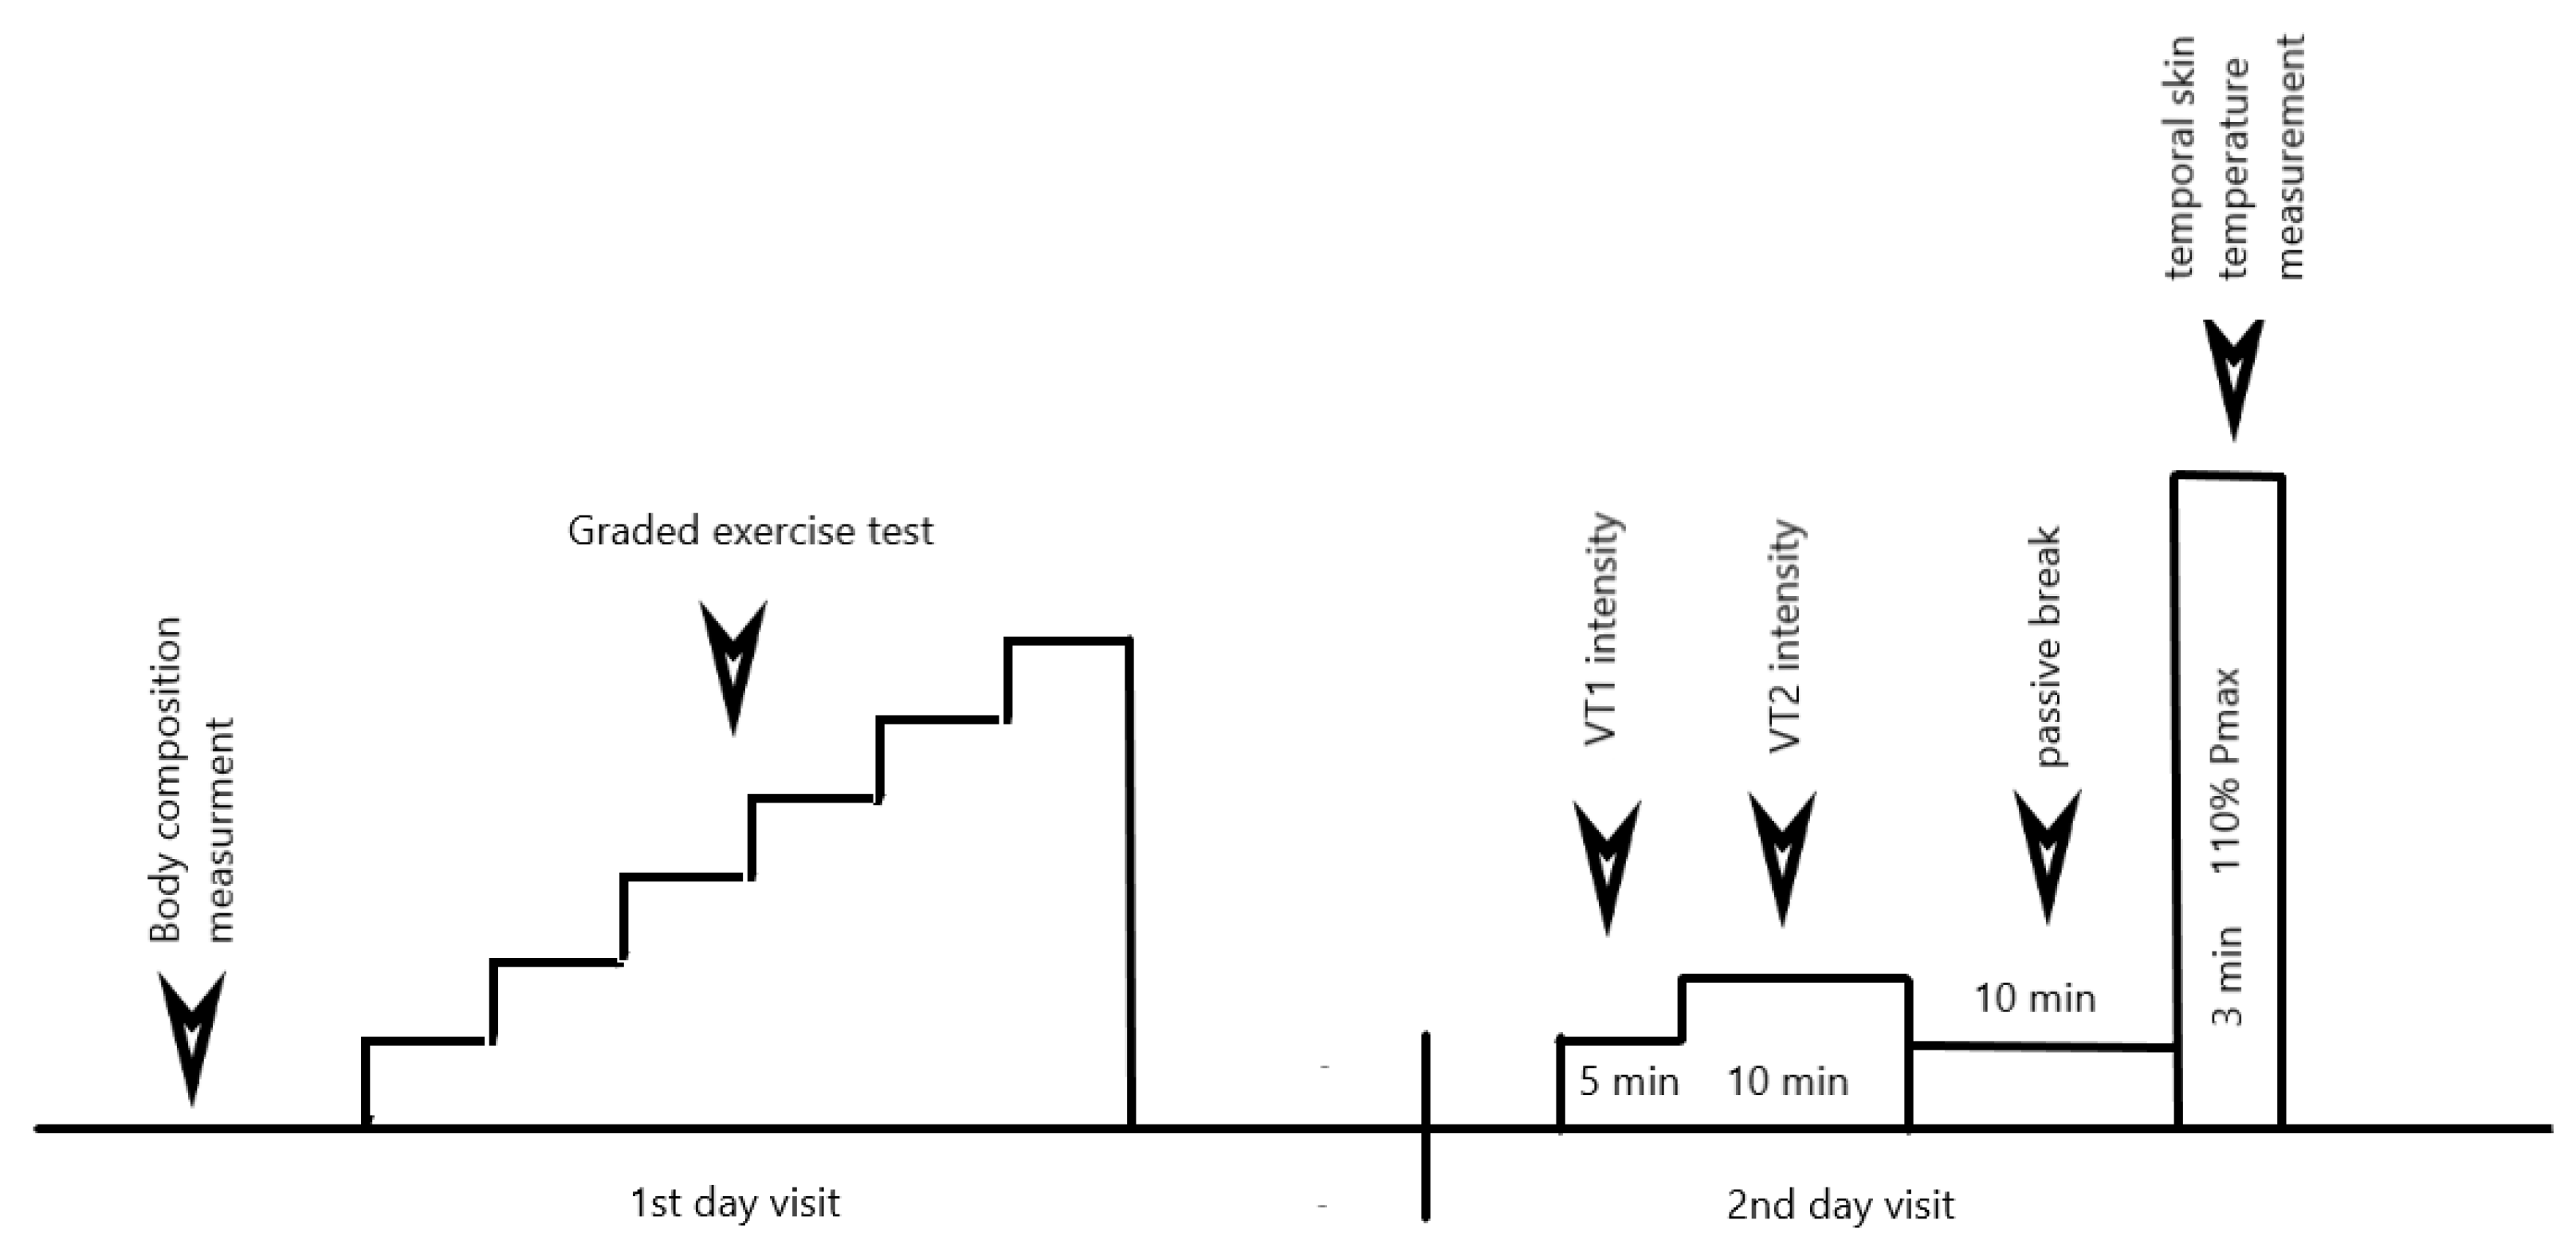
2.2. Study Design
2.2.1. Body Composition
2.2.2. Graded Exercise Test (GXT)
2.2.3. Test at 110% of Pmax
2.3. Statistical Analysis
3. Results
4. Discussion
5. Conclusions
Author Contributions
Funding
Institutional Review Board Statement
Informed Consent Statement
Data Availability Statement
Conflicts of Interest
References
- Clausen, J.S.R.; Marott, J.L.; Holtermann, A.; Gyntelberg, F.; Jensen, M.T. Midlife cardiorespiratory fitness and the long-term risk of mortality: 46 years of follow-up. J. Am. Coll. Cardiol. 2018, 72, 987–995. [Google Scholar] [CrossRef] [PubMed]
- Levine, B.D. VO2max: What do we know, and what do we still need to know? J. Physiol. 2008, 586, 25–34. [Google Scholar] [CrossRef] [PubMed]
- De Lorenzo, A.; Da Silva, C.L.; Castro Souza, F.C.; De Souza, L.; Lima, R. Value of the oxygen pulse curve for the diagnosis of coronary artery disease. Physiol. Res. 2018, 67, 679–686. [Google Scholar] [CrossRef] [PubMed]
- Lopes, A.J.; Vigário, P.S.; Hora, A.L.; Deus, C.A.L.; Soares, M.S.; Guimaraes, F.S.; Ferreira, A.S. Ventilation distribution, pulmonary diffusion and peripheral muscle endurance as determinants of exercise intolerance in elderly patients with chronic obstructive pulmonary disease. Physiol. Res. 2018, 67, 863–874. [Google Scholar] [CrossRef] [PubMed]
- Daanen, H.A.; Lamberts, R.P.; Kallen, V.L.; Jin, A.; Van Meeteren, N.L. A systematic review on heart-rate recovery to monitor changes in training status in athletes. Int. J. Sports Physiol. Perform. 2012, 7, 251–260. [Google Scholar] [CrossRef] [PubMed] [Green Version]
- Suzic Lazic, J.; Dekleva, M.; Soldatovic, I.; Leischik, R.; Suzic, S.; Radovanovic, D.; Djuric, B.; Nesic, D.; Lazic, M.; Mazic, S. Heart rate recovery in elite athletes: The impact of age and exercise capacity. Clin. Physiol. Funct. Imaging 2017, 37, 117–123. [Google Scholar] [CrossRef] [PubMed]
- Watson, A.M.; Brickson, S.L.; Prawda, E.R.; Sanfilippo, J.L. Shortterm heart rate recovery is related to aerobic fitness in elite intermittent sport athletes. J. Strength Cond. Res. 2017, 31, 1055–1061. [Google Scholar] [CrossRef]
- Facioli, T.P.; Philbois, S.V.; Gastaldi, A.C.; Almeida, D.S.; Maida, K.D.; Rodrigues, J.A.L.; Sanchez-Delgado, J.C.; Souza, H.C.D. Study of heart rate recovery and cardiovascular autonomic modulation in healthy participants after submaximal exercise. Sci. Rep. 2021, 11, 3620. [Google Scholar] [CrossRef]
- Arena, R.; Arrowood, J.A.; Fei, D.; Shelar, S.; Helm, S.; Kraft, K.A. The influence of sex on the relationship between heart rate recovery and other cardiovascular risk factors in apparently healthy subjects. Scand. J. Med. Sci. Sports 2010, 20, 291–297. [Google Scholar] [CrossRef]
- Sawka, M.N.; Convertino, V.A.; Eichner, E.R.; Schnieder, S.M.; Young, A.J. Blood volume: Importance and adaptations to exercise training, environmental stresses, and trauma/sickness. Med. Sci. Sports Exerc. 2000, 32, 332–348. [Google Scholar] [CrossRef]
- Johnson, J.M. Physical training and the control of skin blood flow. Med. Sci. Sports Exerc. 1998, 30, 382–386. [Google Scholar] [CrossRef] [PubMed]
- Fisher, J.P.; Young, C.N.; Fadel, P.J. Autonomic adjustments to exercise in human. Compr. Physiol. 2015, 5, 475–512. [Google Scholar] [CrossRef] [PubMed]
- Berkin, K.E.; Walker, G.; Inglis, G.C.; Ball, S.G.; Thomson, N.C. Circulating adrenaline and noradrenaline concentrations during exercise in patients with exercise induced asthma and normal subjects. Thorax 1988, 43, 295–299. [Google Scholar] [CrossRef] [PubMed] [Green Version]
- Johnson, J.M. Exercise and the cutaneous circulation. Exerc. Sport Sci. Rev. 1992, 20, 59–97. [Google Scholar]
- Kamon, E.; Belding, H.S. Dermal blood flow in the resting arm during prolonged leg exercise. J. Appl. Physiol. 1969, 26, 317–320. [Google Scholar] [CrossRef]
- Simmons, G.H.; Padilla, J.; Young, C.N.; Wong, B.J.; Lang, J.A.; Davis, M.J.; Laughlin, M.H.; Fadel, P.J. Increased brachial artery retrograde shear rate at exercise onset is abolished during prolonged cycling: Role of thermoregulatory vasodilation. J. Appl. Physiol. 2011, 110, 389–397. [Google Scholar] [CrossRef] [Green Version]
- Ichinose, M.; Saito, M.; Fujii, N.; Ogawa, T.; Hayashi, K.; Kondo, N.; Nishiyasu, T. Modulation of the control of muscle sympathetic nerve activity during incremental leg cycling. J. Physiol. 2008, 586, 2753–2766. [Google Scholar] [CrossRef]
- Katayama, K.; Ishida, K.; Saito, M.; Koiko, T.; Hirasawa, A.; Ogoh, S. Enhanced muscle pump during mild dynamic leg exercise inhibits sympathetic vasomotor outflow. Physiol. Rep. 2014, 2, e12070. [Google Scholar] [CrossRef] [Green Version]
- Katayama, K.; Kaur, J.; Young, B.E.; Barbosa, T.C.; Ogoh, S.; Fadel, P.J. High-intensity muscle metaboreflex activation attenuates cardiopulmonary baroreflex-mediated inhibition of muscle sympathetic nerve activity. J. Appl. Physiol. 2018, 125, 812–819. [Google Scholar] [CrossRef]
- McNamara, T.C.; Keen, J.T.; Simmons, G.H.; Alexander, L.M.; Wong, B.J. Endothelial nitric oxide synthase mediates the nitric oxide component of reflex cutaneous vasodilatation during dynamic exercise in humans. J. Physiol. 2014, 592, 5317–5326. [Google Scholar] [CrossRef] [Green Version]
- Kenney, W.L.; Johnson, J.M. Control of skin blood flow during exercise. Med. Sci. Sports Exerc. 1992, 24, 303–312. [Google Scholar] [CrossRef]
- Smith, C.J.; Johnson, J.M. Responses to hyperthermia. Optimizing heat dissipation by convection and evaporation: Neural control of skin blood flow and sweating in humans. Auton. Neurosci. 2016, 196, 25–36. [Google Scholar] [CrossRef] [PubMed]
- Roberts, M.F.; Wenger, C.B.; Stolwijk, J.A.; Nadel, E.R. Skin blood flow and sweating changes following exercise training and heat acclimation. J. Appl. Physiol. Respir. Environ. Exerc. Physiol. 1977, 43, 133–137. [Google Scholar] [CrossRef] [PubMed]
- Torii, M.; Yamasaki, M.; Sasaki, T.; Nakayama, H. Fall in skin temperature of exercising man. Br. J. Sports Med. 1992, 26, 29–32. [Google Scholar] [CrossRef] [PubMed]
- Hebisz, R.; Hebisz, P.; Borkowski, J.; Wierzbicka-Damska, I.; Zatoń, M. Relationship between the skin surface temperature changes during sprint interval testing protocol and the aerobic capacity in well-trained cyclists. Physiol. Res. 2019, 68, 981–989. [Google Scholar] [CrossRef] [PubMed]
- Gofur, E.M.; Bordoni, B. Anatomy, Head and Neck, Cerebral Blood Flow; StatPearls Publishing: Treasure Island, FL, USA, 2019. [Google Scholar]
- Hebisz, R.; Hebisz, P.; Borkowski, J.; Zatoń, M. Differences in physiological responses to interval training in cyclists with and without interval training experience. J. Hum. Kinet. 2016, 50, 93–101. [Google Scholar] [CrossRef] [PubMed]
- Follador, L.; Alves, R.C.; Ferreira, S.D.S.; Buzzachera, C.F.; Andrade, V.F.D.S.; Garcia, E.D.S.A.; Osiecki, R.; Barbosa, S.C.; de Oliveira, L.M.; da Silva, S.G. Physiological, perceptual, and affective responses to six high-intensity interval training protocols. Percept. Mot. Skills 2018, 125, 329–350. [Google Scholar] [CrossRef]
- Buchheit, M.; Laursen, P.B. High-intensity interval training, solutions to the programming puzzle: Part I: Cardiopulmonary emphasis. Sports Med. 2013, 43, 313–338. [Google Scholar] [CrossRef]
- Murawska-Cialowicz, E.; Wojna, J.; Zuwala-Jagiello, J. Crossfit training changes brain-derived neurotrophic factor and irisin levels at rest, after Wingate and progressive tests, and improves aerobic capacity and body composition of young physically active men and women. J. Physiol. Pharmacol. 2015, 66, 811–821. [Google Scholar]
- Fukada, D.H.; Wray, M.E.; Kendall, K.L.; Smith-Ryan, A.E.; Stout, J.R. Validity of near-infrared interactance (FUTREX 6100/XL) for estimating body fat percentage in elite rowers. Clin. Physiol. Funct. Imaging 2017, 37, 456–458. [Google Scholar]
- Hebisz, P.; Jastrzębska, A.D.; Hebisz, R. Real assessment of maximum oxygen uptake as a verification after an incremental test versus without a test. Front. Physiol. 2021, 12, e739745. [Google Scholar] [CrossRef] [PubMed]
- Jeukendrup, A.; Saris, W.H.; Brouns, F.; Kester, A.D. A new validated endurance performance test. Med. Sci. Sports Exerc. 1996, 28, 266–270. [Google Scholar] [CrossRef] [PubMed] [Green Version]
- Beaver, W.L.; Wasserman, K.; Whipp, B.J. A new method for detecting anaerobic threshold by gas exchange. J. Appl. Physiol. 1986, 60, 2020–2027. [Google Scholar] [CrossRef] [PubMed]
- Davis, J.A.; Whipp, B.J.; Wasserman, K. The relation of ventilation to metabolic rate during moderate exercise in man. Eur. J. Appl. Physiol. Occup. Physiol. 1980, 44, 97–108. [Google Scholar] [CrossRef]
- Buchheit, M.; Al Haddad, H.; Laursen, P.B.; Ahmaidi, S. Effect of body posture on postexercise parasympathetic reactivation in men. Exp. Physiol. 2009, 94, 795–804. [Google Scholar] [CrossRef]
- Peçanha, T.; de Paula-Ribeiro, M.; Nasario-Junior, O.; de Lima, J.R. Post-exercise heart rate variability recovery: A time-frequency analysis. Acta Cardiol. 2013, 68, 607–613. [Google Scholar] [CrossRef]
- Hopkins, W.G.; Marshall, S.W.; Batterham, A.M.; Hanin, J. Progressive statistics for studies in sports medicine and exercise science. Med. Sci. Sports Exerc. 2009, 41, 3–13. [Google Scholar] [CrossRef] [Green Version]
- Tanda, G. The use of infrared thermography to detect the skin temperature response to physical activity. J. Phys. Conf. Ser. 2015, 655, 012062. [Google Scholar] [CrossRef] [Green Version]
- Knyszyńska, A.; Radecka, A.; Lubkowska, A. Thermal imaging of exercise-associated skin temperature changes in swimmers subjected to 2-min intensive exercise on a VASA swim bench ergometer. Int. J. Environ. Res. Public Health 2021, 18, 6493. [Google Scholar] [CrossRef]
- Hawley, J.A.; Noakes, T.D. Peak power output predicts maximal oxygen uptake and performance time in trained cyclists. Eur. J. Appl. Physiol. Occup. Physiol. 1992, 65, 79–83. [Google Scholar] [CrossRef]
- Wernhart, S.; Guazzi, M.; Halle, M. Correlation of heart rate recovery, aerobic physical activity and performance. A sub-analysis of the EURO-Ex trial. Dtsch. Z. Sportmed. 2020, 71, 19–24. [Google Scholar] [CrossRef]
- Gore, C.J.; Withers, R.T. The effect of exercise intensity and duration on the oxygen deficit and excess post-exercise oxygen consumption. Eur. J. Appl. Physiol. Occup. Physiol. 1990, 60, 169–174. [Google Scholar] [CrossRef] [PubMed]
- Kang, S.J.; Ko, K.J. Association between resting heart rate, VO2max and carotid intima-media thickness in middle-aged men. Int. J. Cardiol. Heart Vasc. 2019, 23, 100347. [Google Scholar] [CrossRef] [PubMed]
- Jabbour, G.; Majed, L. Mechanical efficiency at different exercise intensities among adolescent boys with different body fat levels. Front. Physiol. 2019, 10, 265. [Google Scholar] [CrossRef] [Green Version]
- Kenny, G.P.; Jay, O. Thermometry, calorimetry, and mean body temperature during heat stress. Compr. Physiol. 2013, 3, 1689–1719. [Google Scholar]
- Kenny, G.P.; McGinn, R. Restoration of thermoregulation after exercise. J. Appl. Physiol. 2017, 122, 933–944. [Google Scholar] [CrossRef]
- Hargreaves, M.; Spriet, L.L. Skeletal muscle energy metabolism during exercise. Nat. Metab. 2020, 2, 817–828. [Google Scholar] [CrossRef]
- Sawka, M.N.; Wenger, C.B. Physiological responses to acute exercise-heat stress. In Human Performance Physiology and Environmental Medicine at Terrestrial Extremes; Pandolf, K.B., Sawka, M.N., Gonzalez, R.R., Eds.; Benchmark: Indianapolis, IN, USA, 1988; pp. 97–151. [Google Scholar]
- Kenny, G.P.; Reardon, F.D.; Zaleski, W.; Reardon, M.L.; Haman, F.; Ducharme, M.B. Muscle temperature transients before, during, and after exercise measured using an intramuscular multisensor probe. J. Appl. Physiol. 2003, 94, 2350–2357. [Google Scholar] [CrossRef] [Green Version]
- Wang, J.S. Effects of exercise training and detraining on cutaneous microvascular function in man: The regulatory role of endothelium-dependent dilation in skin vasculature. Eur. J. Appl. Physiol. 2005, 93, 429–434. [Google Scholar] [CrossRef]
- Boegli, Y.; Gremion, G.; Golay, S.; Kubli, S.; Liaudet, L.; Leyvraz, P.F.; Waeber, B.; Feihl, F. Endurance training enhances vasodilation induced by nitric oxide in human skin. J. Investig. Dermatol. 2003, 121, 1197–1204. [Google Scholar] [CrossRef] [Green Version]
- Fritzsche, R.G.; Coyle, E.F. Cutaneous blood flow during exercise is higher in endurance-trained humans. J. Appl. Physiol. 2000, 88, 738–744. [Google Scholar] [CrossRef] [PubMed] [Green Version]
- Hagberg, J.M.; Goldberg, A.P.; Lakatta, L.; O’Connor, F.C.; Becker, L.C.; Lakatta, E.G.; Fleg, J.L. Expanded blood volumes contribute to the increased cardiovascular performance of endurance-trained older men. J. Appl. Physiol. 1998, 85, 484–489. [Google Scholar] [CrossRef] [PubMed] [Green Version]
- Dawson, E.A.; Green, D.J.; Gable, N.T.; Thijssen, D.H. Effects of acute exercise on flow mediated ditatation in healthy humans. J. Appl. Physiol. 2013, 115, 1589–1598. [Google Scholar] [CrossRef] [PubMed]
- Périard, J.D.; Racinais, S.; Sawka, M.N. Adaptations and mechanisms of human heat acclimation: Applications for competitive athletes and sports. Scand. J. Med. Sci. Sports 2015, 25 (Suppl. 1), 20–38. [Google Scholar] [CrossRef]
- Wendt, D.; van Loon, L.J.; Lichtenbelt, W.D. Thermoregulation during exercise in the heat: Strategies for maintaining health and performance. Sports Med. 2007, 37, 669–682. [Google Scholar] [CrossRef]
- Neves, E.B.; Vilaca-Alves, J.; Antunes, N.; Felisberto, I.M.; Rosa, C.; Reis, V.M. Different responses of the skin temperature to physical exercise: Systematic review. In Proceedings of the 2015 37th Annual International Conference of the IEEE Engineering in Medicine and Biology Society (EMBC), Milan, Italy, 25–29 August 2015; pp. 1307–1310. [Google Scholar] [CrossRef]
- Possamai, L.T.; Campos, F.S.; Salvador, P.C.D.N.; de Aguiar, R.A.; Guglielmo, L.G.A.; de Lucas, R.D.; Caputo, F.; Turnes, T. Similar maximal oxygen uptake assessment from a step cycling incremental test and verification tests on the same or different day. Appl. Physiol. Nutr. Metab. 2020, 45, 357–361. [Google Scholar] [CrossRef]
- Scharhag-Rosenberger, F.; Carlsohn, A.; Cassel, M.; Mayer, F.; Scharhag, J. How to test maximal oxygen uptake: A study on timing and testing procedure of a supramaximal verification test. Appl. Physiol. Nutr. Metab. 2011, 36, 153–160. [Google Scholar] [CrossRef]
- Astorino, T.A.; DeRevere, J. Efficacy of constant load verification testing to confirm VO2 max attainment. Clin. Physiol. Funct. Imaging 2018, 38, 703–709. [Google Scholar] [CrossRef]
- Michael, S.; Graham, K.S.; Davis, G.M. Cardiac autonomic responses during exercise and post-exercise recovery using heart rate variability and systolic time Intervals—A review. Front. Physiol. 2017, 8, 301. [Google Scholar] [CrossRef] [Green Version]
- Flouris, A.D.; Bravi, A.; Wright-Beatty, H.E.; Green, G.; Seely, A.J.; Kenny, G.P. Heart rate variability during exertional heat stress: Effects of heat production and treatment. Eur. J. Appl. Physiol. 2014, 114, 785–792. [Google Scholar] [CrossRef]
- Peçanha, T.; Forjaz, C.L.M.; Low, D.A. Passive heating attenuates post-exercise cardiac autonomic recovery in healthy young males. Front. Neurosci. 2017, 11, 727. [Google Scholar] [CrossRef]
- Green, H.J.; Patla, A.E. Maximal aerobic power: Neuromuscular and metabolic considerations. Med. Sci. Sports Exerc. 1992, 24, 38–46. [Google Scholar] [CrossRef] [PubMed]
- Bertuzzi, R.; Nascimento, E.M.; Urso, R.P.; Damasceno, M.; Lima-Silva, A.E. Energy system contributions during incremental exercise test. J. Sports Sci. Med. 2013, 12, 454–460. [Google Scholar]
- Denham, J.; Scott-Hamilton, J.; Hagstrom, A.D.; Gray, A.J. Cycling power outputs predict functional threshold power and maximum oxygen uptake. J. Strength Cond. Res. 2020, 34, 3489–3497. [Google Scholar] [CrossRef] [PubMed]
- Ogoh, S.; Ainslie, P.N. Cerebral blood flow during exercise: Mechanisms of regulation. J. Appl. Physiol. 2009, 107, 1370–1380. [Google Scholar] [CrossRef] [PubMed] [Green Version]

| VO2max | Pmax | Age (y) | BM (kg) | LBM (kg) | BH (cm) |
|---|---|---|---|---|---|
| 59.03 ± 11.19 | 332.5 ± 48.4 | 22.8 ± 5.4 | 71.5 ± 10.4 | 64.3 ± 8.6 | 179 ± 8.1 |
| Items | X ± SD | Lower 95%CI | Upper 95%CI |
|---|---|---|---|
| Tempb (°C) | 33.0 ± 2.5 | 31.9 | 34.0 |
| Tempe (°C) | 30.8 ± 2.5 * | 29.7 | 31.9 |
| Tempr (°C) | 32.6 ± 2.6 ** | 31.5 | 33.7 |
| T1 (°C) | −2.2 ± 1.1 | −2.7 | −1.7 |
| T2 (°C) | −0.6 ± 1.3 | −1.2 | 0.0 |
| T3 (°C) | 1.7 ± 1.0 | 1.3 | 2.1 |
| Pmax (W) | 332.5 ± 48.4 | 311.6 | 353.5 |
| Pmax·LBM−1 (W·kg−1) | 5.27 ± 1.04 | 4.82 | 5.72 |
| VO2peak1 (mL·min−1·kg−1) | 55.56 ± 13.02 | 49.93 | 61.19 |
| VO2peak2 (mL·min−1·kg−1) | 58.25 ± 10.82 | 53.57 | 62.93 |
| VO2max (mL·min−1·kg−1) | 59.03 ± 11.19 | 54.19 | 63.87 |
| VO2max·LBM−1 (mL·min−1·kg−1) | 65.35 ± 11.21 | 60.50 | 70.20 |
| Items | T1 (°C) | T2 (°C) | T3 (°C) |
|---|---|---|---|
| Pmax (W) | −0.33 | 0.11 | 0.63 * |
| Pmax·LBM−1 (W·kg−1) | −0.32 | 0.06 | 0.68 * |
| VO2peak1 (mL·min−1·kg−1) | −0.37 | −0.07 | 0.46 * |
| VO2peak2 (mL·min−1·kg−1) | −0.42 * | −0.01 | 0.51 * |
| VO2max (mL·min−1·kg−1) | −0.43 * | −0.05 | 0.51 * |
| VO2max·LBM−1 (mL·min−1·kg−1) | −0.42 * | −0.02 | 0.55 * |
| Items | 1′ | 2′ | 3′ | 4′ | 5′ |
|---|---|---|---|---|---|
| HRR (bpm) 95%CI L–U | 99.2 ± 17.1 91.8–106.6 | 90.5 ± 18.6 * 43.7–54.6 | 88.4 ± 16.8 * 81.2–95.7 | 86.7 ± 14.8 * 80.3–93.1 | 86.2 ± 12.5 * 80.8–91.6 |
| ΔHRR (bpm) 95%CI L–U | 49.1 ± 12.6 43.7–54.6 | 58.1 ± 13.9 * 52.1–64.2 | 60.2 ± 13.3 * 54.4–65.9 | 62.0 ± 11.2 * 57.1–66.8 | 62.4 ± 11.0 * 57.7–67.2 |
| SDNN3–5′ (ms) 95%CI L–U | --- | --- | 43.10 ± 22.46 33.39–52.81 | ||
| RMSSD3–5′ (ms) 95%CI L–U | --- | --- | 31.17 ± 19.72 22.65–39.70 | ||
| HFP3–5′ (ms2) 95%CI L–U | --- | --- | 657.1 ± 1005.7 222.2–1092.0 | ||
| LFP3–5′ (ms2) 95%CI L–U | --- | --- | 1488.2 ± 1541.9 821.5–2155.0 | ||
| Items | T1 (°C) | T2 (°C) | T3 (°C) |
|---|---|---|---|
| HRR1′ (bpm) | 0.09 | −0.28 | −0.53 * |
| ΔHRR1′ (bpm) | −0.34 | 0.11 | 0.63 * |
| HRR2′ (bpm) | 0.20 | −0.18 | −0.50 * |
| ΔHRR2′ (bpm) | −0.48 * | −0.02 | 0.57 * |
| HRR3′ (bpm) | 0.17 | −0.16 | −0.36 |
| ΔHRR3′ (bpm) | −0.44 * | −0.07 | 0.35 |
| HRR4′ (bpm) | 0.10 | −0.3 | −0.58 * |
| ΔHRR4′ (bpm) | −0.40 | 0.07 | 0.64 * |
| HRR5′ (bpm) | 0.12 | −0.48 * | −0.62 * |
| ΔHRR5′ (bpm) | −0.41 | 0.22 | 0.57 * |
| Items | T1 (°C) | T2 (°C) | T3 (°C) |
|---|---|---|---|
| SDNN3–5′ | −0.18 | 0.43 * | 0.65 * |
| RMSSD3–5′ | −0.29 | 0.36 | 0.67 * |
| HFP3–5′ | −0.22 | 0.29 | 0.53 * |
| LFP3–5′ | −0.17 | 0.31 | 0.50 * |
Publisher’s Note: MDPI stays neutral with regard to jurisdictional claims in published maps and institutional affiliations. |
© 2022 by the authors. Licensee MDPI, Basel, Switzerland. This article is an open access article distributed under the terms and conditions of the Creative Commons Attribution (CC BY) license (https://creativecommons.org/licenses/by/4.0/).
Share and Cite
Jastrzębska, A.D.; Hebisz, R.; Hebisz, P. Temporal Skin Temperature as an Indicator of Cardiorespiratory Fitness Assessed with Selected Methods. Biology 2022, 11, 948. https://doi.org/10.3390/biology11070948
Jastrzębska AD, Hebisz R, Hebisz P. Temporal Skin Temperature as an Indicator of Cardiorespiratory Fitness Assessed with Selected Methods. Biology. 2022; 11(7):948. https://doi.org/10.3390/biology11070948
Chicago/Turabian StyleJastrzębska, Agnieszka Danuta, Rafal Hebisz, and Paulina Hebisz. 2022. "Temporal Skin Temperature as an Indicator of Cardiorespiratory Fitness Assessed with Selected Methods" Biology 11, no. 7: 948. https://doi.org/10.3390/biology11070948
APA StyleJastrzębska, A. D., Hebisz, R., & Hebisz, P. (2022). Temporal Skin Temperature as an Indicator of Cardiorespiratory Fitness Assessed with Selected Methods. Biology, 11(7), 948. https://doi.org/10.3390/biology11070948