
Sexual Dimorphism in the Fibular Extremities of Italians and South Africans of Identified Modern Human Skeletal Collections: A Geometric Morphometric Approach

 ,
, 
Abstract
:Simple Summary
Abstract
1. Introduction
- (a)
- Fibular epiphyseal form (size + shape) will be sexually dimorphic, likely reflecting functional differences (body shape, size, and proportions), while shape alone will be less informative [30].
- (b)
- Fibular epiphyseal form dimorphism will differ between populations due to size variation (different patterns of epiphyseal size dimorphism due to differentiation of body size among Italian and South African groups), but shape alone will not reveal differences in the sexual dimorphism between the populations [30].
2. Materials and Methods
2.1. Sample
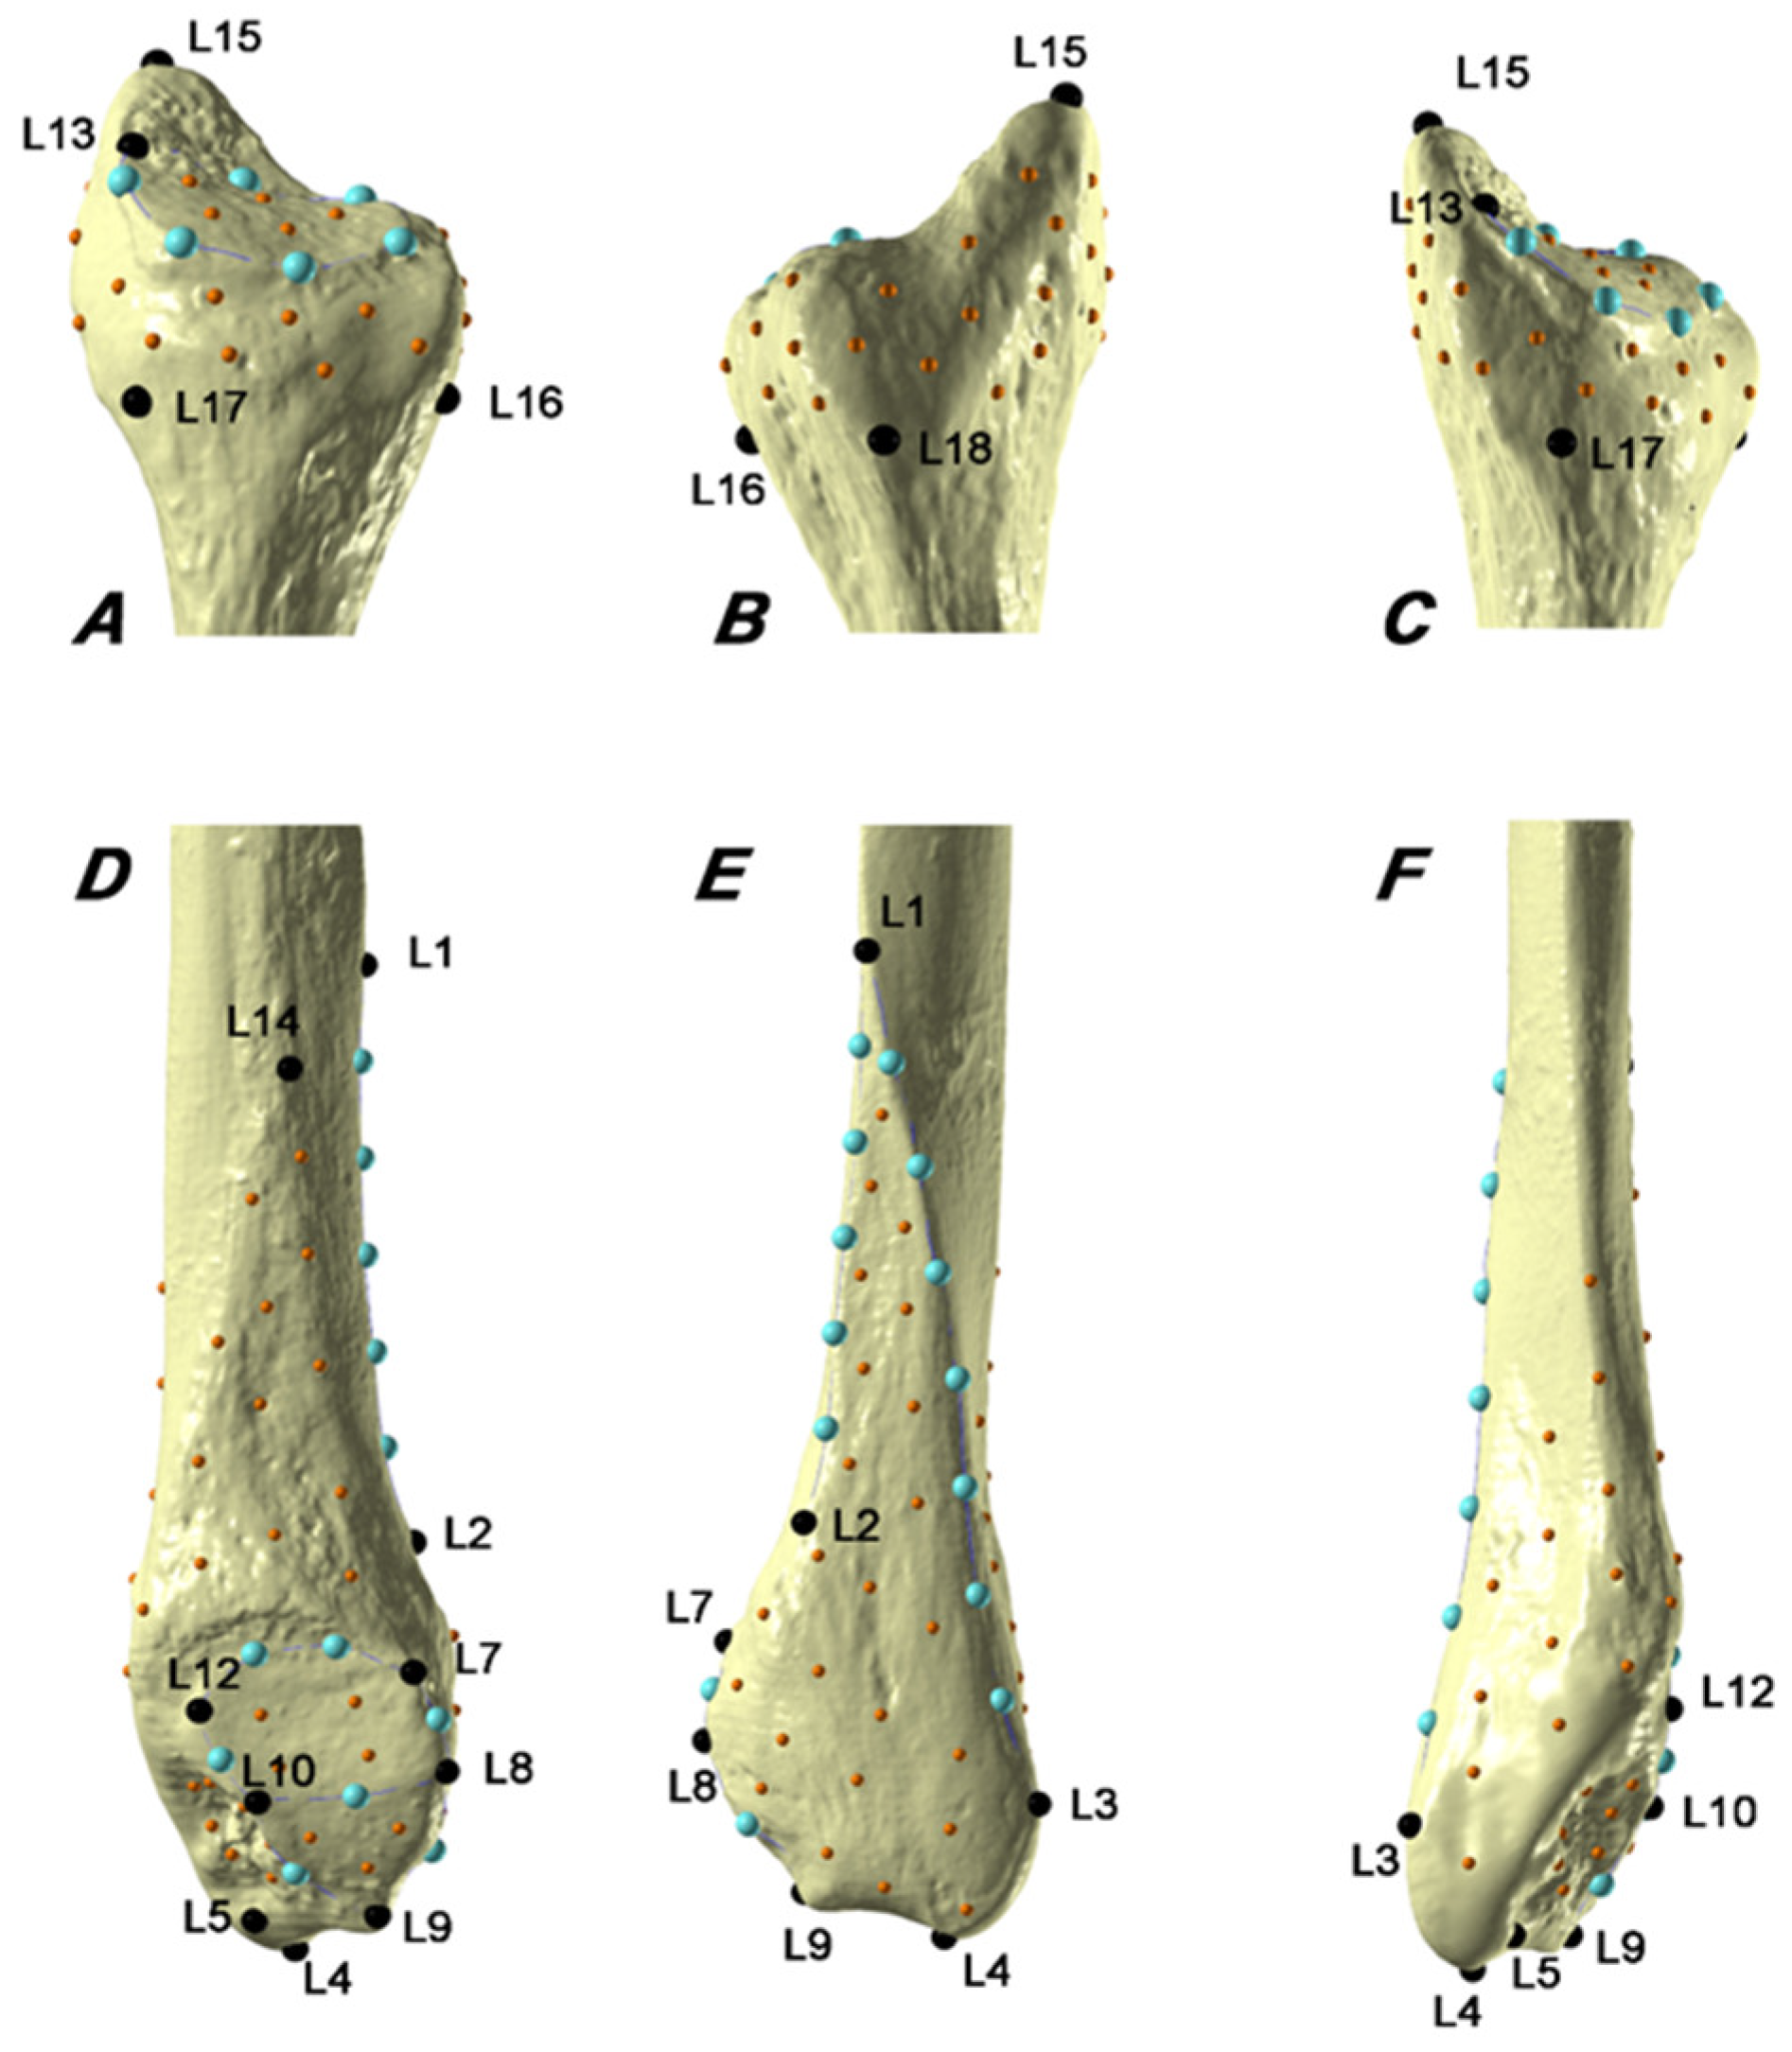
2.2. 3D Geometric Morphometric Analysis
3. Results
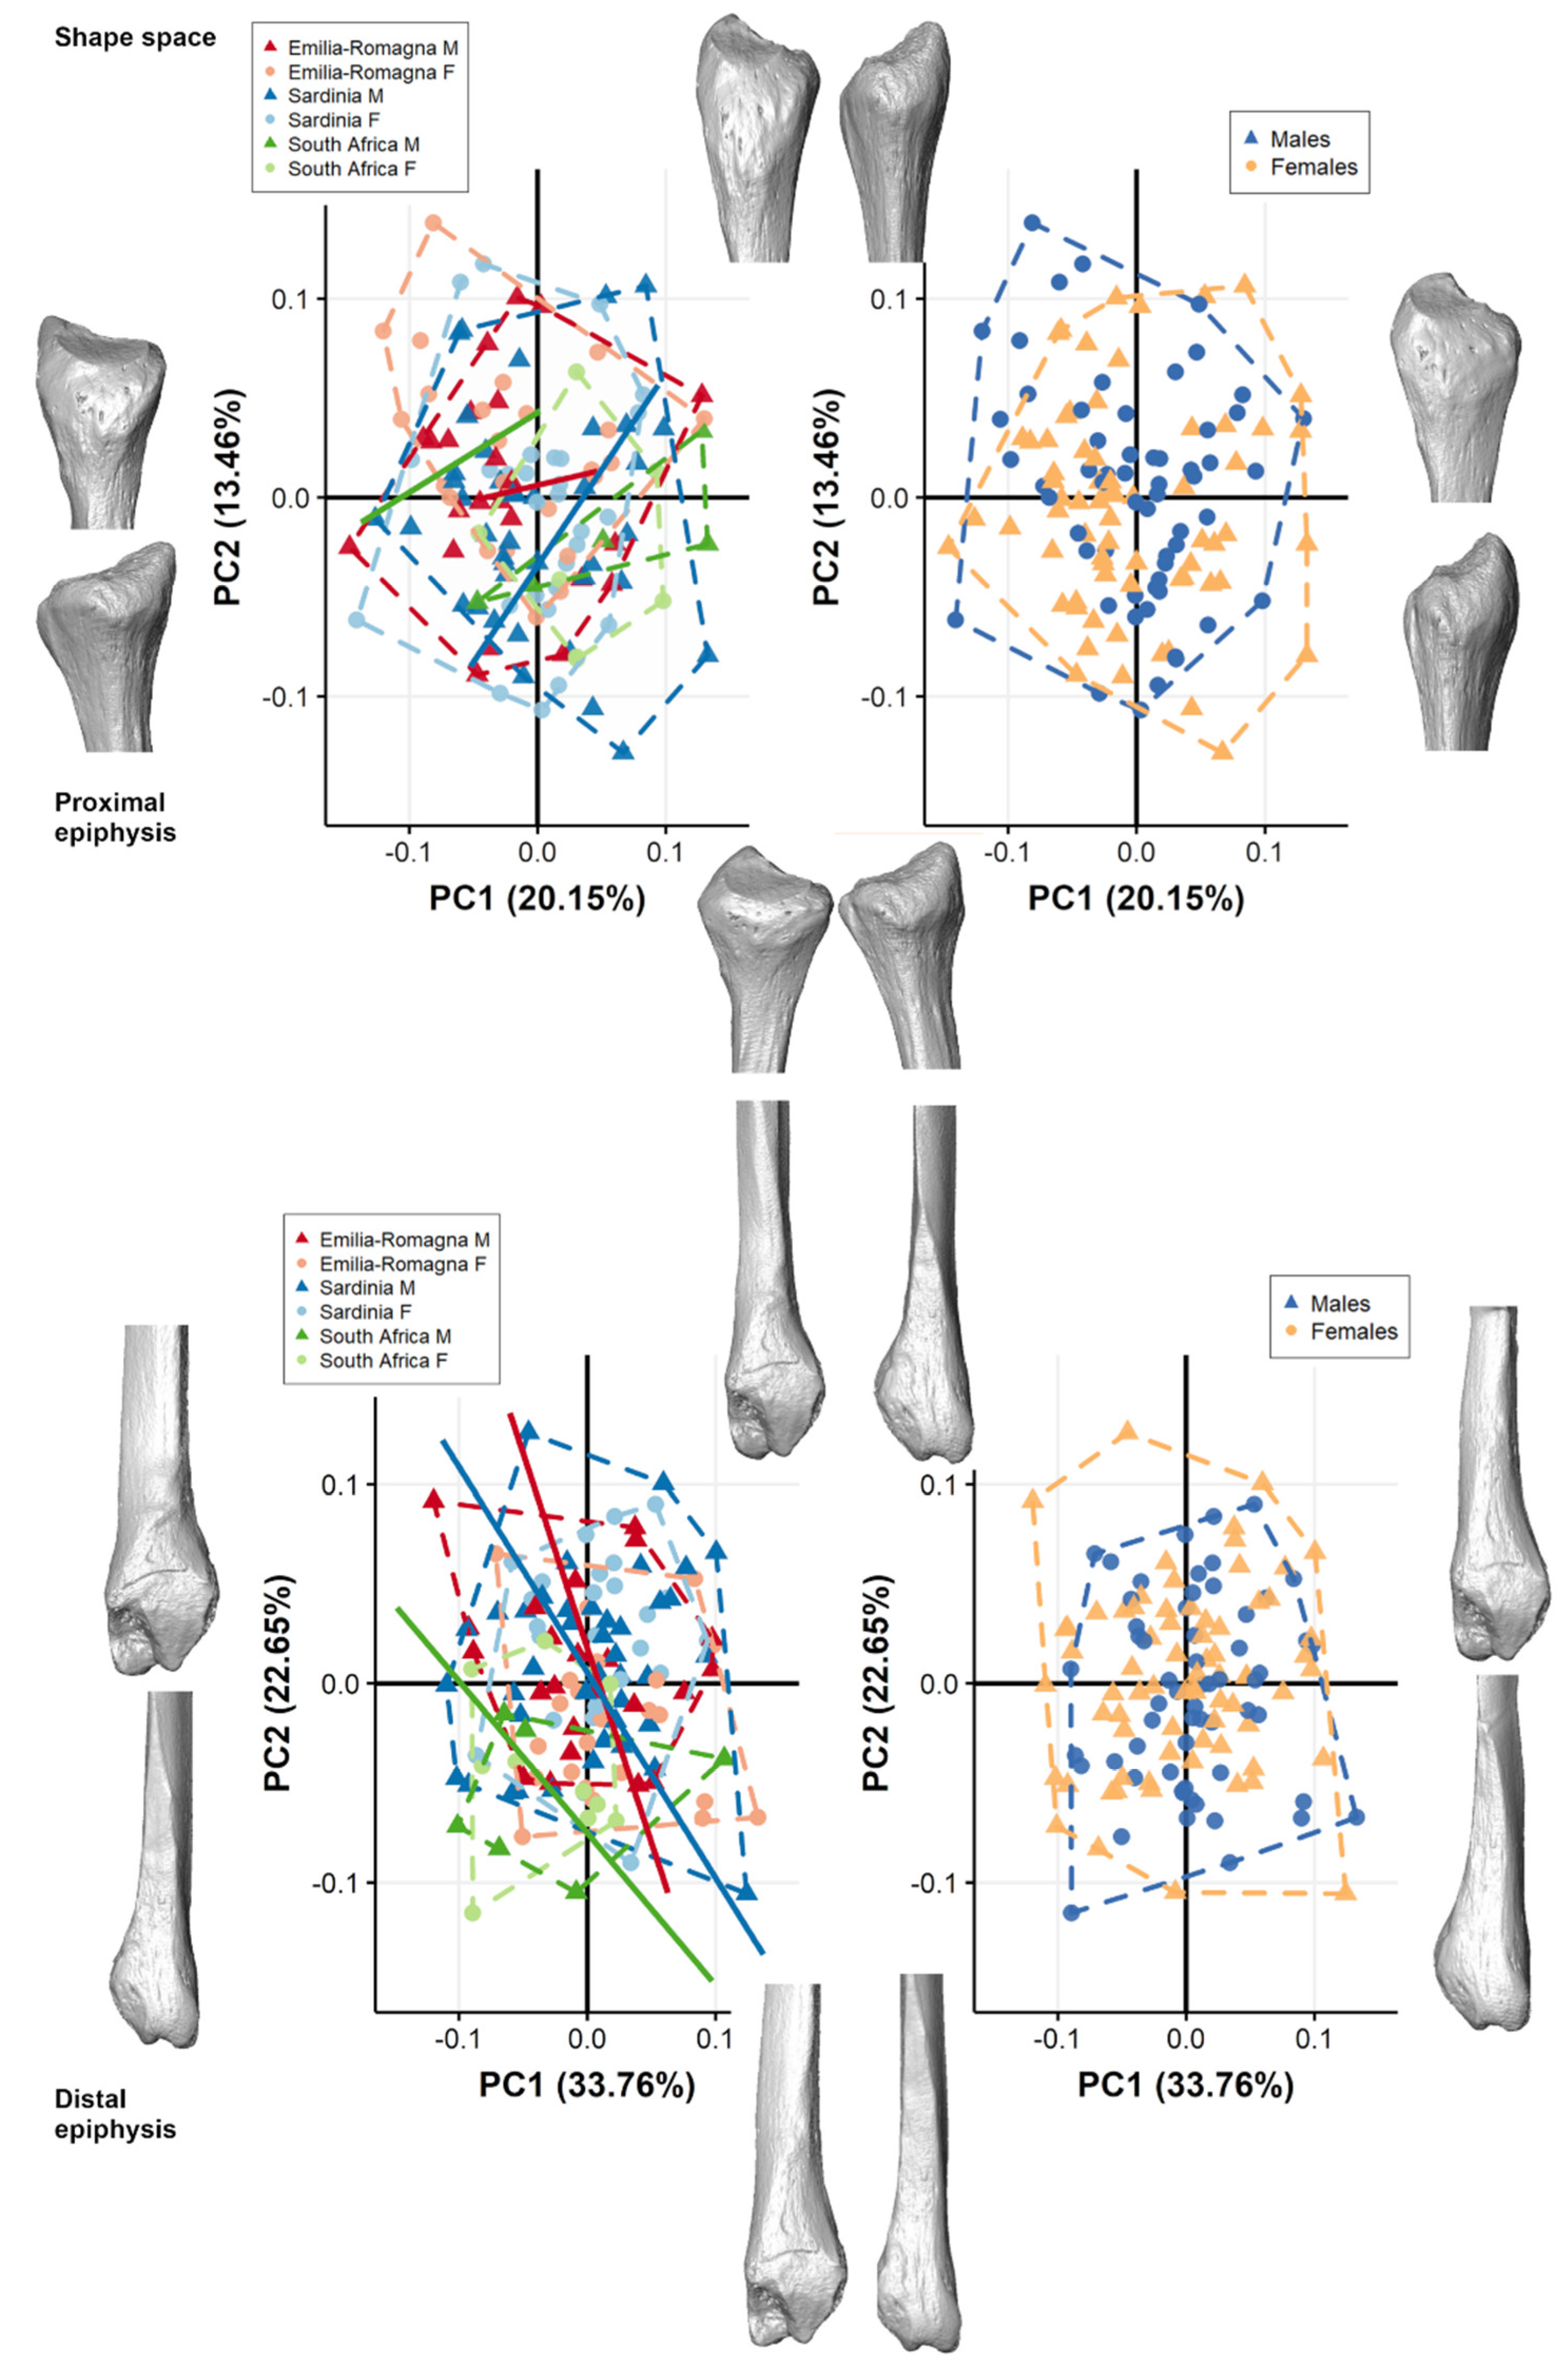
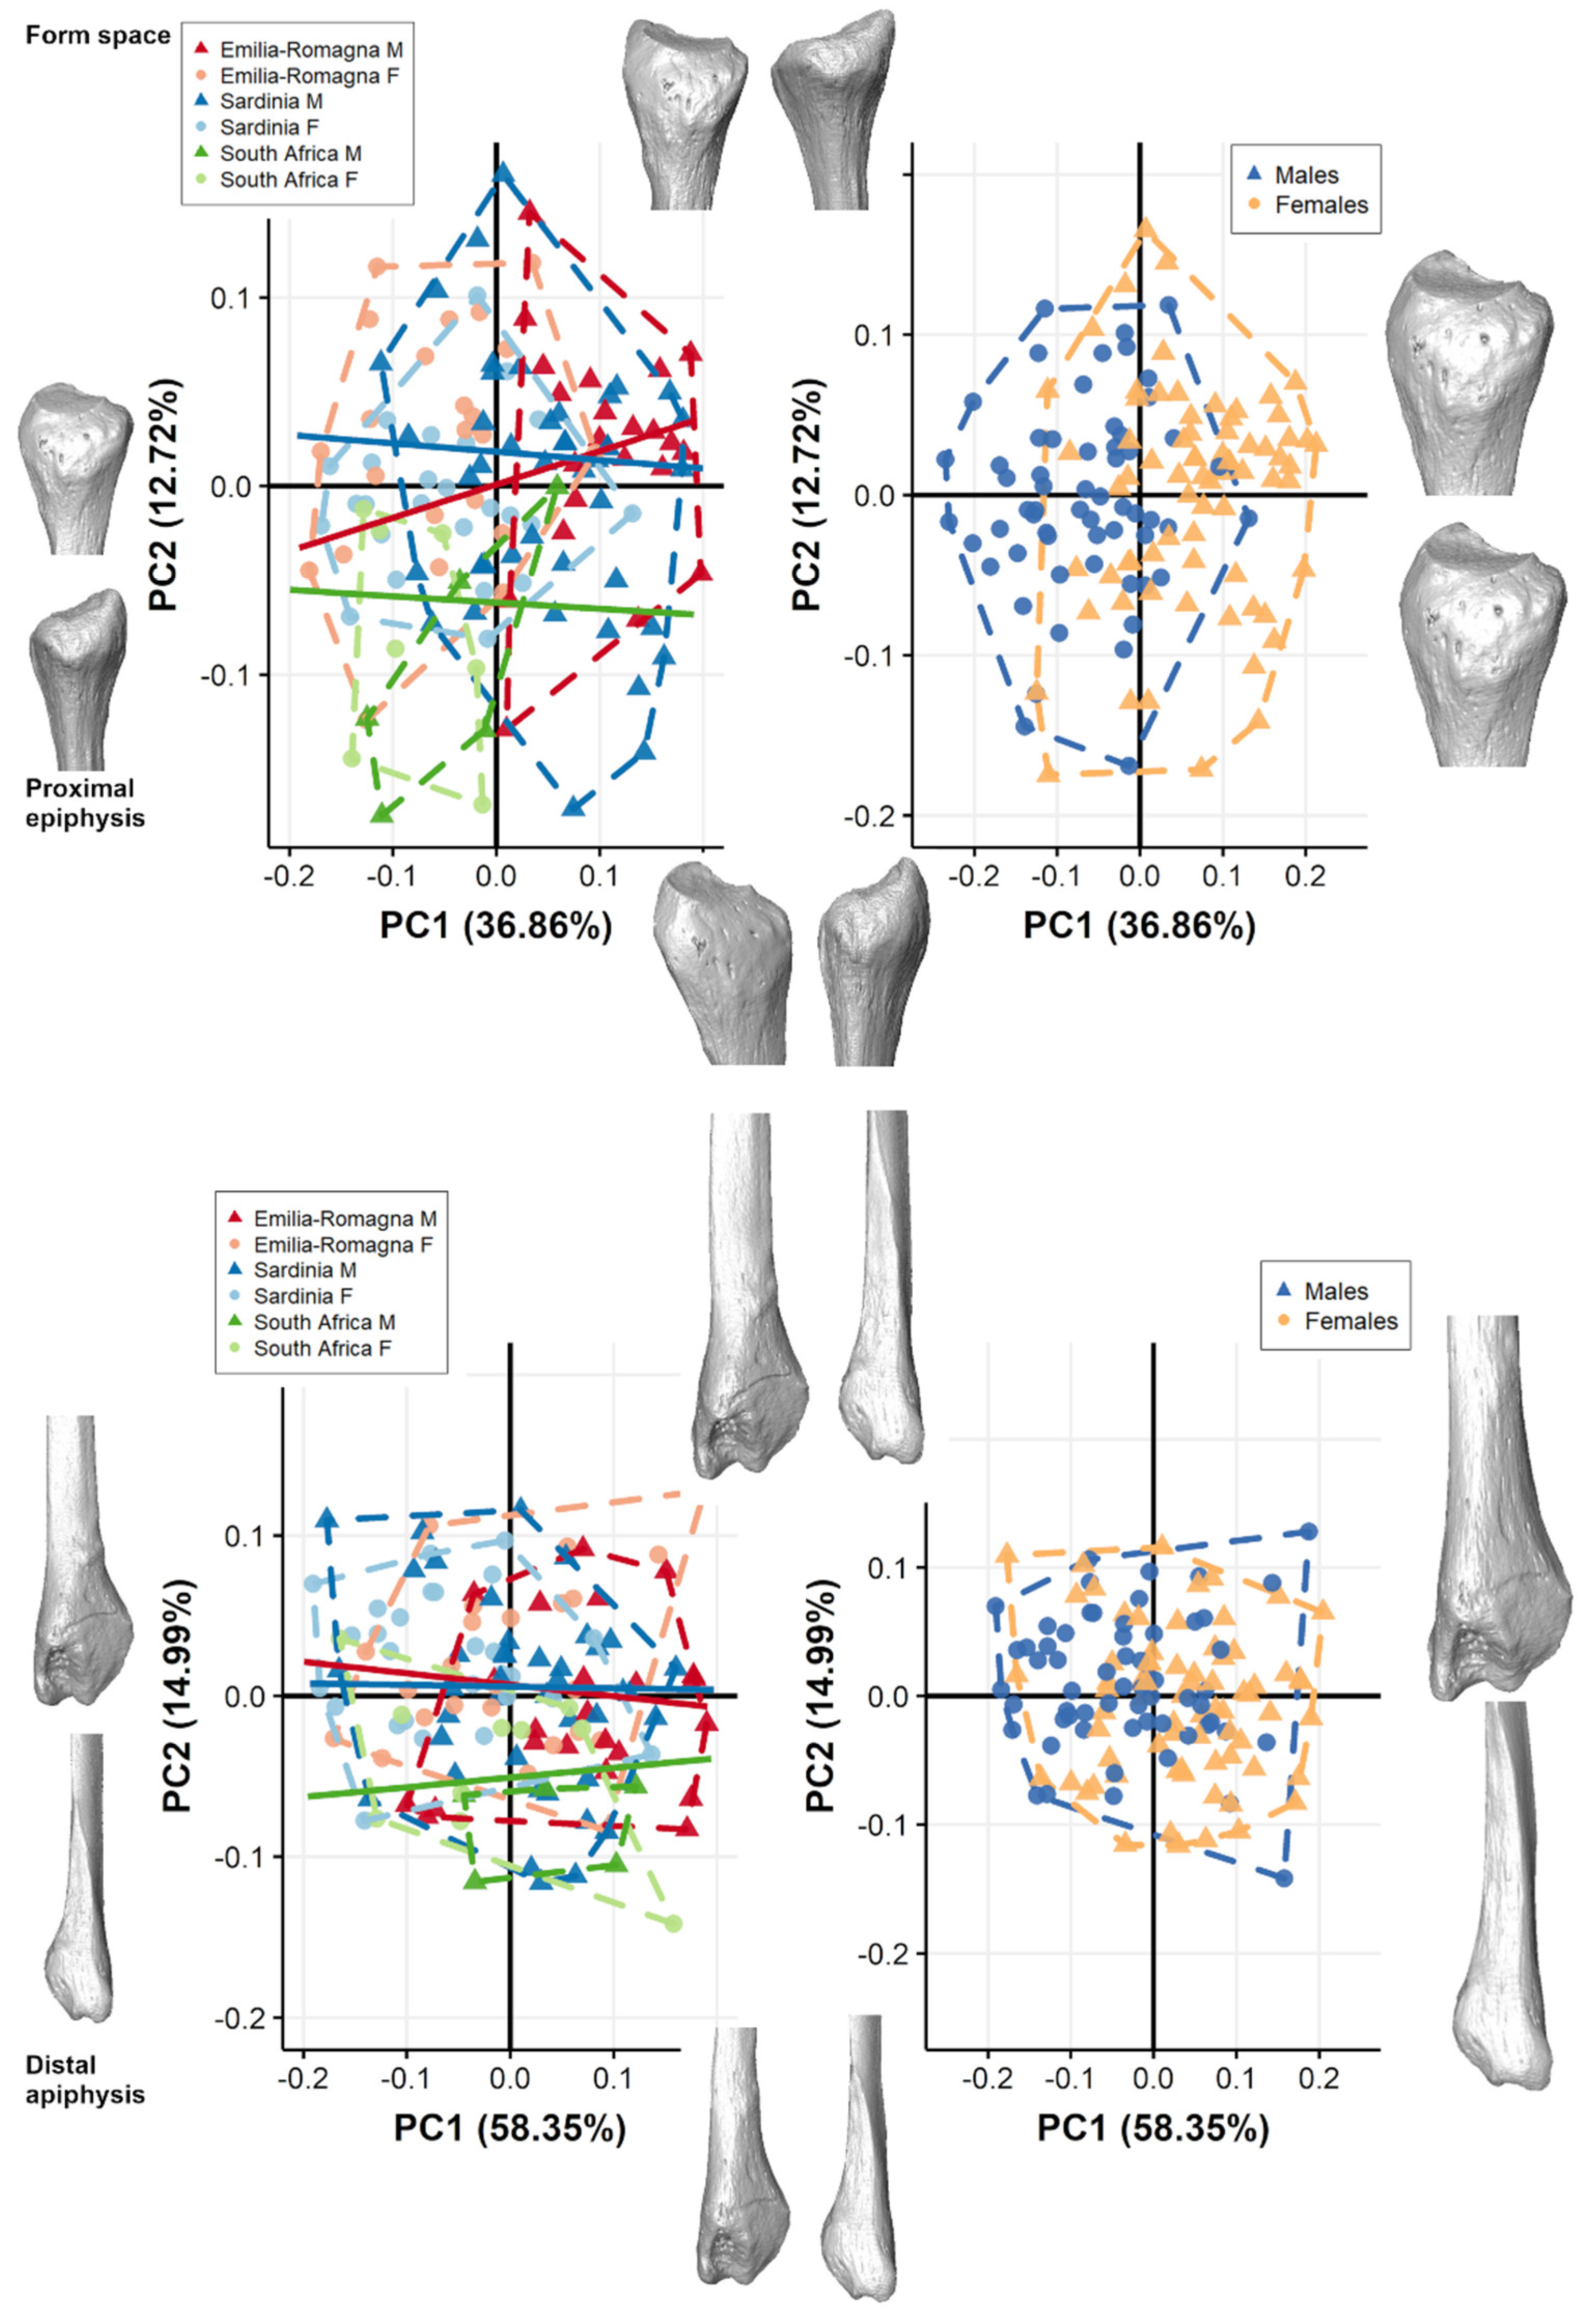
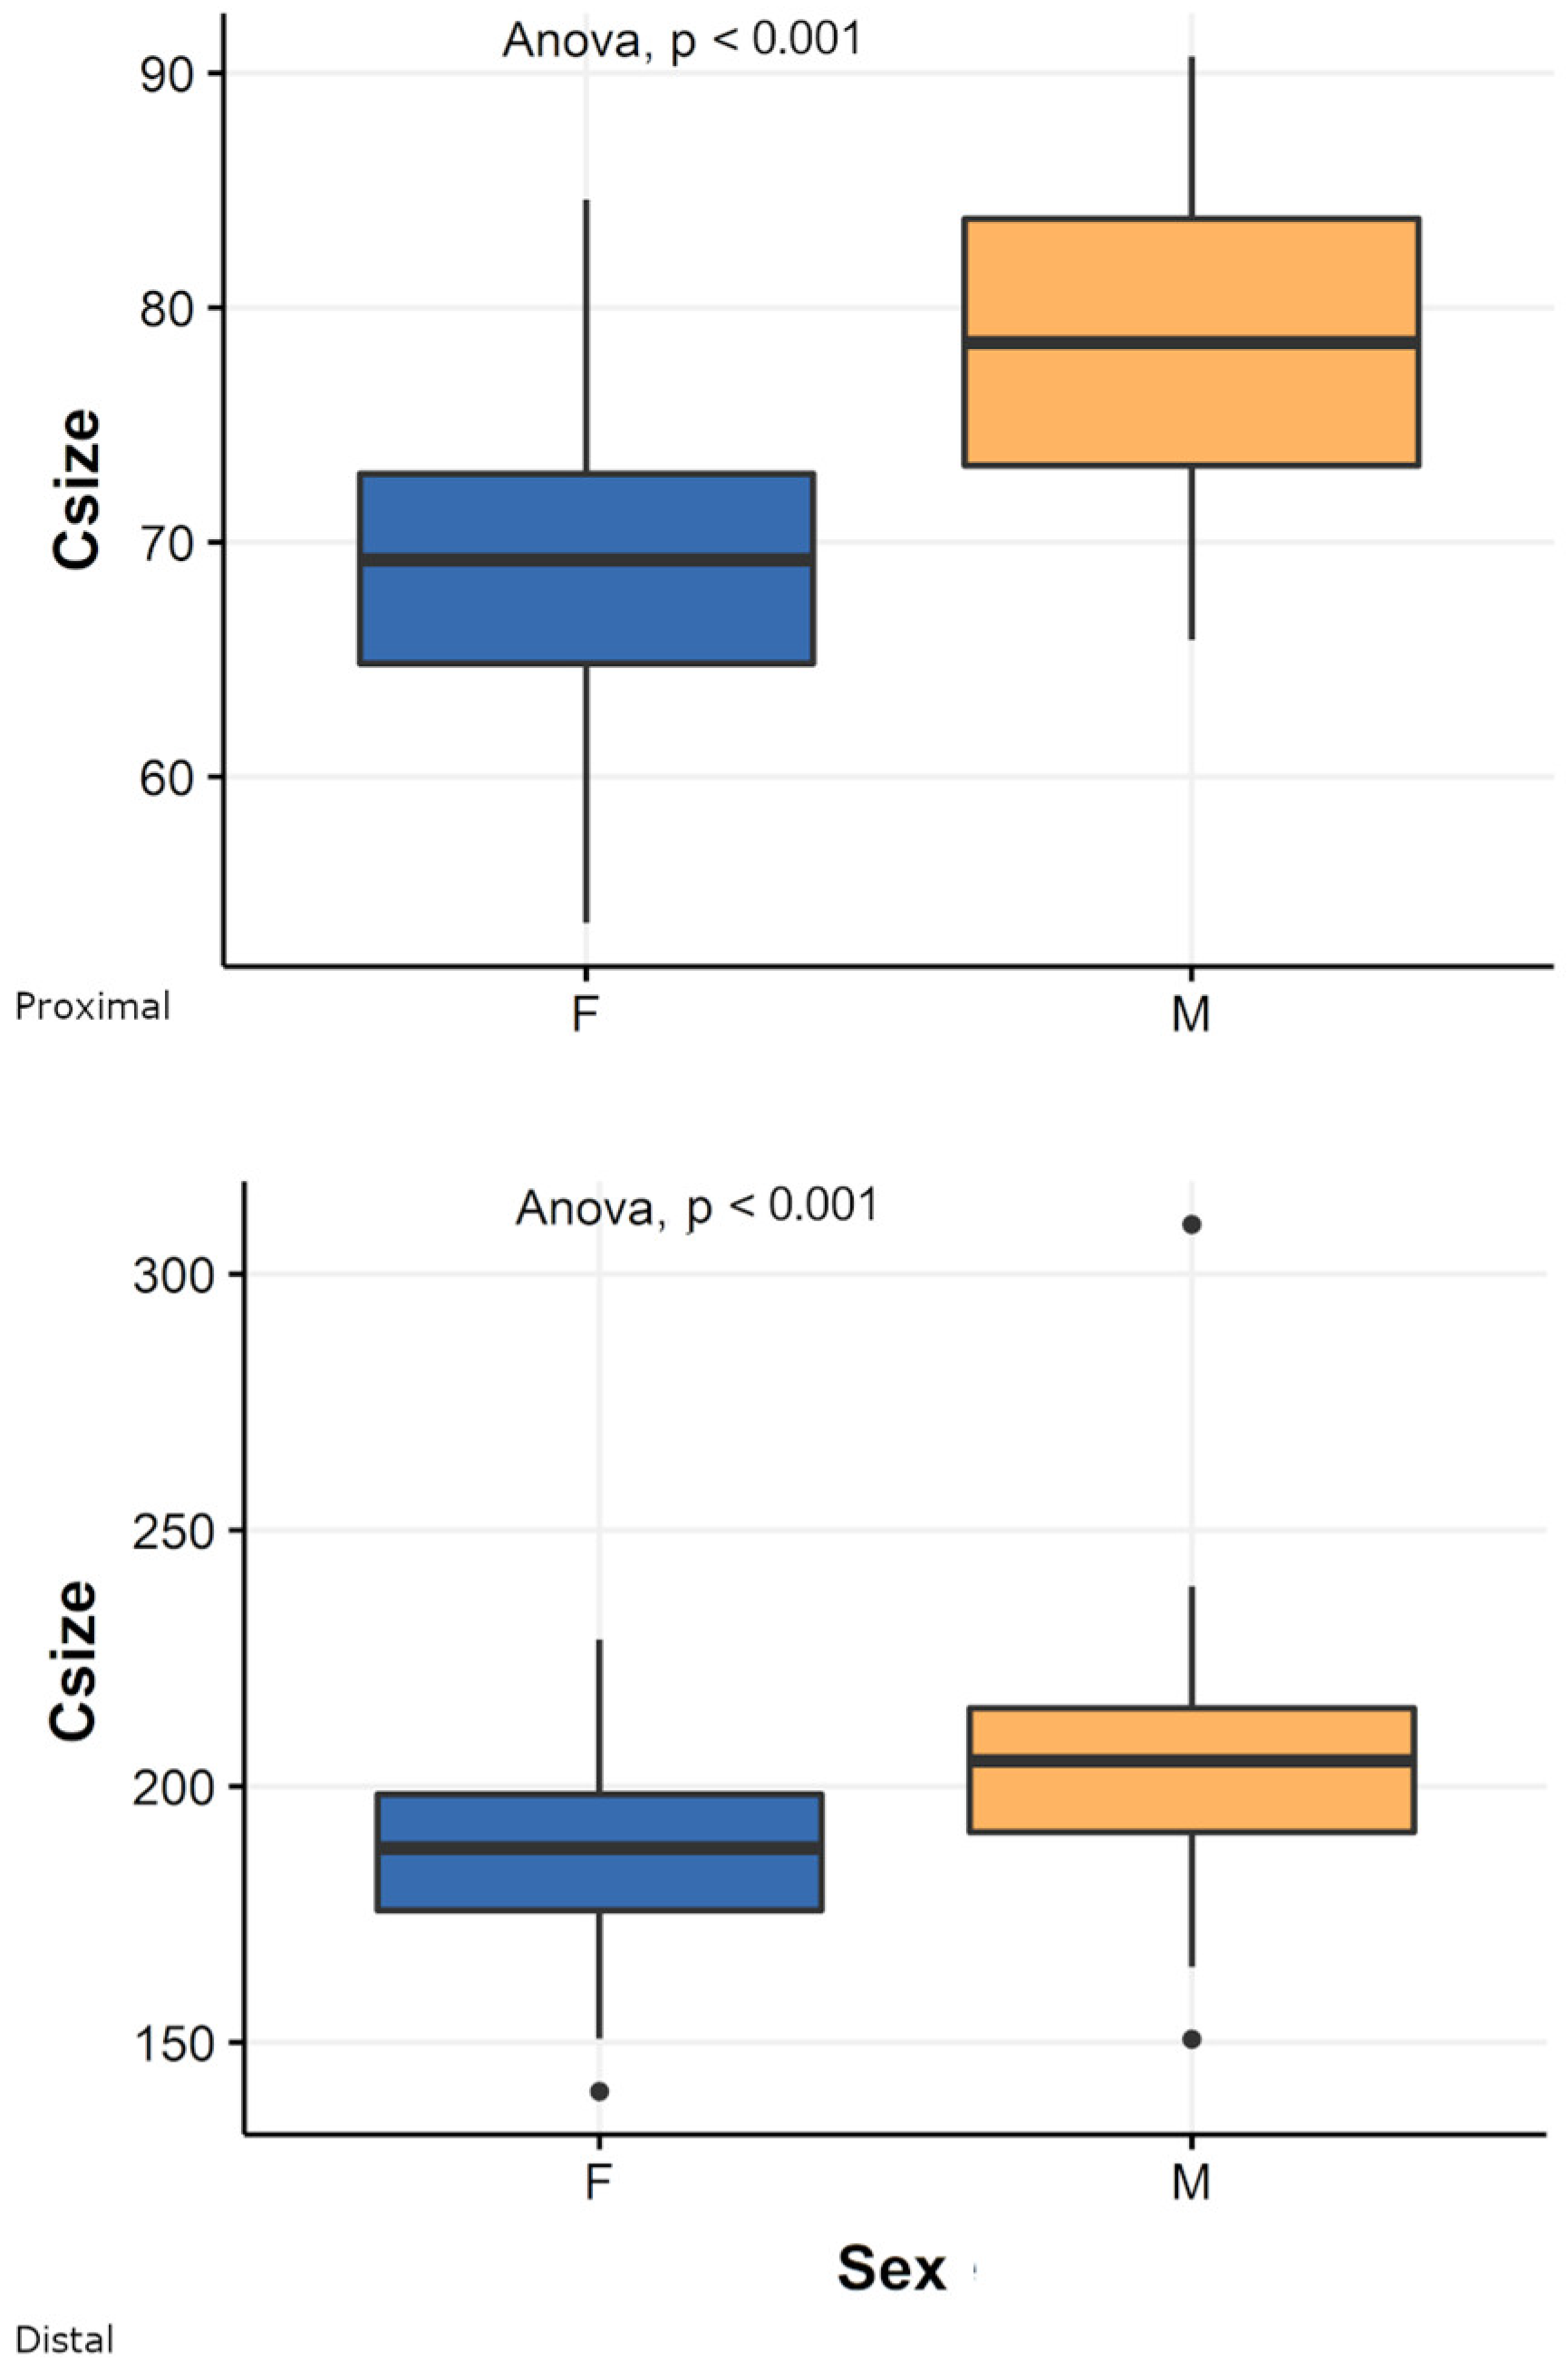
3.1. Pooled Sample
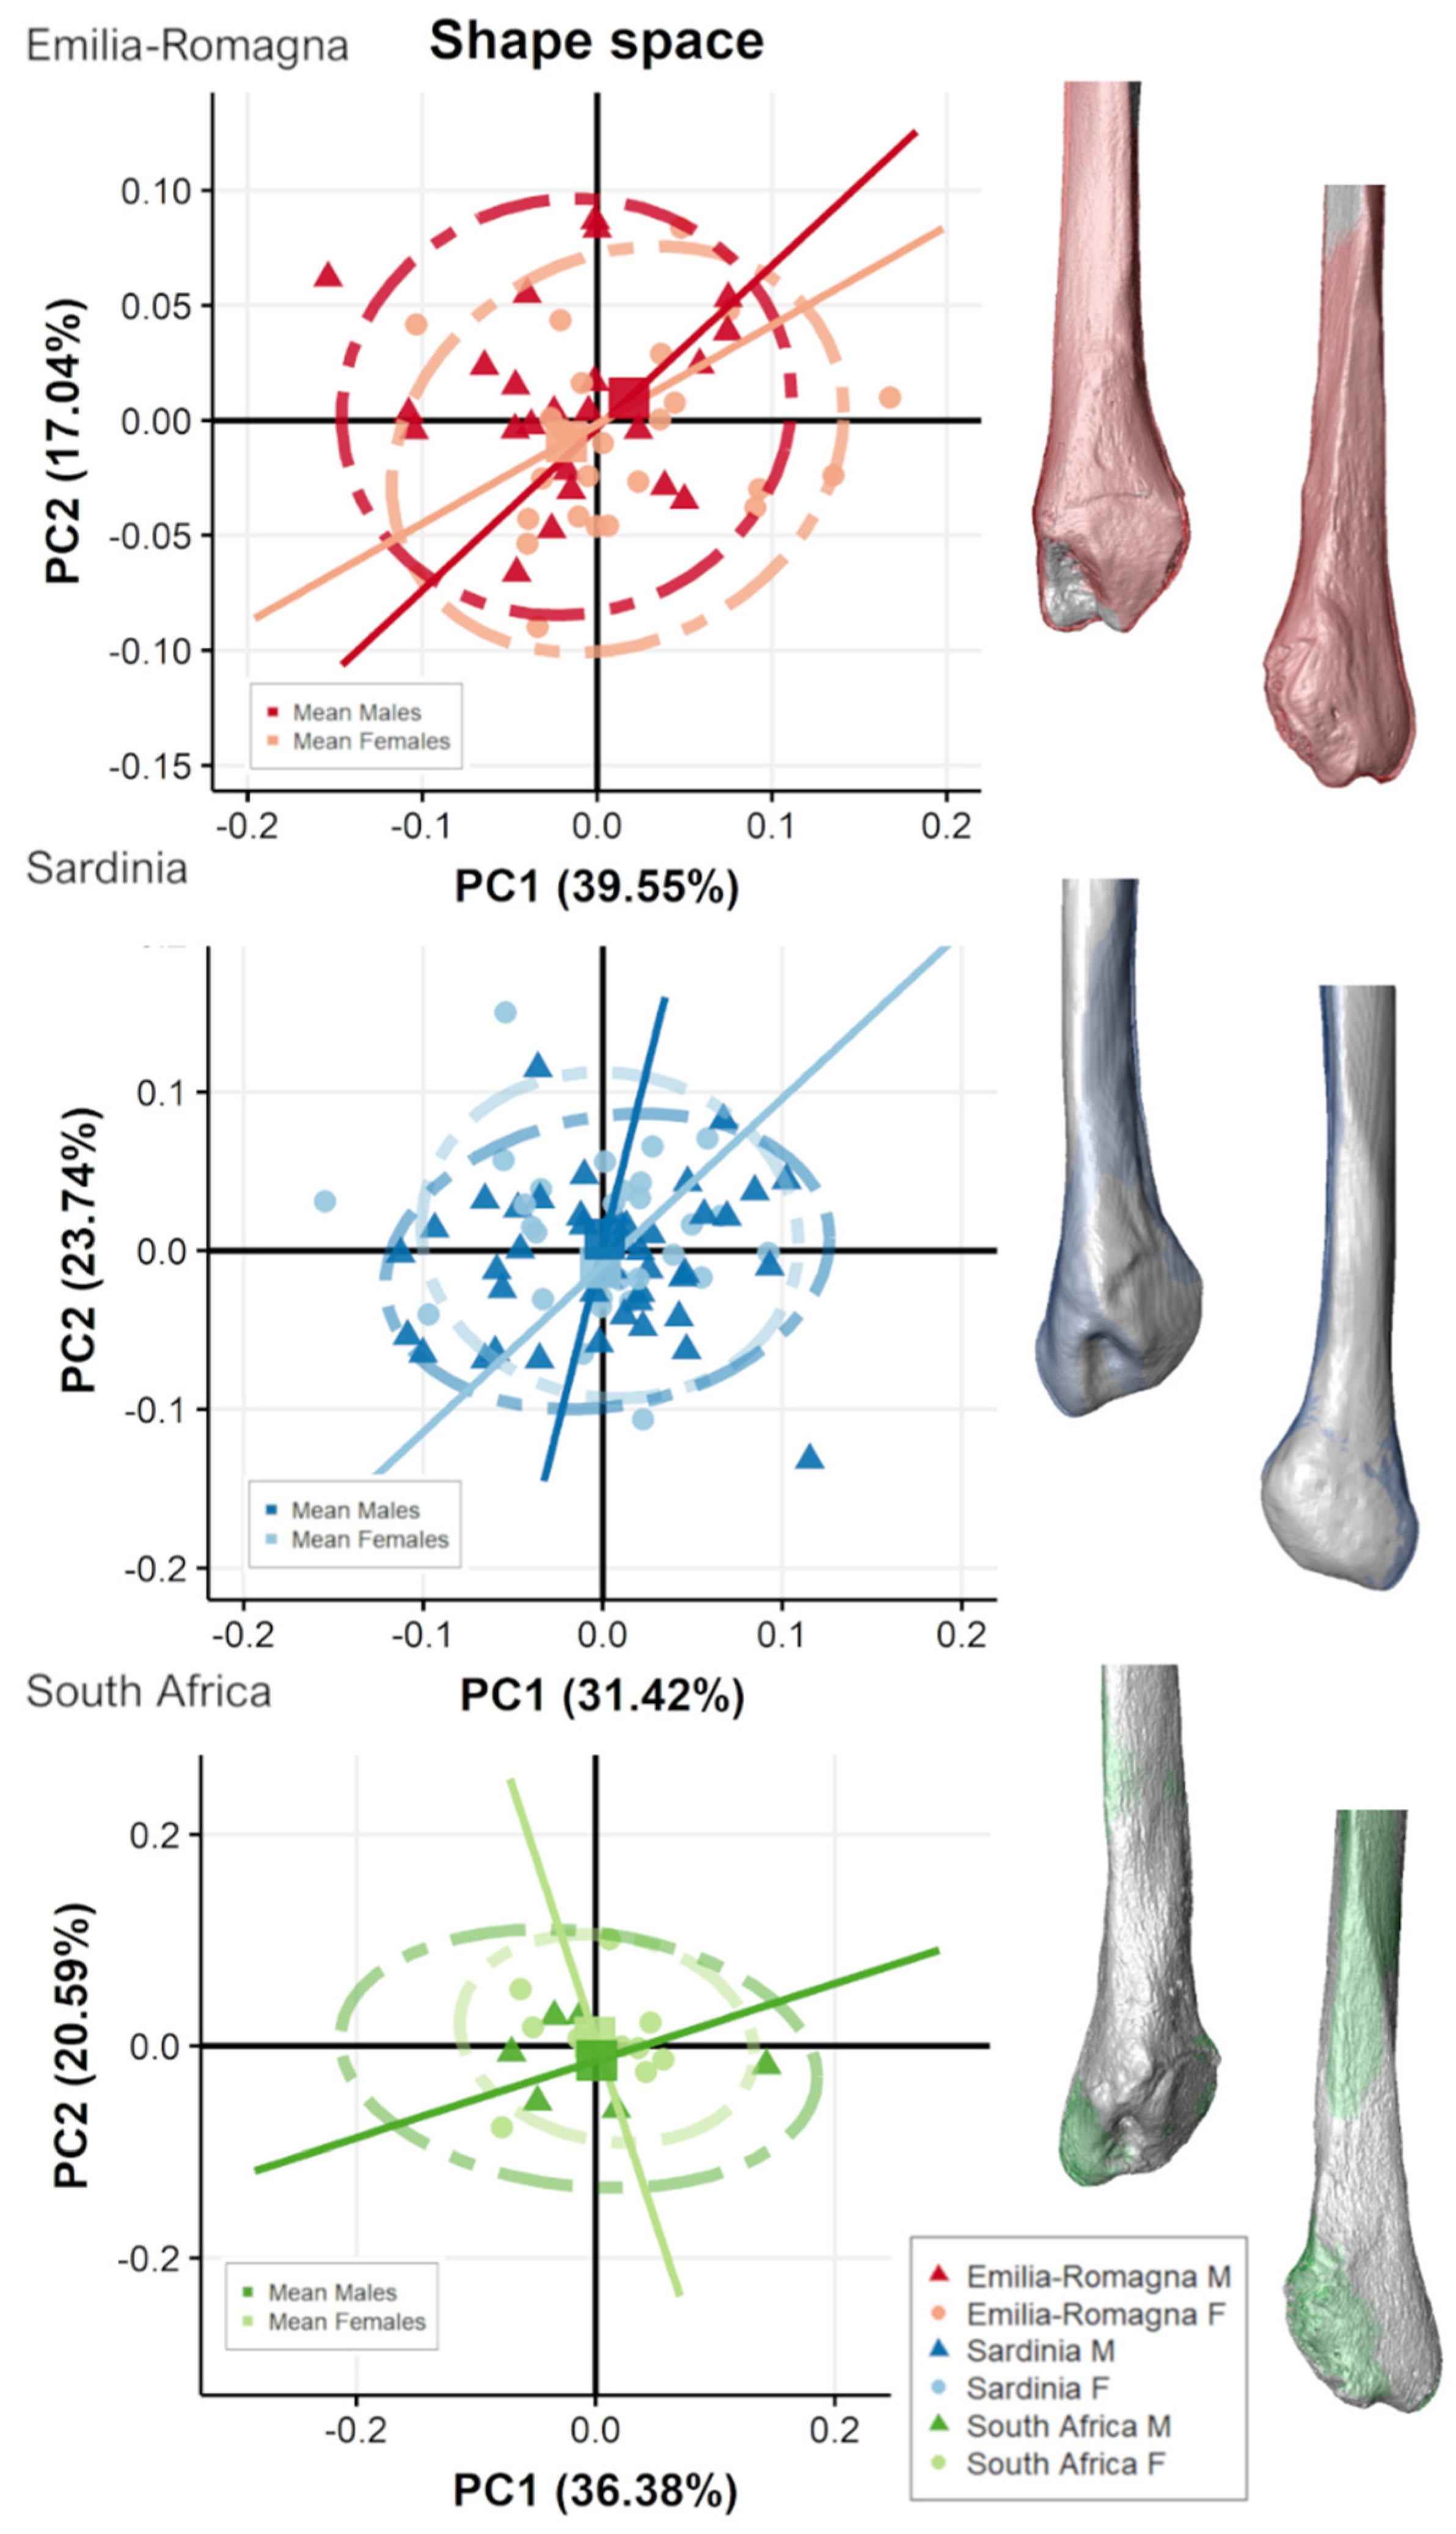
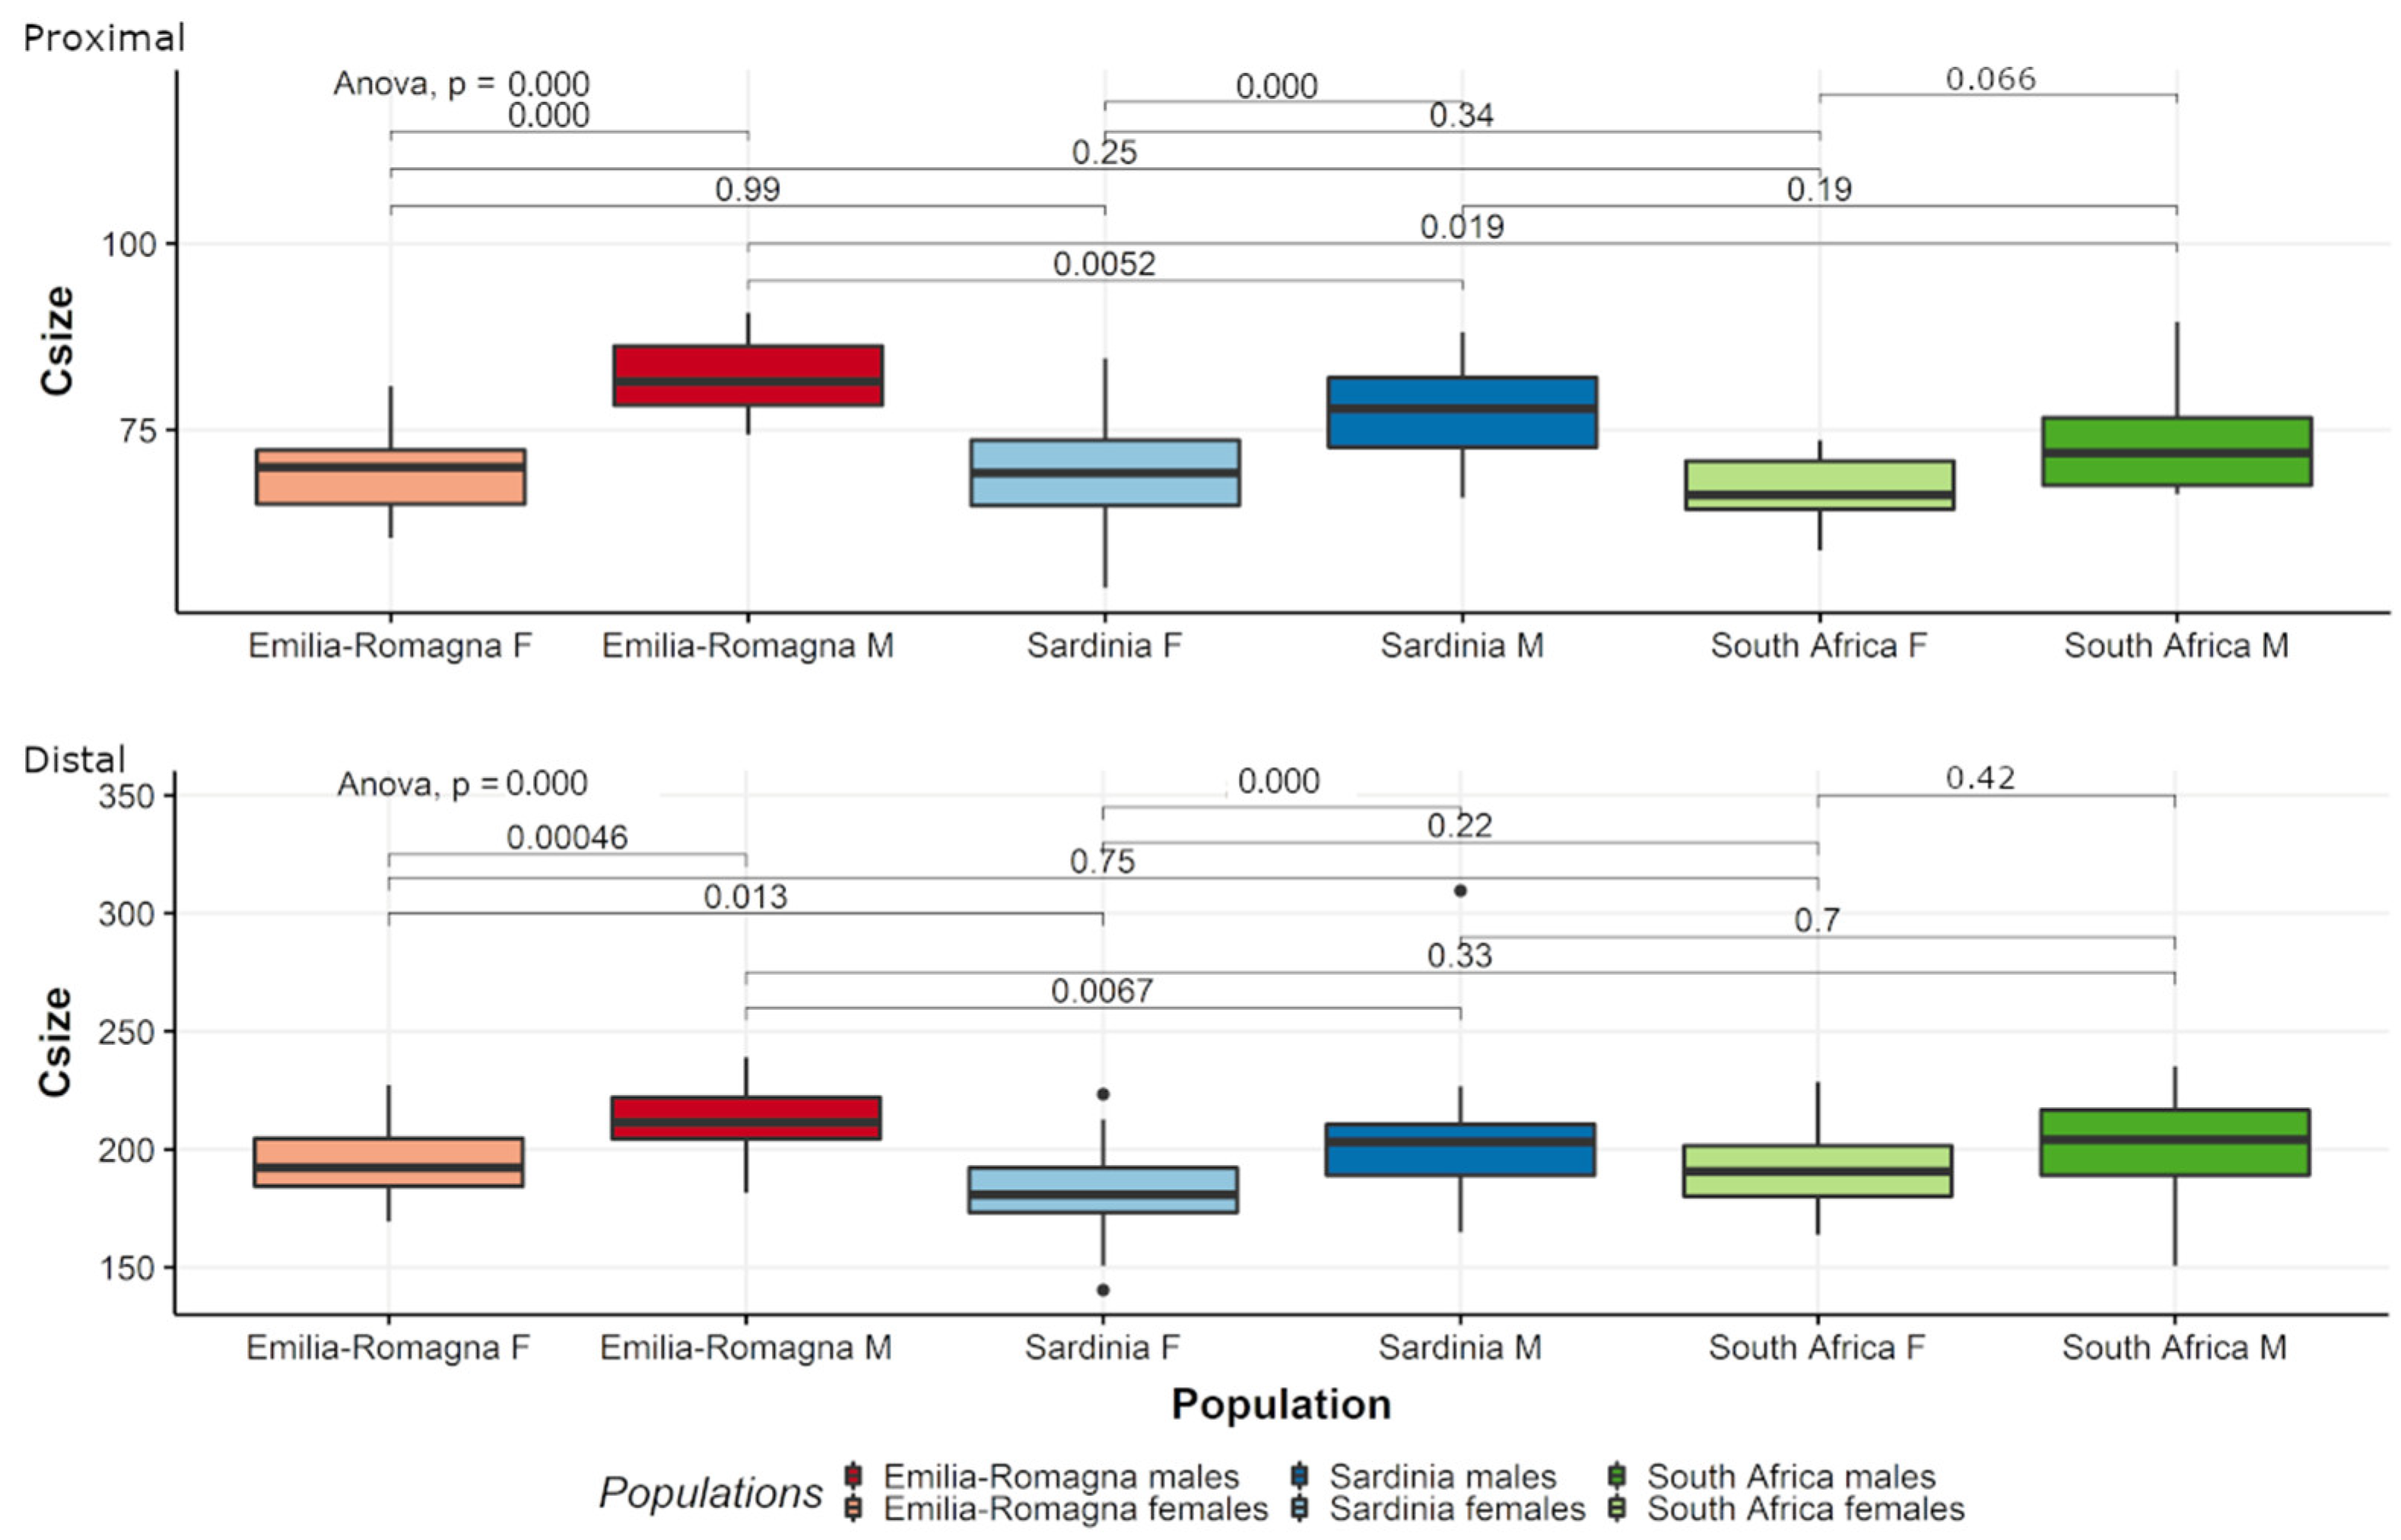
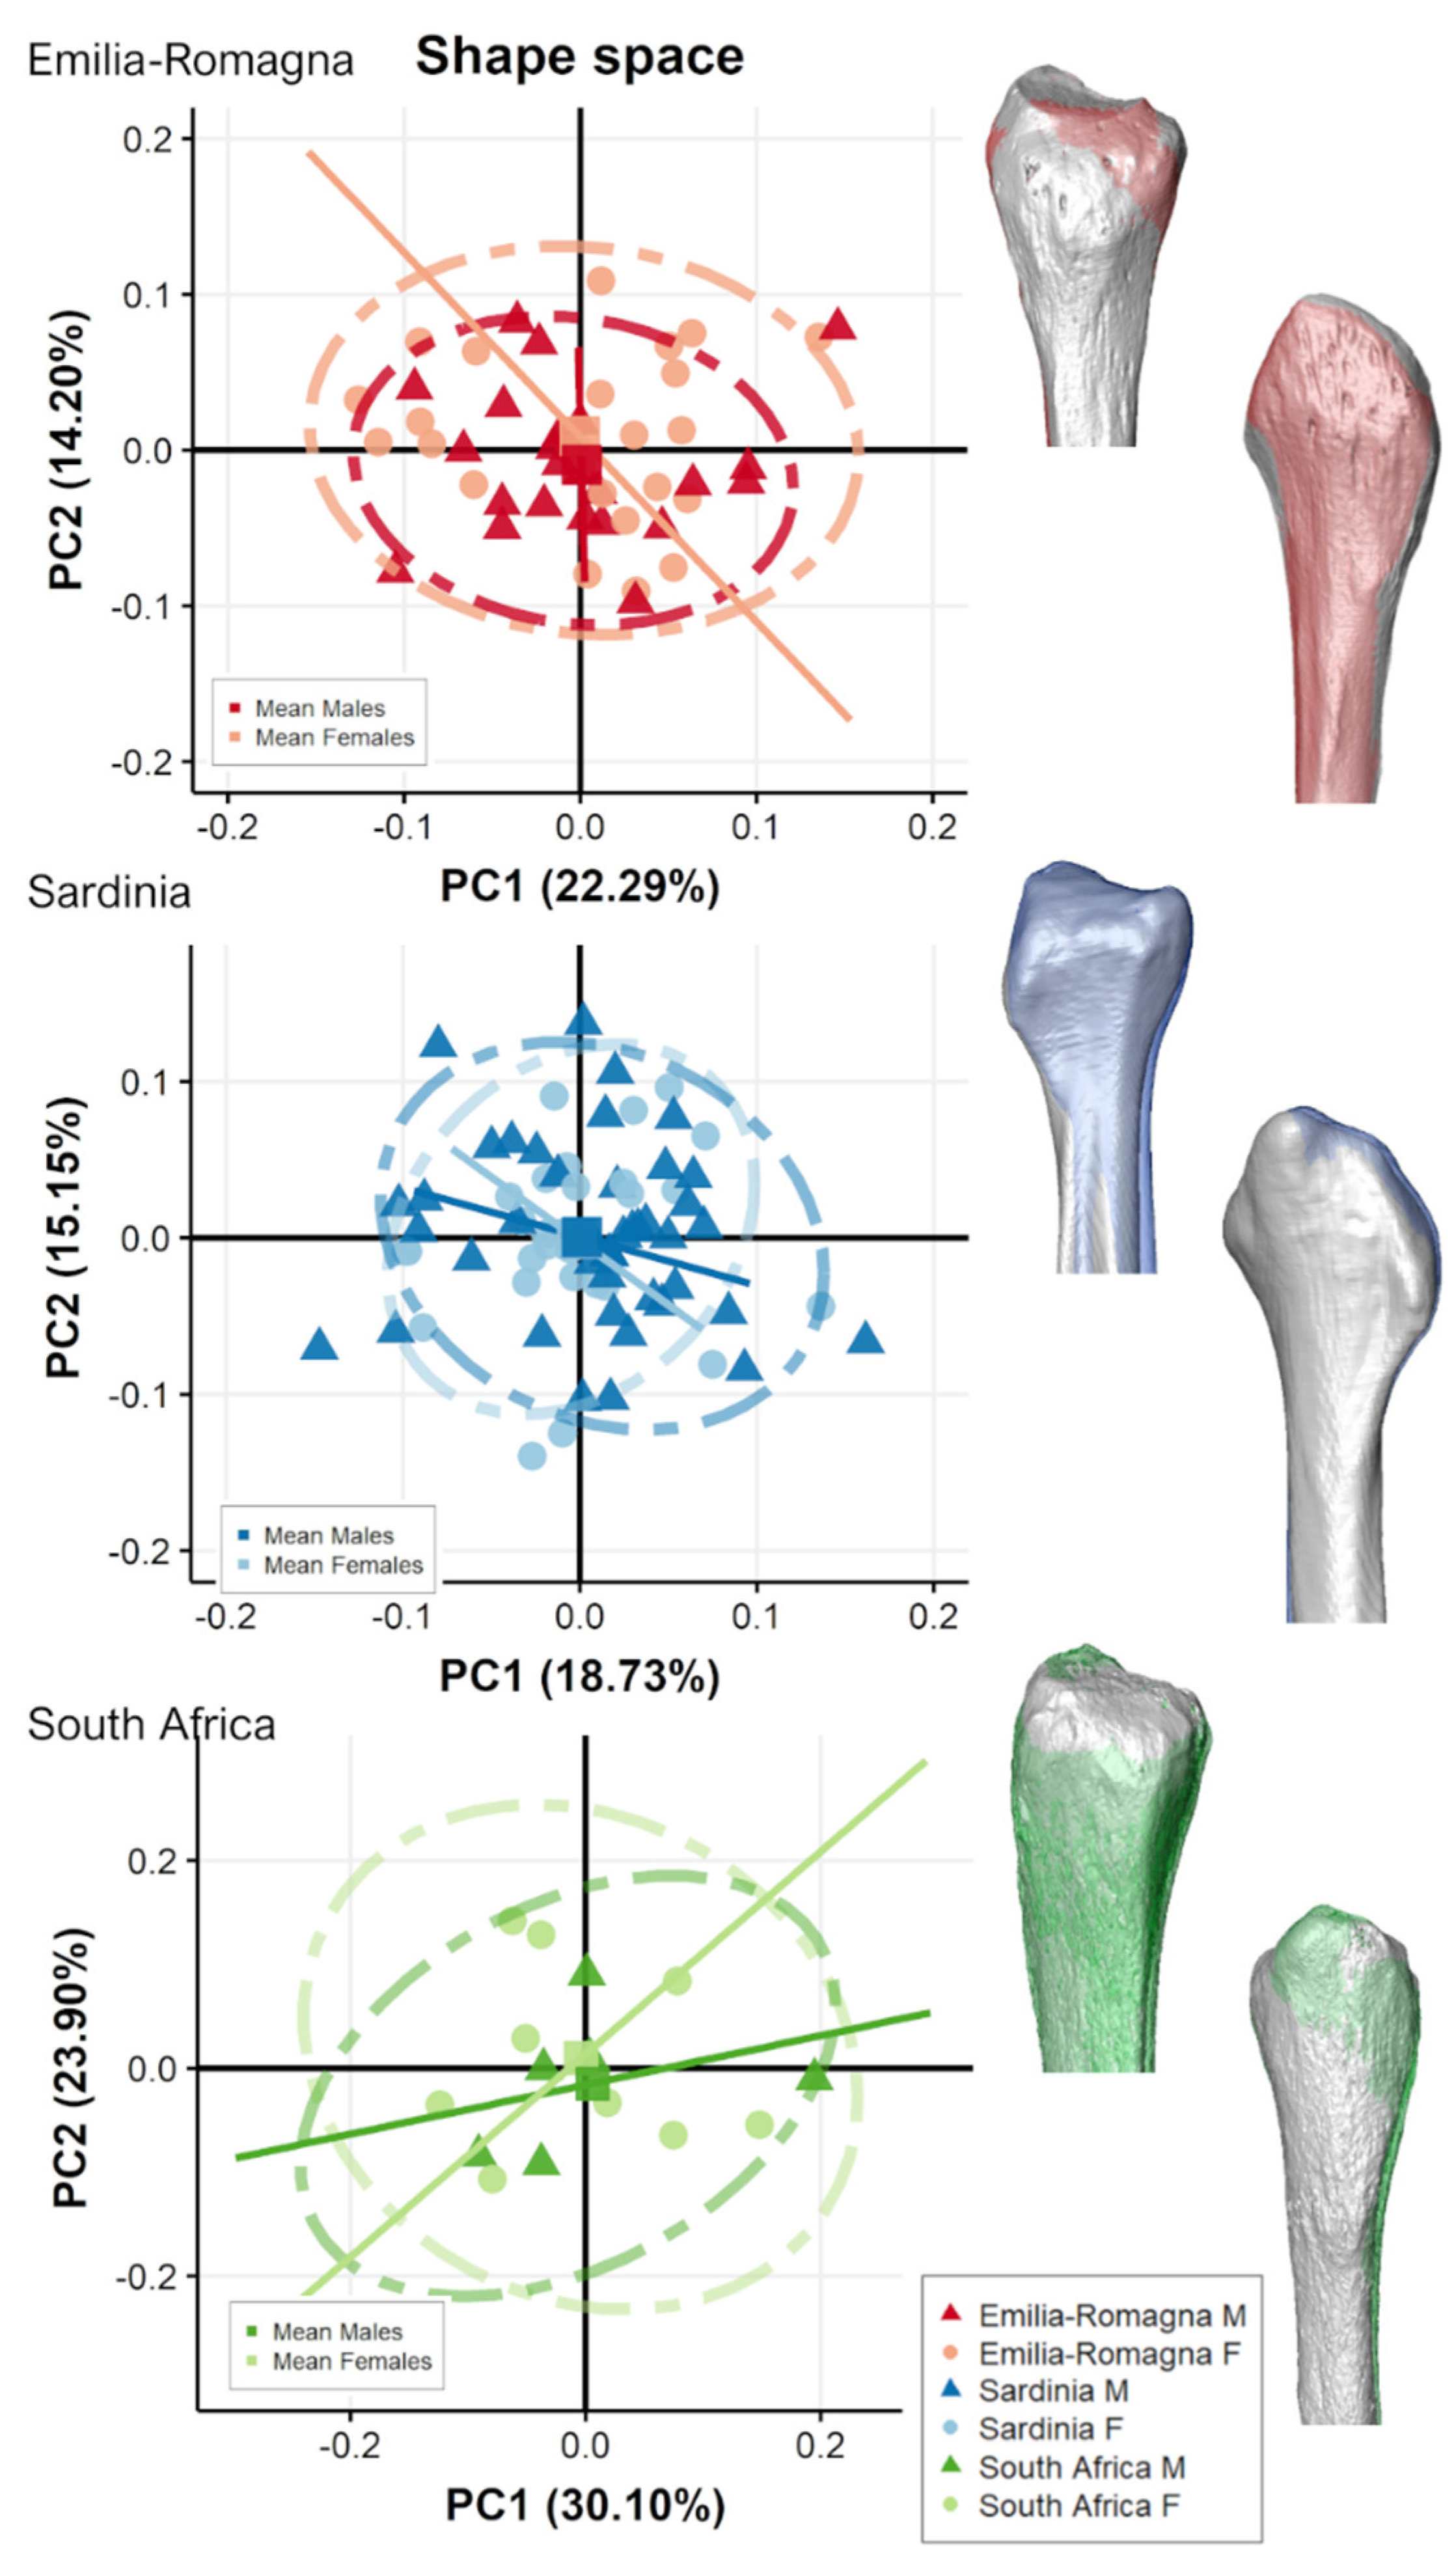
3.2. Separate Populations
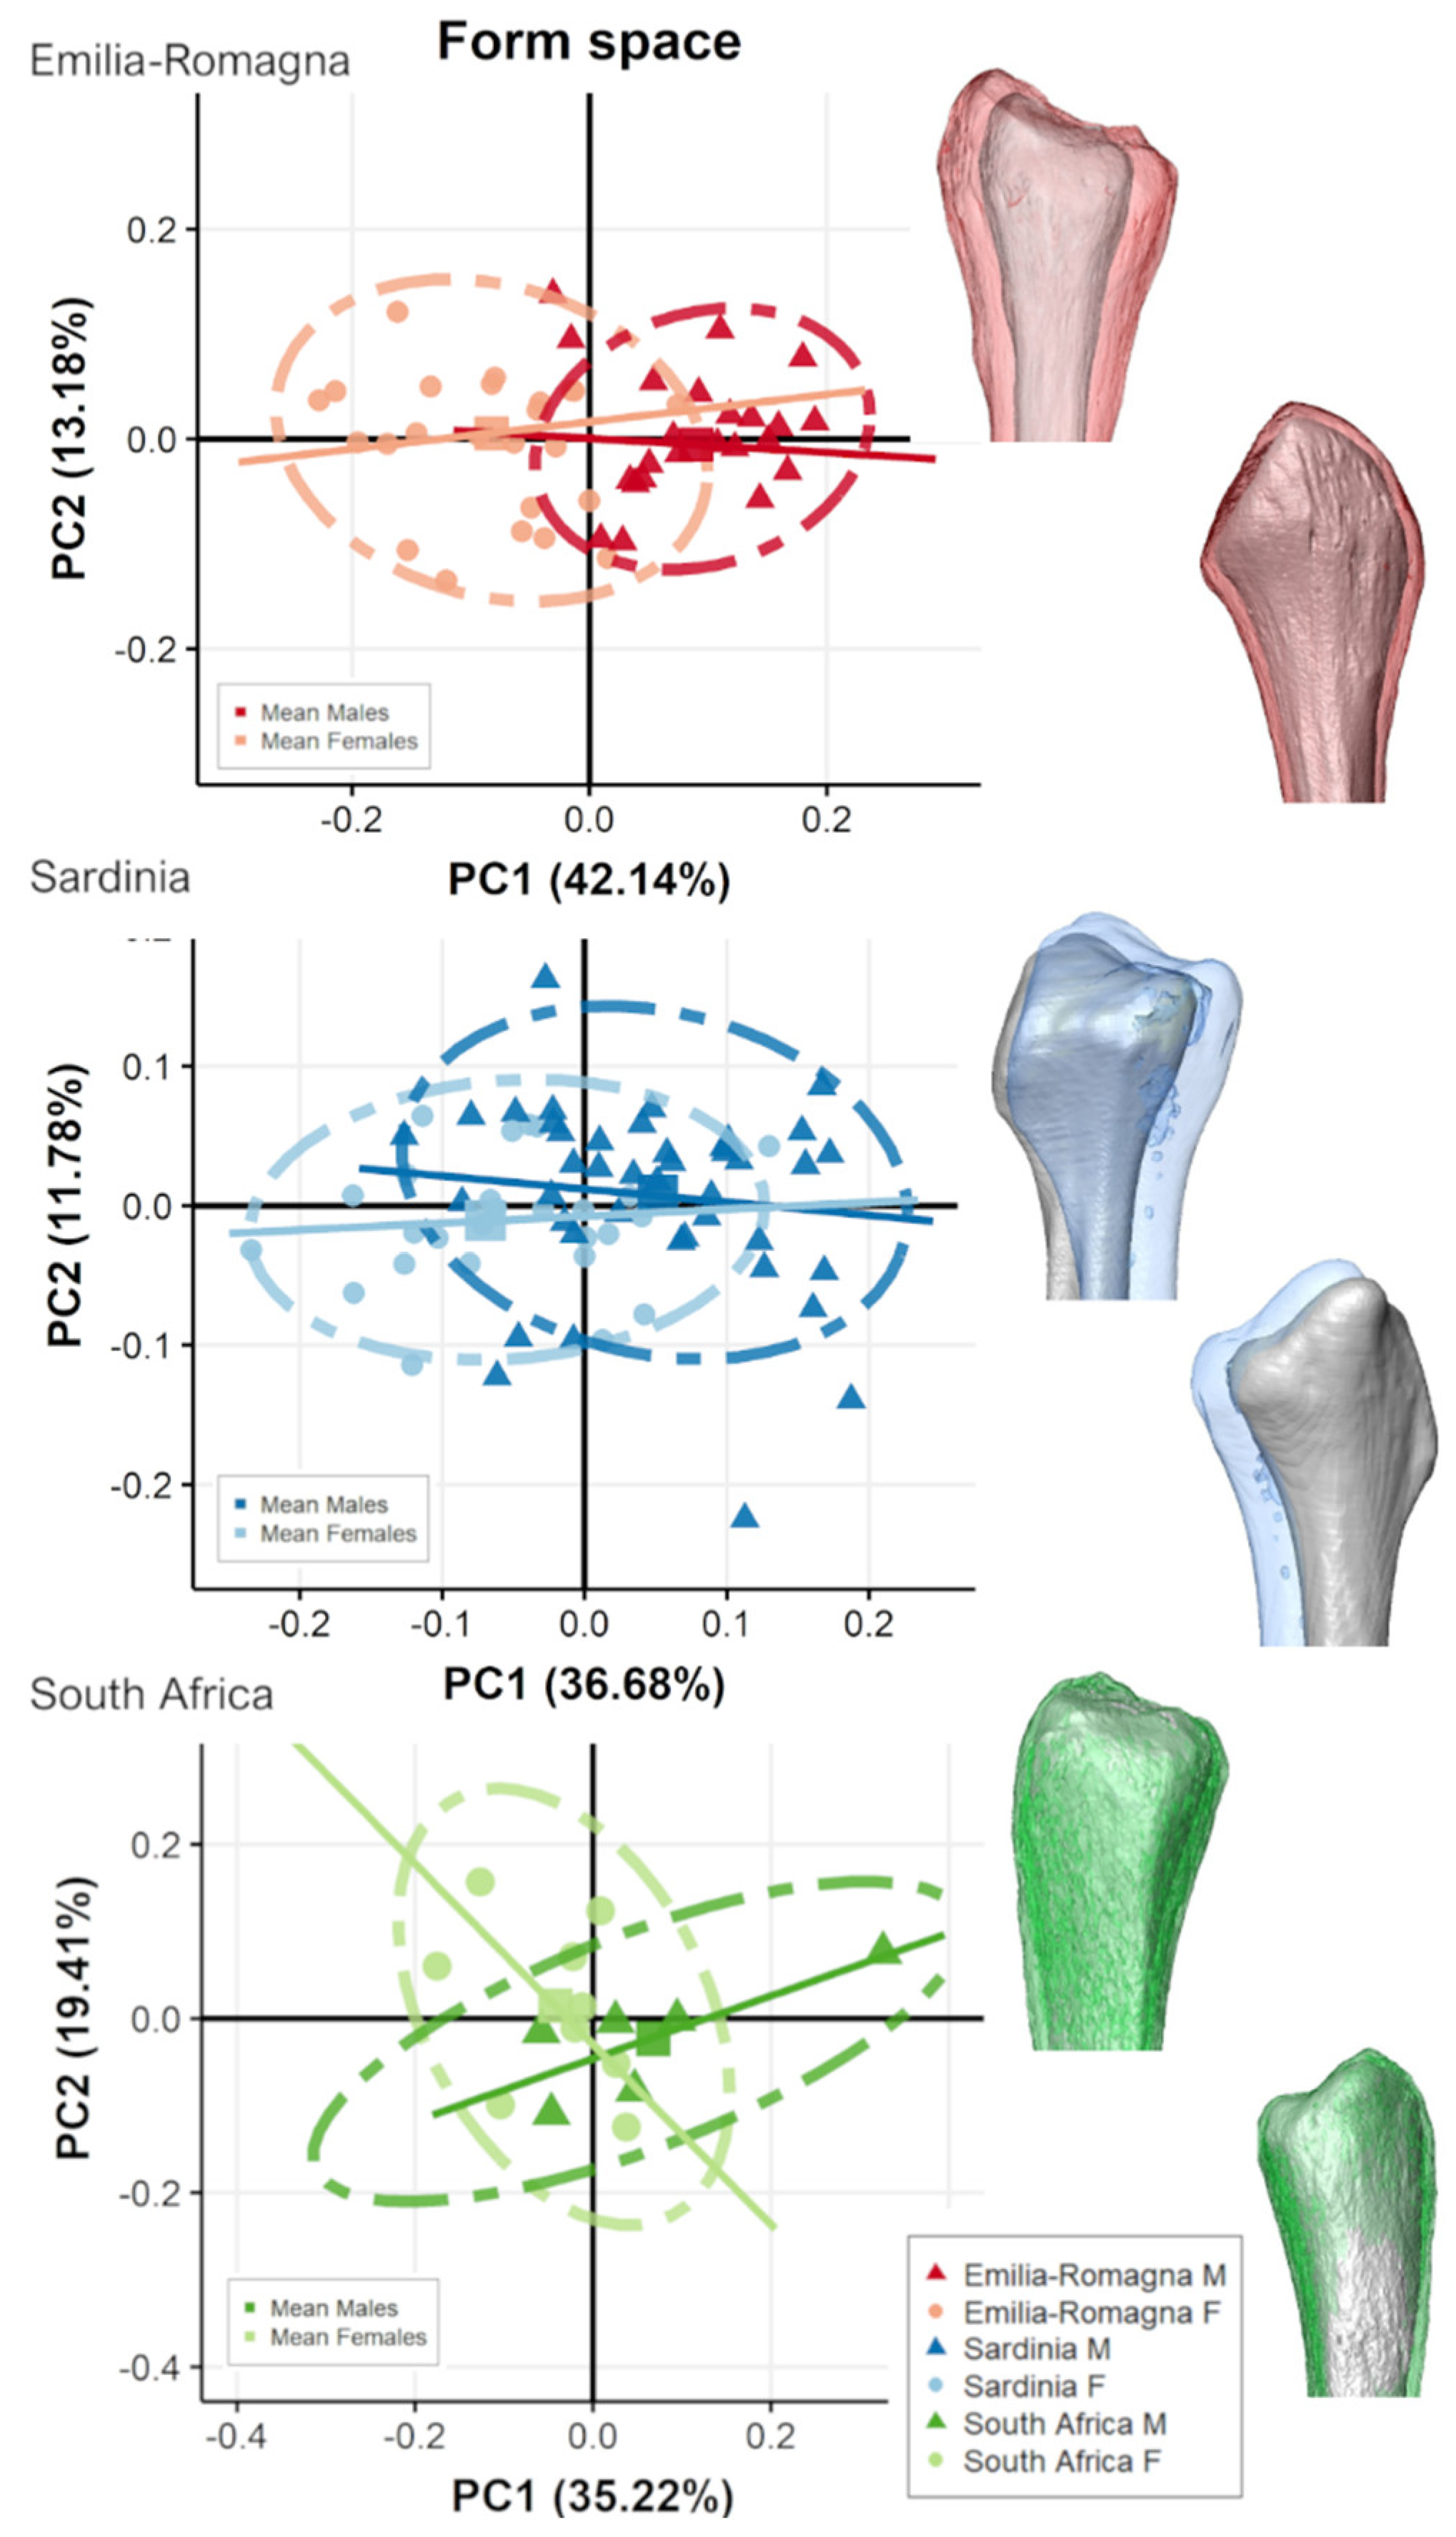
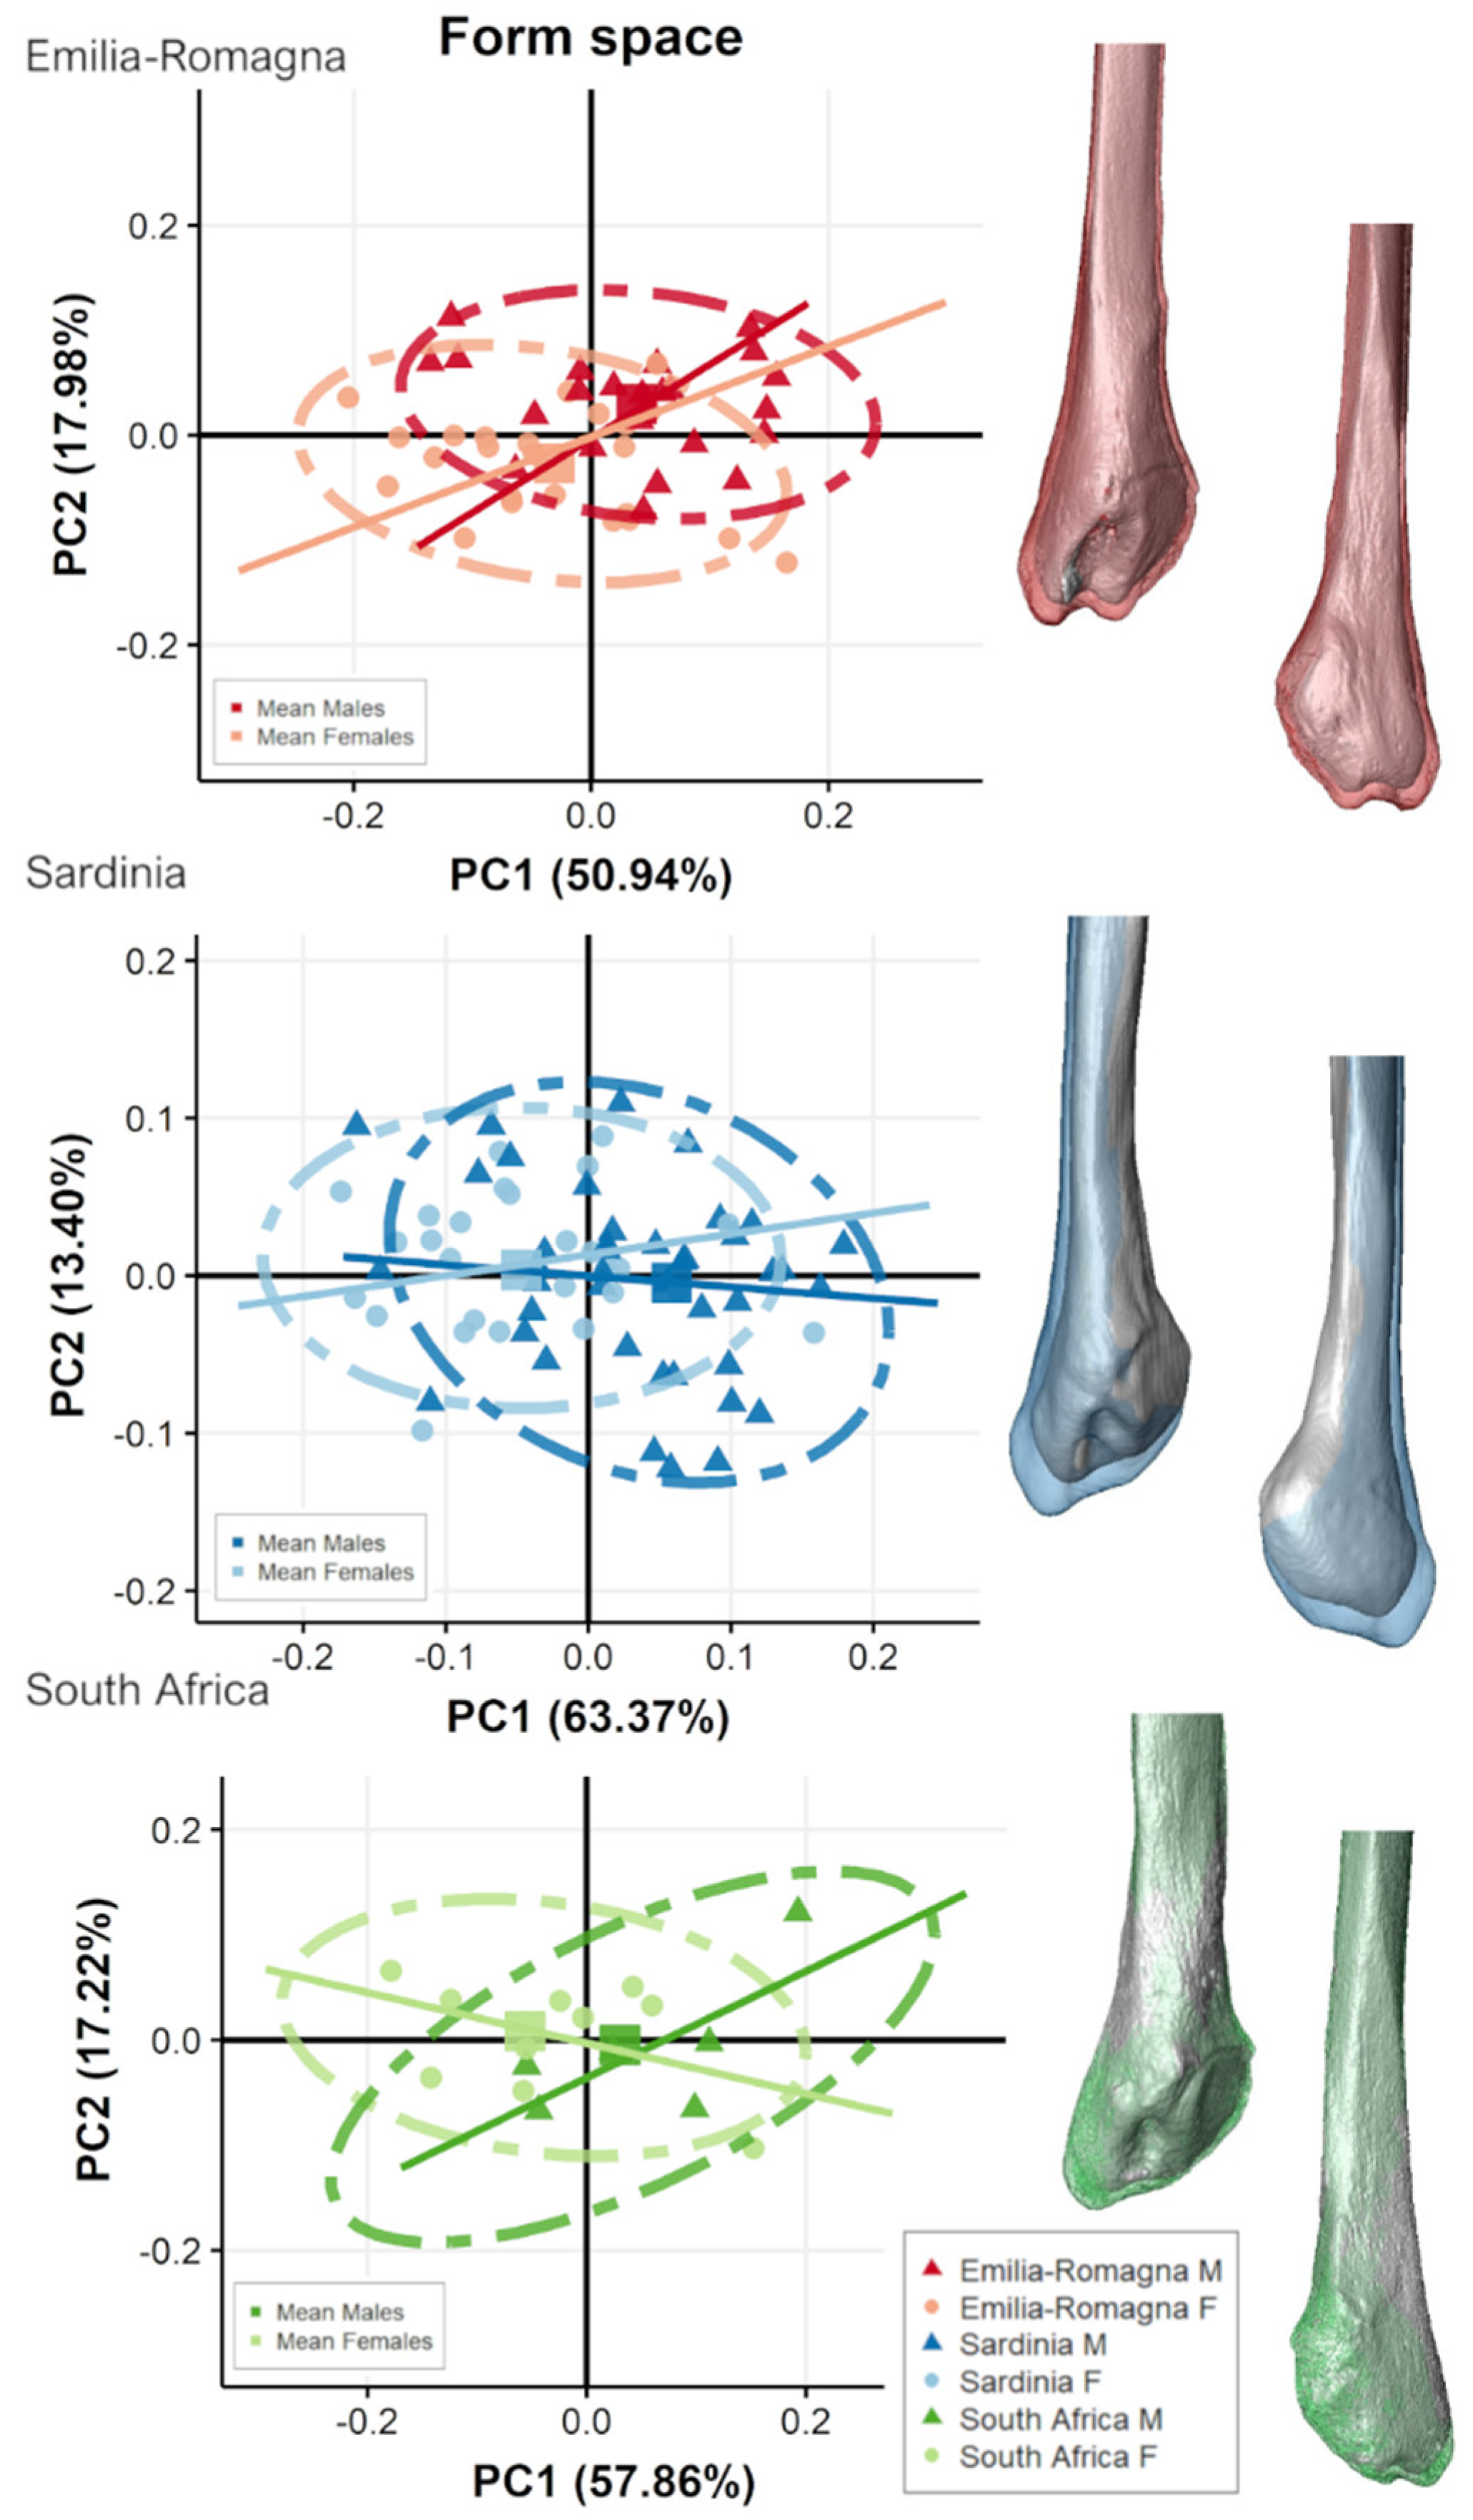
4. Discussion
5. Conclusions
Supplementary Materials
Author Contributions
Funding
Institutional Review Board Statement
Informed Consent Statement
Data Availability Statement
Acknowledgments
Conflicts of Interest
References
- İşcan, M.Y.; Miller-Shaivitz, P. Determination of sex from the tibia. Am. J. Phys. Anthropol. 1984, 64, 53–57. [Google Scholar] [CrossRef] [PubMed]
- Kranioti, E.F.; Apostol, M.A. Sexual dimorphism of the tibia in contemporary Greeks, Italians, and Spanish: Forensic implications. Int. J. Legal Med. 2015, 129, 357–363. [Google Scholar] [CrossRef] [PubMed]
- Brzobohatá, H.; Krajíček, V.; Horák, Z.; Velemínská, J. Sexual dimorphism of the human tibia through time: Insights into shape variation using a surface-based approach. PLoS ONE 2016, 11, e0166461. [Google Scholar] [CrossRef] [PubMed] [Green Version]
- Fasemore, M.D.; Bidmos, M.A.; Mokoena, P.; Imam, A.; Billings, B.K.; Mazengenya, P. Dimensions around the nutrient foramina of the tibia and fibula in the estimation of sex. Forensic Sci. Int. 2018, 287, 222.e1–222.e7. [Google Scholar] [CrossRef]
- Brothwell, D.R. Digging Up Bones, 3rd ed.; Cornell University Press: Ithaca, NY, USA, 1981; pp. 59–63. [Google Scholar]
- Ubelaker, D.H. Human Skeletal Remains: Excavation, Analysis, Interpretation, 2nd ed.; Taraxacum: Washington, DC, USA, 1989; pp. 52–55. [Google Scholar]
- Ruff, C. Sexual dimorphism in human lower limb bone structure: Relationship to subsistence strategy and sexual division of labor. J. Hum. Evol. 1987, 16, 391–416. [Google Scholar] [CrossRef]
- Kimura, T. Cross-section of human lower leg bones viewed from strength of materials. J. Anthropol. Soc. Nippon 1971, 79, 323–336. [Google Scholar] [CrossRef] [Green Version]
- Ruff, C.B.; Hayes, W.C. Cross-sectional geometry of Pecos Pueblo femora and tibiae—A biomechanical investigation: I. Method and general patterns of variation. Am. J. Phys. Anthropol. 1983, 60, 359–381. [Google Scholar] [CrossRef]
- Brzobohatá, H.; Krajíček, V.; Velemínský, P.; Poláček, L.; Velemínská, J. The shape variability of human tibial epiphyses in an early medieval Great Moravian population (9th–10th century AD): A geometric morphometric assessment. Antropol. Anz. 2014, 71, 219–236. [Google Scholar] [CrossRef]
- Brzobohatá, H.; Krajíček, V.; Horák, Z.; Velemínská, J. Sex classification using the three-dimensional tibia form or shape including population specificity approach. J. Forensic Sci. 2015, 60, 29–40. [Google Scholar] [CrossRef]
- Sacragi, A.; Ikeda, T. Sex identification from the distal fibula. Int. J. Osteoarchaeol. 1995, 5, 139–143. [Google Scholar] [CrossRef]
- Spradley, M.K.; Anderson, B.E.; Tise, M.L. Postcranial sex estimation criteria for Mexican Hispanics. J. Forensic Sci. 2015, 60, S27–S31. [Google Scholar] [CrossRef]
- Spradley, M.K.; Jantz, R.L. Sex estimation in forensic anthropology: Skull versus postcranial elements. J. Forensic Sci. 2011, 56, 289–296. [Google Scholar] [CrossRef]
- Moore, M.K.; DiGangi, E.A.; Niño Ruíz, F.P.; Hidalgo Davila, O.; Medina, C. Metric sex estimation from the postcranial skeleton for the Colombian population. Forensic Sci. Int. 2016, 262, 286.e1–286.e8. [Google Scholar] [CrossRef]
- Krüger, G.C.; L’Abbé, E.N.; Stull, K.E. Sex estimation from the long bones of modern South Africans. Int. J. Legal Med. 2017, 131, 275–285. [Google Scholar] [CrossRef]
- Waldron, T. The Relative Survival of the Human Skeleton: Implications for Palaeopathology. In Death, Decay and Reconstruction: Approaches to Archaeology and Forensic Science, 1st ed.; Boddington, A., Garland, A.N., Janaway, R.C., Eds.; Manchester University Press: Manchester, UK, 1987; pp. 55–64. [Google Scholar]
- Spennemann, D.H.R. Differential representation of human skeletal remains in eroded and redeposited coastal deposits: A case study from the Marshall Islands. Int. J. Anthropol. 1992, 7, 1–8. [Google Scholar] [CrossRef]
- Stojanowski, C.M.; Seidemann, R.M.; Doran, G.H. Differential skeletal preservation at Windover Pond: Causes and consequences. Am. J. Phys. Anthropol. 2002, 119, 15–26. [Google Scholar] [CrossRef]
- Willey, P.; Galloway, A.; Snyder, L. Bone mineral density and survival of elements and element portions in the bones of the Crow Creek massacre victims. Am. J. Phys. Anthropol. 1997, 104, 513–528. [Google Scholar] [CrossRef]
- Singh, G.; Singh, S. Identification of sex from the fibula. J. Indian Acad. Forensic. Sci. 1976, 15, 29–34. [Google Scholar]
- Naidoo, N.; Ishwarkumar, S.; Lazarus, L.; Pillay, P.; Satyapal, K. Osteometry and morphology of the human fibula: A South African study. Int. J. Morphol. 2015, 33, 1071–1077. [Google Scholar] [CrossRef] [Green Version]
- Mazengenya, P.; Billings, B.K. Topographic and morphometric features of the nutrient foramina of the fibula in the South African mixed-ancestry population group and their surgical relevance. Eur. J. Anat. 2016, 20, 329–336. [Google Scholar]
- Zhang, J.; Fernandez, J.; Hislop-Jambrich, J.; Besier, T.F. Lower limb estimation from sparse landmarks using an articulated shape model. J. Biomech. 2016, 49, 3875–3881. [Google Scholar] [CrossRef] [PubMed]
- Tümer, N.; Arbabi, V.; Gielis, W.P.; de Jong, P.A.; Weinans, H.; Tuijthof, G.J.M.; Zadpoor, A.A. Three-dimensional analysis of shape variations and symmetry of the fibula, tibia, calcaneus and talus. J. Anat. 2019, 234, 132–144. [Google Scholar] [CrossRef] [PubMed] [Green Version]
- Nolte, D.; Ko, S.T.; Bull, A.M.J.; Kedgley, A.E. Reconstruction of the lower limb bones from digitised anatomical landmarks using statistical shape modelling. Gait Posture 2020, 77, 269–275. [Google Scholar] [CrossRef] [PubMed]
- Audenaert, E.A.; Pattyn, C.; Steenackers, G.; De Roeck, J.; Vandermeulen, D.; Claes, P. Statistical shape modeling of skeletal anatomy for sex discrimination: Their training size, sexual dimorphism, and asymmetry. Front. Bioeng. Biotechnol. 2019, 7, 1–11. [Google Scholar] [CrossRef] [Green Version]
- Bruce, O.L.; Baggaley, M.; Welte, L.; Rainbow, M.J.; Edwards, W.B. A statistical shape model of the tibia-fibula complex: Sexual dimorphism and effects of age on reconstruction accuracy from anatomical landmarks. Comput. Methods Biomech. Biomed. Eng. 2022, 25, 875–886. [Google Scholar] [CrossRef]
- Sorrentino, R.; Belcastro, M.G.; Figus, C.; Stephens, N.B.; Turley, K.; Harcourt-Smith, W.; Ryan, T.M.; Benazzi, S. Exploring sexual dimorphism of the modern human talus through geometric morphometric methods. PLoS ONE 2020, 15, e0229255. [Google Scholar] [CrossRef]
- Maass, P.; Friedling, L.J. Assessment of sex and ancestry variation of the morphology of the fibula. Antropol. Anz. 2020, 77, 345–354. [Google Scholar] [CrossRef]
- Rohlf, F.J.; Slice, D. Extensions of the Procrustes method for the optimal superimposition of landmarks. Syst. Biol. 1990, 39, 40–59. [Google Scholar] [CrossRef] [Green Version]
- Walker, J.A. Ability of geometric morphometric methods to estimate a known covariance matrix. Syst. Biol. 2000, 49, 686–696. [Google Scholar] [CrossRef]
- Klingenberg, C.P. How exactly did the nose get that long? A critical rethinking of the pinocchio effect and how shape changes relate to landmarks. Evol. Biol. 2021, 48, 115–127. [Google Scholar] [CrossRef]
- Dayal, M.R.; Kegley, A.D.; Štrkalj, G.; Bidmos, M.A.; Kuykendall, K.L. The history and composition of the Raymond A. Dart Collection of Human Skeletons at the University of the Witwatersrand, Johannesburg, South Africa. Am. J. Phys. Anthropol. 2009, 140, 324–335. [Google Scholar] [CrossRef]
- Belcastro, M.G.; Bonfiglioli, B.; Pedrosi, M.E.; Zuppello, M.; Tanganelli, V.; Mariotti, V. The history and composition of the Identified Human Skeletal Collection of the Certosa Cemetery (Bologna, Italy, 19th–20th century). Int. J. Osteoarchaeol. 2017, 27, 912–925. [Google Scholar] [CrossRef]
- Belcastro, M.G.; Pietrobelli, A.; Rastelli, E.; Iannuzzi, V.; Toselli, S.; Mariotti, V. Variations in epiphyseal fusion and persistence of the epiphyseal line in the appendicular skeleton of two identified modern (19th–20th c.) adult Portuguese and Italian samples. Am. J. Phys. Anthropol. 2019, 169, 448–463. [Google Scholar] [CrossRef]
- Pietrobelli, A.; Sorrentino, R.; Notariale, V.; Durante, S.; Benazzi, S.; Marchi, D.; Belcastro, M.G. Comparability of skeletal fibulae surfaces generated by different source scanning (dual-energy CT scan vs. high resolution laser scanning) and 3D geometric morphometric validation. J. Anat. 2022, 1–16. [Google Scholar] [CrossRef]
- Soodmand, E.; Kluess, D.; Varady, P.A.; Cichon, R.; Schwarze, M.; Gehweiler, D.; Niemeyer, F.; Pahr, D.; Woiczinski, M. Interlaboratory comparison of femur surface reconstruction from CT data compared to reference optical 3D scan. BioMed. Eng. OnLine 2018, 17, 29. [Google Scholar] [CrossRef] [Green Version]
- Stephen, J.M.; Calder, J.D.; Williams, A.; El Daou, H. Comparative accuracy of lower limb bone geometry determined using MRI, CT, and direct bone 3D models. J. Orthop. Res. 2021, 39, 1870–1876. [Google Scholar] [CrossRef]
- Spoor, C.F.; Zonneveld, F.W.; Macho, G.A. Linear measurements of cortical bone and dental enamel by computed tomography: Applications and problems. Am. J. Phys. Anthropol. 1993, 91, 469–484. [Google Scholar] [CrossRef]
- Coleman, M.N.; Colbert, M.W. Technical note: CT thresholding protocols for taking measurements on three-dimensional models. Am. J. Phys. Anthropol. 2007, 133, 723–725. [Google Scholar] [CrossRef]
- Zanolli, C.; Martinón-Torres, M.; Bernardini, F.; Boschian, G.; Coppa, A.; Dreossi, D.; Mancini, L.; Martínez de Pinillos, M.; Martín-Francés, L.; Bermúdez de Castro, J.M.; et al. The Middle Pleistocene (MIS 12) human dental remains from Fontana Ranuccio (Latium) and Visogliano (Friuli-Venezia Giulia), Italy. A comparative high resolution endostructural assessment. PLoS ONE 2018, 13, e0189773. [Google Scholar] [CrossRef] [Green Version]
- Niel, M.; Chaumoître, K.; Corny, J.; Lalys, L.; Adalian, P. Maturation of the human foetal basioccipital: Quantifying shape changes in second and third trimesters using elliptic Fourier analysis. J. Anat. 2019, 235, 34–44. [Google Scholar] [CrossRef]
- Slice, D.E. Modern Morphometrics in Physical Anthropology, 1st ed.; Springer Science & Business Media: New York, NY, USA, 2006. [Google Scholar]
- Gunz, P.; Mitteroecker, P.; Bookstein, F.L. Semilandmarks in Three Dimensions. In Modern Morphometrics in Physical Anthropology, 1st ed.; Slice, D.E., Ed.; Springer Science & Business Media: New York, NY, USA, 2006; pp. 73–98. [Google Scholar]
- Gunz, P.; Mitteroecker, P. Semilandmarks: A method for quantifying curves and surfaces. Hystrix Ital. J. Mammal. 2013, 24, 103–109. [Google Scholar] [CrossRef]
- R Core Team. R: A Language and Environment for Statistical Computing. R Foundation for Statistical Computing, Vienna, Austria. Available online: https://www.R-project.org/ (accessed on 26 April 2022).
- Adams, D.C.; Collyer, M.L.; Kaliontzopoulou, A. Geomorph: Software for Geometric Morphometric Analyses; R package version 3.0.7 (Version 3.2.0). Available online: https://cran.r-project.org/package=geomorph (accessed on 26 April 2022).
- Schlager, S. Morpho and Rvcg—Shape Analysis in R. In Statistical Shape and Deformation Analysis; Zheng, G., Li, S., Szekely, G., Eds.; Academic Press: Cambridge, MA, USA, 2017; pp. 217–256. [Google Scholar]
- Klingenberg, C.P. Size, shape, and form: Concepts of allometry in geometric morphometrics. Dev. Genes Evol. 2016, 226, 113–137. [Google Scholar] [CrossRef]
- Bookstein, F.L. Morphometric Tools for Landmark Data: Geometry and Biology; Cambridge University Press: Cambridge, UK, 1991. [Google Scholar]
- Bailey, S.E.; Benazzi, S.; Hublin, J.J. Allometry, merism, and tooth shape of the upper deciduous M2 and permanent M1. Am. J. Phys. Anthropol. 2014, 154, 104–114. [Google Scholar] [CrossRef]
- Jolliffe, I.T. Principal Component Analysis; Springer: New York, NY, USA, 2002. [Google Scholar]
- Marchi, D.; Rimoldi, A.; Garcia-Martinez, D.; Bastir, M. Morphological correlates of distal fibular morphology with locomotion in great apes, humans, and Australopithecus afarensis. Am. J. Biol. Anthropol. 2022, 178, 286–300. [Google Scholar] [CrossRef]
- Crowder, C.; Austin, D. Age ranges of epiphyseal fusion in the distal tibia and fibula of contemporary males and females. J. Forensic Sci. 2005, 50, 1001–1007. [Google Scholar] [CrossRef] [PubMed]
- Dargel, J.; Michael, J.; Feiser, J.; Ivo, R.; Koebke, J. Human knee joint anatomy revisited: Morphometry in the light of sex-specific total knee arthroplasty. J. Arthroplast. 2011, 26, 346–353. [Google Scholar] [CrossRef] [PubMed]
- El-Ashker, S.; Carson, B.P.; Ayala, F.; De Ste Croix, M.B. Sex-related differences in joint-angle-specific functional hamstring-to-quadriceps strength ratios. Knee Surg. Sports Traumatol. Arthrosc. 2017, 25, 949–957. [Google Scholar] [CrossRef] [PubMed]
- Li, K.; Cavaignac, E.; Xu, W.; Cheng, Q.; Telmon, N.; Huang, W. Morphometric evaluation of the knee in Chinese population reveals sexual dimorphism and age-related differences. Int. Orthop. 2018, 42, 2349–2356. [Google Scholar] [CrossRef] [PubMed]
- Yurek, W.J.; Gianakos, A.L.; Mulcahey, M.K. Ankle Anatomy and Biomechanics. In The Female Athlete; Frank, R.M., Ed.; Elsevier: Amsterdam, The Netherlands, 2022; Chapter 12; pp. 161–167. [Google Scholar] [CrossRef]
- O’Connor, K.; Bragdon, G.; Baumhauer, J.F. Sexual dimorphism of the foot and ankle. Orthop. Clin. N. Am. 2006, 37, 569–574. [Google Scholar] [CrossRef]
- Harris, S.; Case, D.T. Sexual dimorphism in the tarsal bones: Implications for sex determination. J. Forensic Sci. 2012, 57, 295–305. [Google Scholar] [CrossRef]
- Edwards, D.L.; Jakobi, J.M. Comparison of daily muscle activity with electromyography in young and old men. Appl. Physiol. Nutr. Metab. 2006, 31, S22. [Google Scholar]
- Edwards, D.L.; Jakobi, J.M. Characterization of muscular rest periods (gaps) in long-term EMG of older men and women. Med. Sci. Sports Exerc. 2007, 39, S269. [Google Scholar] [CrossRef]
- Harwood, B.; Edwards, D.L.; Jakobi, J.M. Quantifying muscular activation and rest in a discrete functional task of older men and women. Med. Sci. Sports Exerc. 2007, 29, S267. [Google Scholar] [CrossRef]
- Harwood, B.; Edwards, D.L.; Jakobi, J.M. Age- and sex-related differences in muscle activation for a discrete functional task. B Eur. J. Appl. Physiol. 2007, 103, 677–686. [Google Scholar] [CrossRef]
- Adjei, E.; Nalam, V.; Lee, H. Sex differences in human ankle stiffness during standing balance. Front. Sports Act. Living 2020, 2, 570449. [Google Scholar] [CrossRef]
- Trevino, J.; Lee, H. Sex differences in 2-dof human ankle stiffness in relaxed and contracted muscles. Ann. Biomed. Eng. 2018, 46, 2048–2056. [Google Scholar] [CrossRef]
- Wilkerson, R.D.; Mason, M.A. Differences in men’s and women’s mean ankle ligamentous laxity. Iowa Orthop. J. 2000, 20, 46–48. [Google Scholar]
- Beynnon, B.D.; Renstrom, P.A.; Alosa, D.M.; Baumhauer, J.F.; Vacek, P.M. Ankle ligament injury risk factors: A prospective study of college athletes. J. Orthop. Res. 2001, 19, 213–220. [Google Scholar] [CrossRef]
- Kubo, K.; Kanehisa, H.; Fukunaga, T. Gender differences in the viscoelastic properties of tendon structures. Eur. J. Appl. Physiol. 2003, 88, 520–526. [Google Scholar] [CrossRef]
- Janssen, I.; Heymsfield, S.B.; Wang, Z.M.; Ross, R. Skeletal muscle mass and distribution in 468 men and women aged 18-88 year. J. Appl. Physiol. 2000, 89, 81–88. [Google Scholar] [CrossRef] [Green Version]
- Miller, A.E.; MacDougall, J.D.; Tarnopolsky, M.A.; Sale, D.G. Gender differences in strength and muscle fiber characteristics. Eur. J. Appl. Physiol. Occup. Physiol. 1993, 66, 254–262. [Google Scholar] [CrossRef]
- Takabayashi, T.; Edama, M.; Nakamura, M.; Nakamura, E.; Inai, T.; Kubo, M. Gender differences associated with rearfoot, midfoot, and forefoot kinematics during running. Eur. J. Sport. Sci. 2017, 17, 1289–1296. [Google Scholar] [CrossRef]
- Beynnon, B.D.; Bernstein, I.M.; Belisle, A.; Brattbakk, B.; Devanny, P.; Risinger, R.; Durant, D. The effect of estradiol and progesterone on knee and ankle joint laxity. Am. J. Sports Med. 2005, 33, 1298–1304. [Google Scholar] [CrossRef]
- Parker, K.M.; Hagen, M.S. Chapter 1-Knee Anatomy and Biomechanics. In The Female Athlete; Frank, R.M., Ed.; Elsevier: Amsterdam, The Netherlands, 2022; pp. 1–11. [Google Scholar] [CrossRef]
- Sorrentino, R.; Stephens, N.B.; Carlson, K.J.; Figus, C.; Fiorenza, L.; Frost, S.; Harcourt-Smith, W.; Parr, W.; Saers, J.; Turley, K.; et al. The influence of mobility strategy on the modern human talus. Am. J. Phys. Anthropol. 2020, 171, 456–469. [Google Scholar] [CrossRef]
- Degen, N.; Sass, J.; Jalali, J.; Kovacs, L.; Euler, E.; Prall, W.C.; Böcker, W.; Thaller, P.H.; Fürmetz, J. Three-dimensional assessment of lower limb alignment: Reference values and sex-related differences. Knee 2020, 27, 428–435. [Google Scholar] [CrossRef]
- Sepic, S.B.; Murray, M.P.; Mollinger, L.A.; Spurr, G.B.; Gardner, G.M. Strength and range of motion in the ankle in two age groups of men and women. Am. J. Phys. Med. 1986, 65, 75–83. [Google Scholar]
- Wunderlich, R.E.; Cavanagh, P.R. Gender differences in adult foot shape: Implications for shoe design. Med. Sci. Sports Exerc. 2001, 34, 605–611. [Google Scholar] [CrossRef]
- Callewaert, F.; Sinnesael, M.; Gielen, E.; Boonen, S.; Vanderschueren, D. Skeletal sexual dimorphism: Relative contribution of sex steroids, GH–IGF1, and mechanical loading. J. Endocrinol. 2010, 207, 127–134. [Google Scholar] [CrossRef]
- Scheuer, L.; Black, S. Developmental Juvenile Osteology; Elsevier Academic Press: San Diego, CA, USA, 2000. [Google Scholar]
- López-Costas, O.; Rissech, C.; Trancho, G.; Turbón, D. Postnatal ontogenesis of the tibia. Implications for age and sex estimation. Forensic Sci. Int. 2012, 214, 207.e1–207.e11. [Google Scholar] [CrossRef] [Green Version]
- Malina, R.; Johnston, F. Relations between bone, muscle, and fat widths in the upper arms and calves of boys and girls studied cross-sectionally at ages 6 to 16 years. Hum. Biol. 1967, 39, 211–223. [Google Scholar]
- Humphrey, L.T. Growth patterns in the modern human skeleton. Am. J. Phys. Anthropol. 1998, 105, 57–72. [Google Scholar] [CrossRef]
- Stull, K.E.; L’Abbe, E.N.; Ousley, S.D. Subadult sex estimation from diaphyseal dimensions. Am. J. Phys. Anthropol. 2017, 163, 64–74. [Google Scholar] [CrossRef] [PubMed]
- Pietrobelli, A.; Marchi, D.; Belcastro, M.G. The relationship between bipedalism and growth: A metric assessment in a documented modern skeletal collection (Certosa Collection, Bologna, Italy). Am. J. Biol. Anthropol. 2022, 177, 669–689. [Google Scholar] [CrossRef]
- Seeman, E. Sexual dimorphism in skeletal size, density, and strength. J. Clin. Endocr. 2001, 86, 4576–4584. [Google Scholar] [CrossRef]
- McKern, T.W.; Stewart, T.D. Skeletal Age Changes in Young American Males Analyzed from the Standpoint of Age Identification; Technical Report EP-45; Environmental Protection Research Division, Quartermaster Research and Development Center, U.S. Army: Natick, MA, USA, 1957.
- Frayer, D.W.; Wolpoff, M.H. Sexual dimorphism. Annu. Rev. Anthropol. 1985, 14, 429–473. [Google Scholar] [CrossRef]
- Lazenby, R.A. Population variation in second metacarpal sexual size dimorphism. Am. J. Phys. Anthropol. 2002, 118, 378–384. [Google Scholar] [CrossRef]
- Sacragi, A.; Ikeda, T.; Terada, H. Fibulo-tibial weight index--a new criterion for sex identification based on the lower leg bones. Acta Anatomica 1993, 147, 193–196. [Google Scholar] [CrossRef]
- Krogman, W.M.; Iscan, M.Y. The Human Skeleton in Forensic Medicine, 2nd ed.; Charles, C., Ed.; Thomas Springfield: Springfield, IL, USA, 1986. [Google Scholar]
- Price, B.; Cameron, N.; Tobias, P.V. A further search for a secular trend of adult body size in South African|Blacks: Evidence from the femur and tibia. Hum. Biol. 1987, 59, 467–475. Available online: http://www.jstor.org/stable/41464819 (accessed on 14 March 2022).


| Population | Age Range | Females | Males | Total |
|---|---|---|---|---|
| Emilia-Romagna (MHISC UBOL *) | 18–84 | 24 (18%) | 23 (17%) | 47 |
| Sardinia (MHISC UBOL) | 17–88 | 29 (21%) | 43 (31%) | 72 |
| South Africa (Dart Collection) | 20–90 | 10 (7%) | 7 (5%) | 17 |
| Total | 17–90 | 63 (46%) | 73 (54%) | 136 |
| Landmarks | Definition | |
|---|---|---|
| L1 | Point where the fibular anterolateral border divides into two ridges: the proximal apex of the subcutaneous triangular surface (STS) | |
| L2 | Most medial point of the medial border of the STS | |
| L3 | Most lateral point of the lateral border of the STS | |
| L4 | Most distal point of the lateral malleolus in anterior view | |
| L5 | Most distal point of the posterior border of the malleolar fossa | |
| L7 | Most anterior point on the anterior border of the proximal fibular-talar articular facet (PAF) | |
| L8 | Point between the anterior border of PAF and the anterior border of distal fibular-talar articular facet (DAF) | |
| L9 | Most distal point of DAF | |
| L10 | Most proximal point on the posterior border of DAF | |
| L12 | Most posterior point of the proximal border of PAF | |
| L13 | Most proximal point of proximal tibiofibular articular facet | |
| L14 | Most proximal point of interosseous tibiofibular ligament (ILA) insertion | |
| L15 | Most proximal point on styloid process of fibular head in medial view | |
| L16 | Most anteroproximal point on anterior border in medial view (above fibular neck) | |
| L17 | Most posteroproximal point on posteromedial border in medial view (above fibular neck) | |
| L18 | Most posteroproximal point on posterior border in lateral view (above fibular neck) | |
| Curves | Definition | N of semi-landmarks |
| C_1->2 | Medial border of the subcutaneous triangular surface (STS) | 5 |
| C_1->3 | Posterior border of the STS | 7 |
| C_7->8 | Anterior border of the proximal fibular-talar articular facet (PAF) | 1 |
| C_8->9 | Anterior border of the distal fibular-talar articular facet (DAF) | 1 |
| C_9->10 | Posterior border of the DAF | 1 |
| C_10->12 | Posterior border of the PAF | 1 |
| C_8->10 | Border between the PAF and DAF | 1 |
| C_13->13 | Outline of proximal tibiofibular articular facet | 6 |
| C_7->12 | Proximal border of the PAF | 2 |
| Surfaces | Definition | N of semi-landmarks |
| SSML_malleolar fossa | Surface of the malleolar fossa, attachment site of the transverse tibiofibular and posterior talofibular ligaments. | 7 |
| SSML_ILA | Attachment surface of interosseous tibiofibular ligament and part of interosseous membrane (ILA) | 13 |
| SSML_fibular groove | Groove for tendons of m. peroneus longus and m. tertius and attachment site of posterior tibiofibular ligament | 13 |
| SSML_STS | Subcutaneous triangular surface (STS) | 24 |
| SSML_FiTal1Ar | Proximal fibular-talar articular facet (PAF) | 4 |
| SSML_FiTal2Ar | Distal fibular-talar articular facet (DAF) | 3 |
| SSML_head | Proximal tibiofibular articular surface | 5 |
| SSML_prox_ep | Surface of proximal epiphysis | 32 |
| Pooled Sample | |||
|---|---|---|---|
| Allometric Trajectories | |||
| Shape | |||
| α (°) | p | ||
| Proximal | ER-SAR | 95.95 | 0.190 |
| ER-SA | 54.24 | 0.987 | |
| SAR-SA | 84.93 | 0.548 | |
| Distal | ER-SAR | 29.75 | 0.381 |
| ER-SA | 35.99 | 0.792 | |
| SAR-SA | 35.84 | 0.520 | |
| Form | |||
| α (°) | p | ||
| Proximal | ER-SAR | 16.92 | 0.234 |
| ER-SA | 24.38 | 0.305 | |
| SAR-SA | 25.54 | 0.440 | |
| Distal | ER-SAR | 9.47 | 0.426 |
| ER-SA | 11.96 | 0.799 | |
| SAR-SA | 12.05 | 0.580 | |
| Pooled Sample | |||
|---|---|---|---|
| Shape | |||
| PCs | N | %acc | |
| Proximal | 10 | 76/133 | 57 |
| Distal | 10 | 85/163 | 62 |
| Form | |||
| PCs | N | %acc | |
| Proximal | 6 | 107/133 | 80 |
| Distal | 4 | 111/136 | 81 |
| Csize | |||
| N | %acc | ||
| Proximal | 102/133 | 76 | |
| Distal | 93/136 | 68 | |
| Separate Populations | ||||
|---|---|---|---|---|
| Allometric Trajectories M-F | ||||
| Shape | ||||
| Proximal | Distal | |||
| α (°) | p | α (°) | p | |
| ER M-F | 76.44 | 0.543 | 31.39 | 0.548 |
| SAR M-F | 54.38 | 0.978 | 36.31 | 0.347 |
| SA M-F | 122.44 | 0.05 | 89.34 | 0.242 |
| Form | ||||
| α (°) | p | α (°) | p | |
| ER M-F | 28.33 | 0.604 | 14.43 | 0.658 |
| SAR M-F | 16.17 | 0.99 | 13.92 | 0.381 |
| SA M-F | 140.21 | 0.195 | 43.16 | 0.215 |
| Emilia-Romagna | Sardinia | South Africa | |||||||
|---|---|---|---|---|---|---|---|---|---|
| Shape | Shape | Shape | |||||||
| PCs | N | %acc | PCs | N | %acc | PCs | N | %acc | |
| Proximal | 10 | 19/47 | 40 | 7 | 39/71 | 54 | 4 | 9/15 | 60 |
| Distal | 5 | 24/47 | 51 | 7 | 52/72 | 72 | 5 | 9/16 | 56 |
| Form | Form | Form | |||||||
| PCs | N | %acc | PCs | N | %acc | PCs | N | %acc | |
| Proximal | 5 | 42/47 | 89 | 6 | 49/71 | 80 | 4 | 8/15 | 53 |
| Distal | 3 | 44/47 | 93 | 4 | 60/72 | 83 | 4 | 8/16 | 50 |
| CS | |||||||||
| N | %acc | N | %acc | N | %acc | ||||
| Proximal | 41/47 | 87 | 49/71 | 69 | 10/15 | 66 | |||
| Distal | 34/47 | 72 | 50/72 | 69 | 11/16 | 68 | |||
Publisher’s Note: MDPI stays neutral with regard to jurisdictional claims in published maps and institutional affiliations. |
© 2022 by the authors. Licensee MDPI, Basel, Switzerland. This article is an open access article distributed under the terms and conditions of the Creative Commons Attribution (CC BY) license (https://creativecommons.org/licenses/by/4.0/).
Share and Cite
Pietrobelli, A.; Sorrentino, R.; Durante, S.; Marchi, D.; Benazzi, S.; Belcastro, M.G. Sexual Dimorphism in the Fibular Extremities of Italians and South Africans of Identified Modern Human Skeletal Collections: A Geometric Morphometric Approach. Biology 2022, 11, 1079. https://doi.org/10.3390/biology11071079
Pietrobelli A, Sorrentino R, Durante S, Marchi D, Benazzi S, Belcastro MG. Sexual Dimorphism in the Fibular Extremities of Italians and South Africans of Identified Modern Human Skeletal Collections: A Geometric Morphometric Approach. Biology. 2022; 11(7):1079. https://doi.org/10.3390/biology11071079
Chicago/Turabian StylePietrobelli, Annalisa, Rita Sorrentino, Stefano Durante, Damiano Marchi, Stefano Benazzi, and Maria Giovanna Belcastro. 2022. "Sexual Dimorphism in the Fibular Extremities of Italians and South Africans of Identified Modern Human Skeletal Collections: A Geometric Morphometric Approach" Biology 11, no. 7: 1079. https://doi.org/10.3390/biology11071079
APA StylePietrobelli, A., Sorrentino, R., Durante, S., Marchi, D., Benazzi, S., & Belcastro, M. G. (2022). Sexual Dimorphism in the Fibular Extremities of Italians and South Africans of Identified Modern Human Skeletal Collections: A Geometric Morphometric Approach. Biology, 11(7), 1079. https://doi.org/10.3390/biology11071079