
Genetic Diversity Trends in the Cultivated Potato: A Spatiotemporal Overview

 ,
,
Abstract
:Simple Summary
Abstract
1. Introduction
2. Materials and Methods
2.1. Plant Materials
2.2. DNA Isolation and SSR Genotyping
2.3. Data Analysis
2.3.1. Allelic Diversity of SSR Loci
2.3.2. SOM Analysis
2.3.3. DAPC Analysis
2.3.4. AMOVA Analysis
3. Results
3.1. Allelic Diversity of SSR Loci
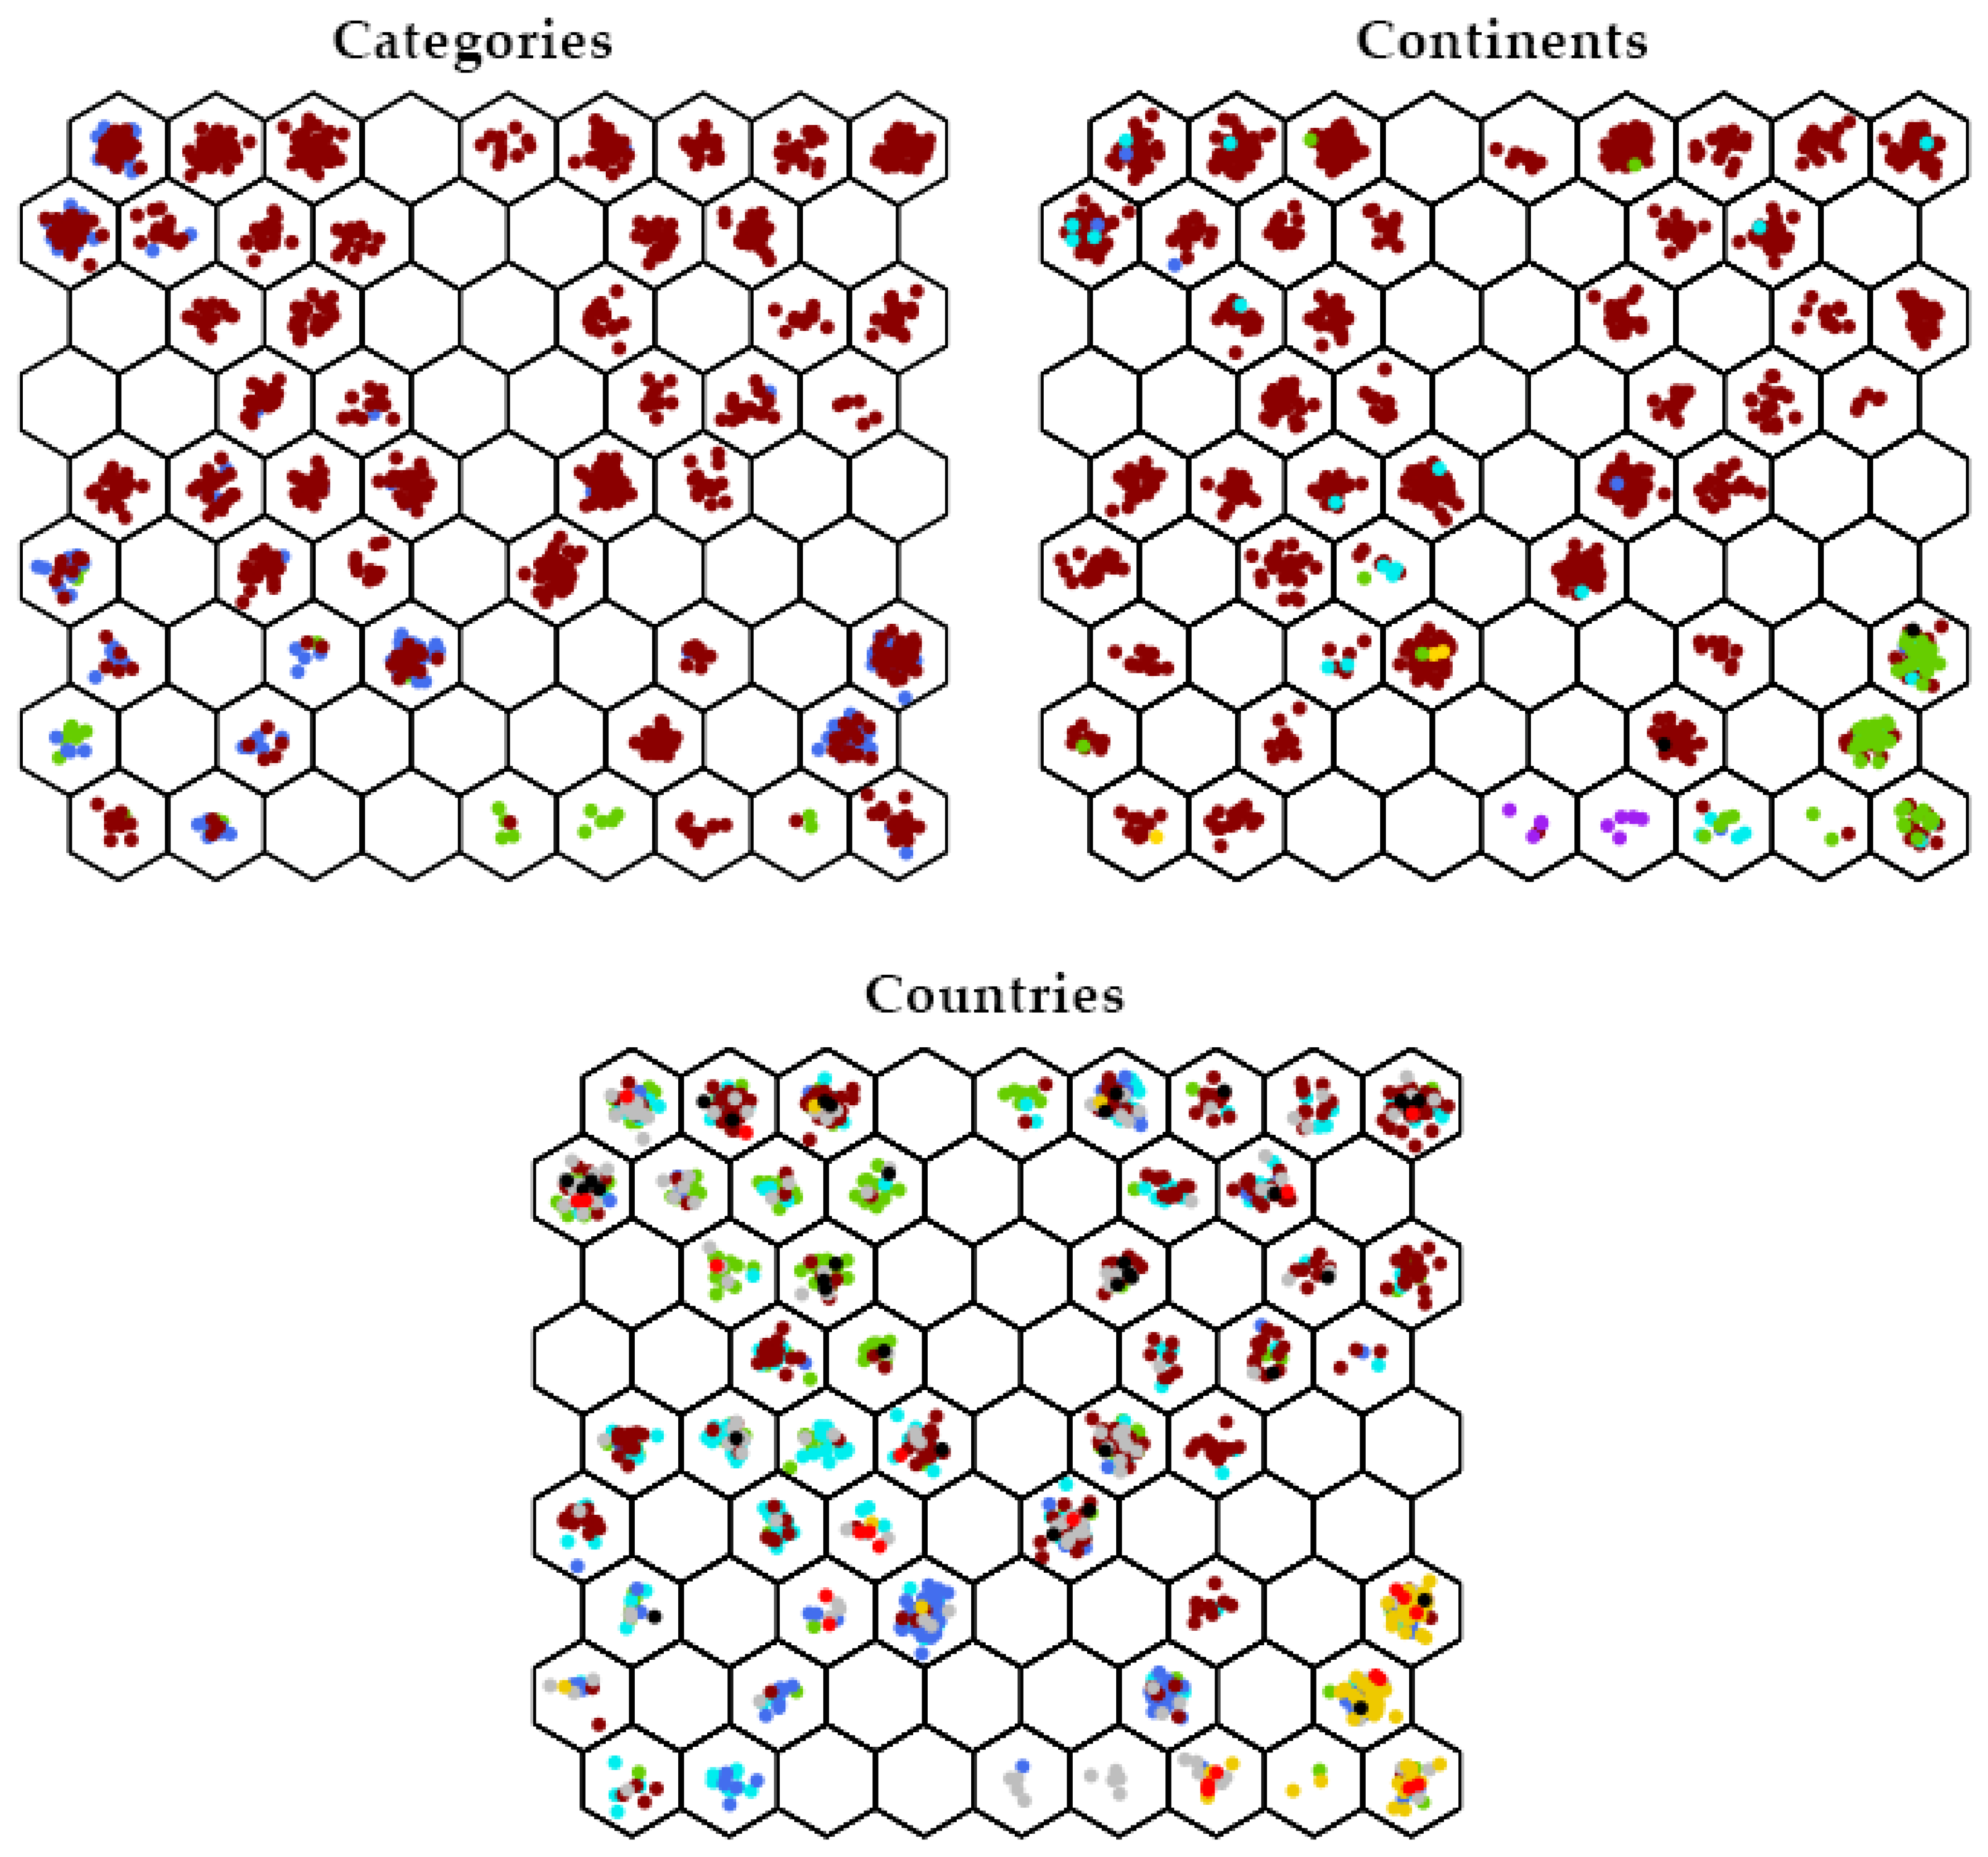
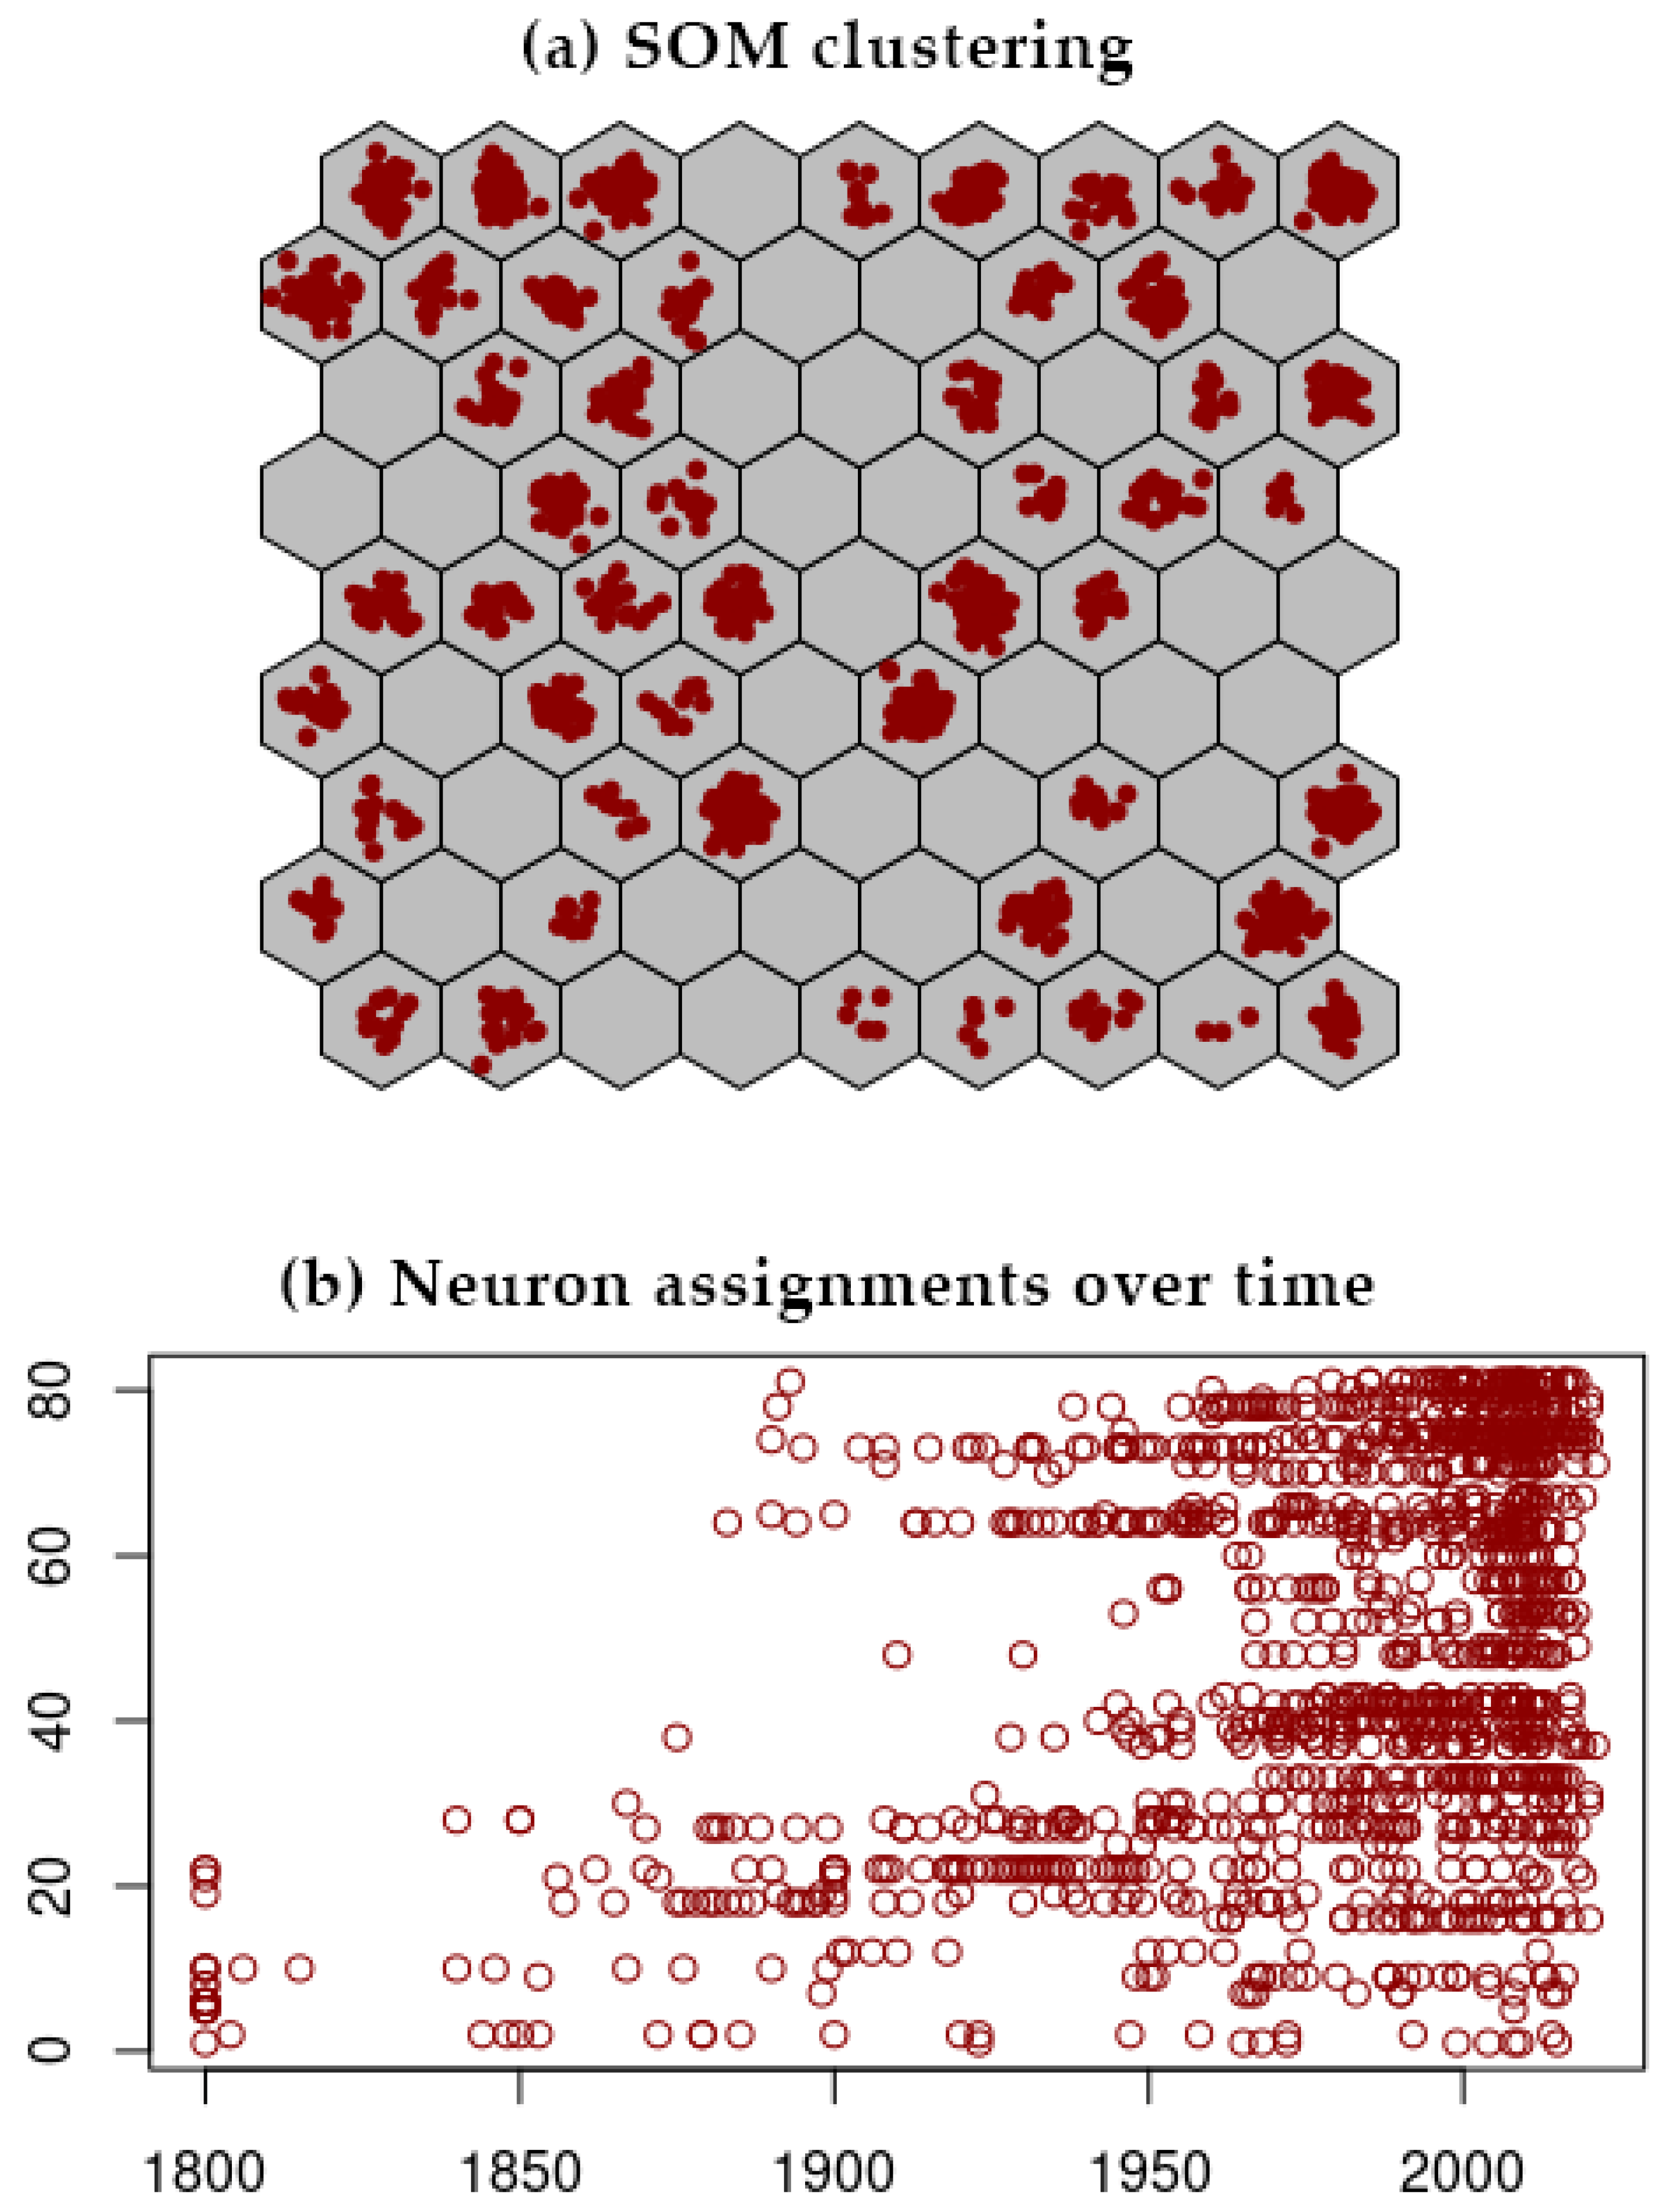
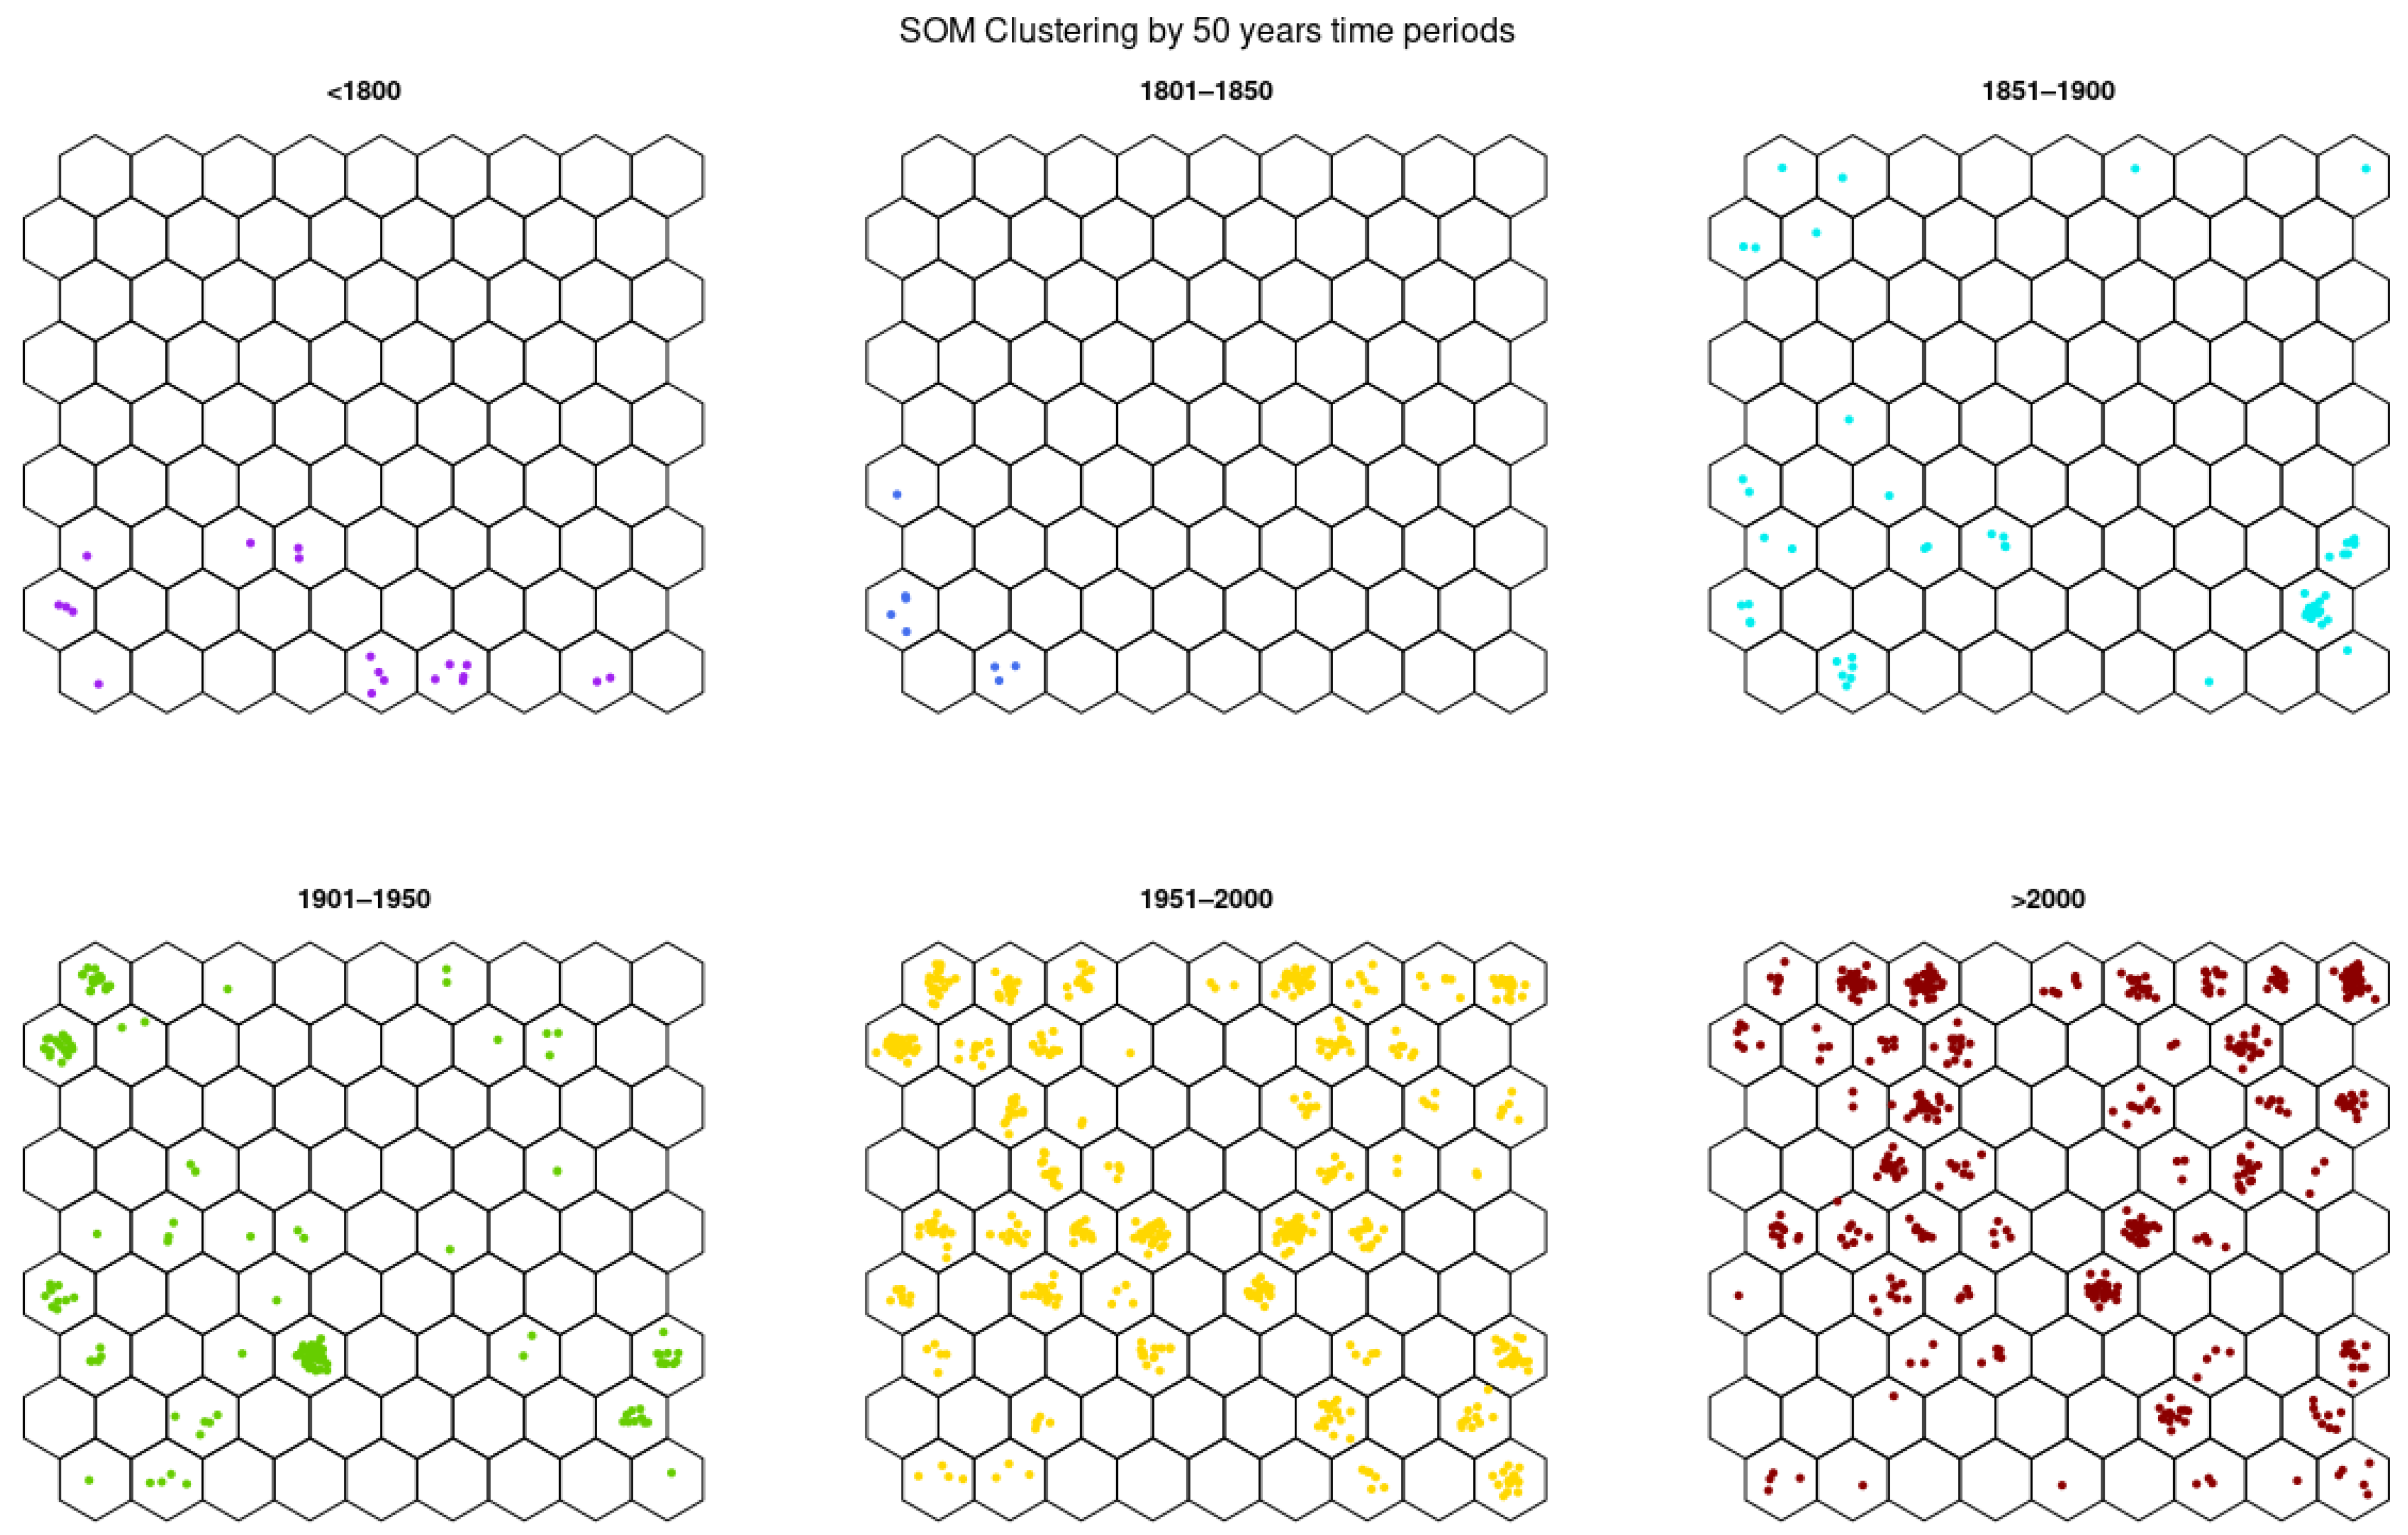
3.2. SOM Analysis
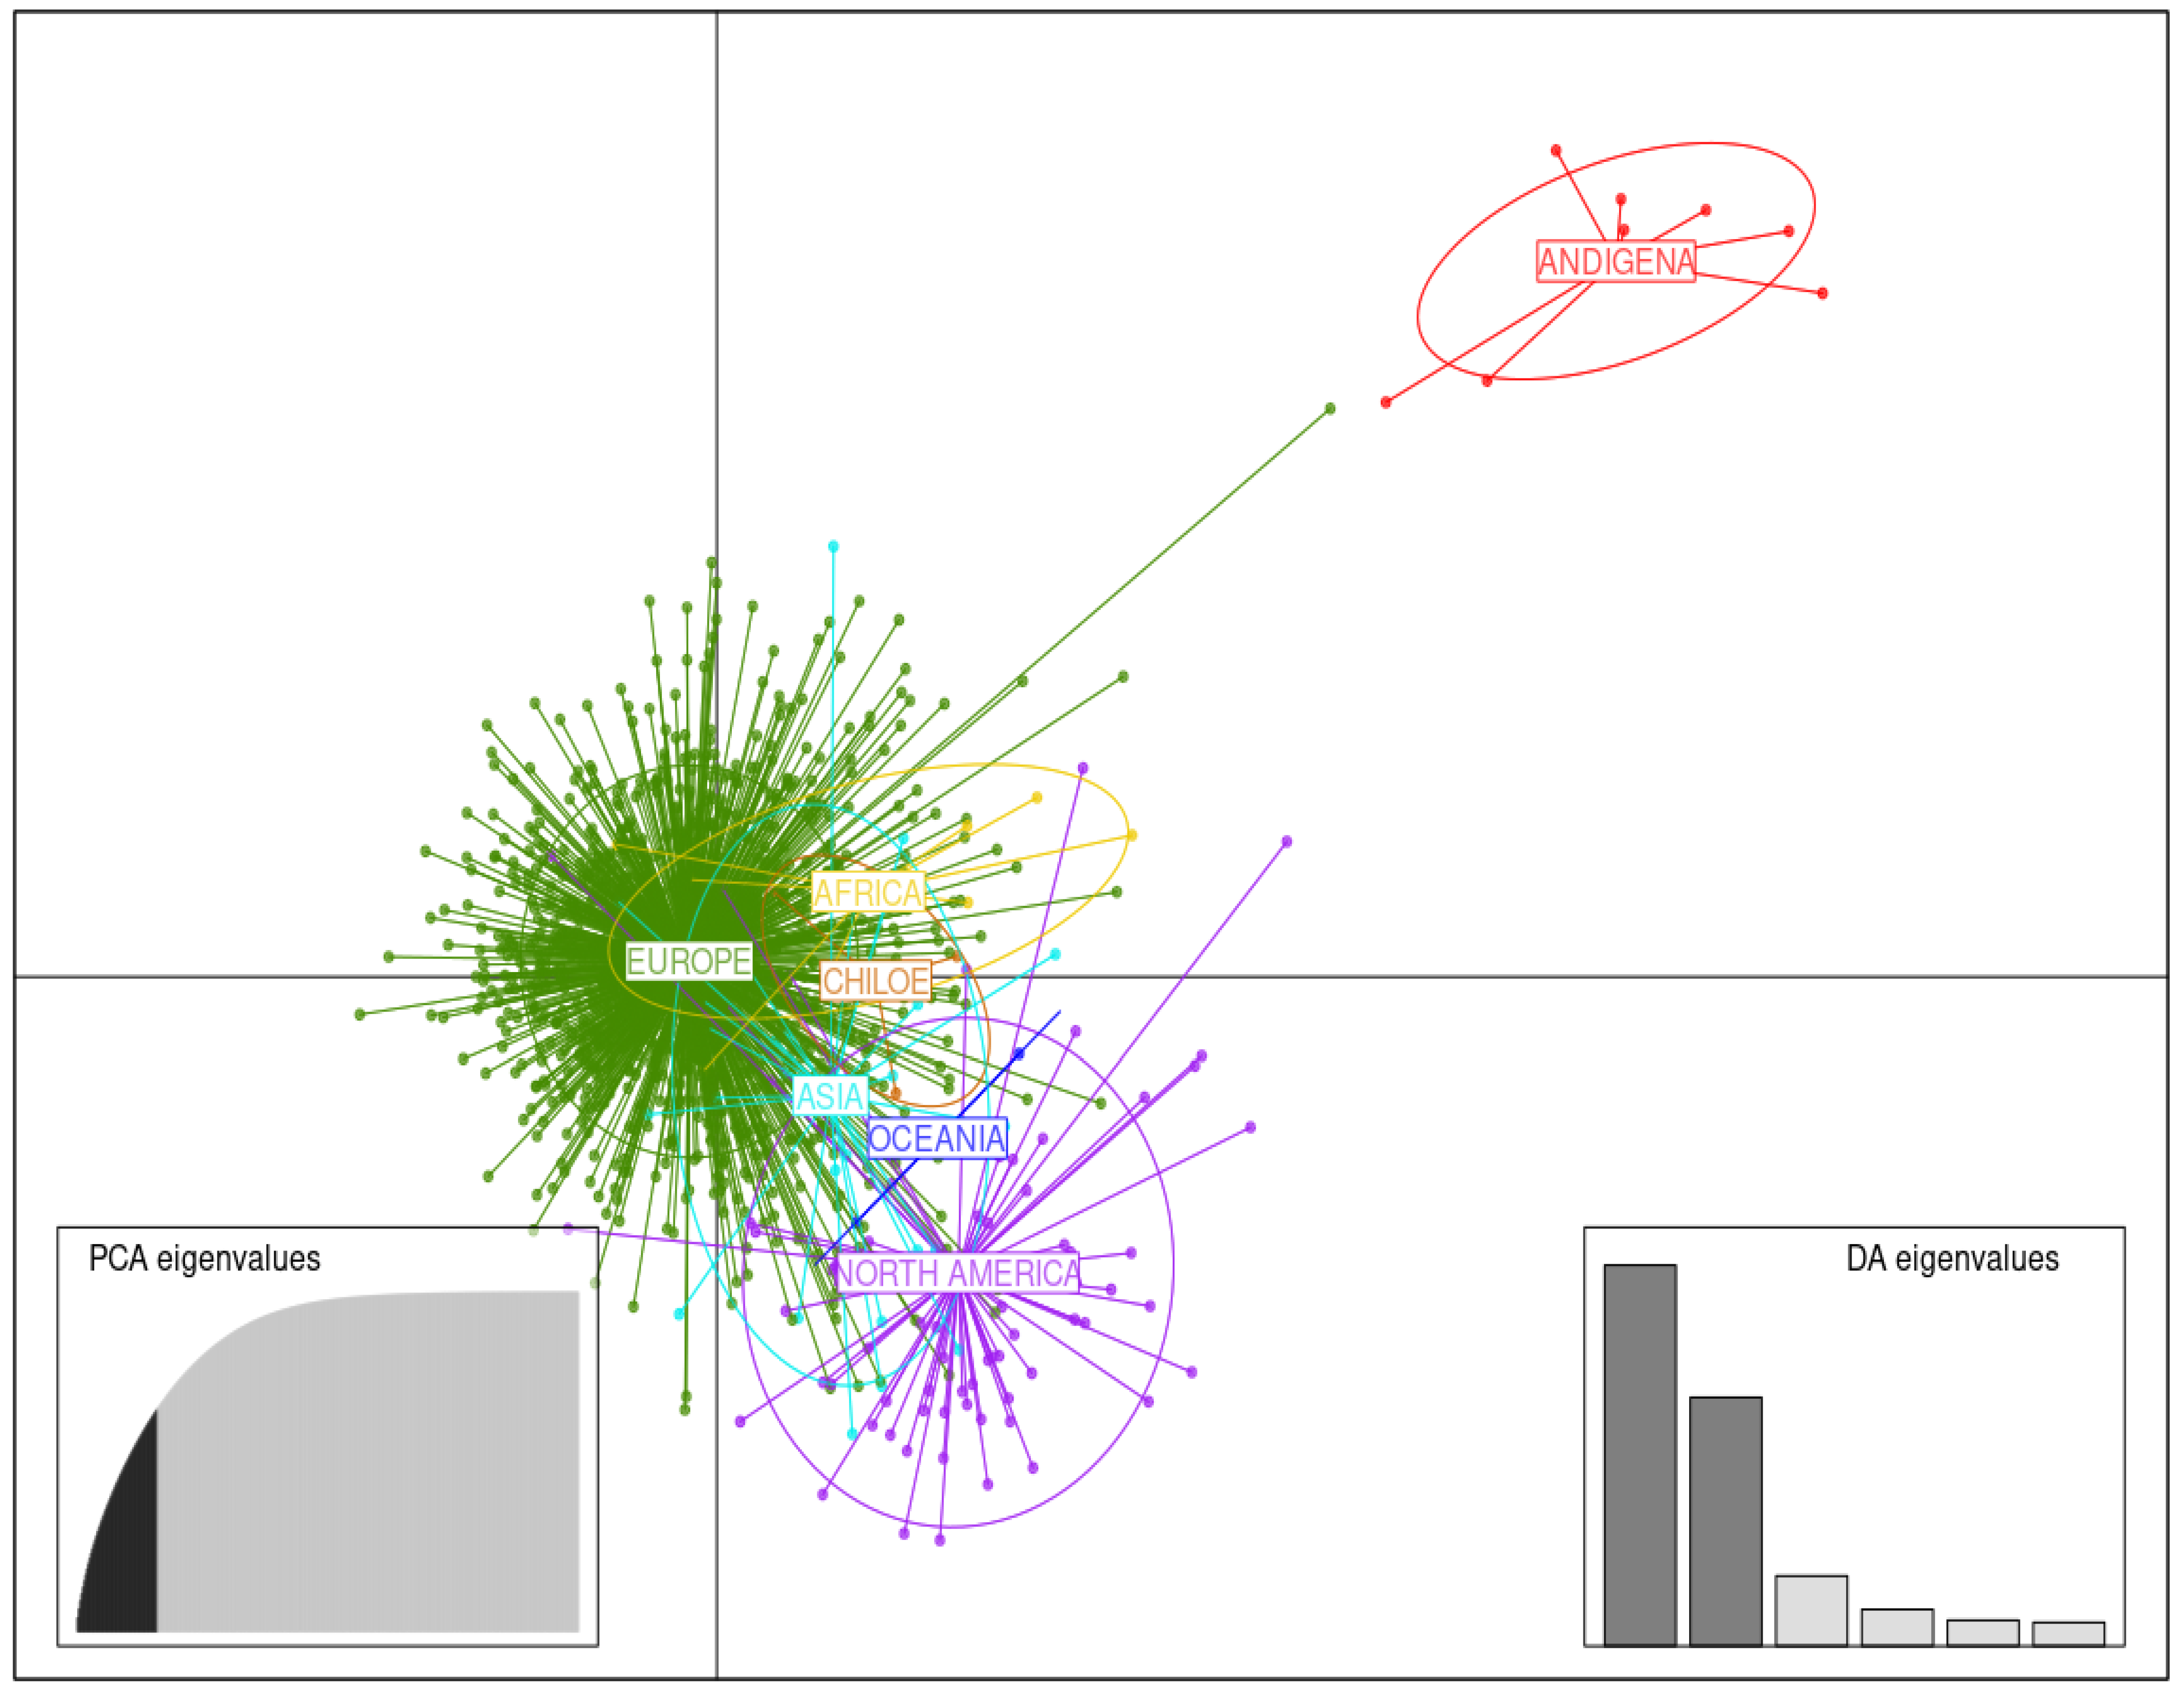
3.3. DAPC Analysis
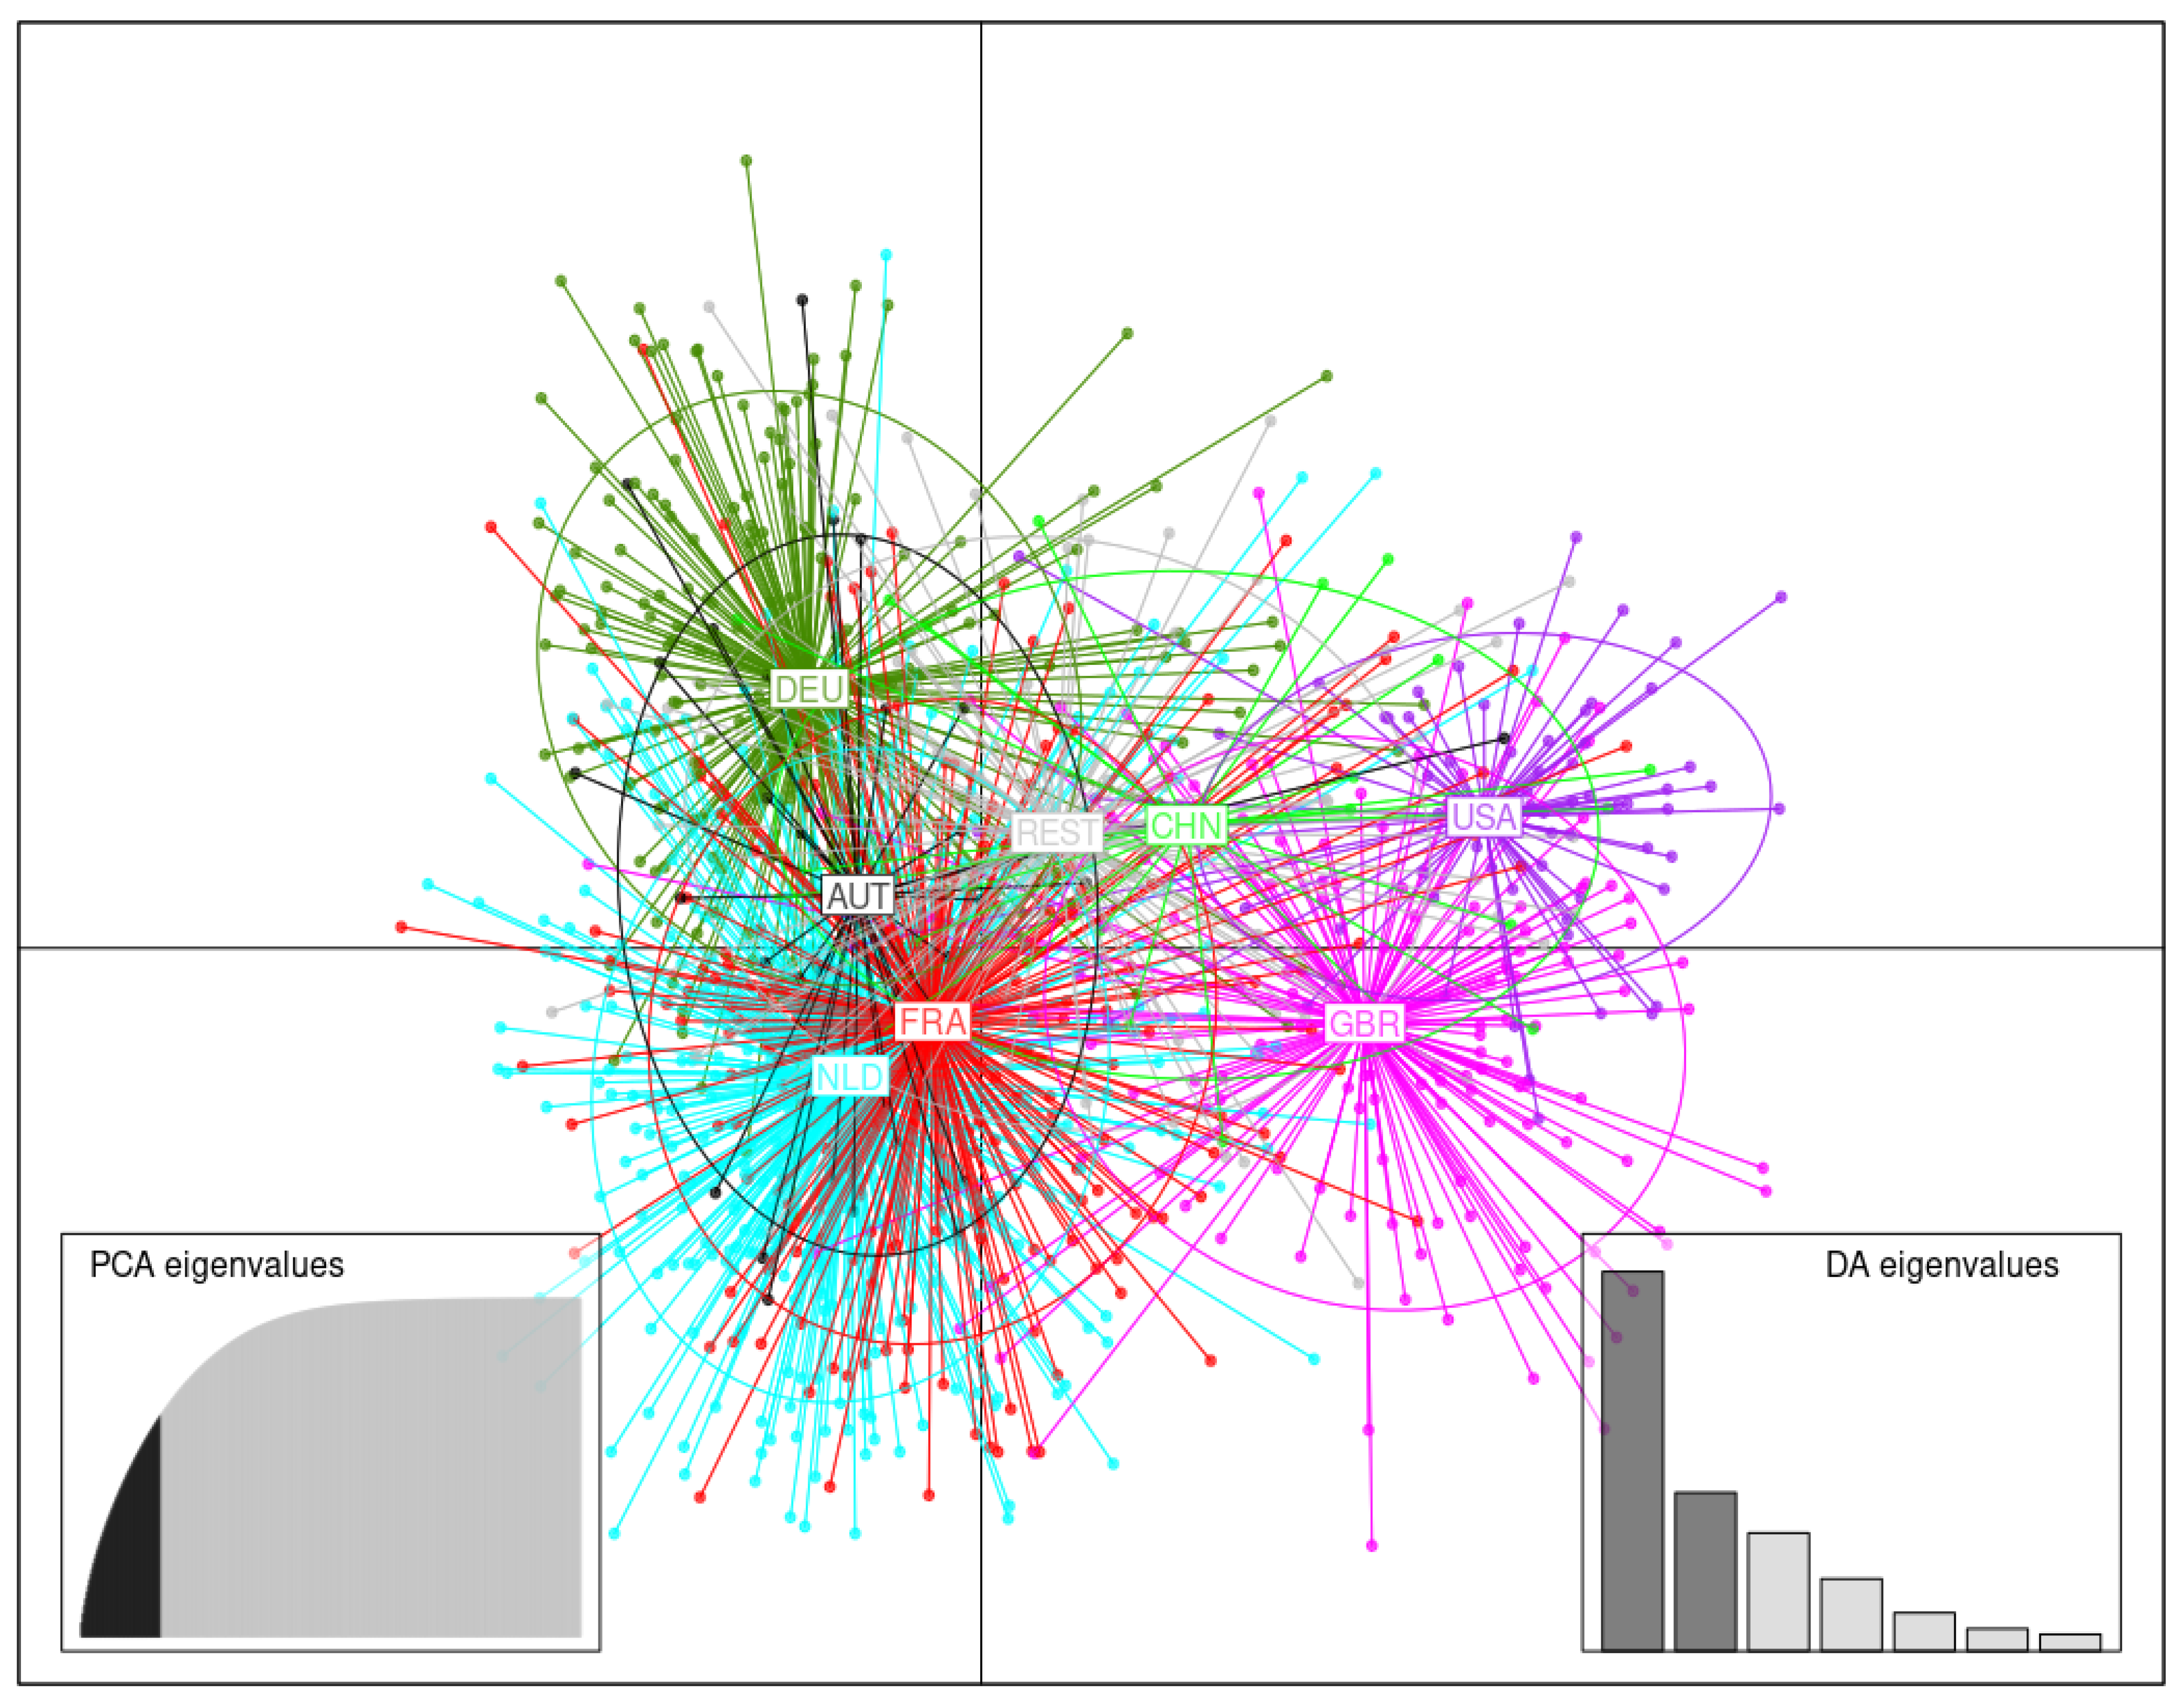
3.3.1. Germplasm of Various Continental Origins
3.3.2. Germplasm Originating in Various Countries
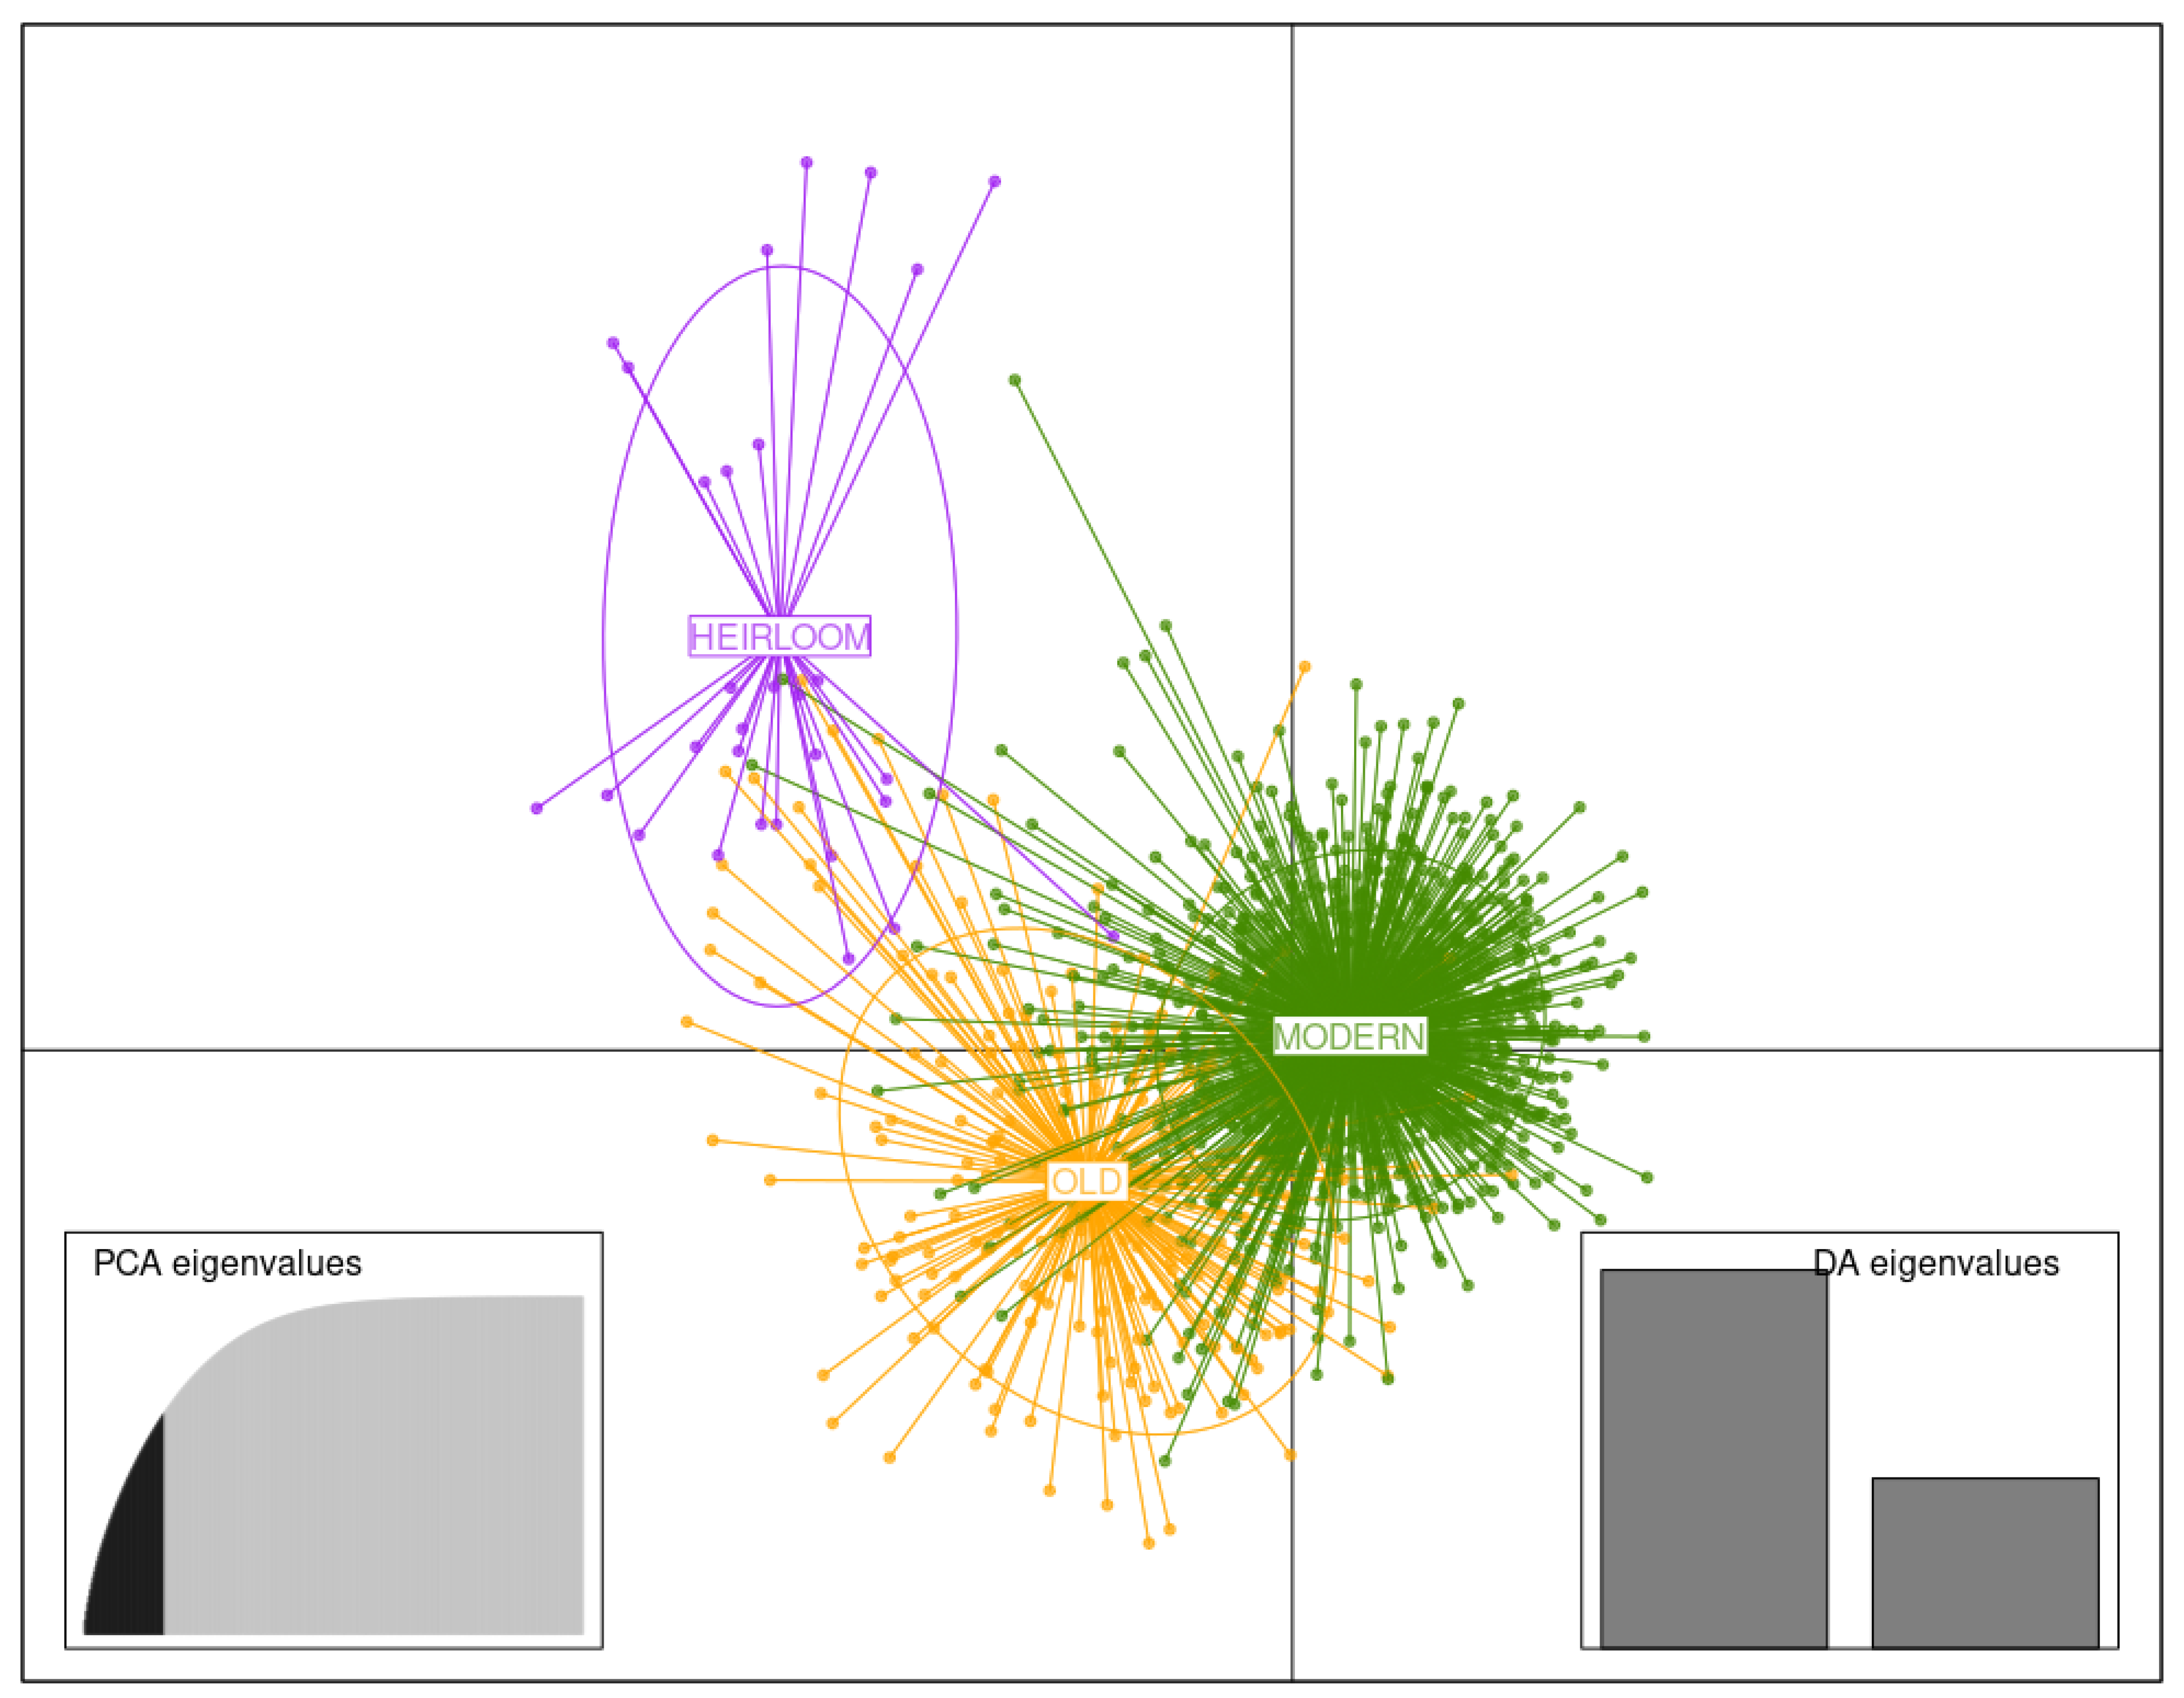
3.3.3. Germplasm of Three Temporal Groups
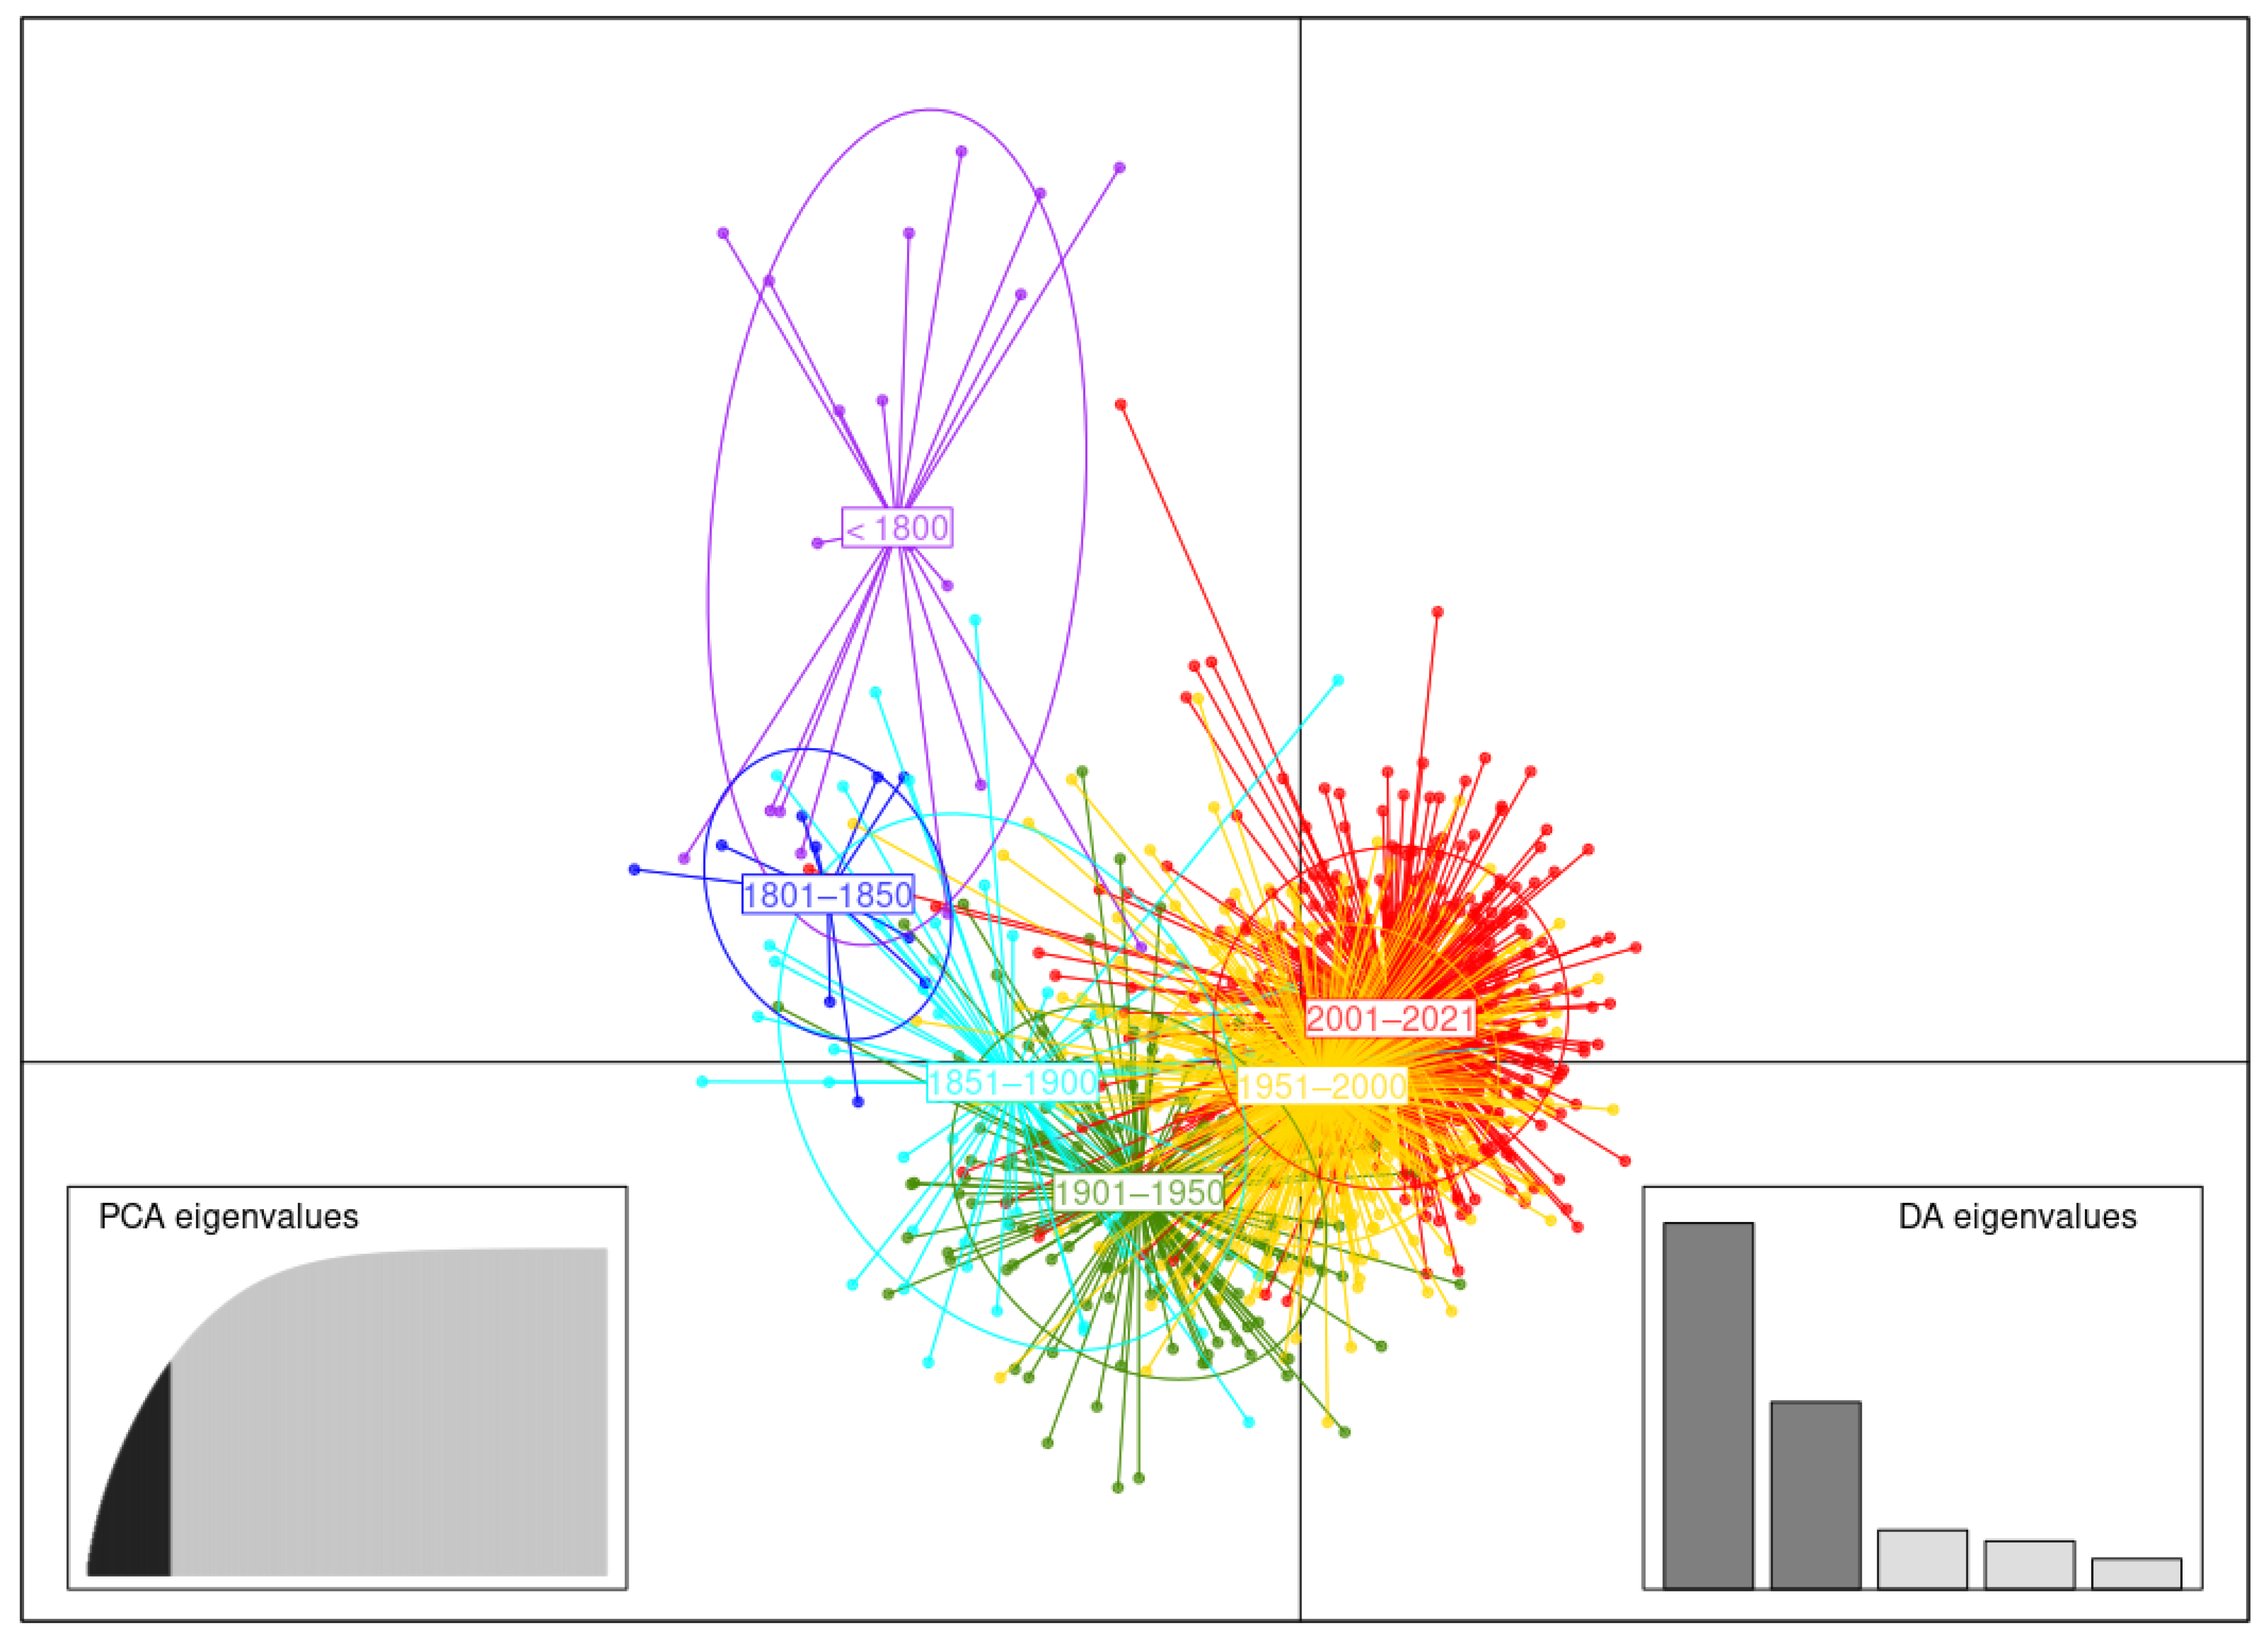
3.3.4. Germplasm of 50-Year Breeding Groups
3.4. AMOVA Analysis
4. Discussion
4.1. How Many Historical Introductions Are at the Origin of Modern Potato Lineages?
4.2. Are There Signs of Genetic Erosion over Time and Space in the Cultivated Potato?
4.3. Is the Impact of the Introduction of Exotic Potato Germplasm into the Modern Cultivated Potato Noticeable?
- (1)
- S. Tuberosum ssp. Andigena CPC 1673 in many breeding programs, which confers resistance to G. rostochiensis pathotypes Ro1 and Ro4 [36,79] as well as to G. pallida pathotype Pa2 [80]. Many resistant tetraploid potato cultivars have S. tuberosum ssp. Andigena CPC 1673 in their pedigree, including Agria, Alcmaria, Amaryl, Amex, Aminca, Carrera, Cherie, Elkana, Mara, Prominent, and Saturna;
- (2)
- Maris Piper and Ulster Glade, cultivars that have been bred with a dominant gene for resistance to cyst nematode, derived from S. tuberosum ssp. Andigena;
- (3)
- Lenape, which has in its second-generation ancestors a wild potato native to the Chaco region in South America, S. chacoense, selected to provide the qualities of resistance to certain diseases, including late blight;
- (4)
- BRA 9089, whose parents are from (Chilote x Svitez) and landrace cross, in the basis of important lineages in China with Mira (syn. Ora) as well as in Germany with Axilia, Leander, Hessenkrone, and Sitta;
- (5)
- Improved clones VTN 62-033-03 and AM 66-0042 using S. vernei and S. demissum for targeted resistance to certain diseases and high starch yield. These two ancestors are highly represented in the pedigree of modern varieties.
5. Conclusions
Supplementary Materials
Author Contributions
Funding
Institutional Review Board Statement
Informed Consent Statement
Data Availability Statement
Acknowledgments
Conflicts of Interest
References
- Hajjar, R.; Jarvis, D.I.; Gemmill-Herren, B. The utility of crop genetic diversity in maintaining ecosystem services. Agric. Ecosyst. Environ. 2008, 123, 261–270. [Google Scholar] [CrossRef]
- Van de Wouw, M.; Kik, C.; van Hintum, T.; van Treuren, R.; Visser, B. Genetic erosion in crops: Concept, research results and challenges. Plant Genet. Resour. 2010, 8, 1–15. [Google Scholar] [CrossRef]
- Fu, Y.-B. Understanding crop genetic diversity under modern plant breeding. Theor. Appl. Genet. 2015, 128, 2131–2142. [Google Scholar] [CrossRef] [PubMed]
- Devaux, A.; Goffart, J.-P.; Kromann, P.; Andrade-Piedra, J.; Polar, V.; Hareau, G. The Potato of the Future: Opportunities and Challenges in Sustainable Agri-food Systems. Potato Res. 2021, 64, 681–720. [Google Scholar] [CrossRef]
- Van Berloo, R.; Hutten, R.C.B. Peditree: Pedigree Database Analysis and Visualization for Breeding and Science. J. Hered. 2005, 96, 465–468. [Google Scholar] [CrossRef]
- Machida-Hirano, R. Diversity of potato genetic resources. Breed. Sci. 2015, 65, 26–40. [Google Scholar] [CrossRef]
- Deperi, S.I.; Tagliotti, M.E.; Bedogni, M.C.; Manrique-Carpintero, N.C.; Coombs, J.; Zhang, R.; Douches, D.; Huarte, M.A. Discriminant analysis of principal components and pedigree assessment of genetic diversity and population structure in a tetraploid potato panel using SNPs. PLoS ONE 2018, 13, e0194398. [Google Scholar] [CrossRef]
- Malosetti, M.; van der Linden, C.G.; Vosman, B.; van Eeuwijk, F.A. A mixed-model approach to association mapping using pedigree information with an illustration of resistance to Phytophthora infestans in potato. Genetics 2007, 175, 879–889. [Google Scholar] [CrossRef]
- D’hoop, B.B.; Paulo, M.J.; Kowitwanich, K.; Sengers, M.; Visser, R.G.F.; van Eck, H.J.; van Eeuwijk, F.A. Population structure and linkage disequilibrium unravelled in tetraploid potato. Theor. Appl. Genet. 2010, 121, 1151–1170. [Google Scholar] [CrossRef]
- Li, X.; Xu, J.; Duan, S.; Bian, C.; Hu, J.; Shen, H.; Li, G.; Jin, L. Pedigree-Based Deciphering of Genome-Wide Conserved Patterns in an Elite Potato Parental Line. Front. Plant Sci. 2018, 9, 690. [Google Scholar] [CrossRef]
- Song, Y.S.; Hepting, L.; Schweizer, G.; Hartl, L.; Wenzel, G.; Schwarzfischer, A. Mapping of extreme resistance to PVY (Ry (sto) on chromosome XII using anther-culture-derived primary dihaploid potato lines. Theor. Appl. Genet. 2005, 111, 879–887. [Google Scholar] [CrossRef] [PubMed]
- Slater, A.T.; Cogan, N.O.I.; Forster, J.W.; Hayes, B.J.; Daetwyler, H.D. Improving Genetic Gain with Genomic Selection in Autotetraploid Potato. Plant Genome 2016, 9, 1–15. [Google Scholar] [CrossRef] [PubMed]
- Sood, S.; Bhardwaj, V.; Kaushik, S.K.; Sharma, S. Prediction based on estimated breeding values using genealogy for tuber yield and late blight resistance in auto-tetraploid potato (Solanum tuberosum L.). Heliyon 2020, 6, e05624. [Google Scholar] [CrossRef] [PubMed]
- Juzepchuk, S.V.; Bukasov, S.M. A contribution to the question of the origin of the potato. In Proceedings of the USSR Congress Genetics and Plant and Animal Breeding, Leningrad, Russia, 10–16 January 1929; pp. 593–611. [Google Scholar]
- Salaman, R.N. The History and Social Influence of the Potato; Cambridge University Press: Cambridge, UK, 1949. [Google Scholar]
- Hawkes, J.G. Origins of cultivated potatoes and species relationships. In Potato Genetics; CAB International: Wallingford, UK, 1994; pp. 3–42. [Google Scholar]
- Spooner, D.M.; Nuñez, J.; Rodríguez, F.; Naik, P.S.; Ghislain, M. Nuclear and chloroplast DNA reassessment of the origin of Indian potato varieties and its implications for the origin of the early European potato. Theor. Appl. Genet. 2005, 110, 1020–1026. [Google Scholar] [CrossRef]
- Ríos, D. What Is the Origin of the European Potato? Evidence from Canary Island Landraces. Crop Sci. 2007, 47, 1271–1280. [Google Scholar] [CrossRef]
- Ames, M.; Spooner, D.M. DNA from herbarium specimens settles a controversy about origins of the European potato. Am. J. Bot. 2008, 95, 252–257. [Google Scholar] [CrossRef]
- Gutaker, R.M.; Weiß, C.L.; Ellis, D.; Anglin, N.L.; Knapp, S.; Luis Fernández-Alonso, J.; Prat, S.; Burbano, H.A. The origins and adaptation of European potatoes reconstructed from historical genomes. Nat. Ecol. Evol. 2019, 3, 1093–1101. [Google Scholar] [CrossRef]
- Hardigan, M.A.; Laimbeer, F.P.E.; Newton, L.; Crisovan, E.; Hamilton, J.P.; Vaillancourt, B.; Wiegert-Rininger, K.; Wood, J.C.; Douches, D.S.; Farré, E.M.; et al. Genome diversity of tuber-bearing uncovers complex evolutionary history and targets of domestication in the cultivated potato. Proc. Natl. Acad. Sci. USA 2017, 114, E9999. [Google Scholar] [CrossRef]
- Van Berloo, R.; Hutten, R.C.B.; van Eck, H.J.; Visser, R.G.F. An Online Potato Pedigree Database Resource. Potato Res. 2007, 50, 45–57. [Google Scholar] [CrossRef]
- Keneni, G.; Bekele, E.; Imtiaz, M.; Dagne, K.J.P. Genetic Vulnerability of Modern Crop Cultivars: Causes, Mechanism and Remedies. Int. J. Plant Res. 2012, 2, 69–79. [Google Scholar] [CrossRef]
- Bethke, P.C.; Halterman, D.A.; Jansky, S.H. Potato Germplasm Enhancement Enters the Genomics Era. Agronomy 2019, 9, 575. [Google Scholar] [CrossRef]
- Glendinning, D.R. Potato introductions and breeding up to the early 20th century. New Phytol. 1983, 94, 479–505. [Google Scholar] [CrossRef]
- Bradshaw, J.; Mackay, G. Breeding Strategies for Clonally Propagated Potatoes; CAB International: Wallingford, UK, 1994. [Google Scholar]
- Fu, Y.-B.; Peterson, G.W.; Richards, K.W.; Tarn, T.R.; Percy, J.E. Genetic Diversity of Canadian and Exotic Potato Germplasm Revealed by Simple Sequence Repeat Markers. Am. J. Potato Res. 2009, 86, 38–48. [Google Scholar] [CrossRef]
- Vos, P.G.; Uitdewilligen, J.G.A.M.L.; Voorrips, R.E.; Visser, R.G.F.; van Eck, H.J. Development and analysis of a 20K SNP array for potato (Solanum tuberosum): An insight into the breeding history. Theor. Appl. Genet. 2015, 128, 2387–2401. [Google Scholar] [CrossRef]
- Love, S.L. Founding clones, major contributing ancestors, and exotic progenitors of prominent North American potato cultivars. Am. J. Potato Res. 1999, 76, 263–272. [Google Scholar] [CrossRef]
- Lenne, J.M.; Wood, D. Plant Diseases and the Use of Wild Germplasm. Annu. Rev. Phytopathol. 1991, 29, 35–63. [Google Scholar] [CrossRef]
- Tarn, T.R.; Tai, G.C.C.; De long, H.; Murphy, A.M.; Seabrook, J.E.A. Breeding potatoes for long-day, temperate climates. In Plant Breeding Reviews; Janick, J., Ed.; John Wiley & Sons: Hoboken, NJ, USA, 1992; pp. 217–332. [Google Scholar]
- Simmonds, N.W. Introgression and incorporation. Strategies for the use of crop genetic resources. Biol. Rev. 1993, 68, 539–562. [Google Scholar] [CrossRef]
- Vincent, H.; Wiersema, J.; Kell, S.; Fielder, H.; Dobbie, S.; Castañeda-Álvarez, N.P.; Guarino, L.; Eastwood, R.; Leόn, B.; Maxted, N. A prioritized crop wild relative inventory to help underpin global food security. Biol. Conserv. 2013, 167, 265–275. [Google Scholar] [CrossRef]
- Hirsch, C.N.; Hirsch, C.D.; Felcher, K.; Coombs, J.; Zarka, D.; Van Deynze, A.; De Jong, W.; Veilleux, R.E.; Jansky, S.; Bethke, P.; et al. Retrospective view of North American potato (Solanum tuberosum L.) breeding in the 20th and 21st Centuries. G3 Genes|Genomes|Genet. 2013, 3, 1003. [Google Scholar] [CrossRef]
- Bradshaw, J.E.; Bryan, G.J.; Ramsay, G. Genetic Resources (Including Wild and Cultivated Solanum Species) and Progress in their Utilisation in Potato Breeding. Potato Res. 2006, 49, 49–65. [Google Scholar] [CrossRef]
- Gebhardt, C.; Mugniery, D.; Ritter, E.; Salamini, F.; Bonnel, E. Identification of RFLP markers closely linked to the H1 gene conferring resistance to Globodera rostochiensis in potato. Theor. Appl. Genet. 1993, 85, 541–544. [Google Scholar] [CrossRef] [PubMed]
- Ross, H. Wild species and primitive cultivars as ancestors of potato varieties. In Proceedings of the Conference on Broadening Genetic Base of Crops, Wageningen, The Netherlands, 3–7 July 1979; pp. 237–245. [Google Scholar]
- Spooner, D.M.; Salas, A. Structure, Biosystematics, and Genetic Resources. In Handbook of Potato Production, Improvement, and Post-Harvest Management; Gopal, J., Paul Khurana, S.M., Eds.; Food Products Press: New York, NY, USA, 2006. [Google Scholar]
- Ghislain, M.; Douches, D.S. The Genes and Genomes of the Potato. In The Potato Crop: Its Agricultural, Nutritional and Social Contribution to Humankind; Campos, H., Ortiz, O., Eds.; Springer International Publishing: Cham, Switzerland, 2020; pp. 139–162. [Google Scholar]
- Bethke, P.C.; Halterman, D.A.; Jansky, S. Are we getting better at using wild potato species in light of new tools? Crop Sci. 2017, 57, 1241–1258. [Google Scholar] [CrossRef]
- Kohonen, T. Self-organized formation of topologically correct feature maps. Biol. Cybern. 1982, 43, 59–69. [Google Scholar] [CrossRef]
- Jombart, T.; Devillard, S.; Balloux, F. Discriminant analysis of principal components: A new method for the analysis of genetically structured populations. BMC Genet. 2010, 11, 94. [Google Scholar] [CrossRef] [PubMed]
- Esnault, F.; Solano, J.; Perretant, M.R.; Hervé, M.; Label, A.; Pellé, R.; Dantec, J.P.; Boutet, G.; Brabant, P.; Chauvin, J.E. Genetic diversity analysis of a potato (Solanum tuberosum L.) collection including Chiloé Island landraces and a large panel of worldwide cultivars. Plant Genet. Resour. 2014, 12, 74–82. [Google Scholar] [CrossRef]
- Spanoghe, M.; Marique, T.; Rivière, J.; Lanterbecq, D.; Gadenne, M. Investigation and Development of Potato Parentage Analysis Methods Using Multiplexed SSR Fingerprinting. Potato Res. 2015, 58, 43–65. [Google Scholar] [CrossRef]
- Veilleux, R.E.; Shen, L.Y.; Paz, M.M. Analysis of the genetic composition of anther-derived potato by randomly amplified polymorphic DNA and simple sequence repeats. Genome 1995, 38, 1153–1162. [Google Scholar] [CrossRef]
- Provan, J.; Powell, W.; Waugh, R. Microsatellite analysis of relationships within cultivated potato (Solanum tuberosum). Theor. Appl. Genet. 1996, 92, 1078–1084. [Google Scholar] [CrossRef]
- Kawchuk, L.M.; Lynch, D.R.; Thomas, J.; Penner, B.; Sillito, D.; Kulcsar, F. Characterization ofSolanum tuberosum simple sequence repeats and application to potato culiwar identification. Am. Potato J. 1996, 73, 325–335. [Google Scholar] [CrossRef]
- Milbourne, D.; Meyer, R.C.; Collins, A.J.; Ramsay, L.D.; Gebhardt, C.; Waugh, R. Isolation, characterisation and mapping of simple sequence repeat loci in potato. Mol. Gen. Genet. MGG 1998, 259, 233–245. [Google Scholar] [CrossRef]
- Ghislain, M.; Spooner, D.M.; Rodríguez, F.; Villamón, F.; Núñez, J.; Vásquez, C.; Waugh, R.; Bonierbale, M. Selection of highly informative and user-friendly microsatellites (SSRs) for genotyping of cultivated potato. Theor. Appl. Genet. 2004, 108, 881–890. [Google Scholar] [CrossRef] [PubMed]
- Ghislain, M.; Núñez, J.; del Rosario Herrera, M.; Pignataro, J.; Guzman, F.; Bonierbale, M.; Spooner, D.M. Robust and highly informative microsatellite-based genetic identity kit for potato. Mol. Breed. 2009, 23, 377–388. [Google Scholar] [CrossRef]
- Feingold, S.; Lloyd, J.; Norero, N.; Bonierbale, M.; Lorenzen, J. Mapping and characterization of new EST-derived microsatellites for potato (Solanum tuberosum L.). Theor. Appl. Genet. 2005, 111, 456–466. [Google Scholar] [CrossRef] [PubMed]
- Esselink, G.D.; Nybom, H.; Vosman, B. Assignment of allelic configuration in polyploids using the MAC-PR (microsatellite DNA allele counting—peak ratios) method. Theor. Appl. Genet. 2004, 109, 402–408. [Google Scholar] [CrossRef] [PubMed]
- RStudio Team. RStudio: Integrated Development for R; RStudio, Inc.: Boston, MA, USA, 2019. [Google Scholar]
- R Development Core Team. R: A Language and Environment for Statistical Computing; R Foundation for Statistical Computing: Vienna, Austria, 2021. [Google Scholar]
- Nei, M. Analysis of Gene Diversity in Subdivided Populations. Proc. Natl. Acad. Sci. USA 1973, 70, 3321–3323. [Google Scholar] [CrossRef] [PubMed]
- Wehrens, R.; Kruisselbrink, J. Flexible Self-Organizing Maps in kohonen 3.0. J. Stat. Softw. 2018, 87, 1–18. [Google Scholar] [CrossRef]
- Kohonen, T. Self-Organizing Maps, 3rd ed.; Springer: Berlin/Heidelberg, Germany, 2001; p. 501. [Google Scholar]
- Kiviluoto, K. Topology preservation in self-organizing maps. In Proceedings of the Proceedings of International Conference on Neural Networks (ICNN’96), Washington, DC, USA, 3–6 June 1996; Volume 291, pp. 294–299. [Google Scholar]
- Spanoghe, M.C.; Marique, T.; Rivière, J.; Moulin, M.; Dekuijper, C.; Nirsha, A.; Bonnave, M.; Lanterbecq, D. Genetic patterns recognition in crop species using self-organizing map: The example of the highly heterozygous autotetraploid potato (Solanum tuberosum L.). Genet. Resour. Crop Evol. 2020, 67, 947–966. [Google Scholar] [CrossRef]
- Jombart, T. adegenet: A R package for the multivariate analysis of genetic markers. Bioinformatics 2008, 24, 1403–1405. [Google Scholar] [CrossRef]
- Jombart, T.; Collins, C. A tutorial for Discriminant Analysis of Principal Components (DAPC) Using Adegenet 2.0.0. 2015. Available online: https://adegenet.r-forge.r-project.org/files/tutorial-dapc.pdf (accessed on 18 October 2021).
- Excoffier, L.; Smouse, P.E.; Quattro, J.M. Analysis of molecular variance inferred from metric distances among DNA haplotypes: Application to human mitochondrial DNA restriction data. Genetics 1992, 131, 479–491. [Google Scholar] [CrossRef]
- Paradis, E. pegas: An R package for population genetics with an integrated–modular approach. Bioinformatics 2010, 26, 419–420. [Google Scholar] [CrossRef]
- Hawkes, J.G. Genetic poverty of the potato in Europe. In Broadening the Genetic Base Crops; Centre for Agricultural Publishing and Documentation: Wageningen, The Netherlands, 1979; pp. 19–27. [Google Scholar]
- Hawkes, J.G.; Francisco-Ortega, J. The early history of the potato in Europe. Euphytica 1993, 70, 1–7. [Google Scholar] [CrossRef]
- Hosaka, K.; Hanneman, R.E. The origin of the cultivated tetraploid potato based on chloroplast DNA. Theor. Appl. Genet. 1988, 76, 172–176. [Google Scholar] [CrossRef] [PubMed]
- Powell, W.; Baird, E.; Duncan, N.; Waugh, R. Chloroplast DNA variability in old and recently introduced potato cultivars. Ann. Appl. Biol. 1993, 123, 403–410. [Google Scholar] [CrossRef]
- Provan, J.; Powell, W.; Dewar, H.; Bryan, G.; Machray, G.C.; Waugh, R. An extreme cytoplasmic bottleneck in the modern European cultivated potato (Solanum tuberosum) is not reflected in decreased levels of nuclear diversity. Proc. Biol. Sci. 1999, 266, 633–639. [Google Scholar] [CrossRef]
- Sanetomo, R.; Gebhardt, C. Cytoplasmic genome types of European potatoes and their effects on complex agronomic traits. BMC Plant Biol. 2015, 15, 162. [Google Scholar] [CrossRef]
- Hosaka, K.; Sanetomo, R. Development of a rapid identification method for potato cytoplasm and its use for evaluating Japanese collections. Theor. Appl. Genet. 2012, 125, 1237–1251. [Google Scholar] [CrossRef]
- Plaisted, R.L.; Hoopes, R.W. The past record and future prospects for the use of exotic potato germplasm. Am. Potato J. 1989, 66, 603–627. [Google Scholar] [CrossRef]
- Vos, P.G.; Paulo, M.J.; Voorrips, R.E.; Visser, R.G.F.; van Eck, H.J.; van Eeuwijk, F.A. Evaluation of LD decay and various LD-decay estimators in simulated and SNP-array data of tetraploid potato. Theor. Appl. Genet. 2017, 130, 123–135. [Google Scholar] [CrossRef]
- Uitdewilligen, J.G.A.M.L.; Wolters, A.-M.A.; D’hoop, B.B.; Borm, T.J.A.; Visser, R.G.F.; van Eck, H.J. A Next-Generation Sequencing Method for Genotyping-by-Sequencing of Highly Heterozygous Autotetraploid Potato. PLoS ONE 2013, 8, e62355. [Google Scholar] [CrossRef]
- Castañeda-Álvarez, N.P.; de Haan, S.; Juárez, H.; Khoury, C.K.; Achicanoy, H.A.; Sosa, C.C.; Bernau, V.; Salas, A.; Heider, B.; Simon, R.; et al. Ex Situ Conservation Priorities for the Wild Relatives of Potato (Solanum L. Section Petota). PLoS ONE 2015, 10, e0122599. [Google Scholar] [CrossRef]
- Jansky, S. Overcoming hybridization barriers in potato. Plant Breed. 2006, 125, 1–12. [Google Scholar] [CrossRef]
- Jansky, S.H.; Spooner, D.M. The evolution of potato breeding. In Plant Breeding Reviews; John Wiley & Sons Inc.: Hoboken, NJ, USA, 2018; pp. 169–214. [Google Scholar]
- Brown, C.R. The Contribution of Traditional Potato Breeding to Scientific Potato Improvement. Potato Res. 2011, 54, 287–300. [Google Scholar] [CrossRef]
- Schouten, H.J.; Tikunov, Y.; Verkerke, W.; Finkers, R.; Bovy, A.; Bai, Y.; Visser, R.G.F. Breeding Has Increased the Diversity of Cultivated Tomato in The Netherlands. Front. Plant Sci 2019, 10, 1606. [Google Scholar] [CrossRef] [PubMed]
- Niewöhner, J.; Salamini, F.; Gebhardt, C. Development of PCR assays diagnostic for RFLP marker alleles closely linked to allelesGro1 andH1, conferring resistance to the root cyst nematodeGlobodera rostochiensis in potato. Mol. Breed. 1995, 1, 65–78. [Google Scholar] [CrossRef]
- Van der Vossen, E.A.G.; Van der Voort, J.N.A.; Kanyuka, K.; Bendahmane, A.; Sandbrink, H.; Baulcombe, D.C.; Bakker, J.; Stiekema, W.J.; Klein-Lankhorst, R.M. Homologues of a single resistance-gene cluster in potato confer resistance to distinct pathogens: A virus and a nematode. Plant J. 2000, 23, 567–576. [Google Scholar] [CrossRef]


| Country | No. of Accessions | 50-Year Temporal Group | |||||
|---|---|---|---|---|---|---|---|
| Heirloom | Old | Modern | |||||
| <1800 | 1801–1850 | 1851–1900 | 1901–1950 | 1951–2000 | 2001–2021 | ||
| Netherlands | 382 | / | / | 3 | 25 | 171 | 183 |
| France | 262 | / | 5 | 9 | 9 | 123 | 116 |
| Germany | 201 | / | / | 4 | 40 | 83 | 73 |
| UK | 142 | 1 | 5 | 26 | 49 | 39 | 22 |
| USA | 68 | 3 | / | 14 | 12 | 36 | 3 |
| Austria | 35 | / | / | 1 | / | 14 | 20 |
| China | 25 | / | / | / | / | 2 | 23 |
| Denmark | 23 | / | / | / | / | 9 | 14 |
| Belgium | 12 | / | / | / | / | 11 | 1 |
| Czechia | 10 | / | / | / | 5 | 5 | / |
| Andes | 9 | 9 | / | / | / | / | / |
| Poland | 8 | / | / | / | 1 | 7 | / |
| RD Congo | 8 | / | / | / | 1 | 7 | / |
| Chiloe Island | 3 | 3 | / | / | / | / | / |
| Hungary | 5 | / | / | / | 1 | 1 | 3 |
| Ireland | 4 | / | 1 | 1 | / | 1 | 1 |
| Russia | 4 | / | / | / | 2 | 2 | / |
| Canada | 2 | / | / | / | / | 2 | / |
| Japan | 2 | / | / | / | / | 2 | / |
| Sweden | 2 | / | / | / | 1 | 1 | / |
| Ukraine | 2 | / | / | / | / | 2 | / |
| Others * | 10 | 3 | / | 1 | / | 3 | 3 |
| Total | 1219 | 19 | 11 | 59 | 146 | 522 | 462 |
| Marker Locus | LG | Multiplex Set | Dye Labeling | Alleles Size Range | No of Total Alleles | No of Rare Alleles | No of Unique Alleles | Mean Alleles per Accession | H1 | PIC |
|---|---|---|---|---|---|---|---|---|---|---|
| STG0016 g | I | 2 | Ned | 118–157 | 12 | 7 | 0 | 2.81 | 0.985 | 0.777 |
| STM1049 d | I | 2 | Ned | 178–199 | 9 | 4 | 1 | 1.89 | 0.728 | 0.653 |
| STM2020 d | I | 4 | Ned | 137–160 | 14 | 7 | 2 | 2.87 | 0.965 | 0.824 |
| STM5127 g | I | 2 | Hex | 236–271 | 12 | 4 | 2 | 2.75 | 0.969 | 0.793 |
| STG0006 g | II | 2 | Fam | 141–159 | 7 | 3 | 0 | 1.23 | 0.217 | 0.346 |
| STI0036 f | II | 1 | Hex | 111–146 | 13 | 5 | 0 | 2.93 | 0.974 | 0.834 |
| STM1064 d | II | 1 | Hex | 182–194 | 9 | 2 | 1 | 2.04 | 0.799 | 0.654 |
| STI0013 f | III | 2 | Fam | 247–308 | 10 | 5 | 1 | 2.58 | 0.963 | 0.747 |
| STI0050 f | III | 5 | Hex | 149–167 | 7 | 2 | 0 | 2.62 | 0.971 | 0.745 |
| STI0001 f | IV | 5 | Hex | 177–198 | 8 | 2 | 1 | 2.46 | 0.909 | 0.752 |
| STI0012 f | IV | 1 | Fam | 163–195 | 10 | 3 | 0 | 2.87 | 0.979 | 0.812 |
| STM5140 e | IV | 4 | Ned | 162–201 | 8 | 3 | 0 | 2.73 | 0.982 | 0.766 |
| LEMALX d | V | 4 | Fam | 117–133 | 8 | 4 | 2 | 1.91 | 0.720 | 0.656 |
| STG0021 g | V | 3 | Hex | 108–140 | 9 | 3 | 1 | 2.55 | 0.960 | 0.745 |
| STPOAC58 e | V | 3 | Ned | 227–247 | 12 | 6 | 1 | 2.53 | 0.925 | 0.763 |
| STI0004 f | VI | 1 | Hex | 63–104 | 15 | 7 | 1 | 2.50 | 0.916 | 0.775 |
| STI0011 f | VI | 5 | Hex | 56–77 | 10 | 3 | 1 | 2.28 | 0.888 | 0.717 |
| STI0021 f | VI | 4 | Ned | 82–106 | 9 | 2 | 0 | 2.82 | 0.984 | 0.783 |
| STI0033 f | VII | 3 | Ned | 111–135 | 8 | 2 | 0 | 2.75 | 0.976 | 0.769 |
| STM1052 d | VII | 1 | Ned | 196–262 | 14 | 5 | 2 | 2.62 | 0.934 | 0.816 |
| STM3009 d | VII | 5 | Fam | 138–170 | 18 | 13 | 2 | 2.58 | 0.932 | 0.779 |
| SSR1 b | VIII | 4 | Fam | 198–225 | 15 | 5 | 1 | 2.73 | 0.970 | 0.793 |
| STGBSS c | VIII | 1 | Ned | 121–142 | 13 | 5 | 0 | 2.20 | 0.824 | 0.715 |
| STM1104 d | VIII | 2 | Hex | 160–181 | 15 | 7 | 1 | 2.11 | 0.792 | 0.707 |
| STWAX-2 a | VIII | 1 | Fam | 209–244 | 15 | 7 | 1 | 2.48 | 0.938 | 0.759 |
| STI0002 f | IX | 5 | Ned | 99–132 | 18 | 11 | 5 | 2.42 | 0.903 | 0.765 |
| STI0014 f | IX | 2 | Hex | 113–132 | 8 | 4 | 0 | 2.33 | 0.942 | 0.668 |
| STM3012 d | IX | 3 | Hex | 136–207 | 11 | 4 | 2 | 2.20 | 0.825 | 0.712 |
| STG0025 g | X | 3 | Fam | 193–205 | 7 | 3 | 0 | 1.91 | 0.847 | 0.546 |
| STI0023 f | X | 5 | Ned | 149–217 | 22 | 17 | 6 | 2.40 | 0.936 | 0.718 |
| STG0001 g | XI | 3 | Fam | 126–145 | 15 | 6 | 1 | 2.85 | 0.971 | 0.831 |
| STM0037 d | XI | 5 | Fam | 63–101 | 16 | 10 | 2 | 2.64 | 0.931 | 0.810 |
| STM2005 d | XI | 4 | Hex | 147–191 | 6 | 2 | 1 | 2.57 | 0.961 | 0.726 |
| STI0030 f | XII | 3 | Fam | 84–105 | 11 | 3 | 1 | 2.73 | 0.980 | 0.777 |
| STM1097 d | XII | 4 | Hex | 225–280 | 13 | 8 | 2 | 2.01 | 0.746 | 0.667 |
| Sum | 407 | 184 | 41 | |||||||
| Mean | 11.6 | 5.3 | 1.2 | 2.45 | 0.893 | 0.734 |
| Model | df | Sum of Square | Variance Component | Percentage of Variation | p-Value a |
|---|---|---|---|---|---|
| Germplasm of various continental origins | |||||
| among continents | 6 | 797.63 | 2.71 | 7.6 | <0.0001 |
| within continent | 1137 | 39,694.63 | 32.75 | 92.4 | <0.0001 |
| Germplasm of various country origins | |||||
| among countries | 6 | 1194.31 | 1.06 | 3.2 | <0.0001 |
| within countries | 1134 | 39,297.95 | 32.39 | 96.8 | <0.0001 |
| Germplasm of three temporal groups b | |||||
| among temporal groups | 2 | 653.31 | 1.51 | 4.4 | <0.0001 |
| within temporal groups | 1140 | 39,838.95 | 32.76 | 95.6 | <0.0001 |
| Germplasm of 50-year groups | |||||
| among breeding periods | 5 | 959.03 | 1.00 | 3.0 | <0.0001 |
| within breeding periods | 1137 | 39,533.23 | 32.59 | 97.0 | <0.0001 |
Publisher’s Note: MDPI stays neutral with regard to jurisdictional claims in published maps and institutional affiliations. |
© 2022 by the authors. Licensee MDPI, Basel, Switzerland. This article is an open access article distributed under the terms and conditions of the Creative Commons Attribution (CC BY) license (https://creativecommons.org/licenses/by/4.0/).
Share and Cite
Spanoghe, M.; Marique, T.; Nirsha, A.; Esnault, F.; Lanterbecq, D. Genetic Diversity Trends in the Cultivated Potato: A Spatiotemporal Overview. Biology 2022, 11, 604. https://doi.org/10.3390/biology11040604
Spanoghe M, Marique T, Nirsha A, Esnault F, Lanterbecq D. Genetic Diversity Trends in the Cultivated Potato: A Spatiotemporal Overview. Biology. 2022; 11(4):604. https://doi.org/10.3390/biology11040604
Chicago/Turabian StyleSpanoghe, Martin, Thierry Marique, Alexandra Nirsha, Florence Esnault, and Deborah Lanterbecq. 2022. "Genetic Diversity Trends in the Cultivated Potato: A Spatiotemporal Overview" Biology 11, no. 4: 604. https://doi.org/10.3390/biology11040604
APA StyleSpanoghe, M., Marique, T., Nirsha, A., Esnault, F., & Lanterbecq, D. (2022). Genetic Diversity Trends in the Cultivated Potato: A Spatiotemporal Overview. Biology, 11(4), 604. https://doi.org/10.3390/biology11040604