
The Expression of Signaling Genes in Breast Cancer Cells


Abstract
:Simple Summary
Abstract
1. Introduction
1.1. The Distinction between Two Main Types of Breast Cancer and its Subtypes with Different Prognoses
1.2. Predicting Distant Metastases and Survival (MammaPrint 70 Genes), and the Assessment of the Risk of Recurrence (OncotypeDx, 21 Genes)
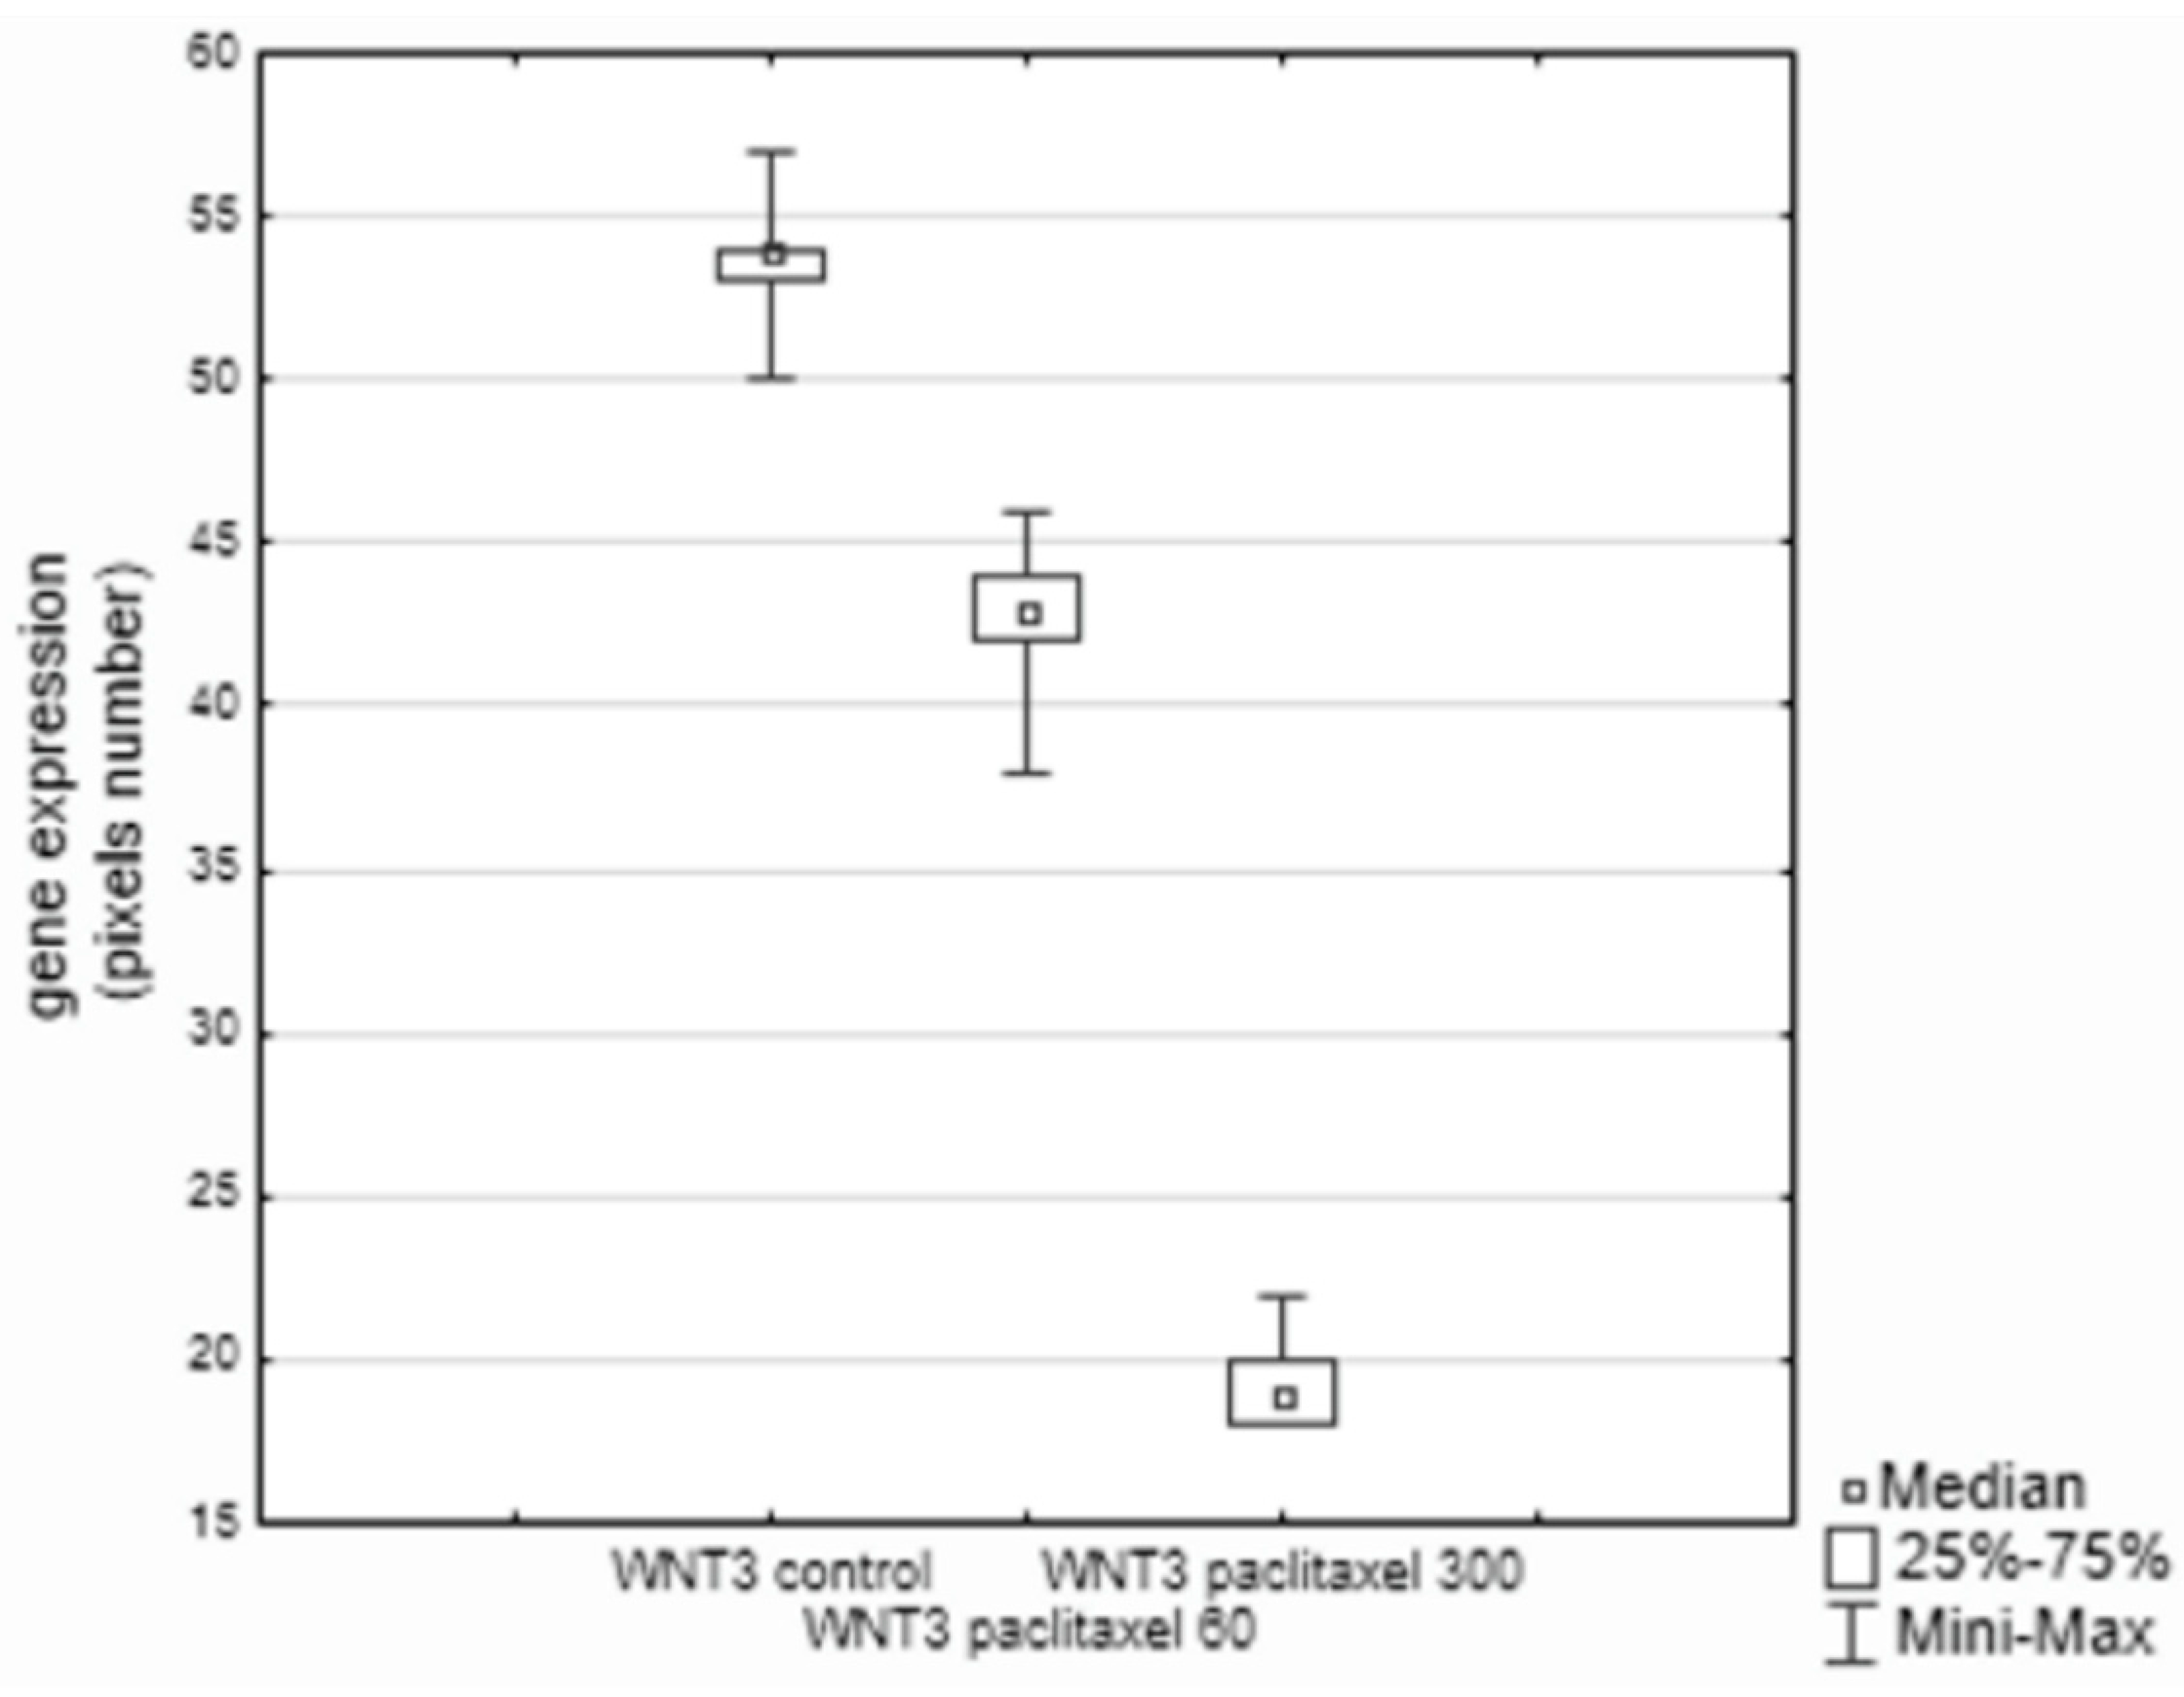
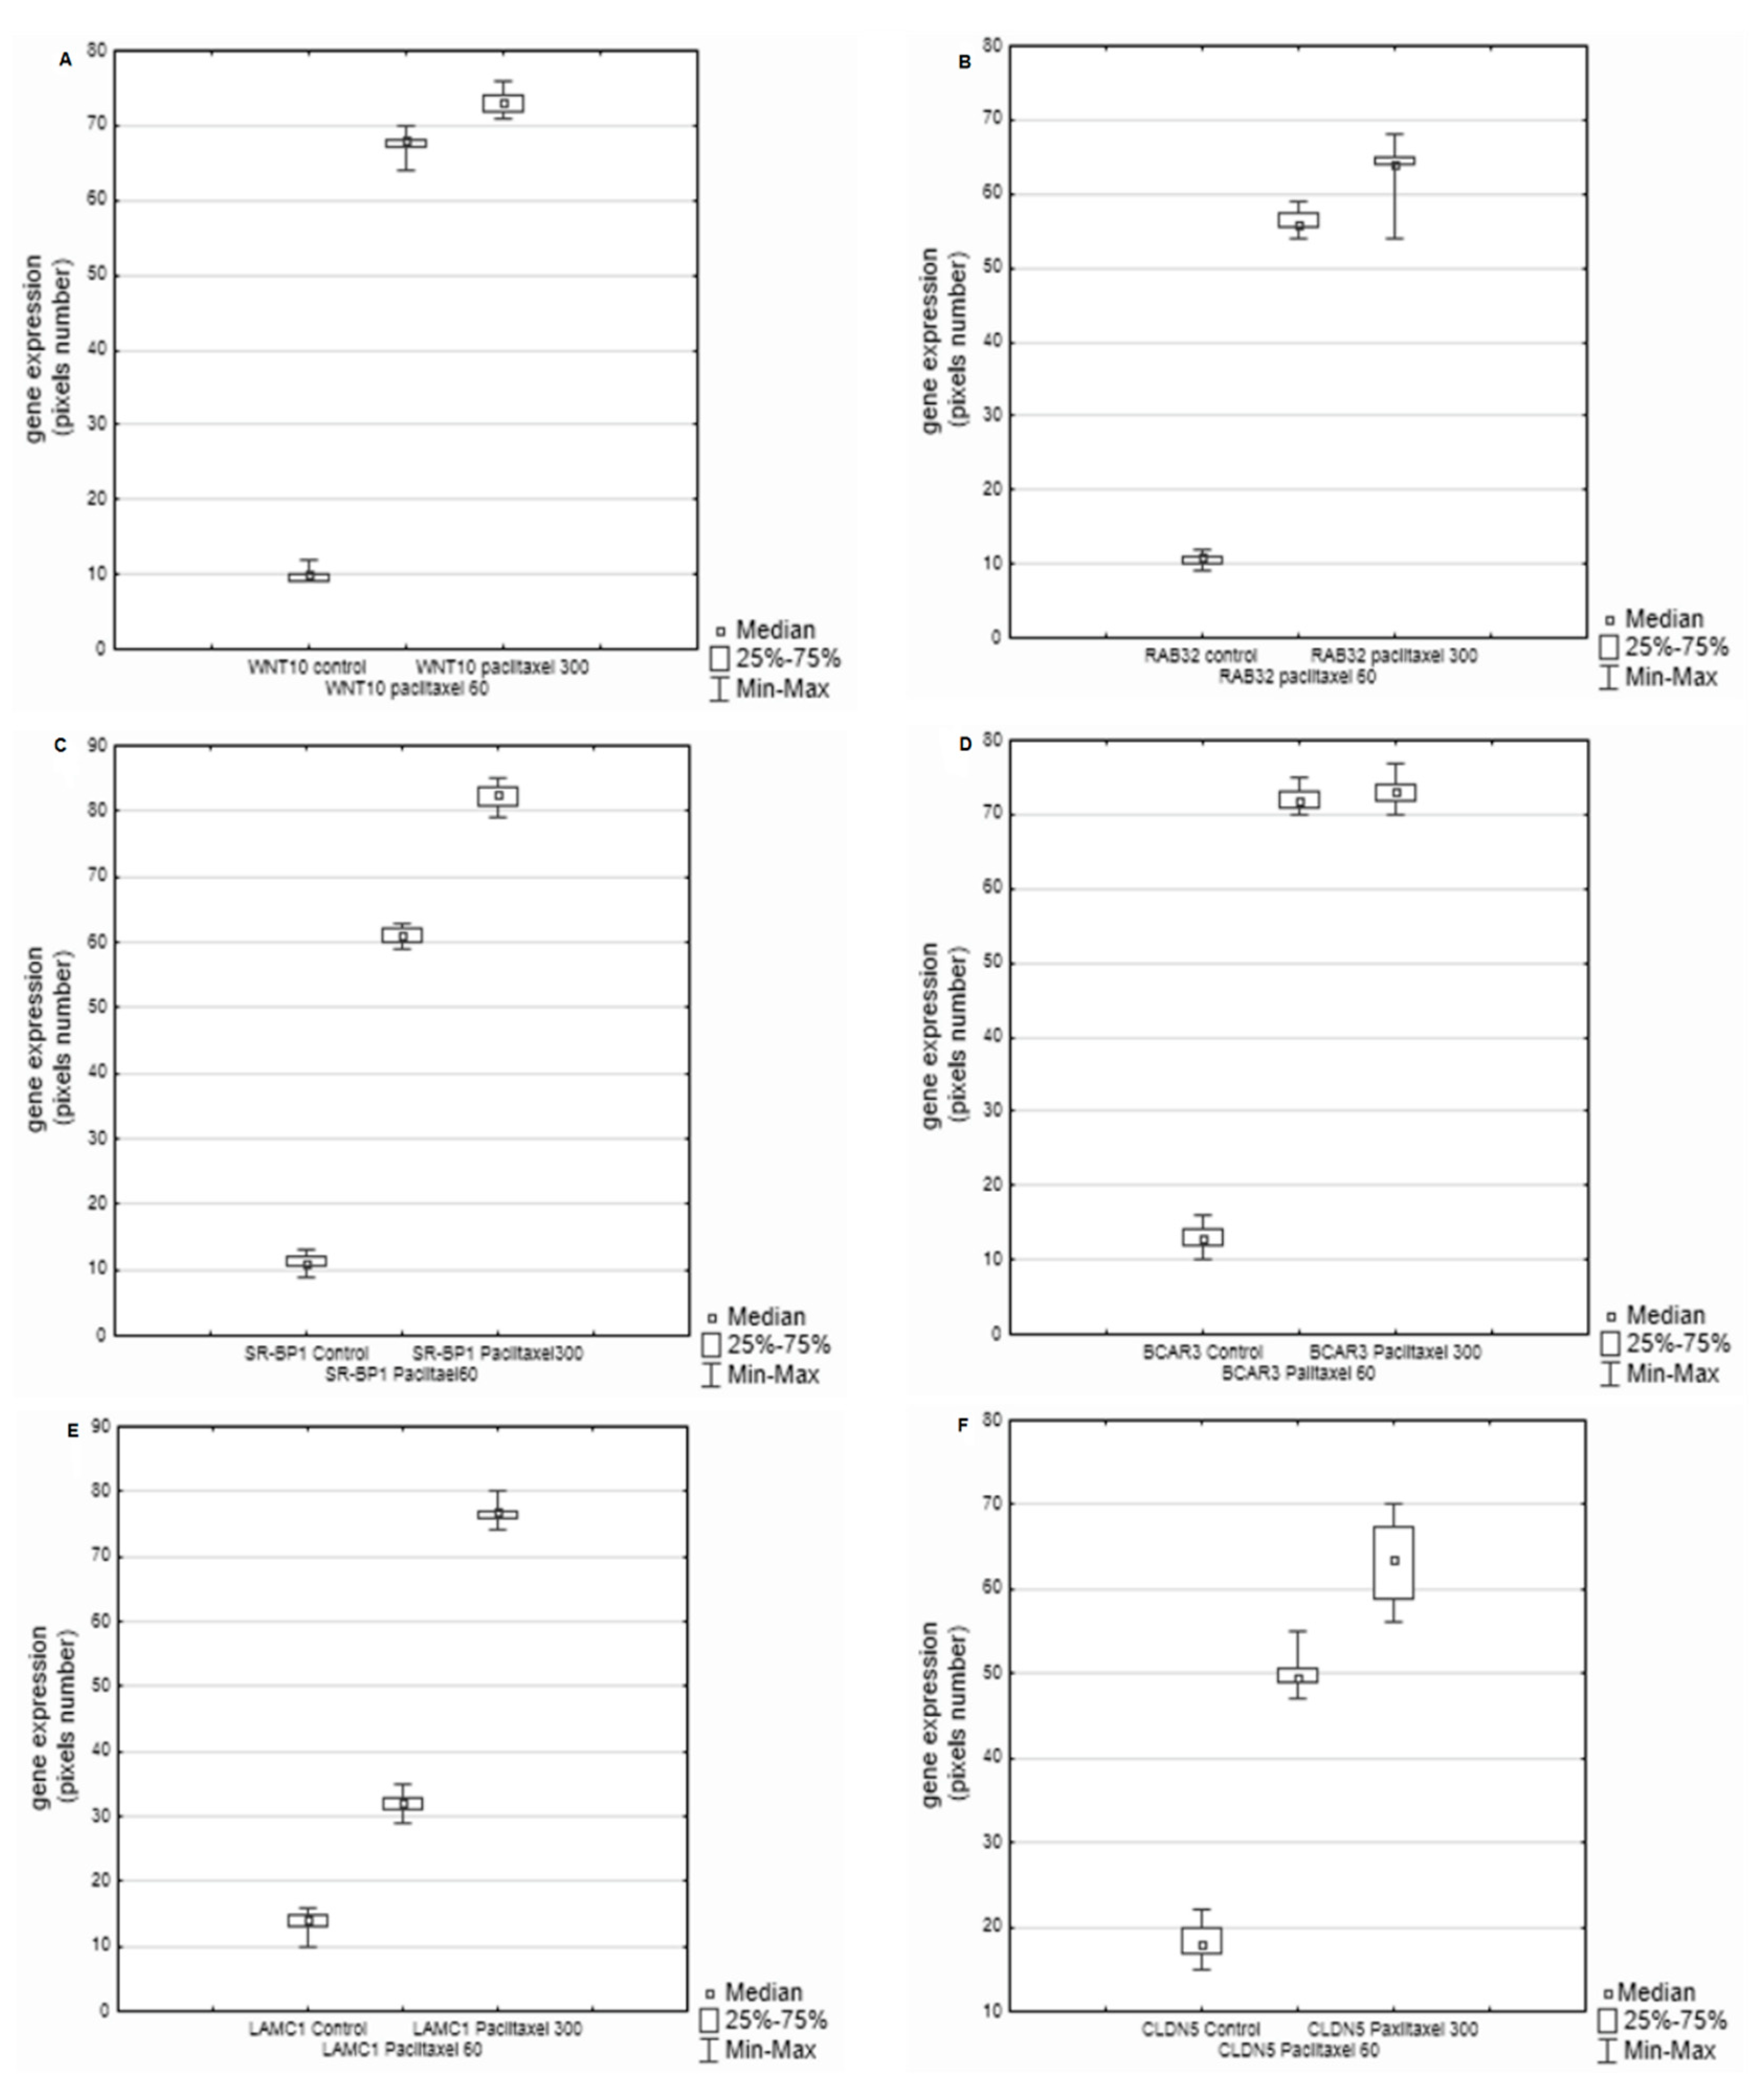
- the identification of a group of gene-encoding factors involved in signaling in breast cancer cells which showed differences in expression after administration of the chemotherapeutic agent;
- the determination of statistical significance and correlation values for the expression of individual genes and their importance for the prediction of cancer progression and prognosis.
2. Materials and Methods
2.1. Cell Cultures
2.2. Examined Genes
2.3. Total RNA isolation
2.4. Reverse Transcription Polymerase Chain Reaction (RTPCR)
2.5. cDNA Array Hybridization
2.6. Analysis of the Array Gene Expression Matrix
2.7. Statistical Analysis
3. Results
4. Discussion
5. Conclusions
Author Contributions
Funding
Institutional Review Board Statement
Informed Consent Statement
Data Availability Statement
Conflicts of Interest
References
- Makki, J. Diversity of Breast Carcinoma: Histological Subtypes and Clinical Relevance. Clin. Med. Insights Pathol. 2015, 8, 23–31. [Google Scholar] [CrossRef] [Green Version]
- Joiner, D.M.; Ke, J.; Zhong, Z.; Xu, H.E.; Williams, B.O. LRP5 and LRP6 in development and disease. Trends Endocrinol. Metab. 2013, 24, 31–39. [Google Scholar] [CrossRef] [PubMed] [Green Version]
- Chiang, K.-C.; Yeh, C.-N.; Chung, L.-C.; Feng, T.-H.; Sun, C.-C.; Chen, M.-F.; Jan, Y.-Y.; Yeh, T.-S.; Chen, S.-C.; Juang, H.-H. WNT-1 inducible signaling pathway protein-1 enhances growth and tumorigenesis in human breast cancer. Sci. Rep. 2015, 5, srep08686. [Google Scholar] [CrossRef] [PubMed] [Green Version]
- Prasad, C.P.; Chaurasiya, S.K.; Axelsson, L. WNT-5A triggers Cdc42 activation leading to an ERK1/2 dependent decrease in MMP9 activity and invasive migration of breast cancer cells. Mol. Oncol. 2013, 7, 870–883. [Google Scholar] [CrossRef]
- Jiang, W.; Crossman, D.K.; Mitchell, E.H.; Sohn, P.; Crowley, M.R.; Serra, R. WNT5A inhibits metastasis and alters splicing of Cd 44 in breast cancer cells. PLoS ONE 2013, 8, e58329. [Google Scholar]
- Clevers, H.; Nusse, R. Wnt/β-catenin signaling and disease. Cell 2012, 149, 1192–1205. [Google Scholar] [CrossRef] [PubMed] [Green Version]
- Choi, S.H.; Estarás, C.; Moresco, J.J.; Yates, J.R.; Jones, K.A. α-Catenin interacts with APC to regulate β-catenin proteolysis and transcriptional repression of Wnt target genes. Genes Dev. 2013, 15, 2473–2488. [Google Scholar] [CrossRef] [PubMed] [Green Version]
- Hong, Y.L.; Yang, L.Y.; Pan, X.Y.; Feng, Q.; Zou, H.; Song, S.L.; Wang, L.; Wang, P.; Bai, S.; Zhou, X.L.; et al. Mutation status of ras genes in breast cancers with overexpressed p21Ras protein. Int. J. Clin. Exp. Pathol. 2016, 10, 10422–10429. [Google Scholar]
- Kodaz, H.; Kostek, O.; Hacioglu, M.B.; Erdogan, B. Frequency of RAS mutations (KRAS, NRAS, HRAS) in human solid cancer. EJMO 2017, 1, 1–7. [Google Scholar] [CrossRef] [Green Version]
- Pasquier, E.; Kavallaris, M. Microtubules: A dynamic target in cancer therapy. IUBMB Life 2008, 60, 165–170. [Google Scholar] [CrossRef] [PubMed]
- Sethakorn, N.; Dulin, N.O. RGS expression in cancer: Oncomining the cancer microarray data. J. Recept Signal Transduct. Res. 2013, 33, 166–171. [Google Scholar] [CrossRef] [PubMed]
- Arras, J.; Thomas, K.S.; Myers, P.J.; Cross, A.M.; Osei, A.D.; Vazquez, G.E.; Atkins, K.A.; Conaway, M.R.; Jones, M.K.; Lazzara, M.J.; et al. Breast cancer antiestrogen resistance 3 (BCAR3) promotes tumor growth and progression in triple-negative breast cancer. Am. J. Cancer Res. 2021, 11, 4768–4787. [Google Scholar]
- Gligorov, J.; Lotz, J.P. Preclinical pharmacology of the taxanes: Implications of the differences. Oncologist 2004, 9, 3–8. [Google Scholar] [CrossRef] [PubMed] [Green Version]
- Kellogg, E.H.; Hejab, N.M.A.; Howes, S. Insights into the distinct mechanisms of action of taxane and non-taxane microtubule stabilizers from cryo-EM structures. J. Mol. Biol. 2017, 429, 633–646. [Google Scholar] [CrossRef] [Green Version]
- Torres, K.; Horwitz, S.B. Mechanisms of taxol-induced cell death are concentration dependent. Cancer Res. 1998, 58, 3620–3626. [Google Scholar] [PubMed]
- Rusecka, J. Mikromacierze DNA. Kosmos 2004, 53, 295–303. [Google Scholar]
- Słomski, R. (Ed.) Analiza DNA-Teoria i Praktyka; Wydawnictwo Uniwersytetu Przyrodniczego w Poznaniu: Poznań, Poland, 2011; pp. 468–473. [Google Scholar]
- Sørlie, T. Molecular portraits of breast cancer: Tumor subtypes as distinct disease entities. Eur. J. Cancer 2004, 40, 2667–2675. [Google Scholar] [CrossRef]
- Roukos, D.H.; Murray, S.; Briasoulis, E. Molecular genetic tools shape a roadmap towards a more accurate prognostic prediction and personalized management of cancer. Cancer Biol. Ther. 2007, 6, 308–312. [Google Scholar] [CrossRef] [PubMed] [Green Version]
- Kolb, R.; Ankenbauer, W.; Hloch, B. Roche Applied Science, Germany. Transcriptor one-step RT-PCR kit. Biochimica 2009, 1, 27–28. [Google Scholar]
- Mi, H.; Thomas, P. PANTHER pathway: An ontology-based pathway database coupled with data analysis tools. Methods Mol Biol. 2009, 563, 123–140. [Google Scholar] [CrossRef] [PubMed]
- Furukawa, C.; Daigo, Y.; Ishikawa, N.; Kato, T.; Ito, T.; Tsuchiya, E.; Sone, S.; Nakamura, Y. Plakophilin 3 oncogene as prognostic marker and therapeutic target for lung cancer. Cancer Res. 2005, 65, 7102–7110. [Google Scholar] [CrossRef] [PubMed] [Green Version]
- Cicchini, M.; Chakrabarti, R.; Kongara, S.; Price, S.; Nahar, R.; Lozy, F.; Zhong, H.; Vazquez, A.; Kang, Y.; Karantza, V. Autophagy regulator BECN1 suppresses mammary tumorigenesis driven by WNT1 activation and following parity. Autophagy 2014, 10, 2036–2052. [Google Scholar] [CrossRef] [PubMed] [Green Version]
- MacMillan, C.D.; Leong, H.S.; Dales, D.W.; Robertson, A.E.; Lewis, J.D.; Chambers, A.F.; Tuck, A.B. Stage of breast cancer progression influences cellular response to activation of the WNT/planar cell polarity pathway. Sci. Rep. 2014, 4, 6315. [Google Scholar] [CrossRef] [PubMed] [Green Version]
- Cai, K.; Jiang, L.; Wang, J.; Zhang, H.; Wang, X.; Cheng, D.; Dou, J. Downregulation of β-catenin decreases the tumorigenicity, but promotes epithelial-mesenchymal transition in breast cancer cells. J. Cancer Res. Ther. 2014, 10, 1063–1070. [Google Scholar] [PubMed]
- Kim, H.Y.; Park, J.H.; Won, H.Y.; Lee, J.Y.; Kong, G. CBX7 inhibits breast tumorigenicity through DKK-1-mediated suppression of the Wnt/β-catenin pathway. FASEB J. 2015, 29, 300–313. [Google Scholar] [CrossRef] [PubMed]
- Karabacak, T.; Eğılmez, R.; Arpaci, R.B.; Pfeiffer, E.S. Β-catenin expression in in situ and infiltrative ductal carcinomas of the breast. Türk Patoloji Dergisi 2011, 27, 185–188. [Google Scholar] [CrossRef] [PubMed]
- Pohl, S.Ö.-G.; Brook, N.; Agostino, M. Wnt signaling in triple-negative breast cancer. Oncogenesis 2017, 6, e310. [Google Scholar] [CrossRef] [Green Version]
- Fischer, M.M.; Cancilla, B.; Yeung, V.P.; Cattaruzza, F.; Chartier, C.; Murriel, C.L.; Cain, J.; Tam, R.; Cheng, C.Y.; Evans, J.W.; et al. WNT antagonists exhibit unique combinatorial antitumor activity with taxanes by potentiating mitotic cell death. Sci. Adv. 2017, 3, 700090. [Google Scholar] [CrossRef] [PubMed] [Green Version]
- Benhaj, K.; Akcali, K.C.; Ozturk, M. Redundant expression of canonical Wnt ligands in human breast cancer cell lines. Oncol. Rep. 2006, 15, 701–707. [Google Scholar] [CrossRef] [PubMed] [Green Version]
- Johnson, R.W.; Merkel, A.R.; Page, J.M. Wnt signaling induces gene expression of factors associated with bone destruction in lung and breast cancer. Clin. Exp. Metastasis 2014, 31, 945–959. [Google Scholar] [CrossRef] [PubMed]
- Kim, H.J.; Roh, M.S.; Son, C.H.; Kim, A.J.; Jee, H.J.; Song, N.; Kim, M.; Seo, S.Y.; Yoo, Y.H.; Yun, J. Loss of Med1/TRAP220 promotes the invasion and metastasis of human non-small-cell lung cancer cells by modulating the expression of metastasis-related genes. Cancer Lett. 2012, 321, 195–202. [Google Scholar] [CrossRef] [PubMed]
- Mukherjee, N.; Bhattacharya, N.; Alam, N.; Roy, A.; Roychoudhury, S.; Panda, C.K. Subtype-specific alterations of the Wnt signaling pathway in breast cancer, clinical and prognostic significance. Cancer Sci. 2012, 103, 210–212. [Google Scholar] [CrossRef] [PubMed]
- Near, R.; Zhang, Y.; Makkinje, A.; Leme, A. AND-34/BCAR3 differs from other NSP homologs in induction of anti-estrogen resistance, cyclin D1 promoter activation and altered breast cancer cell morphology. J. Cell. Physiol. 2007, 212, 655–665. [Google Scholar] [CrossRef] [PubMed] [Green Version]
- Gopal, K.; Golden, E.; Woodward, A.; Pavlos, N.J.; Blancafort, P. Rab GTPases: Emerging oncogenes and tumor suppressive regulators for the editing of survival pathways in cancer. Cancers 2020, 12, 259. [Google Scholar] [CrossRef] [Green Version]
- Schrecengost, R.S.; Riggins, R.B.; Thomas, K.S.; Guerrero, M.S.; Bouton, A.H. Breast cancer antiestrogen resistance-3 expression regulates breast cancer cell migration through promotion of p130Cas membrane localization and membrane ruffling. Cancer Res. 2007, 67, 6174–6182. [Google Scholar] [CrossRef] [PubMed] [Green Version]
- Wilson, L.; Schrecengost, R.S.; Guerrero, M.S.; Thomas, K.S.; Bouton, A.H. Breast cancer antiestrogen resistance 3 (BCAR3) promotes cell motility by regulating actin cytoskeletal and adhesion remodeling in invasive breast cancer cells. PLoS ONE 2013, 8, e65678. [Google Scholar] [CrossRef] [Green Version]
- Gangi Setty, S.R.; Shin, M.E.; Yoshino, A.; Marks, M.S. Golgi Recruitment of GRIP domain proteins by Arf-like GTPase 1 is regulated by Arf-like GTPase3. Curr. Biol. 2003, 13, 401–404. [Google Scholar] [CrossRef] [Green Version]
- Zhang, Y.; Xi, S.; Chen, J.; Zhou, D.; Gao, H.; Zhou, Z.; Xu, L.; Chen, M. Overexpression of LAMC1 predicts poor prognosis and enhances tumor cell invasion and migration in hepatocellular carcinoma. J. Cancer 2017, 8, 992–3000. [Google Scholar] [CrossRef] [Green Version]
- Niemitz, E. Ras pathway activation in breast cancer. Nat. Genet. 2013, 45, 1273. [Google Scholar] [CrossRef]
- Zubeldia-Brenner, L.; Gutierrez-Uzquiza, A.; Barrio-Real, L.; Wang, H.; Kazanietz, M.G.; Leskow, F.C. β3-chimaerin, a novel member of the chimaerinRac-GAP family. Mol. Biol. Rep. 2014, 41, 206776. [Google Scholar] [CrossRef] [Green Version]
- Barrio-Real, L.; Barrueco, M.; González-Sarmiento, R.; Caloca, M. Association of a novelpolymorphism of the β2-chimaerin gene (CHN2) with smoking. J. Investig. Med. 2013, 61, 1129–1131. [Google Scholar] [CrossRef] [PubMed] [Green Version]
- Nishikawa, R.; Goto, Y.; Kojima, S.; Enokida, H.; Chiyomaru, T.; Kinoshita, T.; Sakamoto, S.; Fuse, M.; Nakagawa, M.; Naya, Y.; et al. Tumor-suppressive microRNA-29s inhibit cancer emigration and invasion via targeting LAMC1 in prostate cancer. Int. J. Oncol. 2014, 45, 401–410. [Google Scholar] [CrossRef] [PubMed] [Green Version]
- Piovan, C.; Palmieri, D.; Di Leva, G.; Braccioli, L.; Casalini, P.; Nuovo, G.; Tortoreto, M.; Sasso, M.; Plantamura, I.; Triulzi, T. Oncosuppressive role of p53-induced miR205 in triple negative breast cancer. Mol. Oncol. 2012, 6, 458–472. [Google Scholar] [CrossRef] [PubMed]
- Jia, W.; Lu, R.; Martin, T.A.; Jiang, W.G. The role of claudin-5 in blood-brain barrier (BBB) and brain metastases (review). Mol. Med. Rep. 2014, 9, 779–785. [Google Scholar] [CrossRef] [Green Version]
- Ye, L.; Martin, T.A.; Parr, C.; Harrison, G.M.; Mansel, R.E.; Jiang, W.G. Biphasic effects of 17-beta-estradiol on expression of occludin and transendothelial resistance and paracellular permeability in human vascular endothelial cells. J. Cell. Physiol. 2003, 196, 362–369. [Google Scholar] [CrossRef]
- Soini, Y. Claudins 2, 3, 4, and 5 in Paget’s disease and breast carcinoma. Hum. Pathol. 2004, 35, 1531–1536. [Google Scholar] [CrossRef]
- Kato-Nakano, M.; Suzuki, M.; Kawamoto, S.; Furuya, A.; Ohta, S.; Nakamura, K.; Ando, H. Characterization and evaluation of the antitumour activity of a dual-targeting monoclonal antibody against claudin-3 and claudin-4. Anticancer Res. 2010, 30, 4555–4562. [Google Scholar]
- Szász, M.A. Claudins as prognostic factors of breast cancer. Magyar Onkológia 2012, 56, 209–212. [Google Scholar]
- Gu, S.; Tirgari, S.; Heximer, S.P. The RGS2 gene product from a candidate hypertension allele shows decreased plasma membrane association and inhibition of Gq. Mol. Pharmacol. 2008, 73, 1037–1043. [Google Scholar] [CrossRef]
- Liang, G.; Bansal, G.; Xie, Z.; Druey, K.M. RGS16 inhibits breast cancer cell growth by mitigating phosphatidylinositol 3-kinase signaling. J. Biol. Chem. 2009, 284, 21719–21727. [Google Scholar] [CrossRef] [Green Version]
- Geyer, F.C.; Lacroix-Triki, M.; Savage, K.; Arnedos, M.; Lambros, M.B.; MacKay, A.; Natrajan, R.; Reis-Filho, J.S. β-Catenin pathway activation in breast cancer is associated with triple-negative phenotype but not with CTNNB1 mutation. Mod. Pathol. 2011, 24, 209–231. [Google Scholar] [CrossRef] [PubMed]
- Sadeghi, N.; Gerber, D.E. Targeting the PI3K pathway for cancer therapy. Future Med. Chem. 2012, 4, 1153–1169. [Google Scholar] [CrossRef] [PubMed] [Green Version]
- Vasilatos, S.N.; Katz, T.A.; Oesterreich, S.; Wan, Y.; Davidson, N.E.; Huang, Y. Crosstalk between lysine-specific demethylase 1 (LSD1) and histone deacetylases mediates antineoplastic efficacy of HDAC inhibitors in human breast cancer cells. Carcinogenesis 2013, 34, 1196207. [Google Scholar] [CrossRef] [PubMed]
- Xu, J.; Prosperi, J.R.; Choudhury, N.; Olopade, O.I.; Goss, K.H. β-Catenin is required for the tumorigenic behavior of triple-negative breast cancer cells. PLoS ONE 2015, 10, e0117097. [Google Scholar] [CrossRef] [PubMed] [Green Version]
- Hayes, M.J.; Thomas, D.; Emmons, A.; Giordano, T.J.; Kleer, C.G. Genetic changes of Wnt pathway genes are common events in metaplastic carcinomas of the breast. Clin. Cancer Res. 2008, 14, 4038–4044. [Google Scholar] [CrossRef] [Green Version]
- Chen, R.; Luo, F.K.; Wang, Y.L.; Tang, J.L.; Liu, Y.S. LBP and CD14 polymorphisms correlate with increased colorectal carcinoma risk in Han Chinese. World J. Gastroenterol. 2011, 17, 2326–2331. [Google Scholar] [CrossRef]
- Kovacs, G.; Peterfi, L.; Farkas, N.; Javorhazy, A.; Pusztai, C.; Szanto, A. Expression of inflammatory lipopolysaccharide binding protein (LBP) predicts the progression of conventional renal cell carcinoma-a short report. Cell. Oncol. 2017, 40, 651–656. [Google Scholar] [CrossRef]

 biological adhesion (GO:0022610)
  - CLDN5, PKP3,
  biological process involved in interspecies interaction between organisms (GO:0044419) - LBP,
  biological regulation (GO:0065007) -LBP, WNT10B, SREBF1, CHN2, BCAR3, CTNNB1, WNT3,
  cellular process (GO:0009987) -LBP, WNT10B, SREBF1, RAB32, CLDN5, PKP3, BCAR3, TAP2, CTNNB1, WNT3, developmental process (GO:0032502) -WNT10B, WNT3,
  immune system process (GO:0002376) -LBP, localization (GO:0051179) -RAB32, TAP2,
  metabolic process (GO:0008152) -SREBF1, BCAR3, CTNNB1,
  multicellular organismal process (GO:0032501) -WNT3, WNT10B, pigmentation (GO:0043473) -RAB32,
  response to stimulus (GO:0050896) -LBPLBP, WNT10B, WNT3,
  signaling (GO:0023052) -LBP, WNT10B, WNT3.
biological adhesion (GO:0022610) - CLDN5, PKP3, biological process involved in interspecies interaction between organisms (GO:0044419) - LBP, biological regulation (GO:0065007) -LBP, WNT10B, SREBF1, CHN2, BCAR3, CTNNB1, WNT3, cellular process (GO:0009987) -LBP, WNT10B, SREBF1, RAB32, CLDN5, PKP3, BCAR3, TAP2, CTNNB1, WNT3, developmental process (GO:0032502) -WNT10B, WNT3, immune system process (GO:0002376) -LBP, localization (GO:0051179) -RAB32, TAP2, metabolic process (GO:0008152) -SREBF1, BCAR3, CTNNB1, multicellular organismal process (GO:0032501) -WNT3, WNT10B, pigmentation (GO:0043473) -RAB32, response to stimulus (GO:0050896) -LBPLBP, WNT10B, WNT3, signaling (GO:0023052) -LBP, WNT10B, WNT3.
signaling (GO:0023052) -LBP, WNT10B, WNT3.
biological adhesion (GO:0022610) - CLDN5, PKP3, biological process involved in interspecies interaction between organisms (GO:0044419) - LBP, biological regulation (GO:0065007) -LBP, WNT10B, SREBF1, CHN2, BCAR3, CTNNB1, WNT3, cellular process (GO:0009987) -LBP, WNT10B, SREBF1, RAB32, CLDN5, PKP3, BCAR3, TAP2, CTNNB1, WNT3, developmental process (GO:0032502) -WNT10B, WNT3, immune system process (GO:0002376) -LBP, localization (GO:0051179) -RAB32, TAP2, metabolic process (GO:0008152) -SREBF1, BCAR3, CTNNB1, multicellular organismal process (GO:0032501) -WNT3, WNT10B, pigmentation (GO:0043473) -RAB32, response to stimulus (GO:0050896) -LBPLBP, WNT10B, WNT3, signaling (GO:0023052) -LBP, WNT10B, WNT3. Alzheimer disease-presenilin pathway (P00004) -WNT3, CTNNB1, WNT10B,
  Angiogenesis (P00005) -WNT10B, CTNNB1,
  CCKR signaling map (P06959) -CTNNB1, RGS2,
  Cadherin signaling pathway (P00012) -WNT10B, CTNNB1, WNT3,
  Gonadotropin-releasing hormone receptor pathway (P06664) -CTNNB1,
  Heterotrimeric G-protein signaling pathway-Gi alpha and Gs alpha mediated pathway (P00026) -RGS16, RGS2, Heterotrimeric G-protein signaling pathway-Gq alpha and Go alpha mediated pathway (P00027) -RGS16, RGS2, Integrin signalling pathway (P00034) -LAMC1,
  Wnt signaling pathway (P00057) -WNT10B,CTNNB1, WNT3,
  p53 pathway feedback loops 2 (P04398) -CTNNB1.
Alzheimer disease-presenilin pathway (P00004) -WNT3, CTNNB1, WNT10B, Angiogenesis (P00005) -WNT10B, CTNNB1, CCKR signaling map (P06959) -CTNNB1, RGS2, Cadherin signaling pathway (P00012) -WNT10B, CTNNB1, WNT3, Gonadotropin-releasing hormone receptor pathway (P06664) -CTNNB1, Heterotrimeric G-protein signaling pathway-Gi alpha and Gs alpha mediated pathway (P00026) -RGS16, RGS2, Heterotrimeric G-protein signaling pathway-Gq alpha and Go alpha mediated pathway (P00027) -RGS16, RGS2, Integrin signalling pathway (P00034) -LAMC1, Wnt signaling pathway (P00057) -WNT10B,CTNNB1, WNT3, p53 pathway feedback loops 2 (P04398) -CTNNB1.
p53 pathway feedback loops 2 (P04398) -CTNNB1.
Alzheimer disease-presenilin pathway (P00004) -WNT3, CTNNB1, WNT10B, Angiogenesis (P00005) -WNT10B, CTNNB1, CCKR signaling map (P06959) -CTNNB1, RGS2, Cadherin signaling pathway (P00012) -WNT10B, CTNNB1, WNT3, Gonadotropin-releasing hormone receptor pathway (P06664) -CTNNB1, Heterotrimeric G-protein signaling pathway-Gi alpha and Gs alpha mediated pathway (P00026) -RGS16, RGS2, Heterotrimeric G-protein signaling pathway-Gq alpha and Go alpha mediated pathway (P00027) -RGS16, RGS2, Integrin signalling pathway (P00034) -LAMC1, Wnt signaling pathway (P00057) -WNT10B,CTNNB1, WNT3, p53 pathway feedback loops 2 (P04398) -CTNNB1.
 ATP-dependent activity (GO:0140657) -TAP2,
  binding (GO:0005488) -LBP, CHN2, WNT10, BSREBF1, PKP,CTNNB1, 3WNT3,
  catalytic activity (GO:0003824) -RAB32, CHN2, TAP2,
  molecular function regulator (GO:0098772) -WNT3, CHN2, WNT10B,
  molecular transducer activity (GO:0060089) -WNT10B, WNT3, transcription regulator activity (GO:0140110) -SREBF1, CTNNB1, transporter activity (GO:0005215) -TAP2.
ATP-dependent activity (GO:0140657) -TAP2, binding (GO:0005488) -LBP, CHN2, WNT10, BSREBF1, PKP,CTNNB1, 3WNT3, catalytic activity (GO:0003824) -RAB32, CHN2, TAP2, molecular function regulator (GO:0098772) -WNT3, CHN2, WNT10B, molecular transducer activity (GO:0060089) -WNT10B, WNT3, transcription regulator activity (GO:0140110) -SREBF1, CTNNB1, transporter activity (GO:0005215) -TAP2.
molecular transducer activity (GO:0060089) -WNT10B, WNT3, transcription regulator activity (GO:0140110) -SREBF1, CTNNB1, transporter activity (GO:0005215) -TAP2.
ATP-dependent activity (GO:0140657) -TAP2, binding (GO:0005488) -LBP, CHN2, WNT10, BSREBF1, PKP,CTNNB1, 3WNT3, catalytic activity (GO:0003824) -RAB32, CHN2, TAP2, molecular function regulator (GO:0098772) -WNT3, CHN2, WNT10B, molecular transducer activity (GO:0060089) -WNT10B, WNT3, transcription regulator activity (GO:0140110) -SREBF1, CTNNB1, transporter activity (GO:0005215) -TAP2.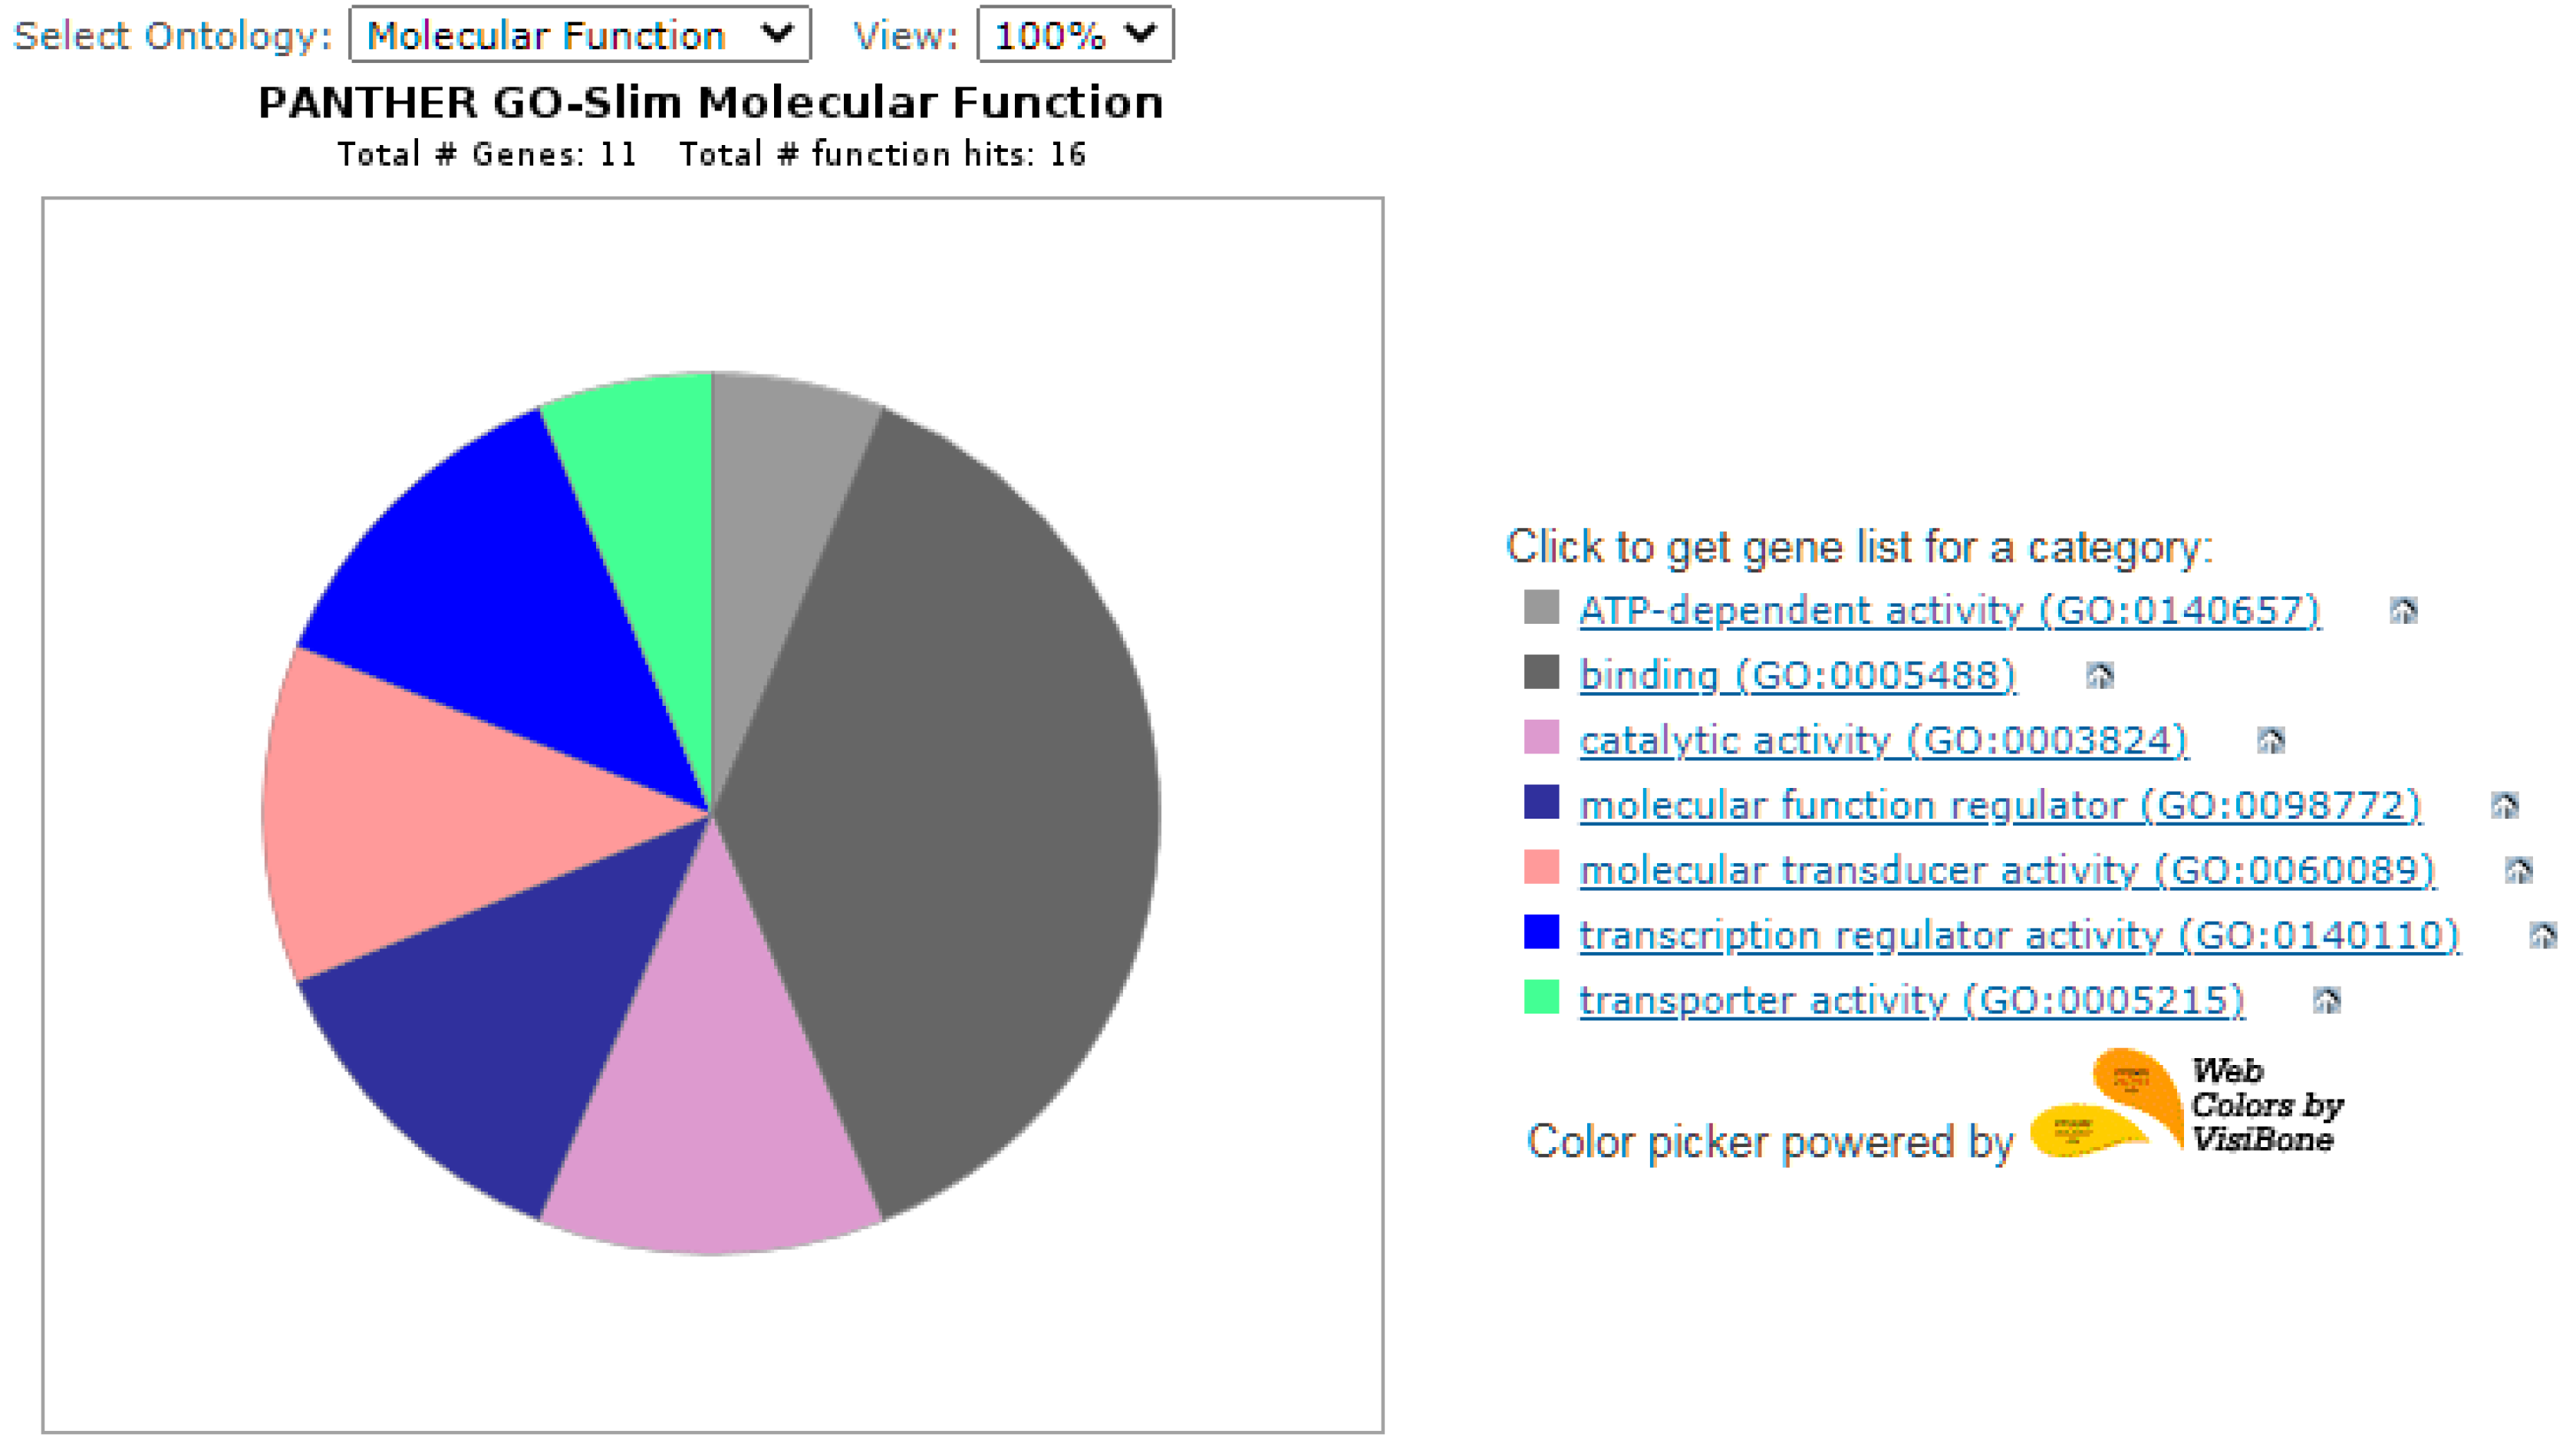

| WNT3 | WNT3 wingless-type MMTV integration site family, member 3 |
| RAB32 | RAB32 2, a member of the RAS oncogene family |
| WNT10B | WNT10B wingless-type MMTV integration site family, member 10B |
| BCAR3 | BCAR3 breast cancer anti-estrogen resistance 3 |
| CTNNB1 | CTNNB1 catenin (cadherin-associated protein), beta 1, 88kDa |
| CHN2 | CHN2 chimerin (chimaerin) 2 |
| LAD1 | LAD1 ladinin 1 |
| RGS16 | RGS16 regulator of G-protein signaling 16 |
| RGS2 | RGS2 regulator of G-protein signaling 2, 24kDa |
| LAMC1 | LAMC1 laminin, gamma 1 (formerly LAMB2) |
| LBP | LBP lipopolysaccharide binding protein |
| SR-BP1 | sterol response element-binding protein-1 |
| TAP2 | Transporter associated with the transformation of antigens |
| PKP3 | PKP3 plakophilin 3 |
| CLDN5 | CLDN5 claudin 5 (transmembrane protein deleted in velocardiofacial syndrome) |
| Gene Names | Statistical Significance | Correlation |
|---|---|---|
| WNT3 Pacli 300–WNT10 Pacli 300 | 0.0338 | 0.3548 |
| RAB 32 Control–RGS2 Control | 0.0027 | 0.347 |
| RAB 32 Pacli 60–PKP3 Pacli 60 | 0.0027 | −0.4853 |
| PKP Pacli 60–RGS16 Pacli 60 | 0.0006 | 0.5464 |
| TREM1 Control–PKP3 Control | 0.0311 | −0.3598 |
| BCAR3 Pacli 60–PKP3 Pacli 60 | 0.0036 | −0.4726 |
| TREM1 Pacli 60–WNT3 Pacli 60 | 0.04 | 0.3439 |
| TREM1Pacli 300–PKP3 Pacli 60 | 0.047 | −0.3334 |
Publisher’s Note: MDPI stays neutral with regard to jurisdictional claims in published maps and institutional affiliations. |
© 2022 by the authors. Licensee MDPI, Basel, Switzerland. This article is an open access article distributed under the terms and conditions of the Creative Commons Attribution (CC BY) license (https://creativecommons.org/licenses/by/4.0/).
Share and Cite
Rzymowska, J.; Wilkołaski, A.; Szatkowska, L.; Grzybowska, L. The Expression of Signaling Genes in Breast Cancer Cells. Biology 2022, 11, 555. https://doi.org/10.3390/biology11040555
Rzymowska J, Wilkołaski A, Szatkowska L, Grzybowska L. The Expression of Signaling Genes in Breast Cancer Cells. Biology. 2022; 11(4):555. https://doi.org/10.3390/biology11040555
Chicago/Turabian StyleRzymowska, Jolanta, Andrzej Wilkołaski, Lidia Szatkowska, and Ludmiła Grzybowska. 2022. "The Expression of Signaling Genes in Breast Cancer Cells" Biology 11, no. 4: 555. https://doi.org/10.3390/biology11040555
APA StyleRzymowska, J., Wilkołaski, A., Szatkowska, L., & Grzybowska, L. (2022). The Expression of Signaling Genes in Breast Cancer Cells. Biology, 11(4), 555. https://doi.org/10.3390/biology11040555