
Morphometrics of the Spinal Cord and Surrounding Structures in Alligator mississippiensis


Abstract
:Simple Summary
Abstract
1. Introduction
2. Materials and Methods
2.1. Specimens
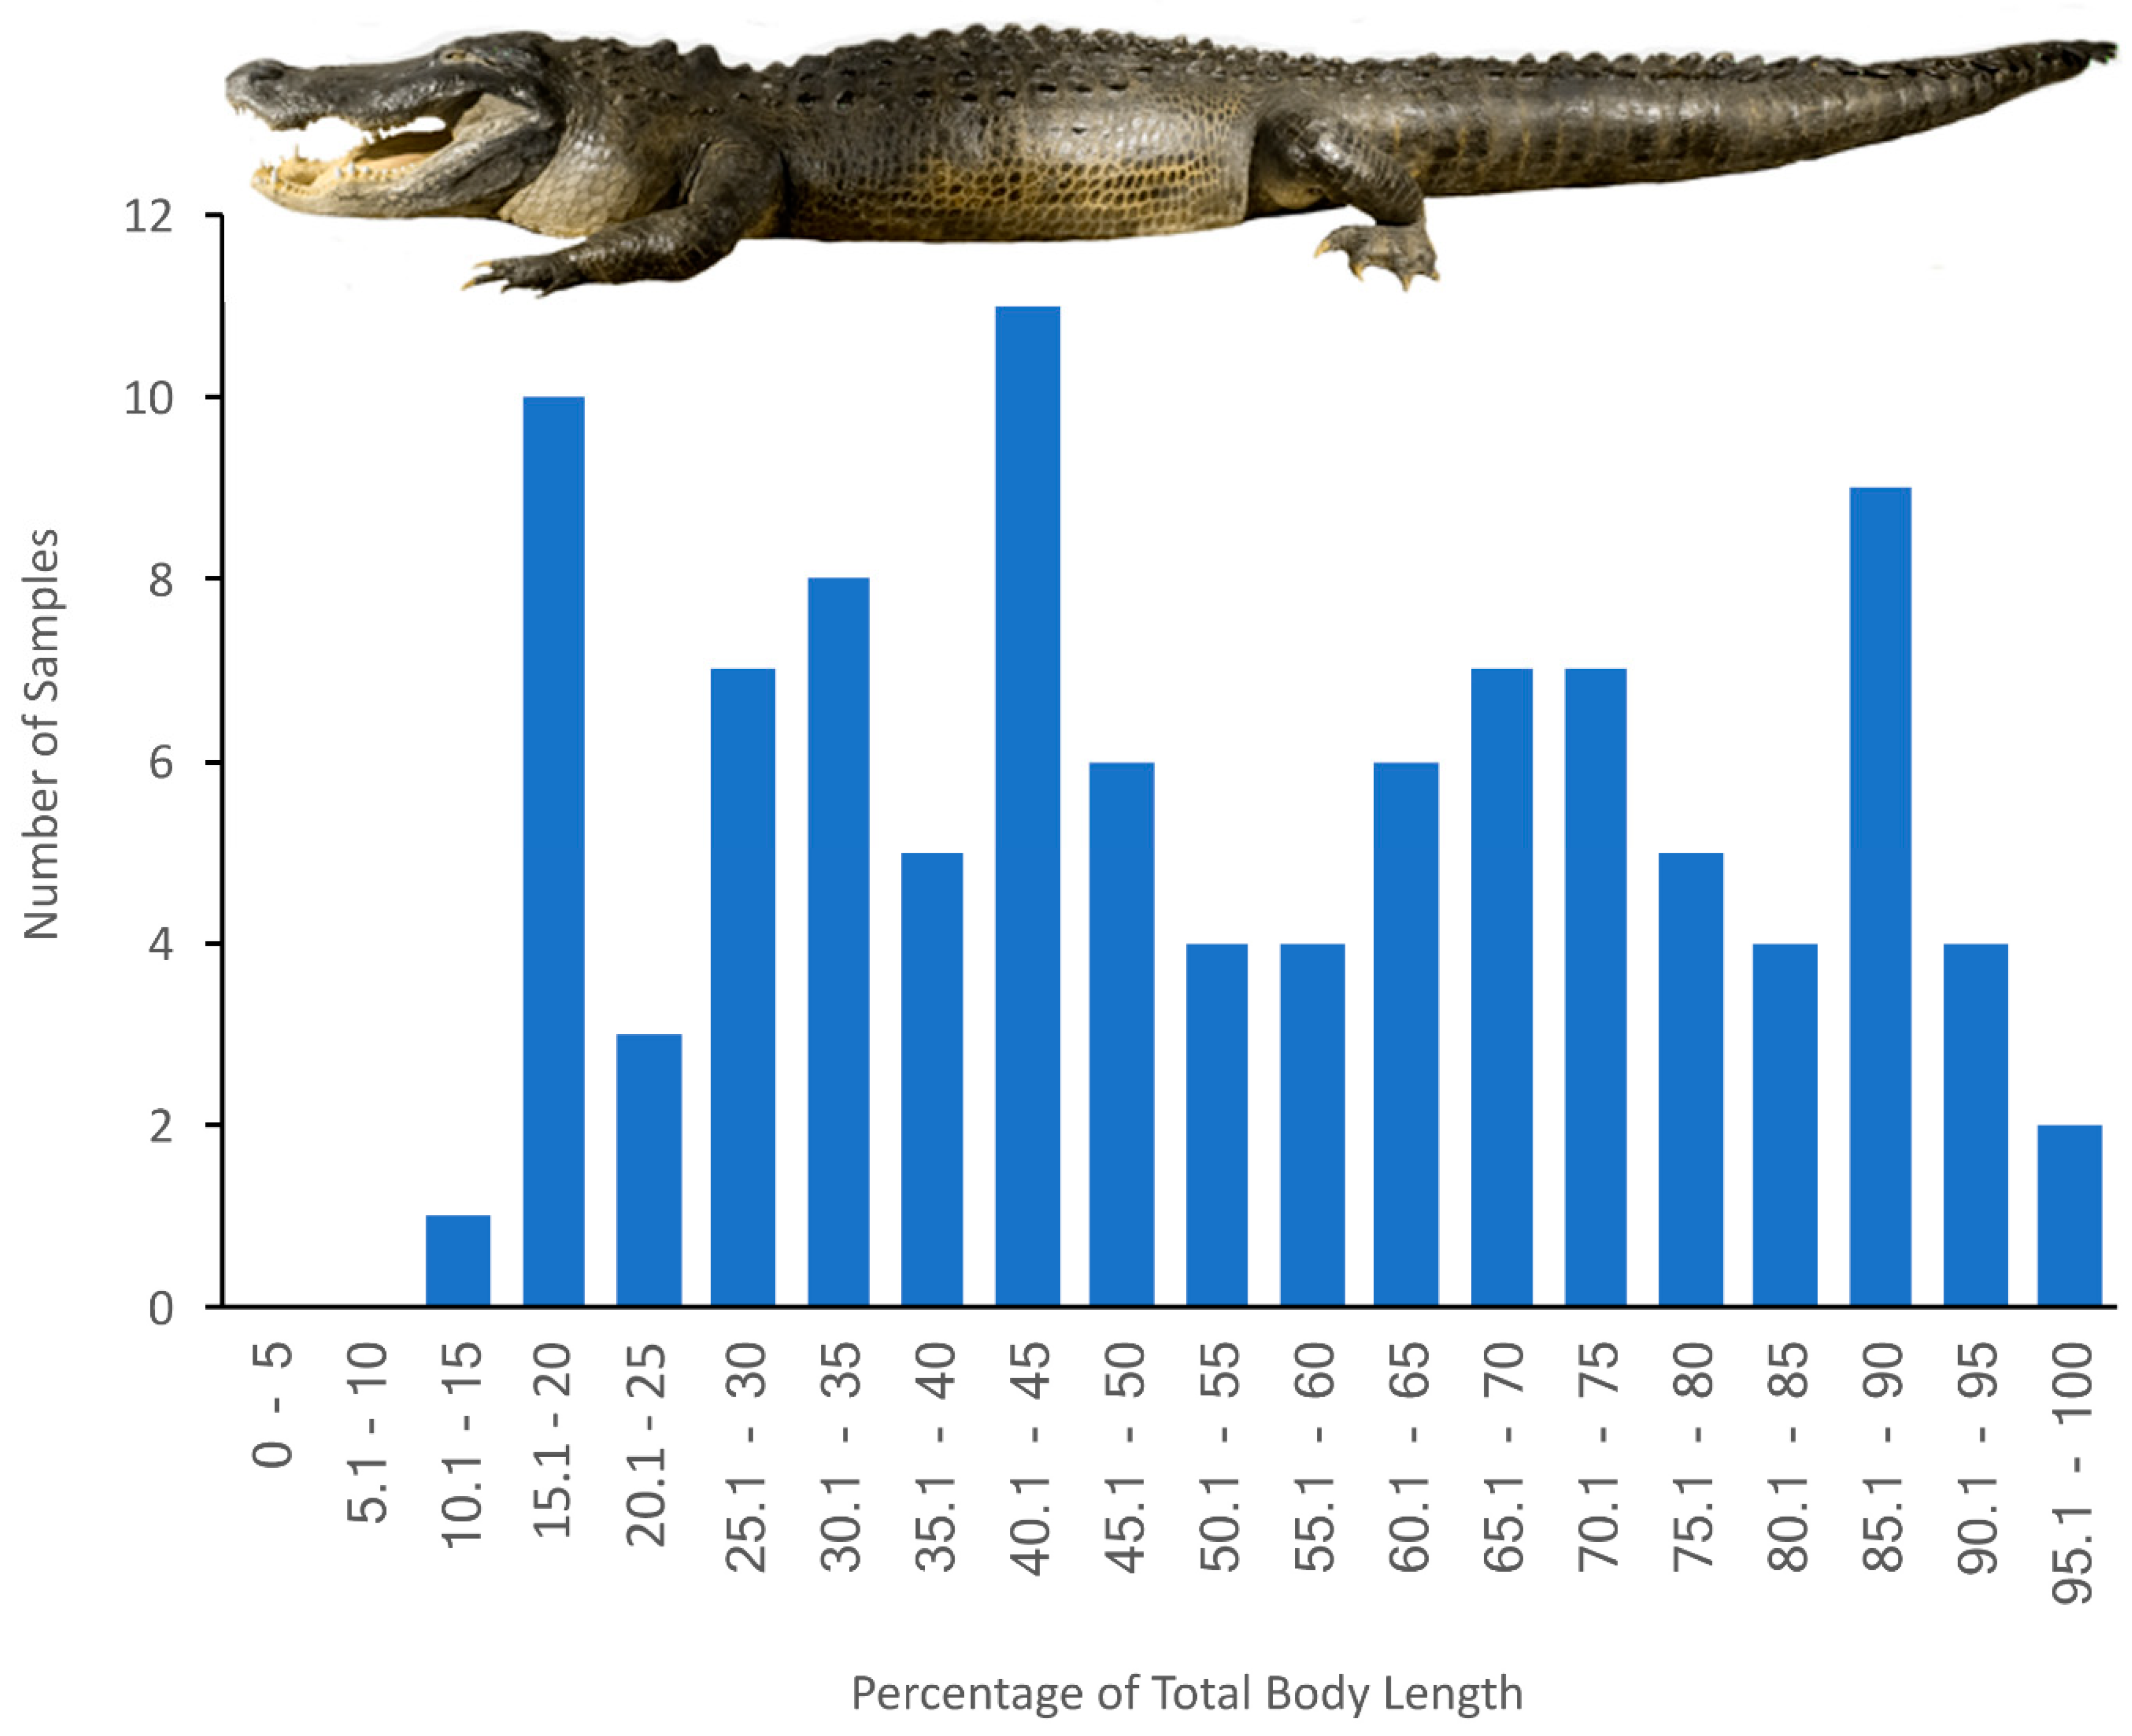
2.2. Samples
2.3. Anatomical Preparation
2.4. Quantification
2.5. Statistical Analysis
3. Results
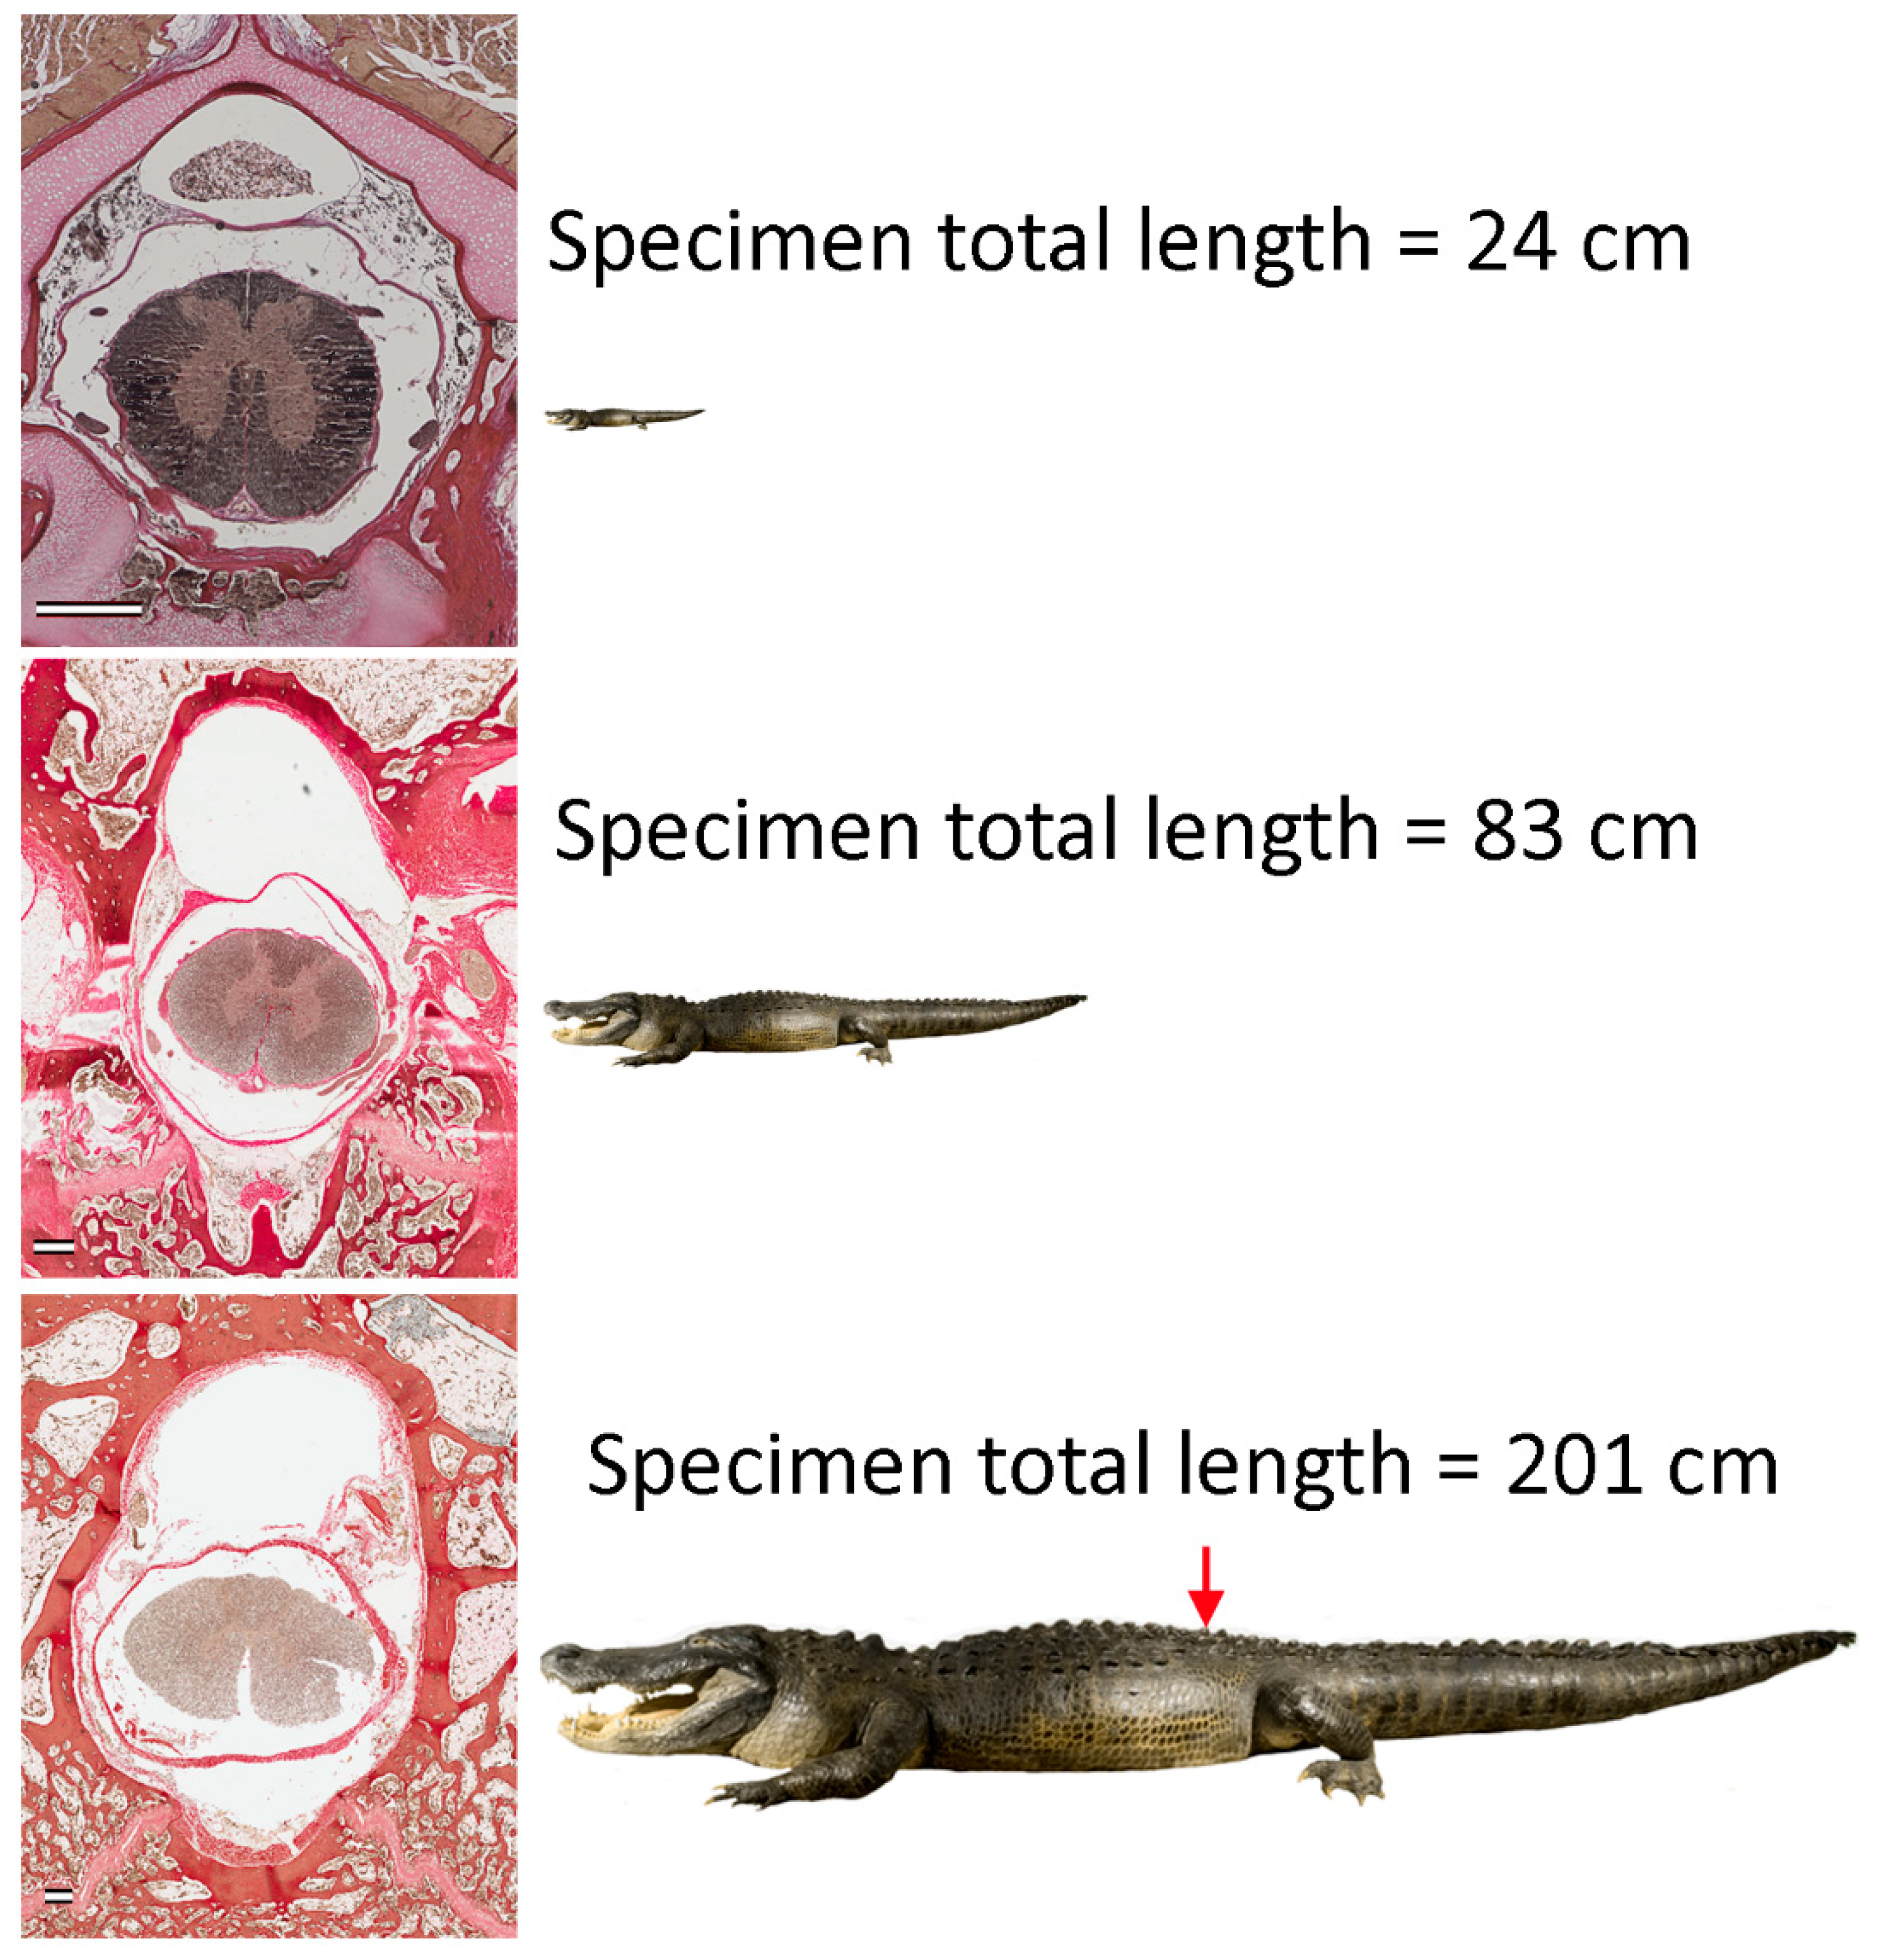
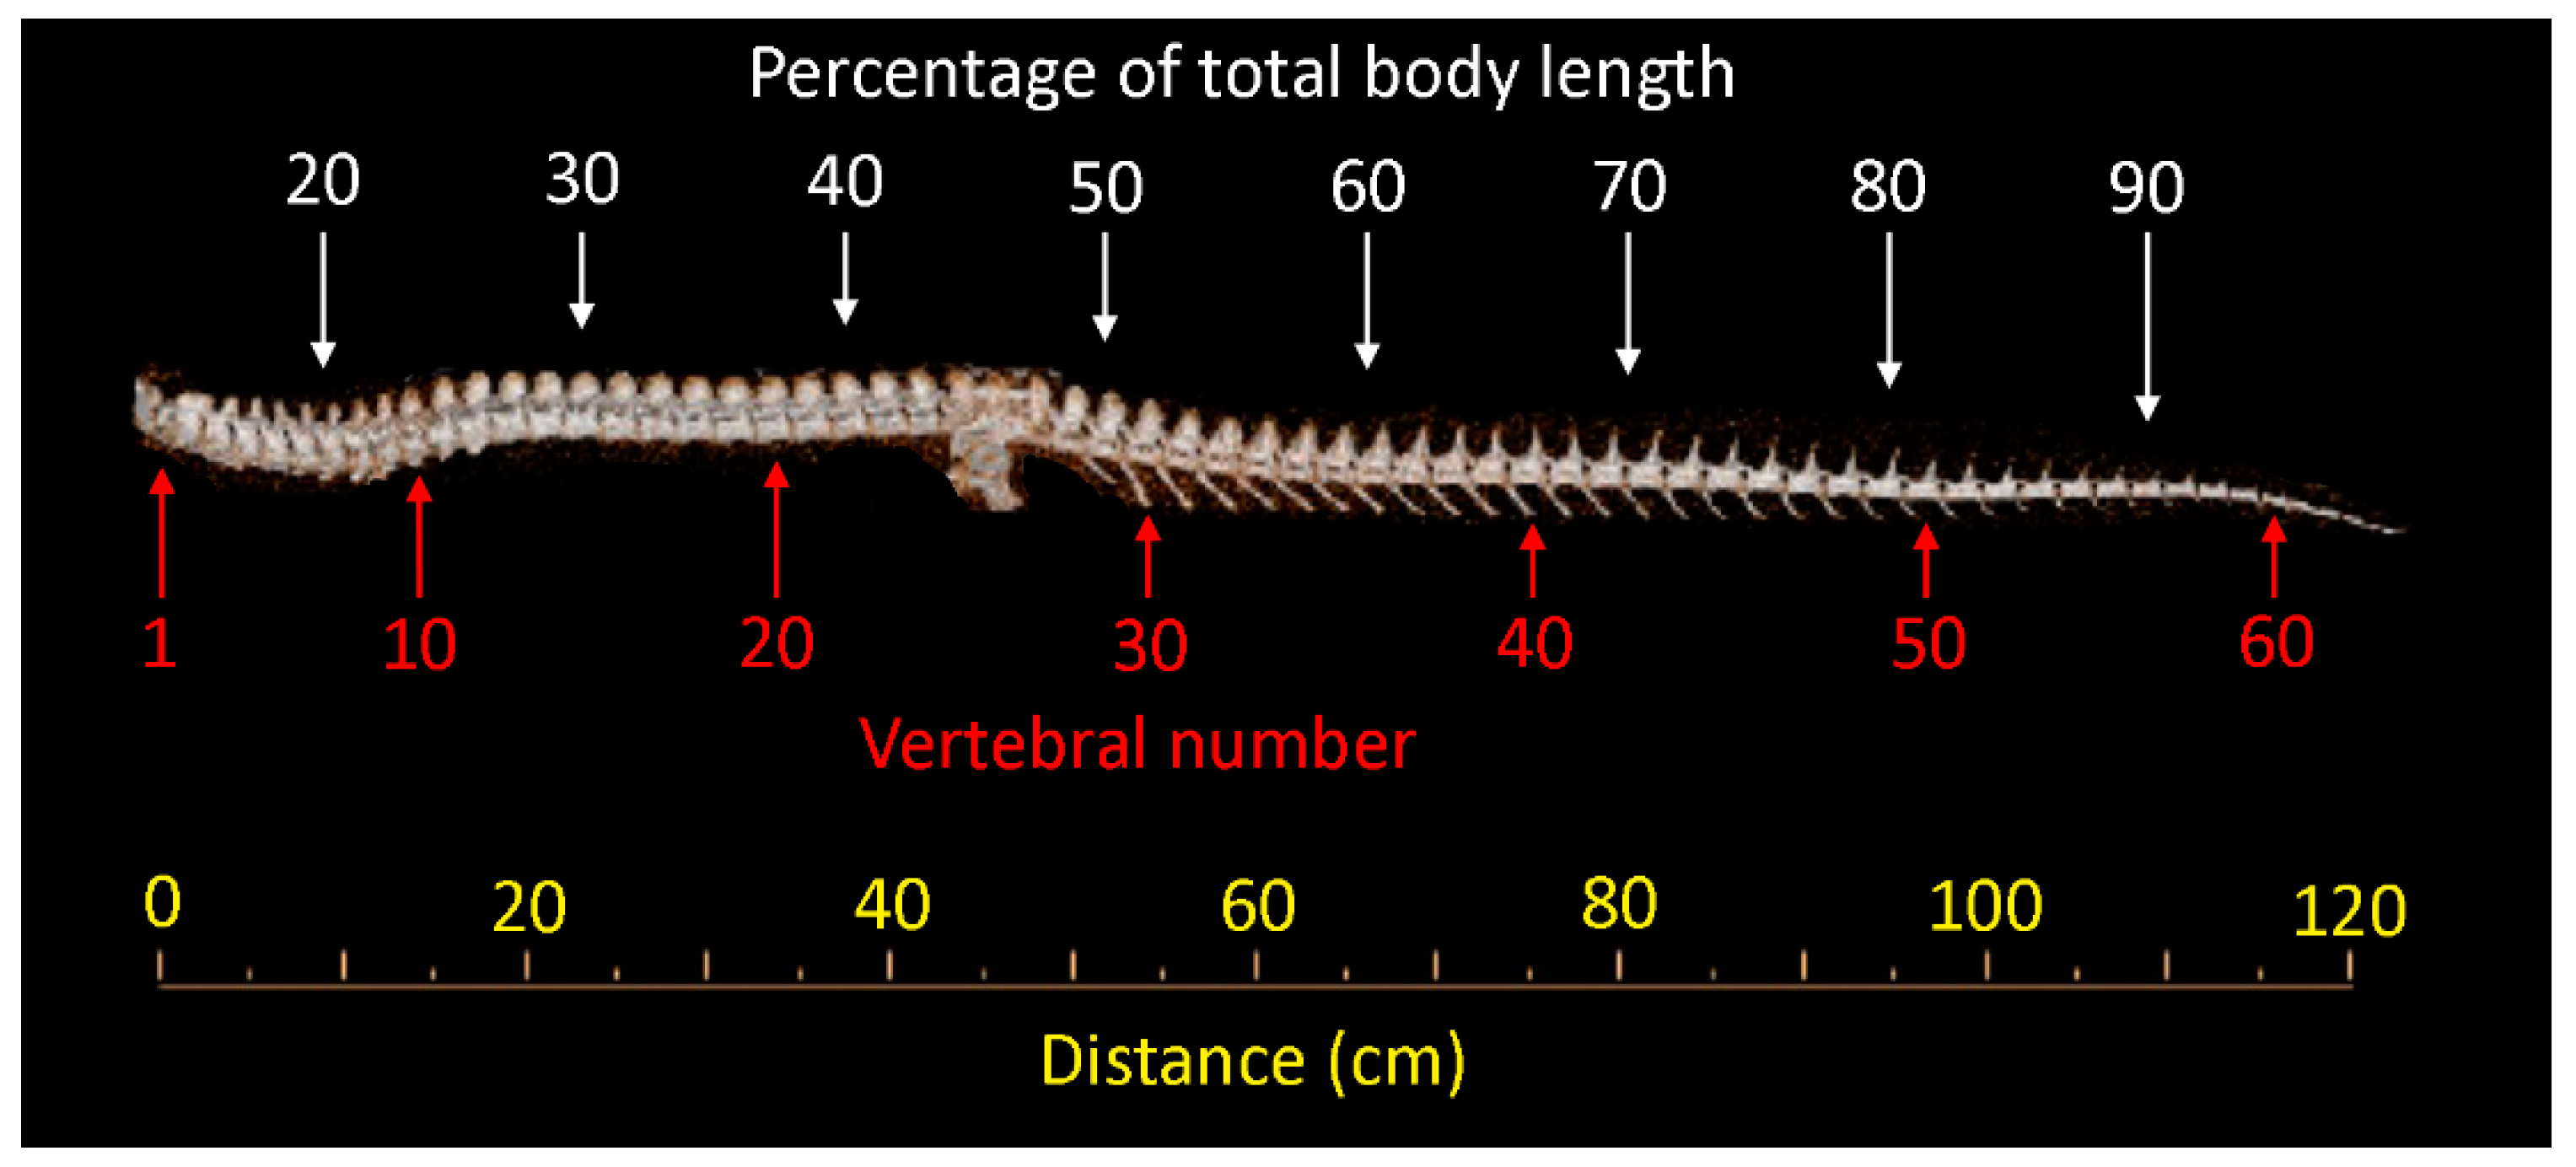
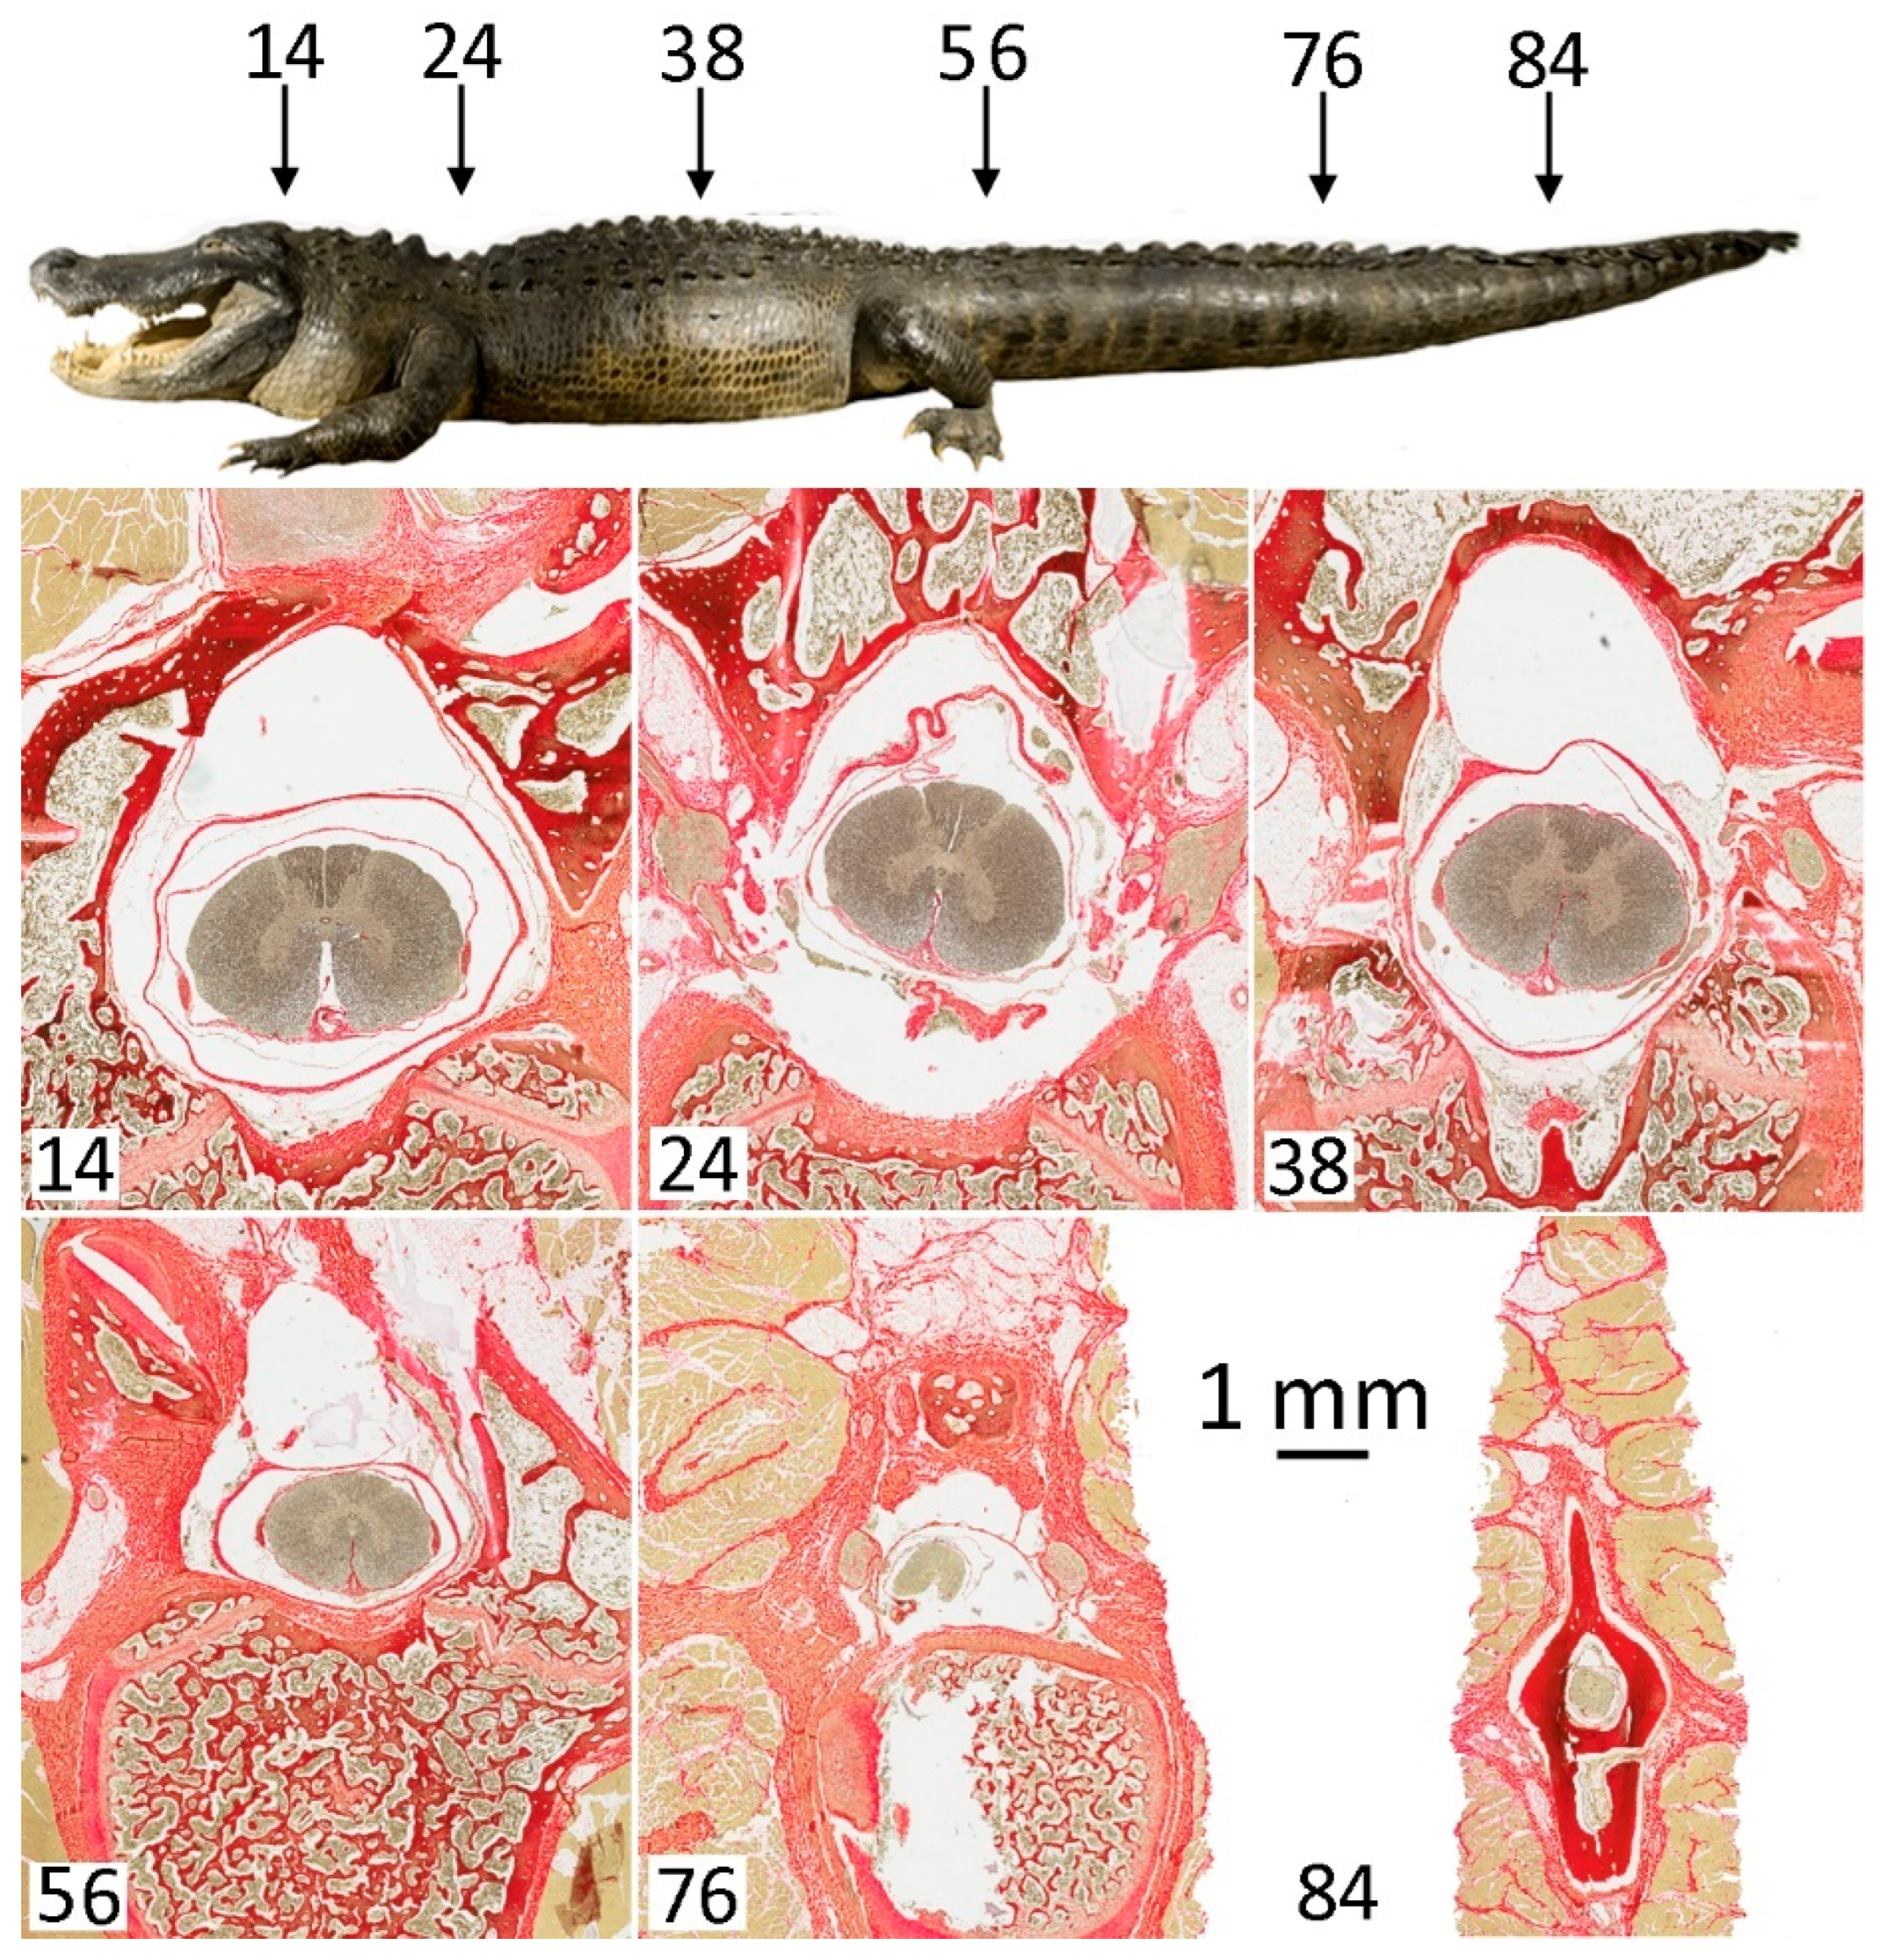
3.1. General Appearance and Variation in the Alligator Spinal Cord and Vertebral Canal
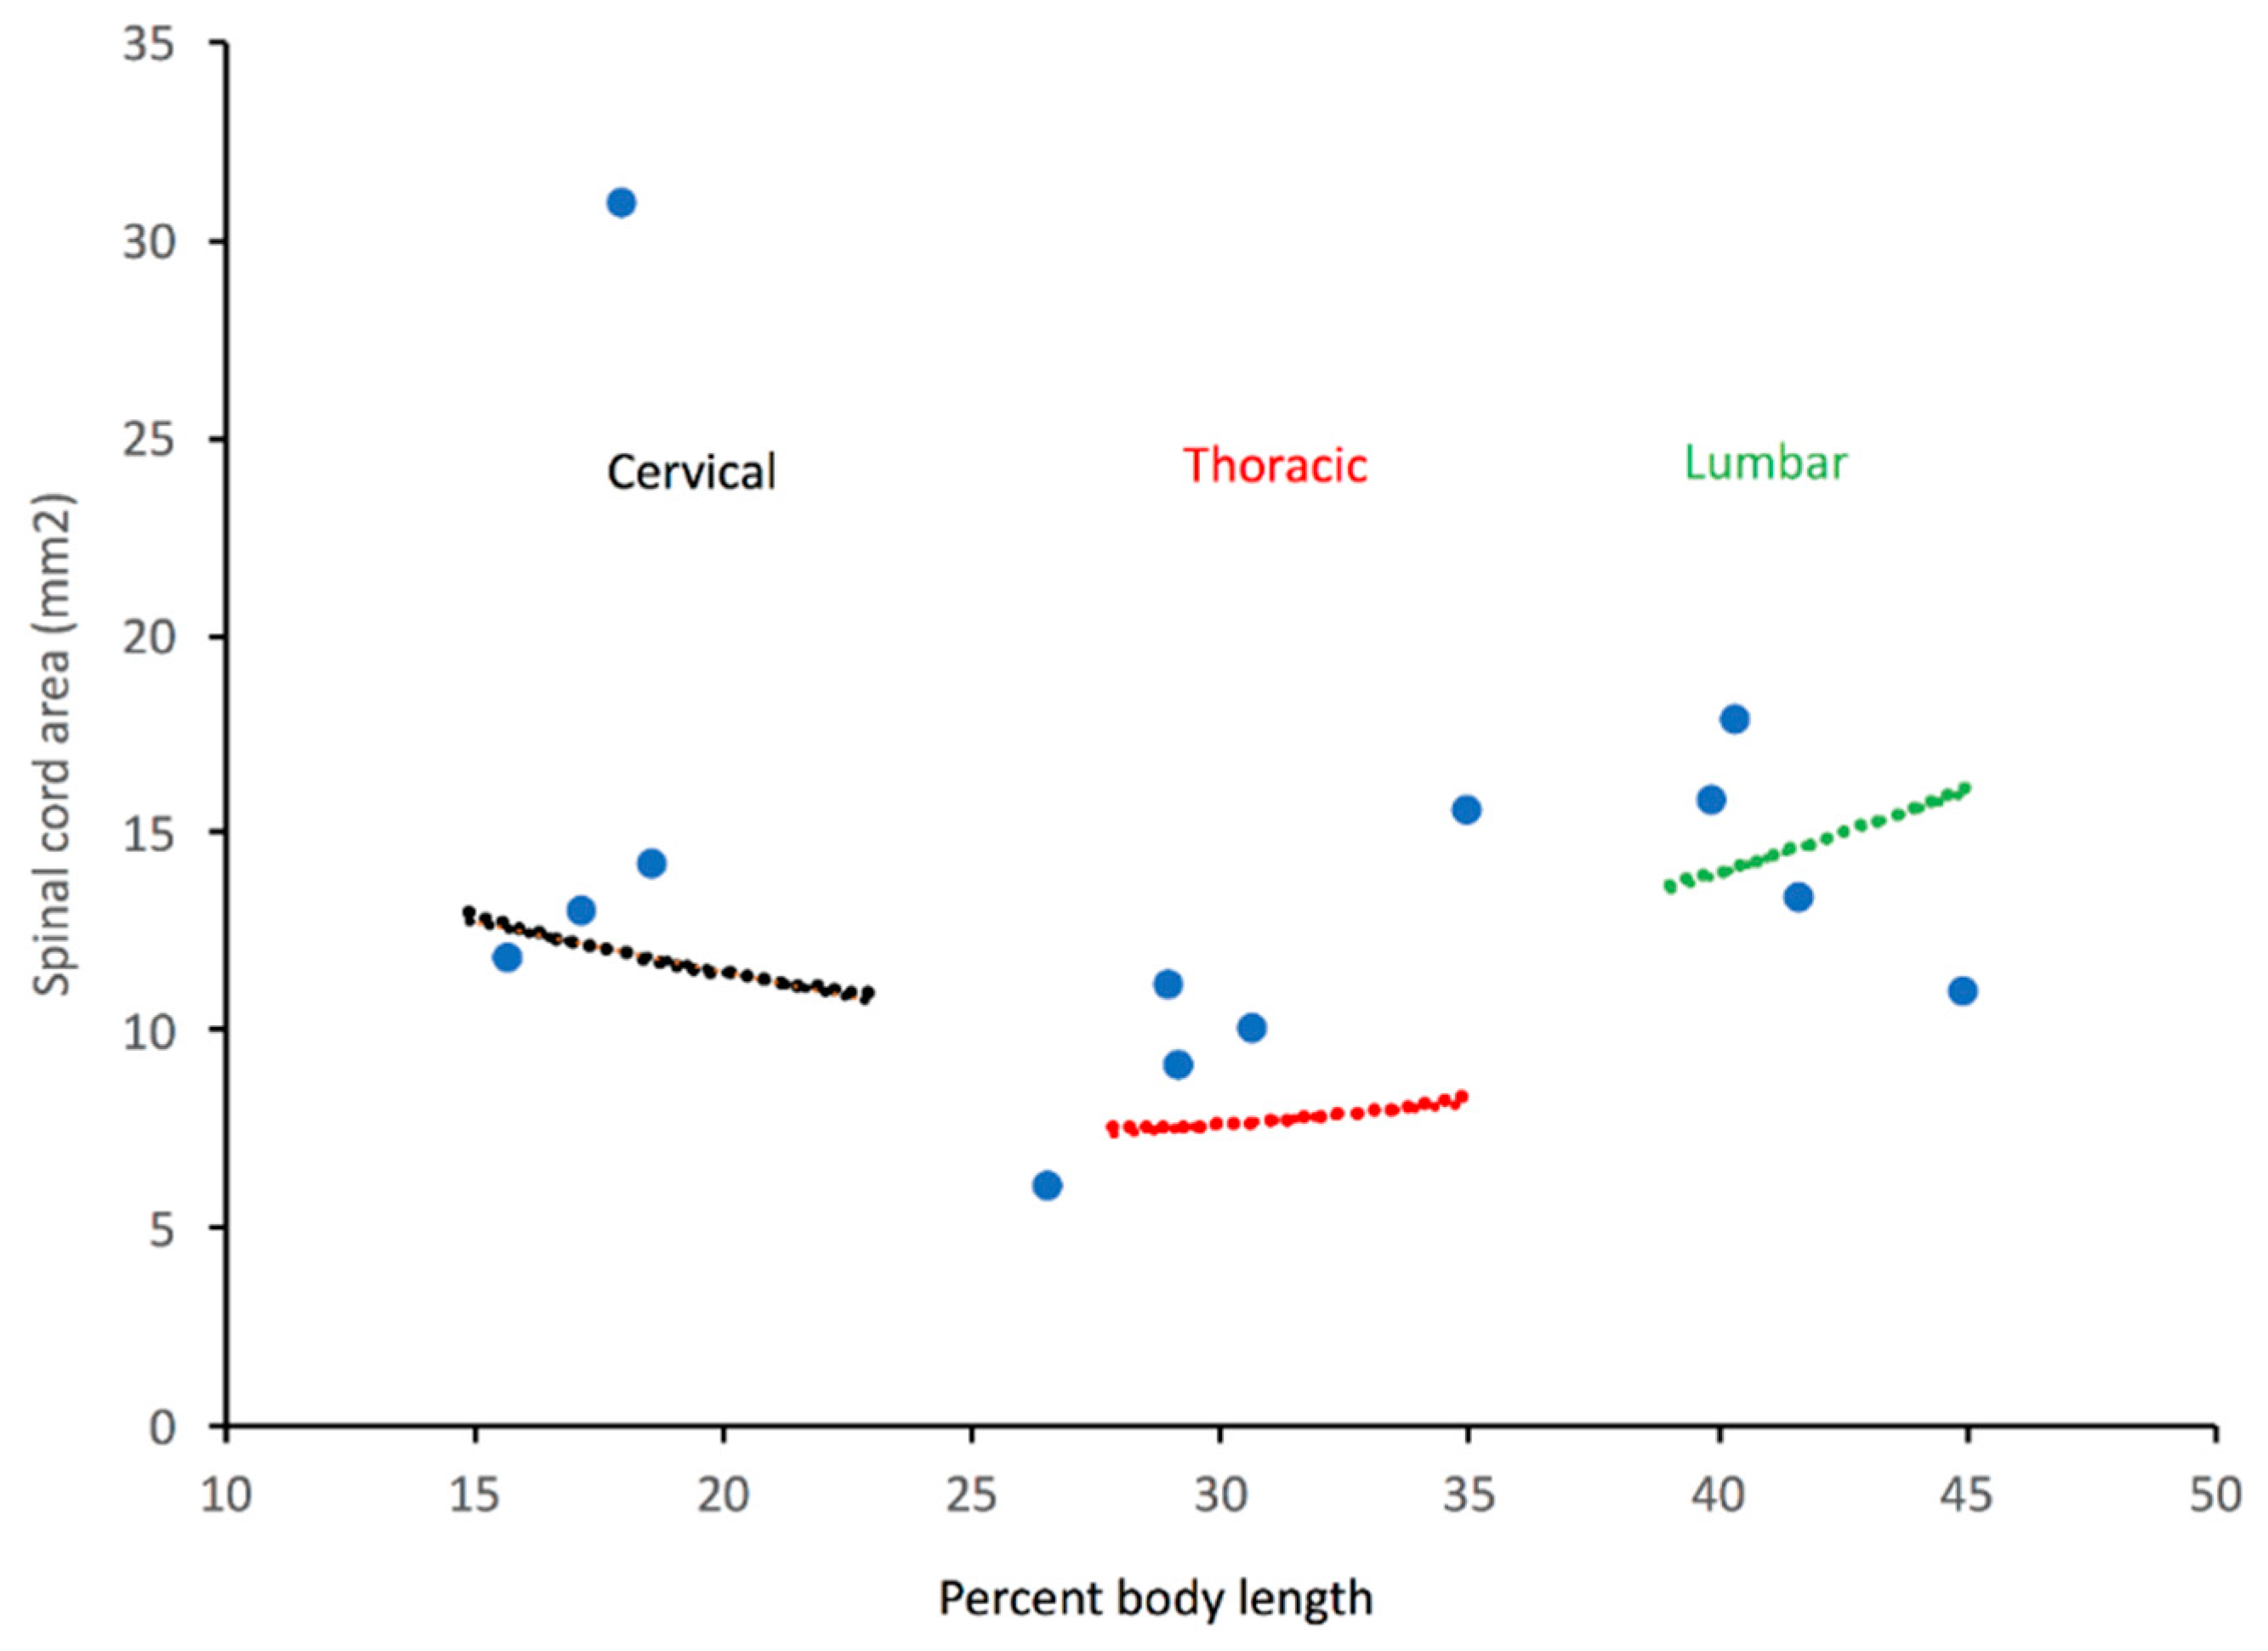
3.2. Trunk
3.3. Caudal
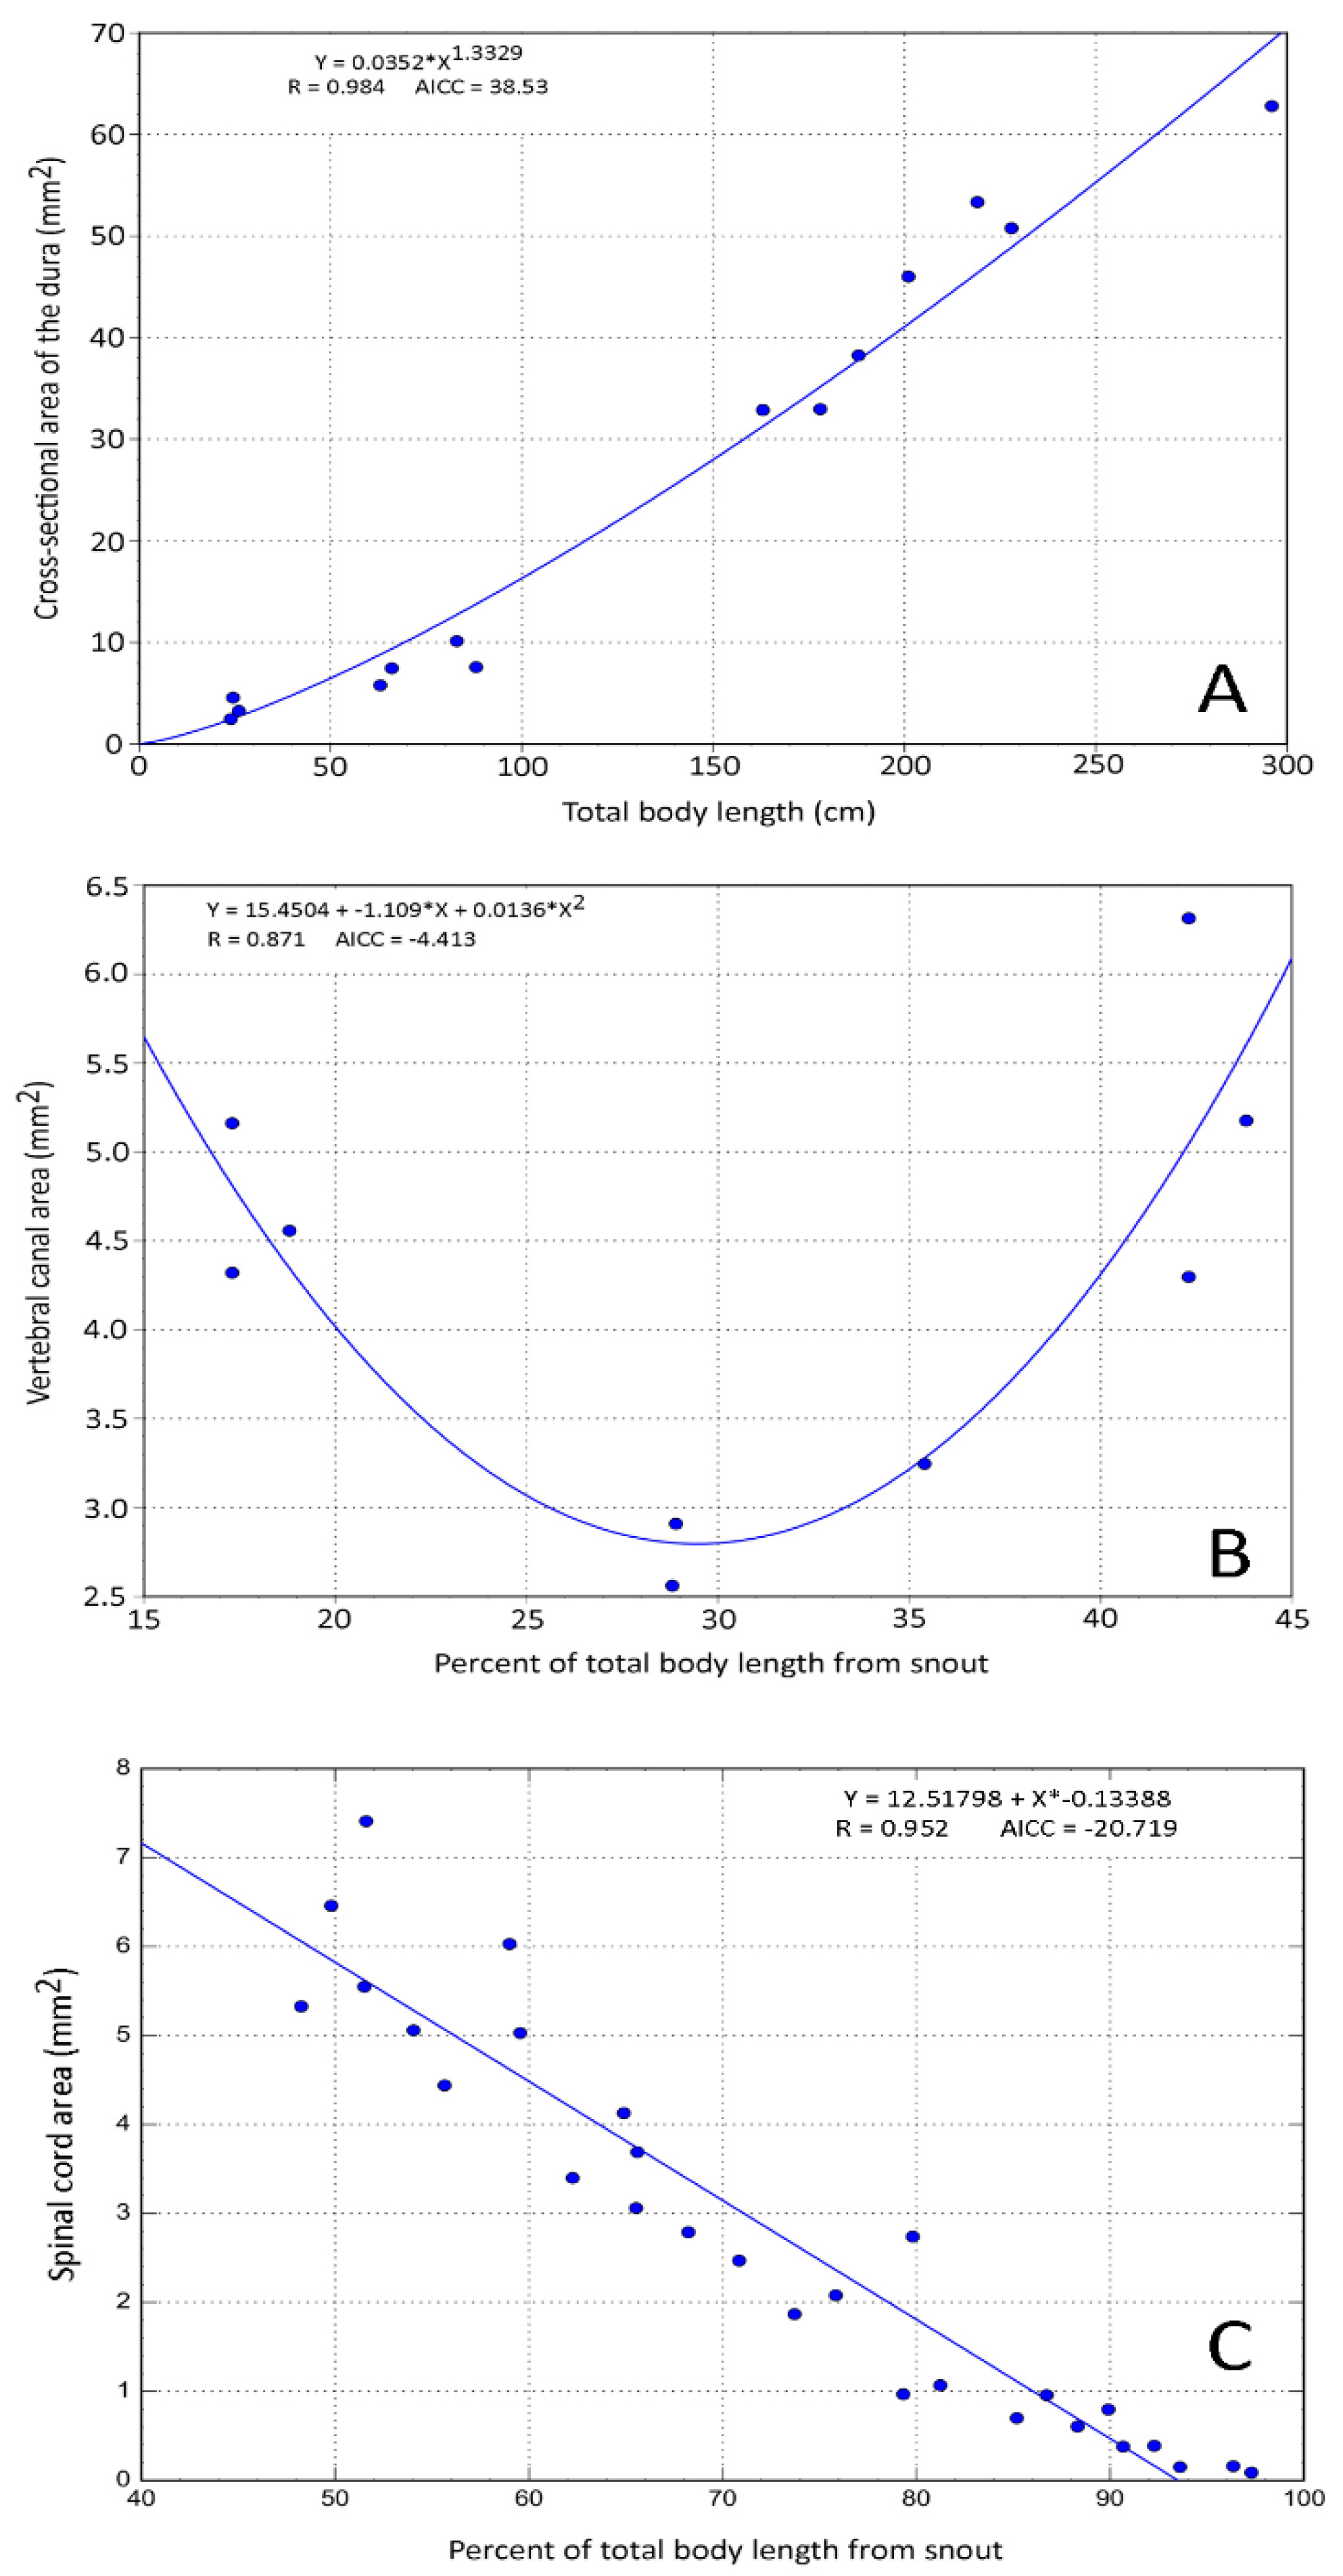
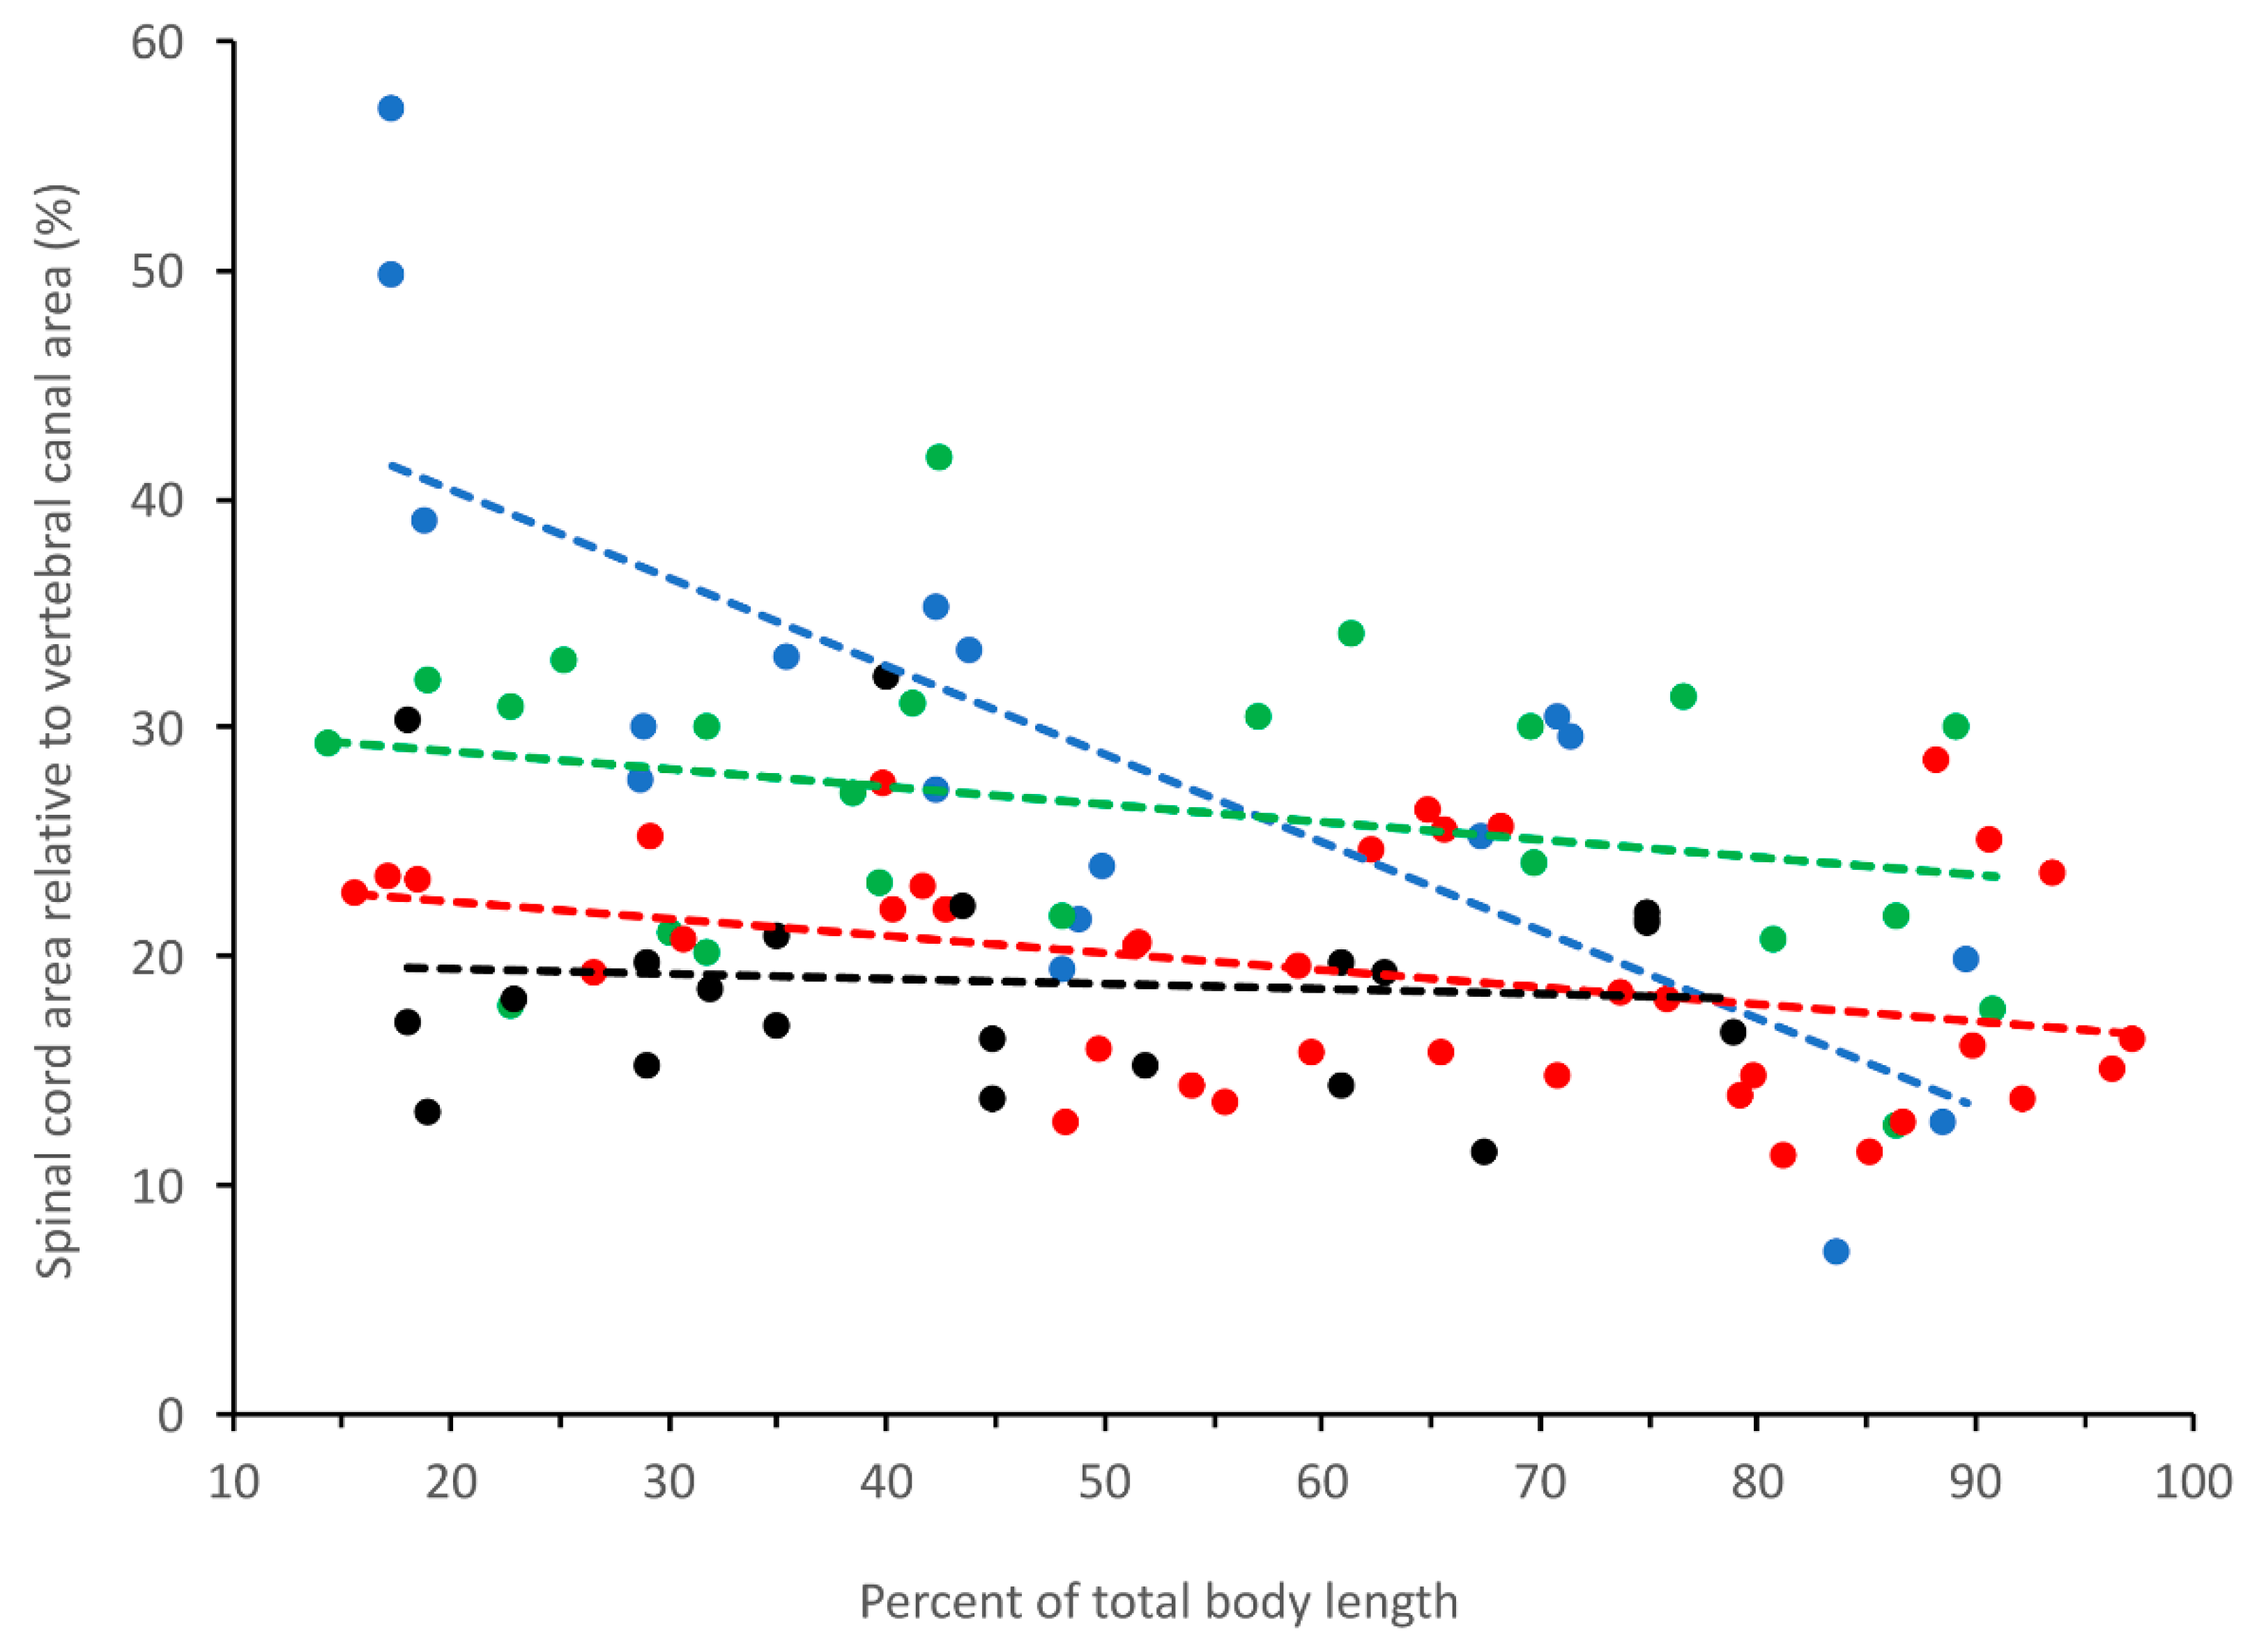
3.4. General Trends
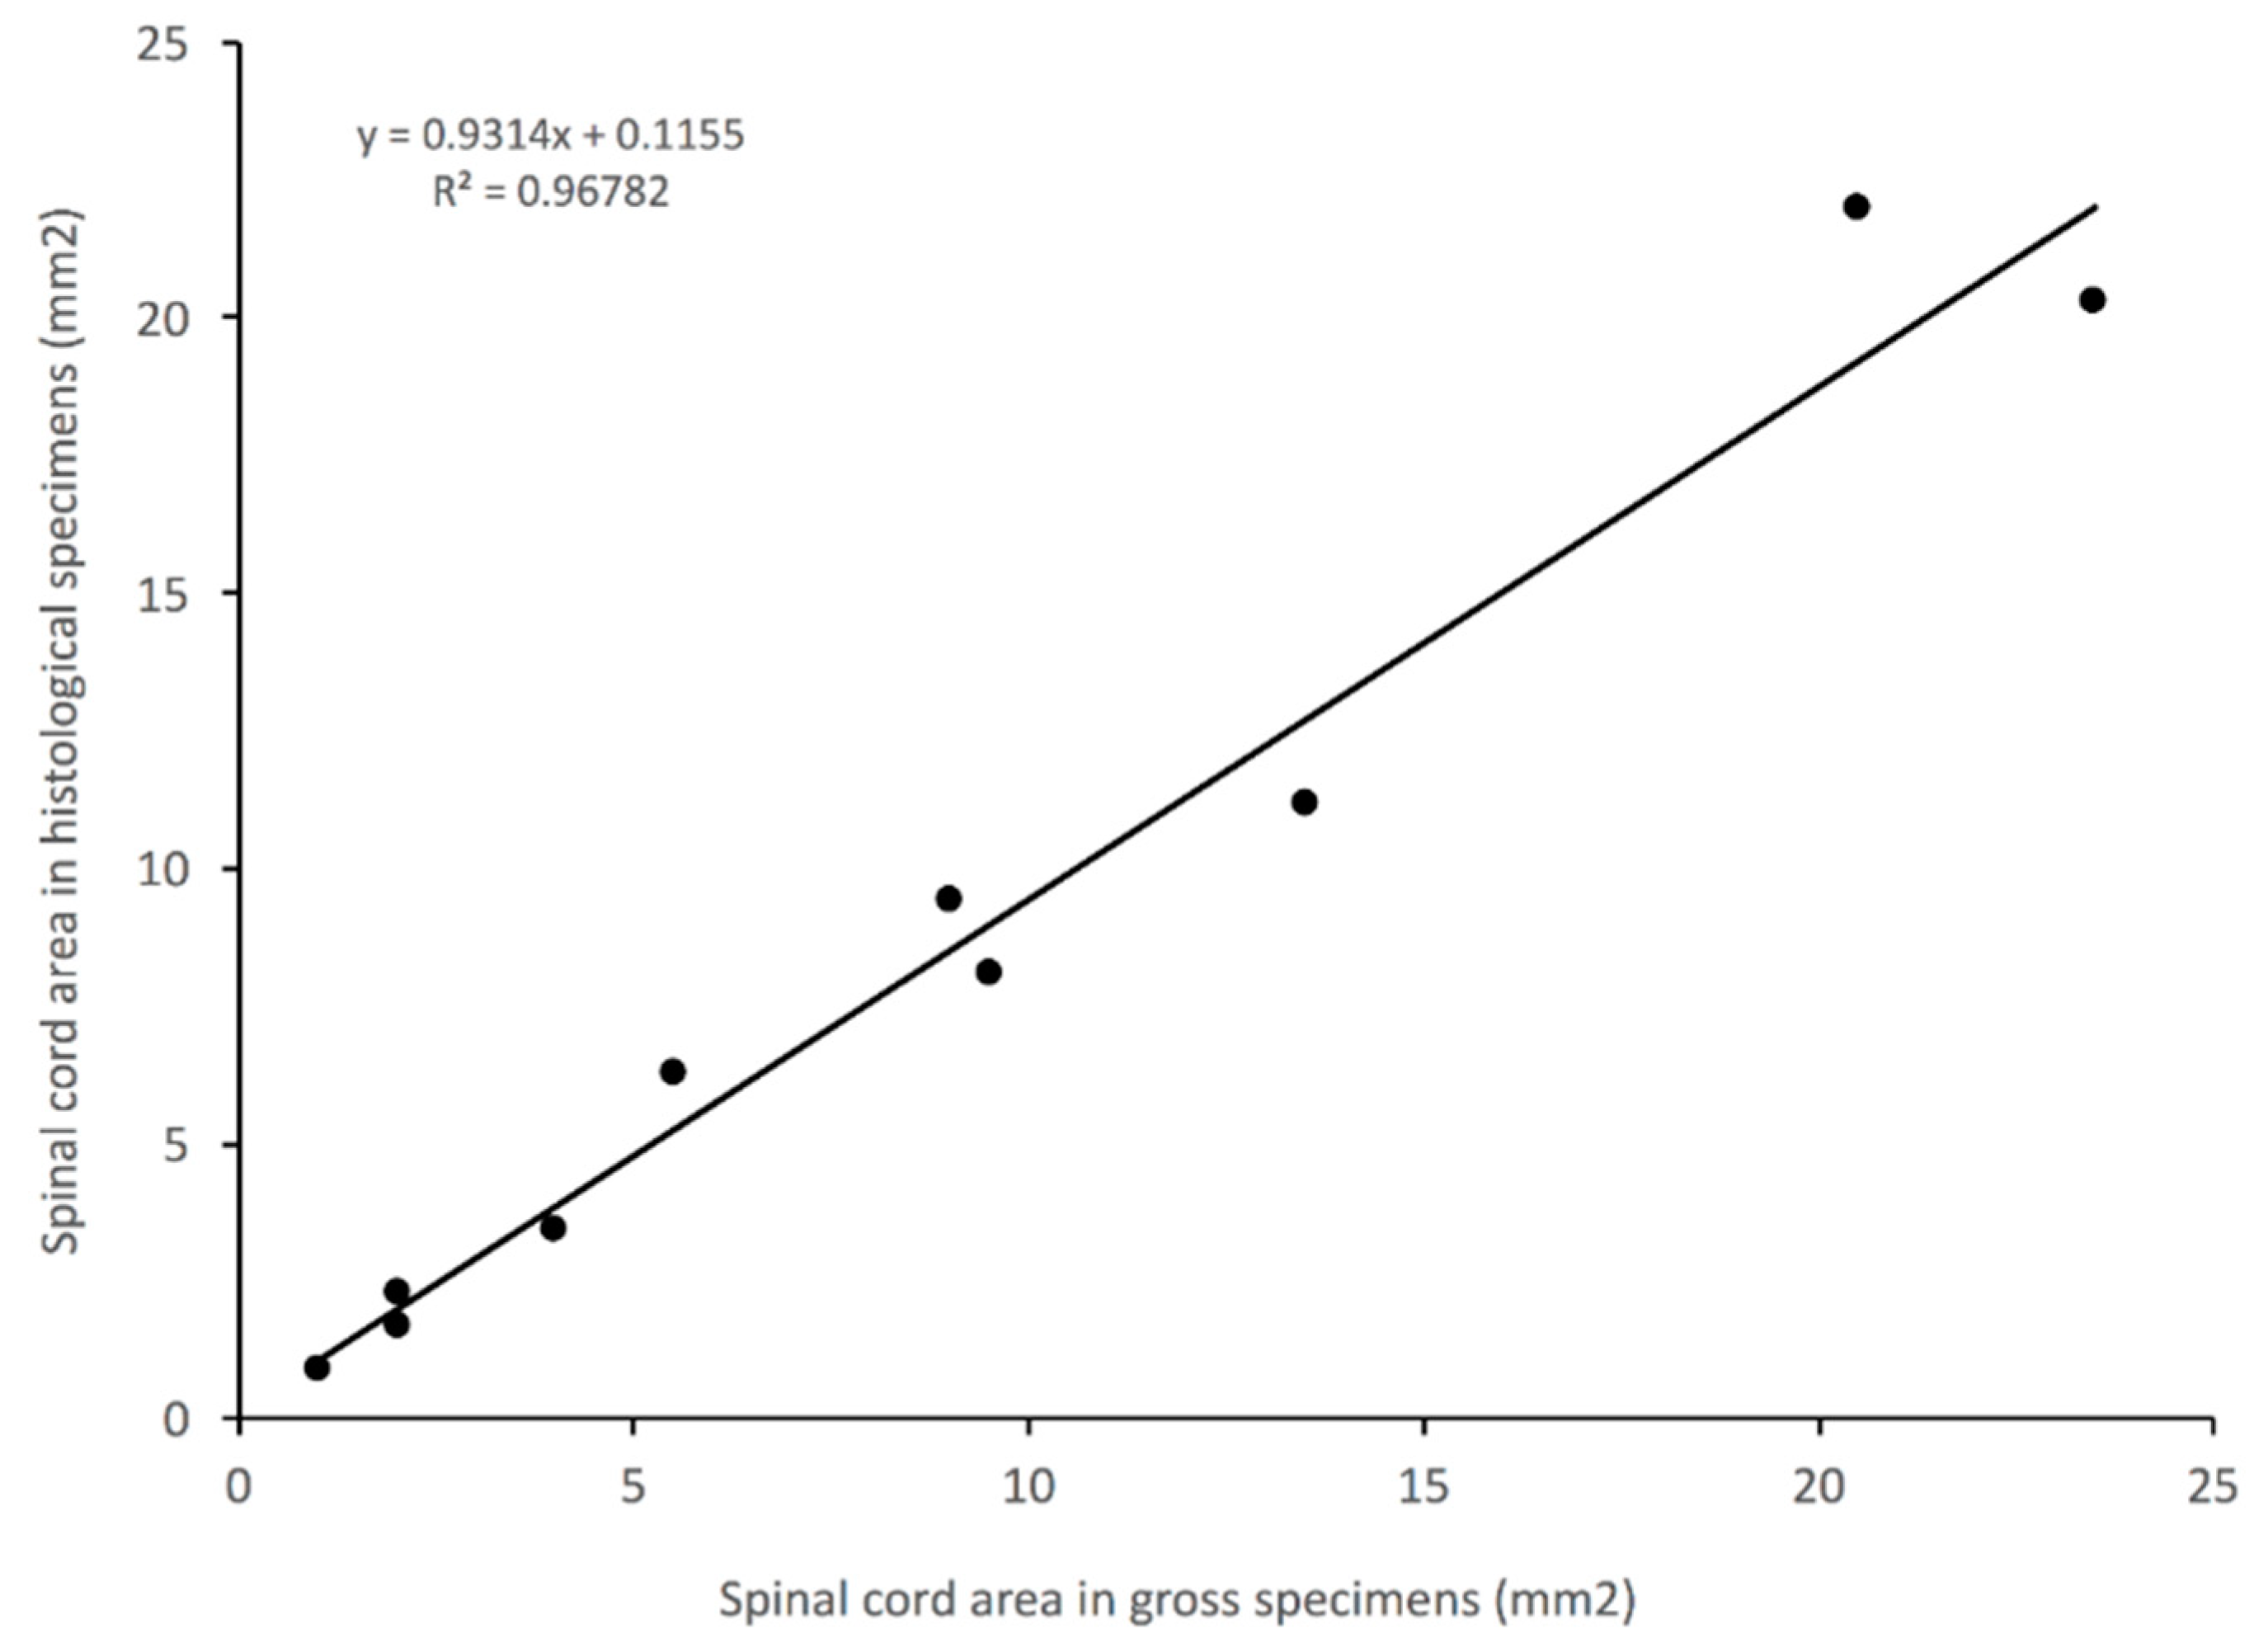
3.5. Impact of Histological Methodology
4. Discussion
5. Conclusions
Supplementary Materials
Author Contributions
Funding
Institutional Review Board Statement
Informed Consent Statement
Data Availability Statement
Acknowledgments
Conflicts of Interest
References
- Brodbelt, A.; Stoodley, M. CSF pathways: A review. Brit. J. Neurosurg. 2007, 21, 510–520. [Google Scholar] [CrossRef] [PubMed]
- de Leval, M.R.; Dubini, G.; Migliavacca, F.; Jalali, H.; Camporini, G.; Redington, A.; Pietrabissa, R. Use of computational fluid dynamics in the design of surgical procedures: Application to the study of competitive flows in cavopulmonary connections. J. Thorac. Cardiovas. Surg. 1996, 111, 502–513. [Google Scholar] [CrossRef] [Green Version]
- Morris, P.D.; Narracott, A.; von Tengg-Kobligk, H.; Soto, D.A.S.; Hsiao, S.; Lungu, A.; Evans, P.; Bressloff, N.W.; Lawford, P.V.; Hose, D.R.; et al. Computational fluid dynamics modelling in cardiovascular medicine. Heart 2016, 102, 18–28. [Google Scholar] [CrossRef] [PubMed] [Green Version]
- Kurtcuoglu, V.; Jain, K.; Martin, B.A. Modelling of Cerebrospinal Fluid Flow by Computational Fluid Dynamics. In Biomechanics of the Brain; Miller, K., Ed.; Springer Nature: Berlin/Heidelberg, Germany, 2019; pp. 215–241. [Google Scholar]
- Yiallourou, T.I.; Kröger, J.R.; Stergiopulos, N.; Maintz, D.; Martin, B.A.; Bunck, A.C. Comparison of 4D phase-contrast MRI flow measurements to computational fluid dynamics simulations of cerebrospinal fluid motion in the cervical spine. PLoS ONE 2012, 7, e52284. [Google Scholar] [CrossRef]
- Hentschel, S.; Mardal, K.-A.; Lovgren, A.E.; Linge, S.; Haughton, V. Characterization of cyclic CSF flow in the foramen magnum and upper cervical spinal canal with MR flow imaging and computational fluid dynamics. Am. J. Neuroradiol. 2010, 31, 997–1002. [Google Scholar] [CrossRef] [Green Version]
- Linge, S.O.; Mardal, K.A.; Helgeland, A.; Heiss, J.D.; Haughton, V. Effect of craniovertebral decompression on CSF dynamics in Chiari malformation type I studied with computational fluid dynamics: Laboratory investigation. J. Neurosurg. Spine 2014, 21, 559–564. [Google Scholar] [CrossRef] [PubMed] [Green Version]
- Vinje, V.; Brucker, J.; Rognes, M.E.; Mardal, K.A.; Haughton, V. Fluid dynamics in syringomyelia cavities: Effects of heart rate, CSF velocity, CSF velocity waveform and craniovertebral decompression. Neurorad. J. 2018, 5, 482–489. [Google Scholar] [CrossRef] [Green Version]
- Dreha-Kulaczewski, S.; Joseph, A.; Merboldt, K.-D.; Ludwig, H.-C.; Gartner, J.; Frahm, J. Inspiration is the major regulator of human CSF flow. J. Neurosci. 2015, 35, 248591. [Google Scholar] [CrossRef] [PubMed]
- Vinje, V.; Ringstad, G.; Lindstrom, E.; Valnes, L.; Rognes, M.; Eide, P.; Mardal, K.-A. Respiratory influence on cerebrospinal fluid flow—A computational study based on long-term intracranial pressure measurements. Sci. Rep. 2019, 9, 9732. [Google Scholar] [CrossRef]
- Bloomfield, G.; Ridlings, P.; Blocher, C.; Marmarou, A.; Sugerman, H. A proposed relationship between increased intra-abdominal, intrathoracic, and intracranial pressure. Crit. Care Med. 1997, 25, 496–503. [Google Scholar] [CrossRef] [PubMed]
- Ben-Haim, M.; Mandeli, J.; Friedman, R.; Rosenthal, R. Mechanisms of systemic hypertension during acute elevation of intraabdominal pressure. J. Surg. Res. 2000, 91, 101–105. [Google Scholar] [CrossRef]
- Guerci, A.; Shi, A.; Levin, H.; Tsitlik, J.; Weisfeldt, M.; Chandra, N. Transmission of intrathoracic pressure to the intracranial space during cardiopulmonary resuscitation in dogs. Circ. Res. 1985, 56, 20–30. [Google Scholar] [CrossRef] [PubMed] [Green Version]
- Young, B.A.; Greer, S.; Cramberg, M. Slithering CSF: Cerebrospinal fluid dynamics in the stationary and moving viper boa, Candoia aspera. Biology 2021, 10, 672. [Google Scholar] [CrossRef] [PubMed]
- Oreskovic, D.; Klarica, M. The formation of cerebrospinal fluid: Nearly a hundred years of interpretations and misinterpretations. Brain Res. Rev. 2010, 64, 241–262. [Google Scholar] [CrossRef] [Green Version]
- Miyajima, M.; Arai, H. Evaluation of the production and absorption of cerebrospinal fluid. Neurol. Med.-Chir. 2015, 55, 647–656. [Google Scholar] [CrossRef] [PubMed] [Green Version]
- Jagla, G.; Walocha, J.; Rajda, K.; Dobrogowski, J.; Wordliczek, J. Anatomical aspects of epidural and spinal analgesia. Adv. Palliat. Med. 2009, 8, 135–146. [Google Scholar]
- Pollay, M. The function and structure of the cerebrospinal fluid outflow system. Cereb. Fluid Res. 2010, 7, 9. Available online: http://www.cerebrospinalfluidresearch.com/content/7/1/9 (accessed on 1 February 2022). [CrossRef] [PubMed] [Green Version]
- Behrens, A.; Lenfeldt, N.; Qvarlander, S.; Koskinen, L.-O.; Malm, J.; Eklund, A. Are intracranial pressure wave amplitudes measurable through lumbar puncture? Acta Neurol. Scand. 2013, 127, 233–241. [Google Scholar] [CrossRef] [PubMed]
- Squair, J.W.; Belanger, L.M.; Tsang, A.; Ritchie, L.; Mac-Thiong, J.-M.; Parent, S.; Christie, S.; Bailey, C.; Dhall, S.; Street, J.; et al. Spinal cord perfusion pressure predicts neurologic recovery in acute spinal cord injury. Neurology 2017, 2017, 1660–1667. [Google Scholar] [CrossRef] [PubMed]
- Kahlon, B.; Sundbärg, G.; Rehncrona, S. Comparison between the lumbar infusion and CSF tap tests to predict outcome after shunt surgery in suspected normal pressure hydrocephalus. J. Neurol. Neurosurg. Psychiatry 2002, 73, 721–726. [Google Scholar] [CrossRef] [PubMed]
- Sullivan, J.T.; Grouper, S.; Walker, M.T.; Parrish, T.B.; McCarthy, R.J.; Wong, C.A. Lumbosacral cerebrospinal fluid volume in humans using three-dimensional magnetic resonance imaging. Anesth. Analg. 2006, 103, 1306–1310. [Google Scholar] [CrossRef] [PubMed]
- Bert, R.J.; Settipalle, N.; Tiwana, E.; Muddasani, D.; Nath, R.; Wellman, B.; Mihlon, F.; Negahdar, M.; Amini, A.; Boakye, M. The relationships among spinal CSF flows, spinal cord geometry, and vascular correlations: Evidence of intrathecal sources and sinks. Am. J. Physiol. 2019, 317, R470–R484. [Google Scholar] [CrossRef] [PubMed]
- Nieuwenhuys, R.; Ten Donkelaar, H.; Nicholson, C. The meaning of it all. In The Central Nervous System of Vertebrates; Nieuwenhuys, H., Ten Donkelaar, H., Nicholson, C., Eds.; Springer: Berlin, Germany, 1998; pp. 2135–2196. [Google Scholar]
- Khan, Z.; Munro, E.; Shaw, D.; Faller, K.M.E. Variation in the position of the conus medullaris and dural sac in adult dogs. Vet. Record 2019, 185, 20. [Google Scholar] [CrossRef] [PubMed]
- Brainerd, E. New perspectives on the evolution of lung ventilation mechanisms in vertebrates. Exp. Biol. Online 1999, 4, 1–28. [Google Scholar] [CrossRef]
- Duncker, H.-R. Vertebrate lungs: Structure, topography and mechanics: A comparative perspective of the progressive integration of respiratory system, locomotor apparatus and ontogenetic development. Resp. Physiol. Neurobiol. 2004, 144, 111–124. [Google Scholar] [CrossRef]
- Giffin, E. Gross spinal anatomy and limb use in living and fossil reptiles. Paleobiology 1990, 16, 448–458. [Google Scholar] [CrossRef]
- Dodson, P. Functional and ecological significance of relative growth in Alligator. J. Zool. 1975, 175, 315–355. [Google Scholar] [CrossRef]
- Webb, G.J.W.; Messel, H. Morphometric analysis of Crocodylus porosus from the north coast of Arnhem Land, northern Australia. Austral. J. Zool. 1978, 26, 1–27. [Google Scholar] [CrossRef] [Green Version]
- Edwards, G.P.; Webb, G.J.; Manolis, S.C.; Mazanov, A. Morphometric analysis of the Australian freshwater crocodile (Crocodylus johnstoni). Austral. J. Zool. 2017, 65, 97–111. [Google Scholar] [CrossRef]
- Holsheimer, J.; den Boer, J.A.; Struijk, J.J.; Rozeboon, A.R. MR assessment of the normal position of the spinal cord in the spinal canal. Am. J. Neuroradiol. 1994, 15, 951–959. [Google Scholar] [PubMed]
- Ko, H.-Y.; Park, J.H.; Shin, Y.B.; Baek, S.Y. Gross quantitative measurements of spinal cord segments in human. Spinal Cord 2004, 42, 35–40. [Google Scholar] [CrossRef] [PubMed] [Green Version]
- Isik, S.; Samanci, M.Y. Analysis of MRI morphometric parameters of the pediatric cervical spine and spinal cord. J. Turk. Spinal Surg. 2019, 30, 157–161. [Google Scholar]
- Platt, S.G.; Elsey, R.M.; Rainwater, T.R.; Fredenberg, M. A critical analysis of a historical size record for the American alligator. Southeast. Nat. 2018, 17, N60–N63. [Google Scholar] [CrossRef]
- Rowlands, C.E.; McLellan, W.A.; Rommel, S.A.; Costidis, A.M.; Yopak, K.E.; Koopman, H.N.; Glandon, H.L.; Pabst, D.A. Comparative morphology of the spinal cord and associated vasculature in shallow versus deep diving cetaceans. J. Morph. 2021, 282, 1415–1431. [Google Scholar] [CrossRef] [PubMed]
- Luna, L. Manual of Histological Staining Methods of the Armed Forces Institute of Pathology, 3rd ed.; McGraw Hill: New York, NY, USA, 1968. [Google Scholar]
- Rasband, W.S. ImageJ; U. S. National Institutes of Health: Bethesda, MA, USA, 1997. Available online: https://imagej.nih.gov/ij/ (accessed on 1 February 2022).
- Jones, A.S.; Milthorpe, B.K.; Howlett, C.R. Measurement of microtomy induced section distortion and its correction for 3-dimensional histological reconstructions. Cytometry 1994, 15, 95–105. [Google Scholar] [CrossRef] [PubMed]
- Pichat, J.; Iglesias, J.E.; Yousry, T.; Ourselin, S.; Modat, M. A survey of methods for 3D histology reconstruction. Med. Imag. Anal. 2018, 46, 73–105. [Google Scholar] [CrossRef] [PubMed] [Green Version]
- Ngwenya, A.; Patzke, N.; Manger, P.R.; Herculano-Houzel, S. Continued growth of the central nervous system without mandatory addition of neurons in the Nile crocodile (Crocodylus niloticus). Brain Beh. Evol. 2016, 87, 19–38. [Google Scholar] [CrossRef] [PubMed]
- Ikejiri, T. Modes of ontogenetic allometric shifts in crocodilian vertebrae. Biol. J. Linn. Soc. 2015, 116, 649–670. [Google Scholar] [CrossRef] [Green Version]
- Zippel, K.; Lillywhite, H.; Mladinich, C. Anatomy of the Crocodilian spinal vein. J. Morphol. 2003, 258, 327–335. [Google Scholar] [CrossRef]
- Liliequist, B. The anatomy of the subarachnoid cisterns. Acta Radiol. 1956, 46, 61–71. [Google Scholar] [CrossRef]
- Sakka, L. Anatomy of the spinal meninges. In Spinal Anatomy; Vital, J., Cawley, C., Eds.; Springer: New York, NY, USA, 2018; pp. 403–419. [Google Scholar]
- Stanchak, K.; French, C.; Perkel, D.; Burton, B. The balance hypothesis for the avial lumbosacral organ and an exploration of its morphological variation. Integr. Org. Biol. 2020, 2, obaa024. [Google Scholar] [CrossRef]
- Flanagan, M. The role of the craniocervical junction in craniospinal hydrodynamics and neurodegenerative conditions. Neurol. Res. Internat. 2015, 2015, 794829. [Google Scholar] [CrossRef] [PubMed] [Green Version]
- Willey, J.; Biknevicius, A.; Reilly, S.; Earls, K. The tale of the tail: Limb function and locomotor mechanics in Alligator mississippiensis. J. Exp. Biol. 2004, 207, 553–563. [Google Scholar] [CrossRef] [PubMed] [Green Version]
- Hedrick, B.; Schachner, E.; Dodson, P. Alligator appendicular architecture across an ontogenetic niche shift. Anat. Rec. 2021. [Google Scholar] [CrossRef] [PubMed]
- Seebacher, F.; Elsworth, P.; Franklin, C. Ontogenetic changes of swimming kinematics in a semi-aquatic reptile (Crocodylus porosus). Austral. J. Zool. 2003, 51, 15–24. [Google Scholar] [CrossRef]
- Wedel, M.; Atterholt, J.; Dooley, A.; Farooq, S.; Macalino, J.; Nalley, T.; Wisser, G.; Yasmer, J. Expanded neural canals in the caudal vertebrae of a specimen of Haplocanthosaurus. Acad. Lett. 2021, 911. [Google Scholar] [CrossRef]
- Kasantikul, V.; Netsky, M.; James, A. Relation of age and cerebral ventricle size to central canal in man. J. Neurosurg. 1979, 51, 85–93. [Google Scholar] [CrossRef]
- Bruni, J.; Reddy, K. Ependyma of the central canal of the rat spinal cord: A light and transmission electron microscopic study. J. Anat. 1987, 152, 55–70. [Google Scholar] [PubMed]
- Tithof, J.; Kelley, D.; Mestre, H.; Nedergaard, M.; Thomas, J. Hydraulic resistance of periarterial spaces in the brain. Fluids Barriers CNS 2019, 16, 19. [Google Scholar] [CrossRef] [PubMed] [Green Version]
- Young, B.A.; Adams, J.; Beary, J.; Mardal, K.-A.; Schneider, R.; Kondrashova, T. The myodural bridge of the American alligator (Alligator mississippiensis) alters CSF flow. J. Exp. Biol. 2020, 223, jeb230896. [Google Scholar] [CrossRef] [PubMed]


Publisher’s Note: MDPI stays neutral with regard to jurisdictional claims in published maps and institutional affiliations. |
© 2022 by the authors. Licensee MDPI, Basel, Switzerland. This article is an open access article distributed under the terms and conditions of the Creative Commons Attribution (CC BY) license (https://creativecommons.org/licenses/by/4.0/).
Share and Cite
Greer, S.; Cramberg, M.J.; Young, B.A. Morphometrics of the Spinal Cord and Surrounding Structures in Alligator mississippiensis. Biology 2022, 11, 514. https://doi.org/10.3390/biology11040514
Greer S, Cramberg MJ, Young BA. Morphometrics of the Spinal Cord and Surrounding Structures in Alligator mississippiensis. Biology. 2022; 11(4):514. https://doi.org/10.3390/biology11040514
Chicago/Turabian StyleGreer, Skye, Michael J. Cramberg, and Bruce A. Young. 2022. "Morphometrics of the Spinal Cord and Surrounding Structures in Alligator mississippiensis" Biology 11, no. 4: 514. https://doi.org/10.3390/biology11040514
APA StyleGreer, S., Cramberg, M. J., & Young, B. A. (2022). Morphometrics of the Spinal Cord and Surrounding Structures in Alligator mississippiensis. Biology, 11(4), 514. https://doi.org/10.3390/biology11040514