


Heavy Metals in Four Marine Fish and Shrimp Species from a Subtropical Coastal Area: Accumulation and Consumer Health Risk Assessment

 , , , ,

Abstract
Simple Summary
Abstract
1. Introduction
2. Materials and Methods
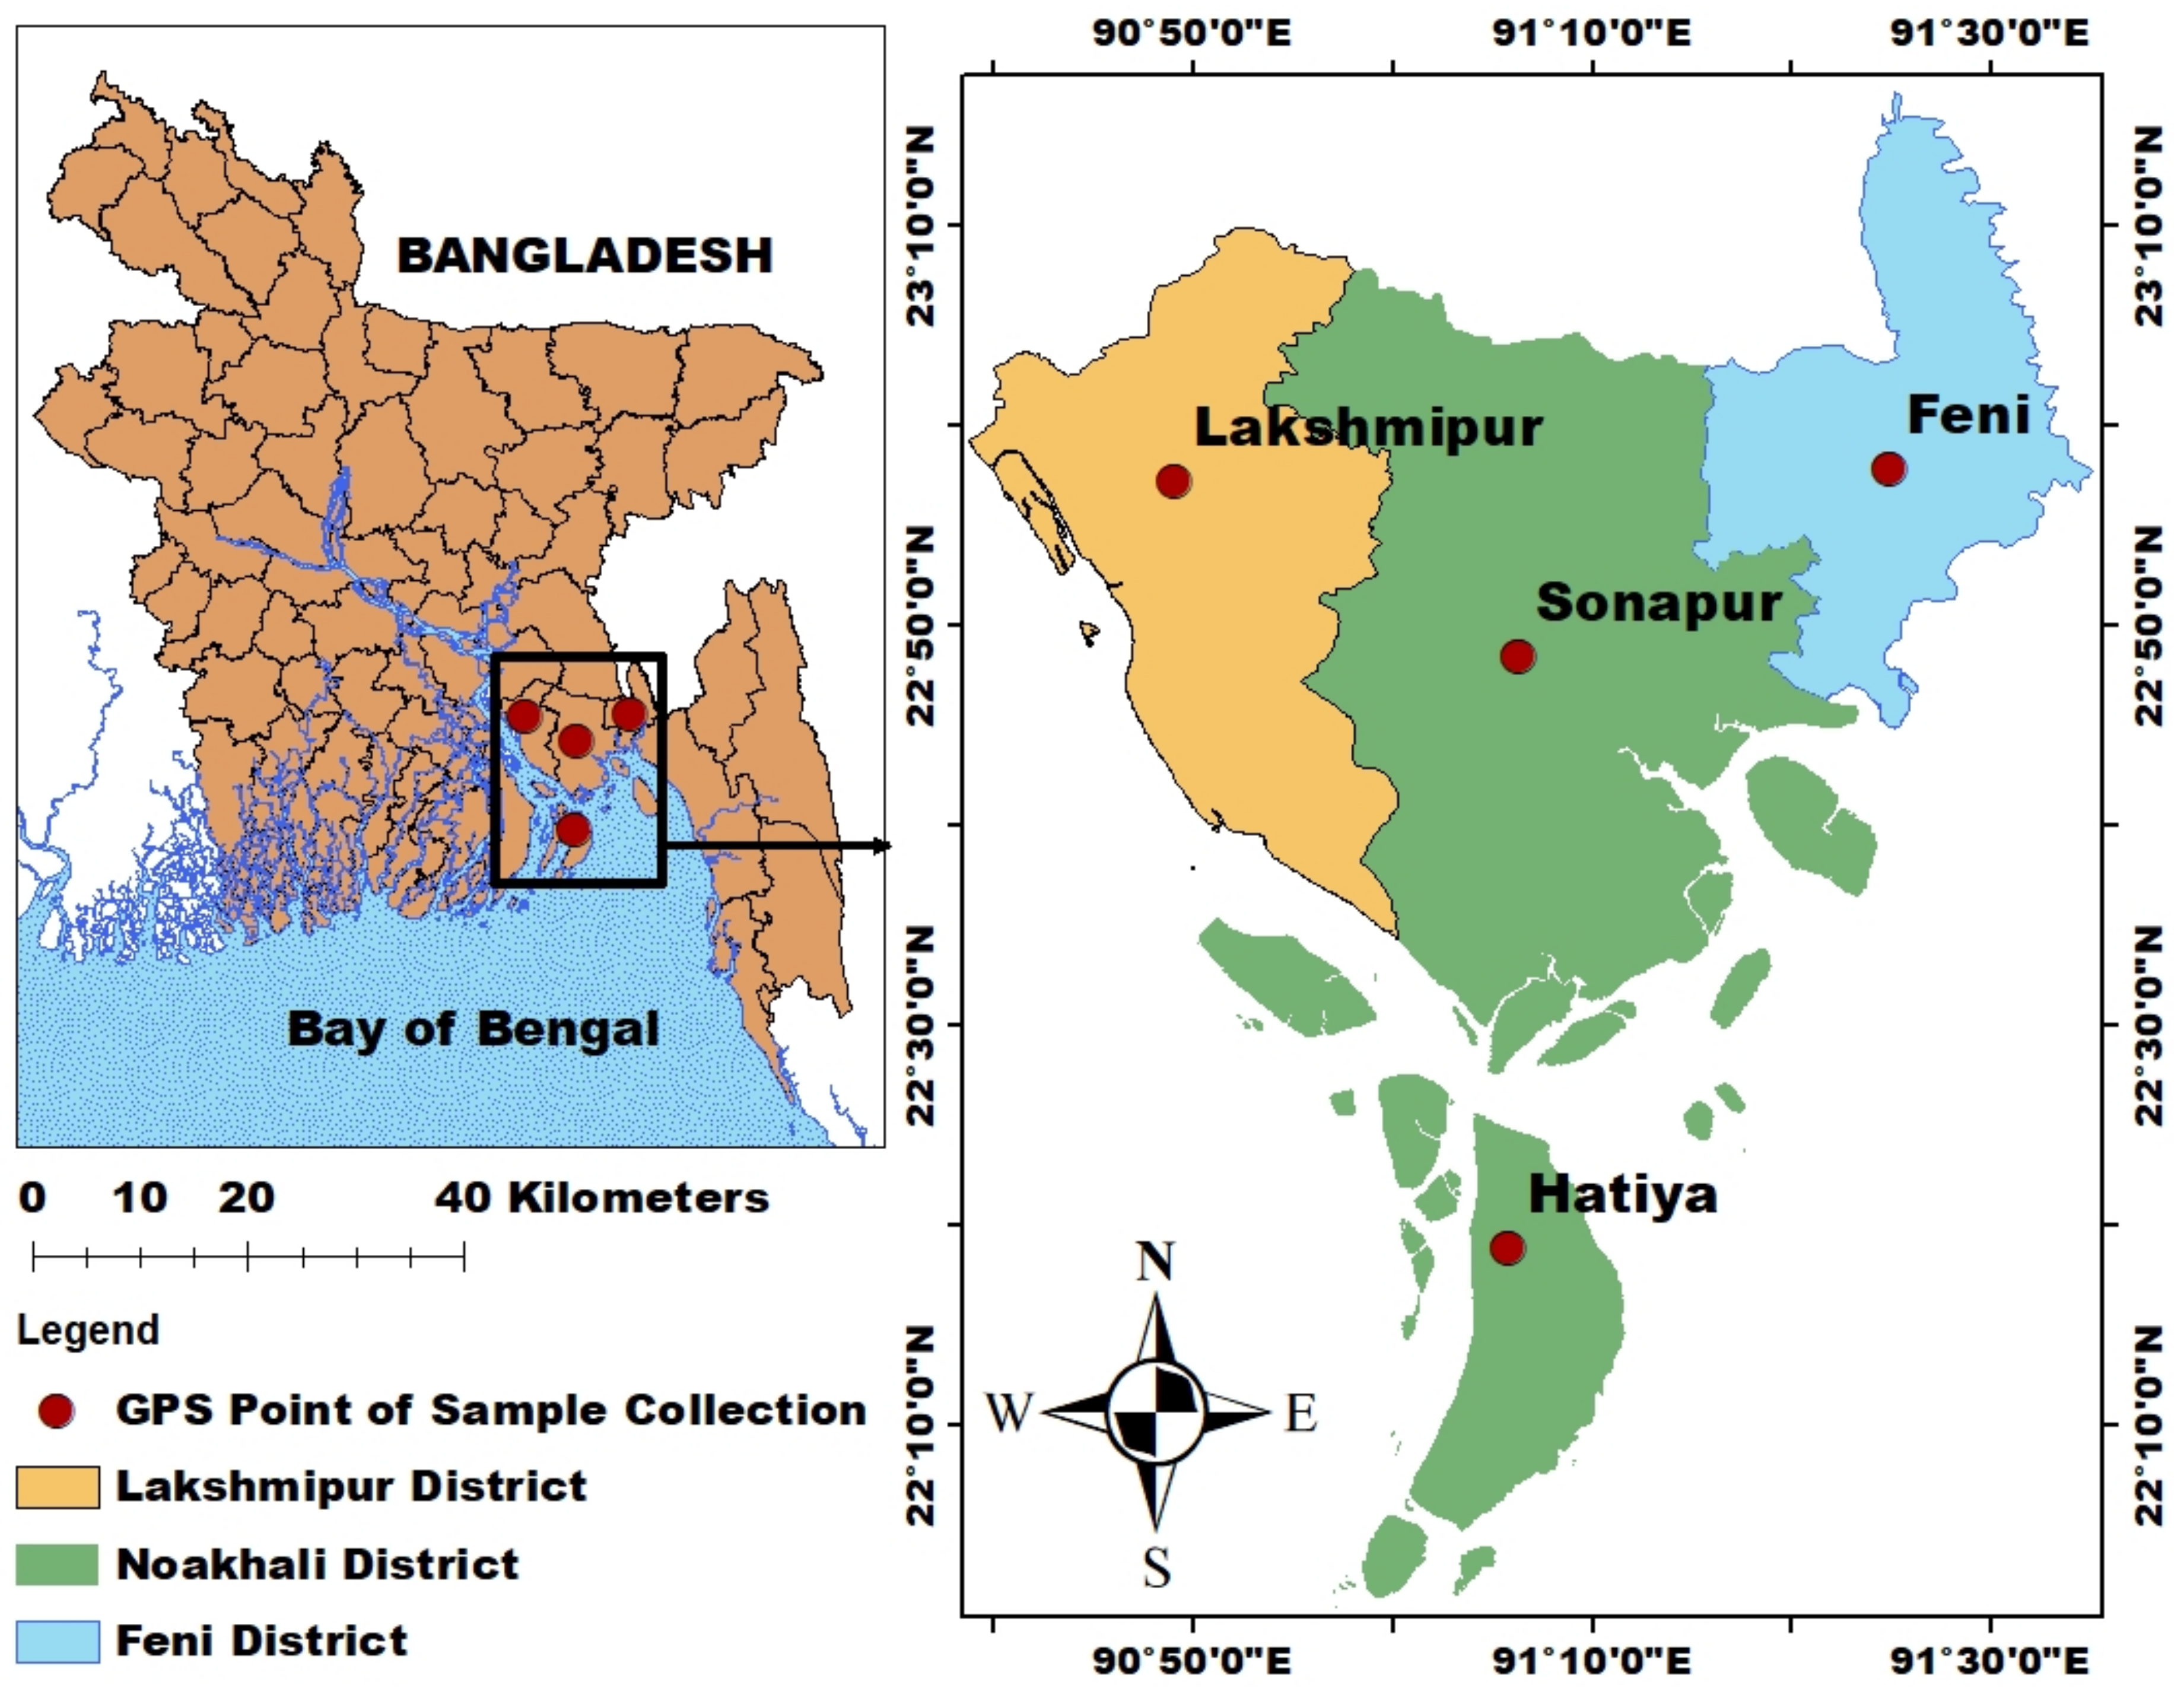
2.1. Study Area
2.2. Sample Collection
2.3. Reagents
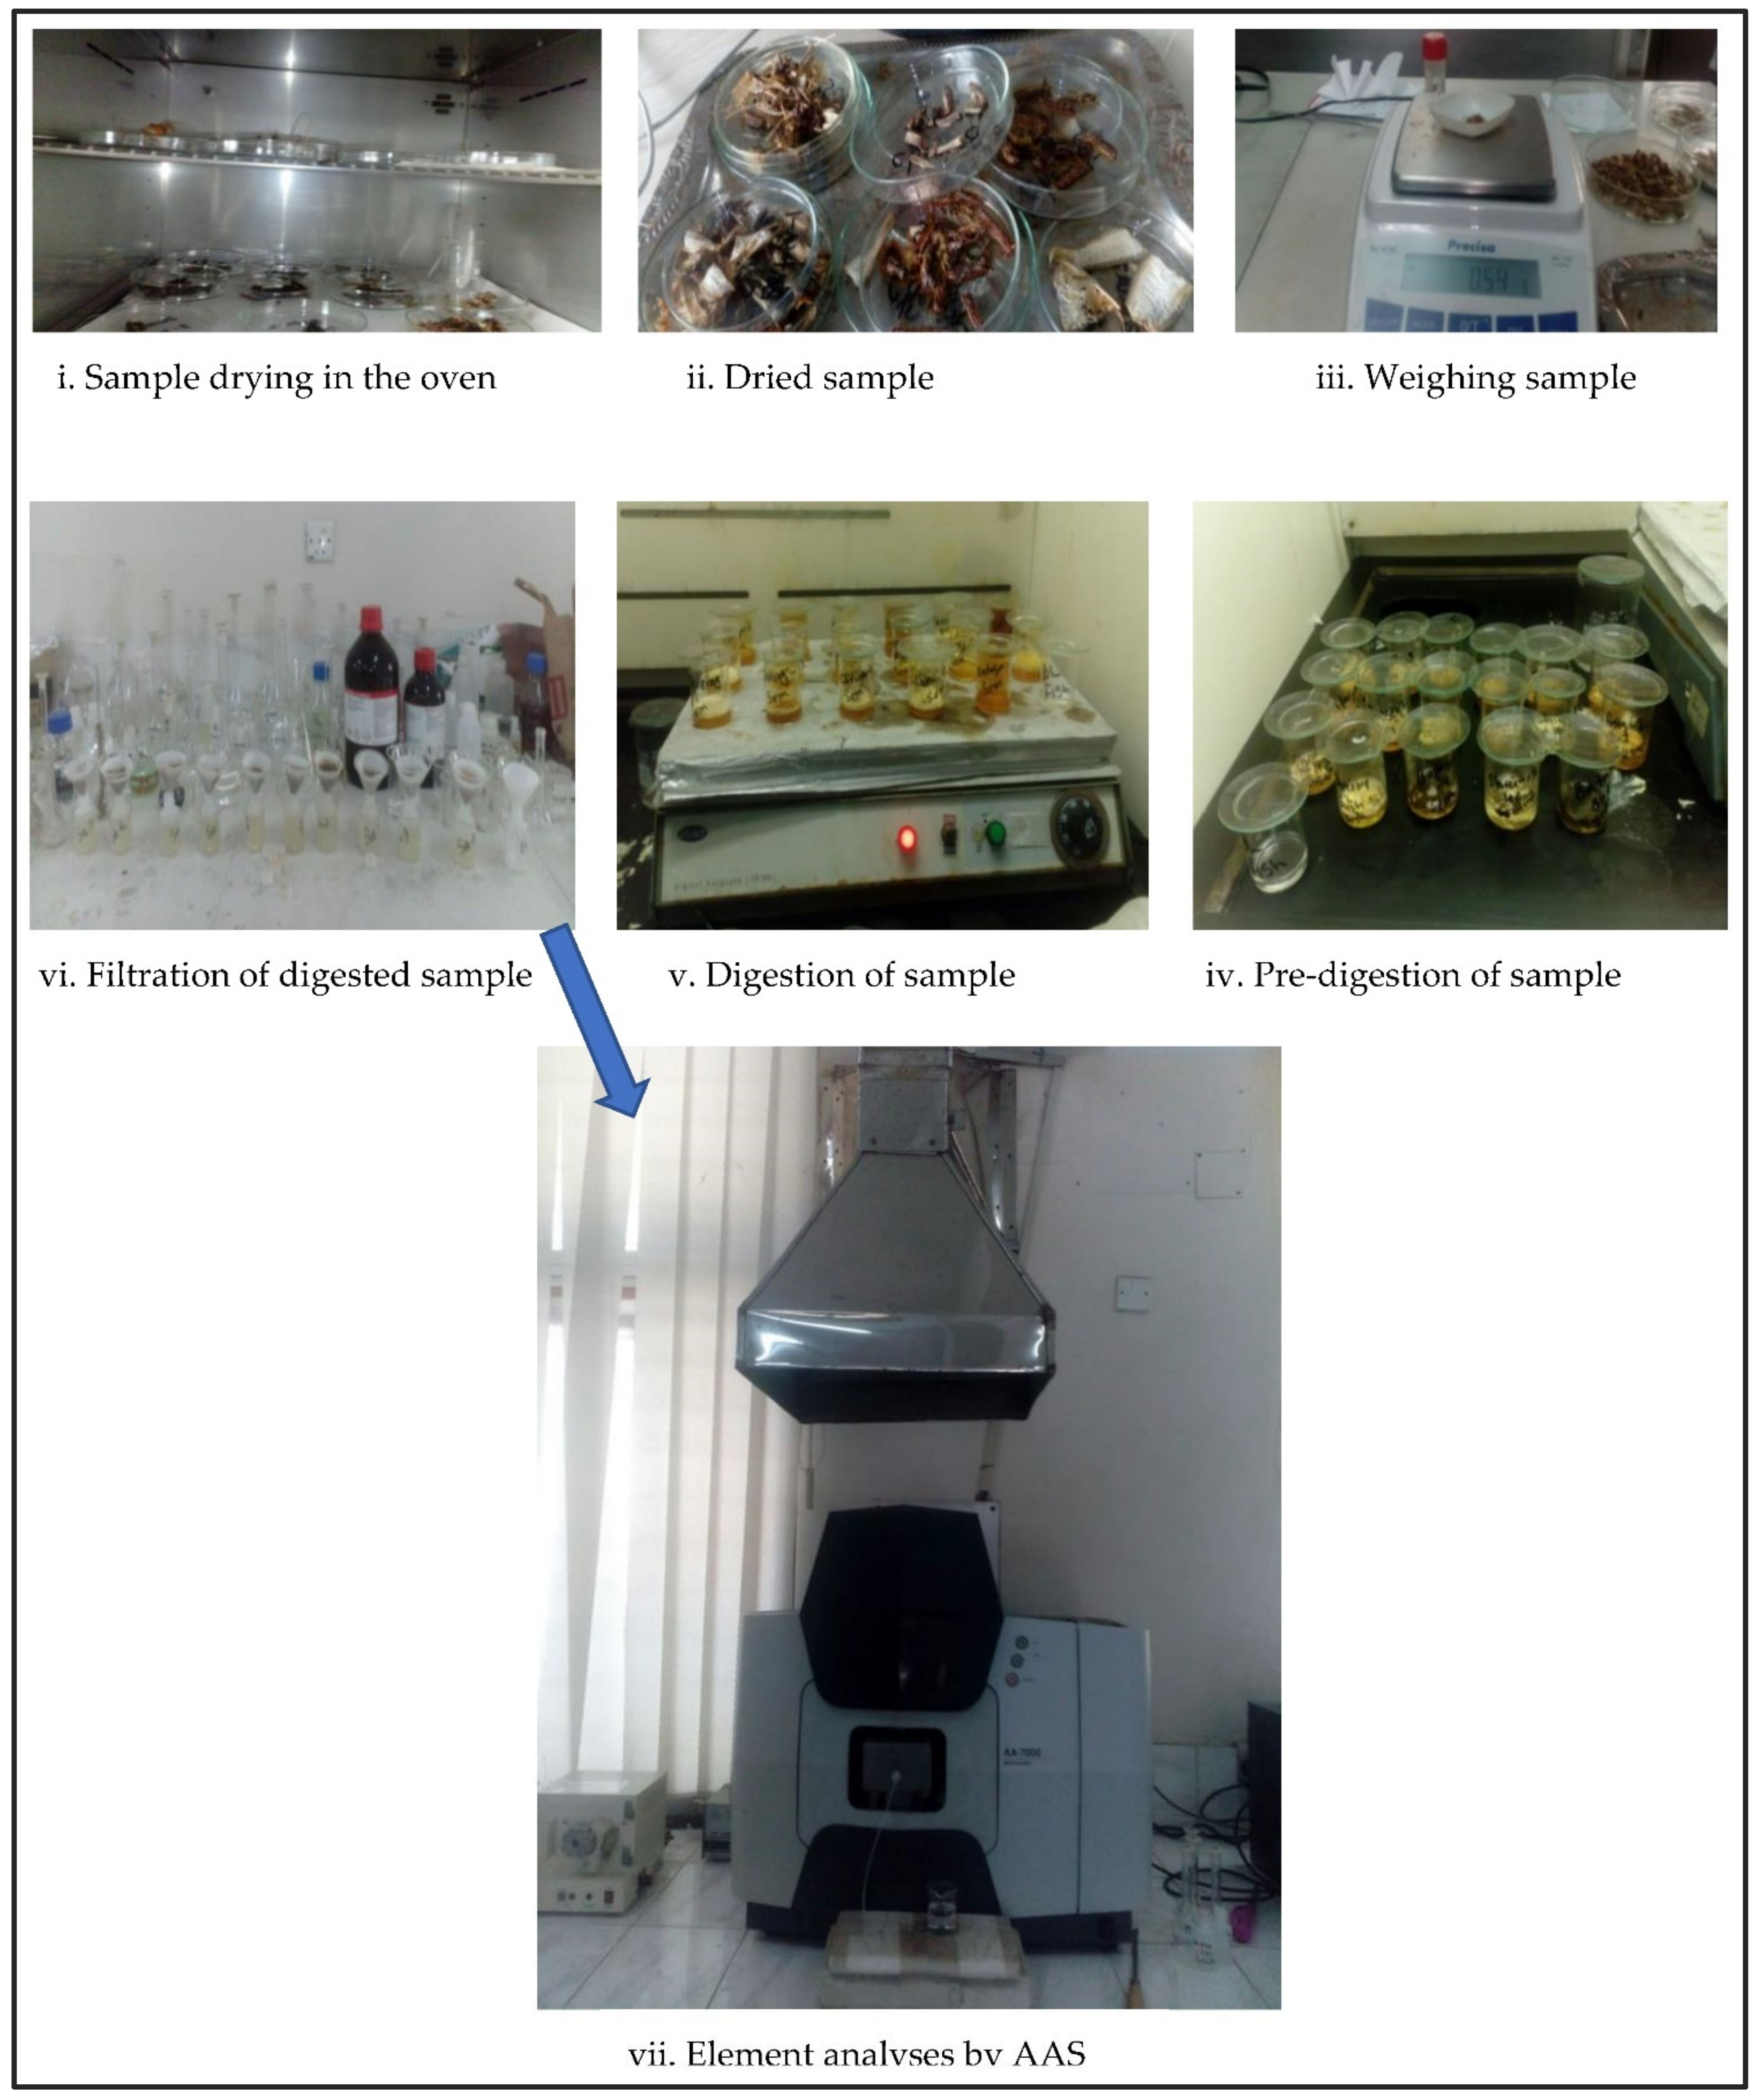
2.4. Sample Preparation, Digestion, and Metal Extraction
2.5. Quality Control
2.6. Health Risk Assessment of Fish and Shrimp
2.6.1. Estimated Daily Intake Assessment
2.6.2. Non-Carcinogenic Risk Assessment: Target Hazard Quotient
2.7. Statistical Analysis
3. Results and Discussion
3.1. Heavy-Metal Concentration in Fish and Shrimp
3.2. Health Risk to Fish and Shrimp Consumers
3.2.1. Estimated Daily Intake (EDI)
3.2.2. Target Hazard Quotient (THQ) and Hazard Index (HI) Value of Fish and Shrimp
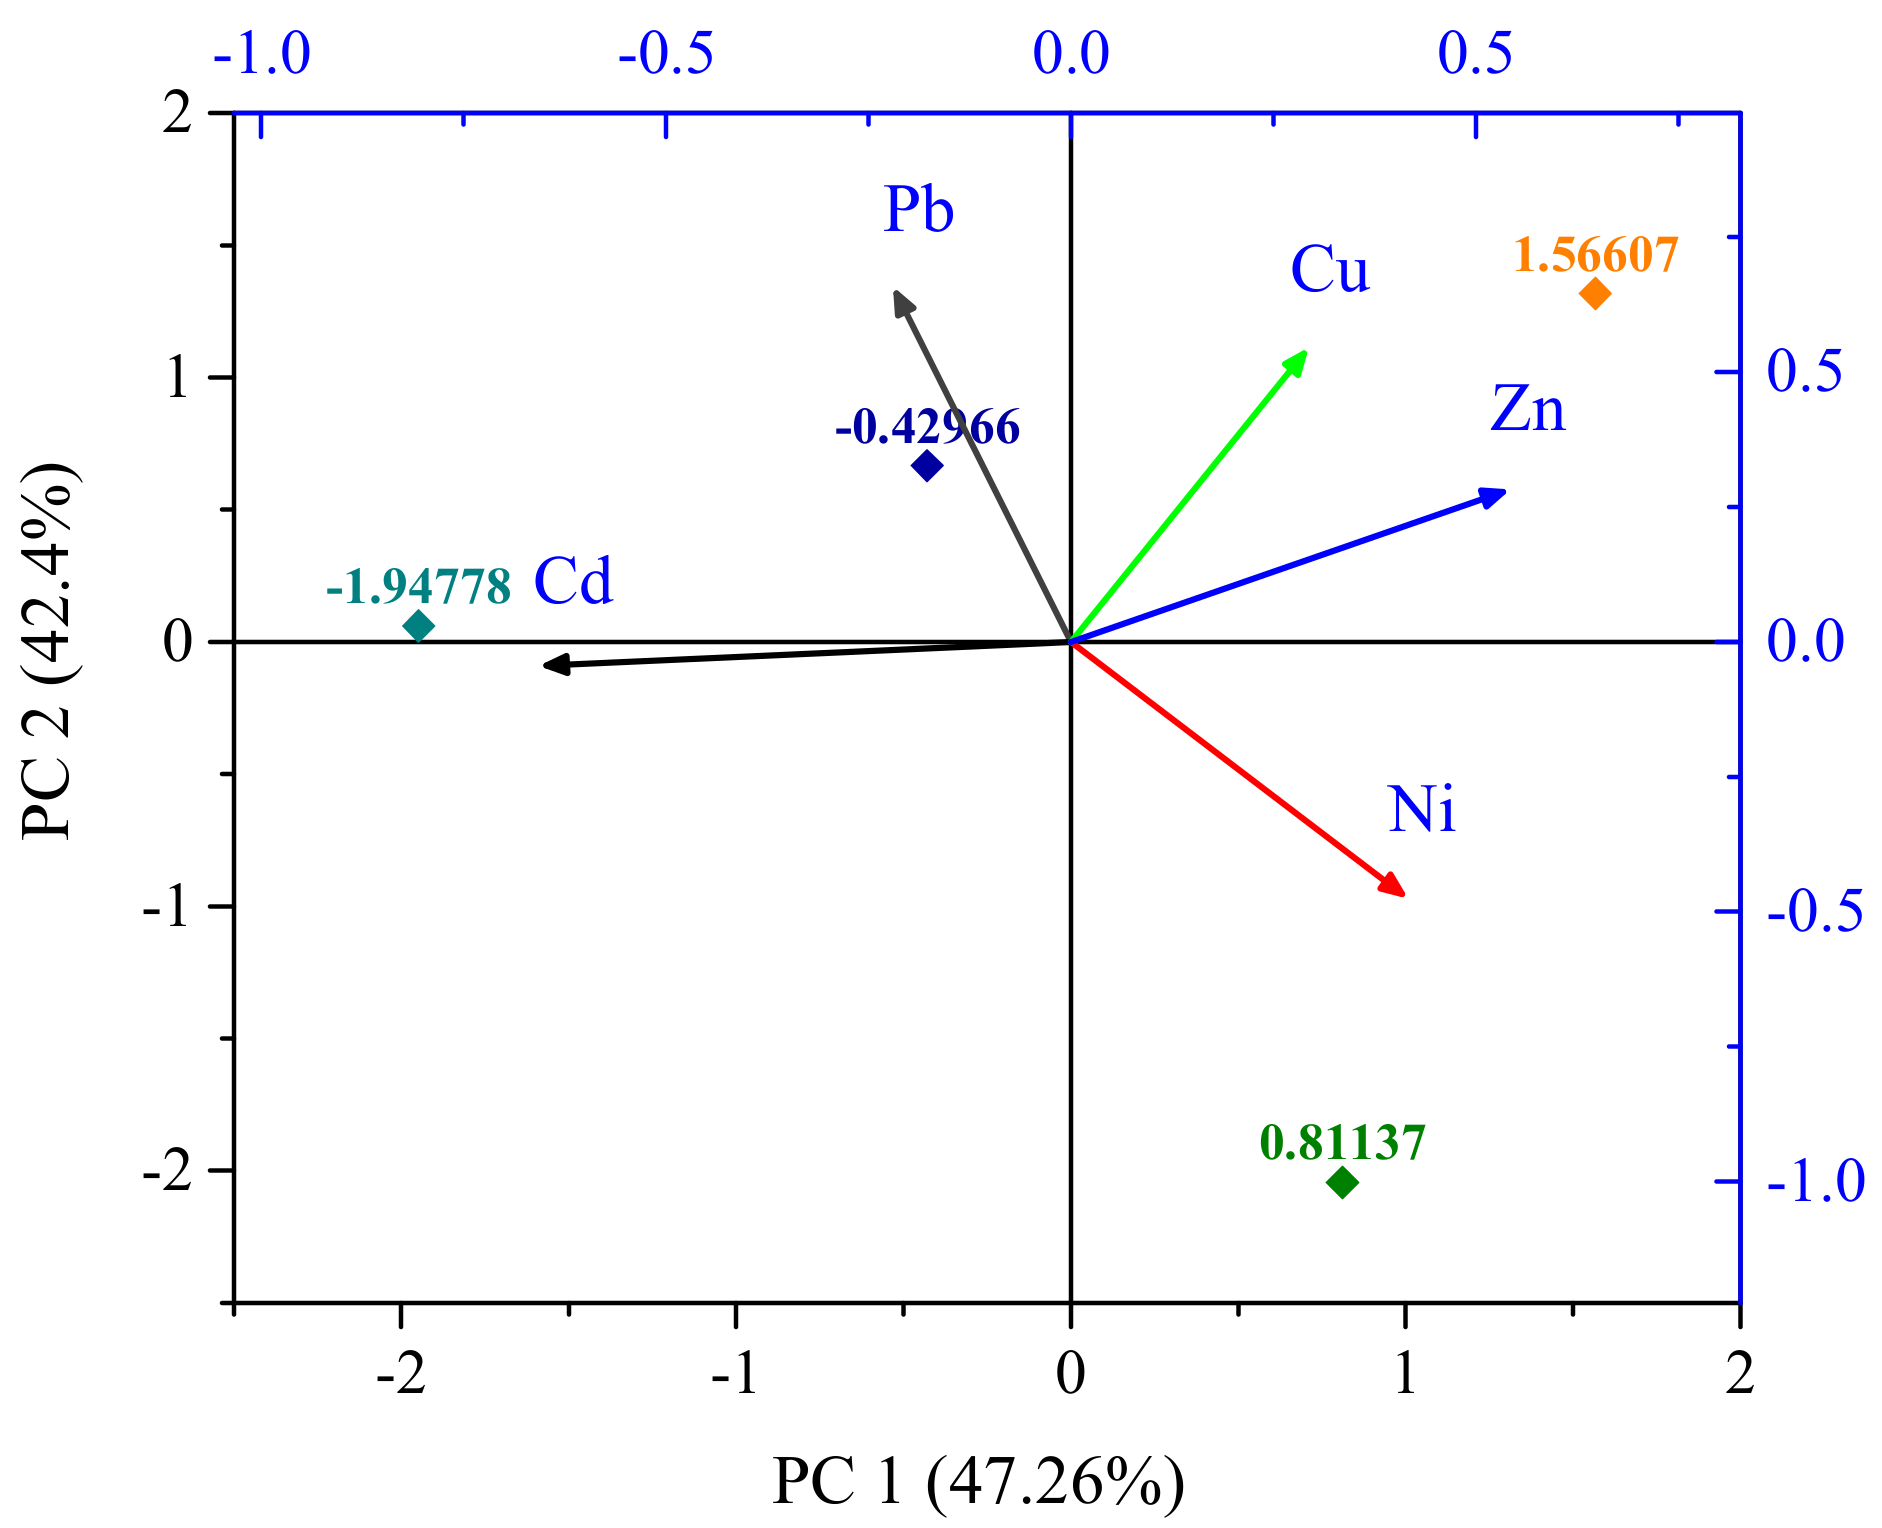
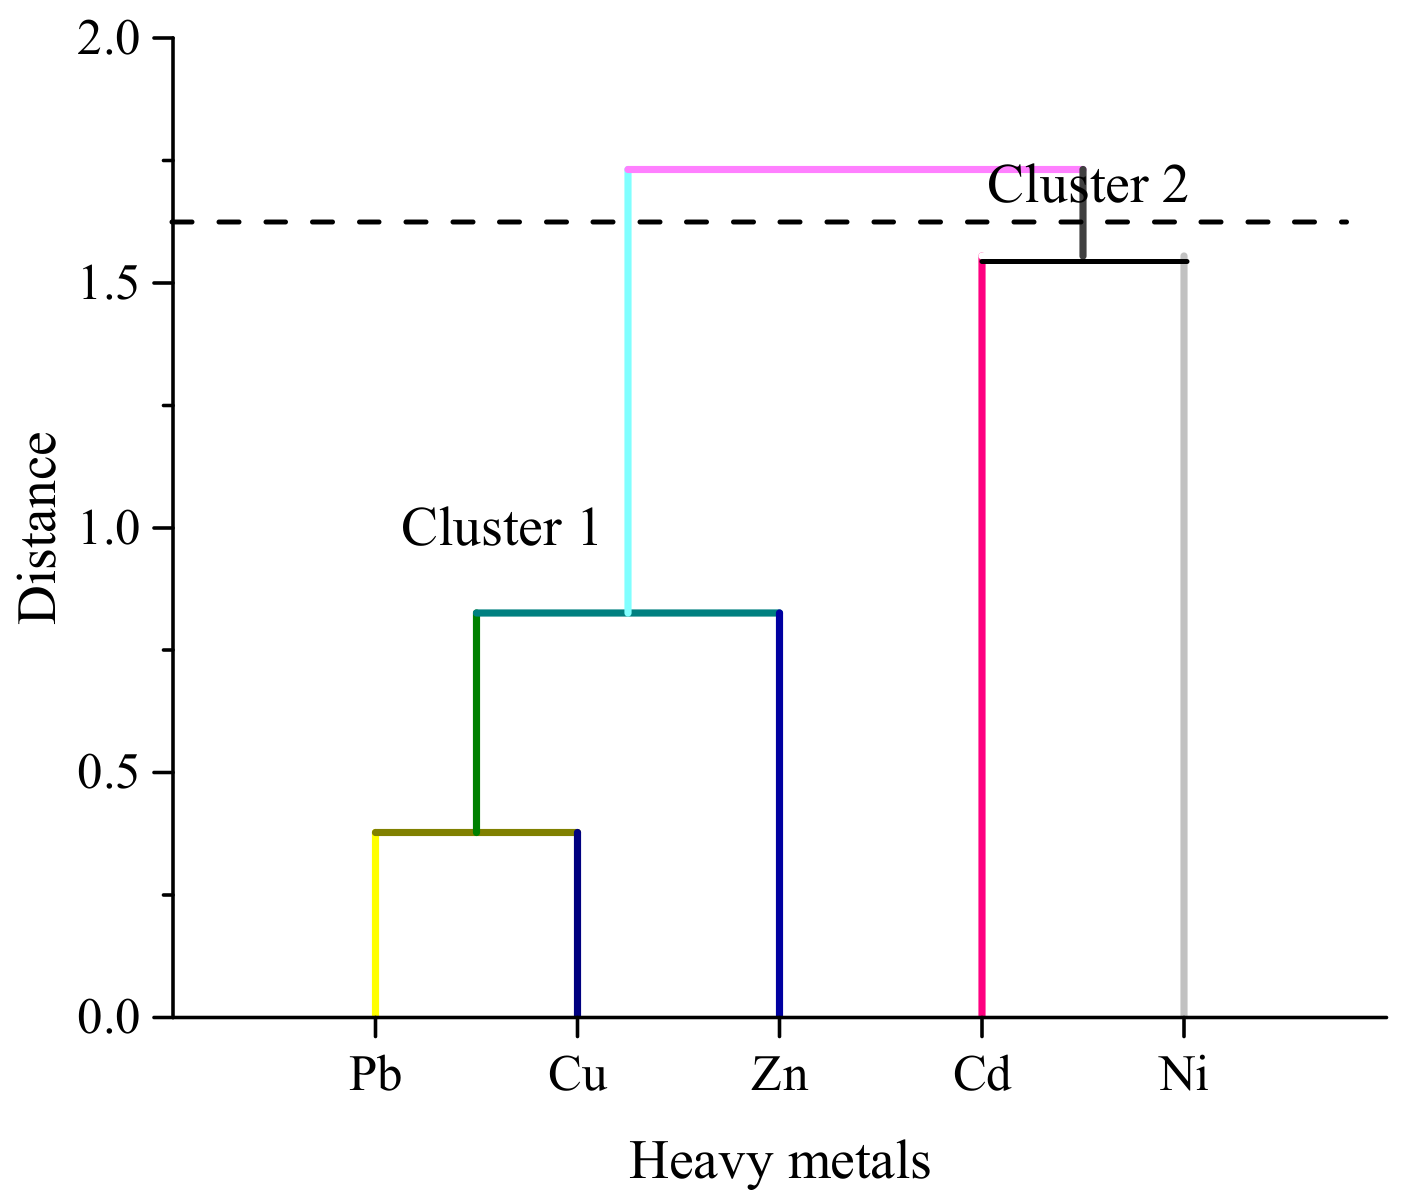
3.3. Source Identification
4. Conclusions
Supplementary Materials
Author Contributions
Funding
Institutional Review Board Statement
Informed Consent Statement
Data Availability Statement
Acknowledgments
Conflicts of Interest
References
- Sultana, S.; Hossain, M.B.; Choudhury, T.R.; Yu, J.; Rana, M.S.; Noman, M.A.; Hosen, M.M.; Paray, B.A.; Arai, T. Ecological and Human Health Risk Assessment of Heavy Metals in Cultured Shrimp and Aquaculture Sludge. Toxics 2022, 10, 175. [Google Scholar] [CrossRef] [PubMed]
- Pragnya, M.; Ajay, B.; Kumar, S.D.; Reddy, T.B. Bioaccumulation of heavy metals in different trophic levels of aquatic ecosystems with fish as a bioindicator in Visakhapatnam, India. Mar. Pollut. Bull. 2021, 165, 112162. [Google Scholar] [CrossRef] [PubMed]
- Rehman, A.U.; Nazir, S.; Irshad, R.; Tahir, K.; Ur Rehman, K.; Islam, R.U.; Wahab, Z. Toxicity of heavy metals in plants and animals and their uptake by magnetic iron oxide nanoparticles. J. Mol. Liq. 2021, 321, 114455. [Google Scholar] [CrossRef]
- Ahmed, A.S.S.; Hossain, M.B.; Semme, S.A.; Babu, S.M.O.F.; Hossain, K.; Moniruzzaman, M. Accumulation of trace elements in selected fish and shellfish species from the largest natural carp fish breeding basin in Asia: A probabilistic human health risk implication. Environ. Sci. Poll. Res. 2020, 27, 37852–37865. [Google Scholar] [CrossRef] [PubMed]
- Baki, M.A.; Hossain, M.M.; Akter, J.; Quraishi, S.B.; Shojib, M.F.H.; Ullah, A.A.; Khan, M.F. Concentration of heavy metals in seafood (fishes, shrimp, lobster and crabs) and human health assessment in Saint Martin Island, Bangladesh. Ecotoxicol. Environ. Saf. 2018, 159, 153–163. [Google Scholar] [CrossRef]
- Hasan, M.; Shahriar, A.; Hossain, N.; Shovon, I.K.; Hossain, A.; Jolly, Y.N.; Begum, B.A. Trace metals contamination in riverine captured fish and prawn of Bangladesh and associated health risk. Expo. Health 2021, 13, 237–251. [Google Scholar] [CrossRef]
- Nesto, N.; Romano, S.; Moschino, V.; Mauri, M.; Da Ros, L. Bioaccumulation and biomarker responses of trace metals and micro-organic pollutants in mussels and fish from the Lagoon of Venice, Italy. Mar. Pollut. Bull. 2007, 55, 469–484. [Google Scholar] [CrossRef]
- Zhu, G.; Noman, M.A.; Narale, D.D.; Feng, W.; Pujari, L.; Sun, J. Evaluation of ecosystem health and potential human health hazards in the Hangzhou Bay and Qiantang Estuary region through multiple assessment approaches. Environ. Pollut. 2020, 264, 114791. [Google Scholar] [CrossRef]
- Saha, N.; Mollah, M.; Alam, M.; Rahman, M.S. Seasonal investigation of heavy metals in marine fishes captured from the Bay of Bengal and the implications for human health risk assessment. Food Control 2016, 70, 110–118. [Google Scholar] [CrossRef]
- Ahmed, M.K.; Baki, M.A.; Islam, M.S.; Kundu, G.K.; Habibullah-Al-Mamun, M.; Sarkar, S.K.; Hossain, M.M. Human health risk assessment of heavy metals in tropical fish and shellfish collected from the river Buriganga, Bangladesh. Environ. Sci. Pollut. Res. 2015, 22, 15880–15890. [Google Scholar] [CrossRef]
- Varol, M.; Sünbül, M.R. Organochlorine pesticide, antibiotic and heavy metal residues in mussel, crayfish and fish species from a reservoir on the Euphrates River, Turkey. Environ. Pollut. 2017, 230, 311–319. [Google Scholar] [CrossRef]
- Tahity, T.; Islam, M.R.U.; Bhuiyan, N.Z.; Choudhury, T.R.; Yu, J.; Noman, M.A.; Hosen, M.M.; Quraishi, S.B.; Paray, B.A.; Arai, T.; et al. Heavy Metals Accumulation in Tissues of Wild and Farmed Barramundi from the Northern Bay of Bengal Coast, and Its Estimated Human Health Risks. Toxics 2022, 10, 410. [Google Scholar] [CrossRef]
- Rashid, T.; Hoque, S.; Akter, S. Pollution in the Bay of Bengal: Impact on marine ecosystem. Open J. Mar. Sci. 2014, 5, 55. [Google Scholar] [CrossRef]
- Islam, M.S.; Hossain, M.B.; Matin, A.; Sarker, M.S.I. Assessment of heavy metal pollution, distribution and source apportionment in the sediment from Feni River estuary, Bangladesh. Chemosphere 2018, 202, 25–32. [Google Scholar] [CrossRef]
- Idriss, A.A.; Ahmad, A.K. Heavy metal concentrations in fishes from Juru River, estimation of the health risk. Bull. Environ. Contam. Toxicol. 2015, 94, 204–208. [Google Scholar] [CrossRef]
- Makokha, V.A.; Qi, Y.; Shen, Y.; Wang, J. Concentrations, distribution, and ecological risk assessment of heavy metals in the East Dongting and Honghu Lake, China. Expo. Health 2016, 8, 31–41. [Google Scholar] [CrossRef]
- Biswas, C.; Soma, S.S.; Rohani, M.F.; Rahman, M.H.; Bashar, A.; Hossain, M.S. Assessment of heavy metals in farmed shrimp, Penaeus monodon sampled from Khulna, Bangladesh: An inimical to food safety aspects. Heliyon 2021, 7, e06587. [Google Scholar] [CrossRef]
- Sarkar, T.; Alam, M.M.; Parvin, N.; Fardous, Z.; Chowdhury, A.Z.; Hossain, S.; Biswas, N. Assessment of heavy metals contamination and human health risk in shrimp collected from different farms and rivers at Khulna-Satkhira region, Bangladesh. Toxicol. Rep. 2016, 3, 346–350. [Google Scholar] [CrossRef]
- Wei, Y.; Zhang, J.; Zhang, D.; Tu, T.; Luo, L. Metal concentrations in various fish organs of different fish species from Poyang Lake, China. Ecotoxicol. Environ. Saf. 2014, 104, 182–188. [Google Scholar] [CrossRef]
- Hossain, M.B.; Tanjin, F.; Rahman, M.S.; Yu, J.; Akhter, S.; Noman, M.A.; Sun, J. Metals Bioaccumulation in 15 Commonly Consumed Fishes from the Lower Meghna River and Adjacent Areas of Bangladesh and Associated Human Health Hazards. Toxics 2022, 10, 139. [Google Scholar] [CrossRef]
- Islam, M.S.; Ahmed, M.K.; Habibullah-Al-Mamun, M. Determination of Heavy Metals in Fish and Vegetables in Bangladesh and Health Implications. Hum. Ecol. Risk Assess. Int. J. 2015, 21, 986–1006. [Google Scholar] [CrossRef]
- Mohiuddin, M.; Hossain, M.B.; Ali, M.M.; Hossain, M.K.; Habib, A.; Semme, S.A.; Rakib, M.R.J.; Rahman, M.A.; Yu, J.; Al-Sadoon, M.K.; et al. Human health risk assessment for exposure to heavy metals in finfish and shellfish from a tropical estuary. J. King Saud Univ.-Sci. 2022, 34, 102035. [Google Scholar] [CrossRef]
- FAO. Toxicological Evaluation of Certain Food Additives and Contaminants. In Thirty Seventh Meeting of JECFA; WHO Food Additives Series; FAO: Rome, Italy, 1989; p. 219. [Google Scholar]
- Gazette, M.B. Bangladesh Ministry of Fisheries and Livestock, Gazette; SRO No. 2014, 233; Ministry of Fisheries and Livestock: Dhaka, Bangladesh, 2014.
- Official Journal of the European Union. Maximum Levels for Certain Contaminants in Foodstuffs; Official Journal of the European Union: Aberdeen, UK, 2006. [Google Scholar]
- Hosseini, M.; Nabavi, S.M.B.; Nabavi, S.N.; Pour, N.A. Heavy metals (Cd, Co, Cu, Ni, Pb, Fe, and Hg) content in four fish commonly consumed in Iran: Risk assessment for the consumers. Environ. Monit. Assess. 2015, 187, 237. [Google Scholar] [CrossRef] [PubMed]
- Jiang, X.; Wang, J.; Pan, B.; Li, D.; Wang, Y.; Liu, X. Assessment of heavy metal accumulation in freshwater fish of Dongting Lake, China: Effects of feeding habits, habitat preferences and body size. J. Environ. Sci. 2022, 112, 355–365. [Google Scholar] [CrossRef] [PubMed]
- Yi, Y.; Tang, C.; Yi, T.; Yang, Z.; Zhang, S. Health risk assessment of heavy metals in fish and accumulation patterns in food web in the upper Yangtze River, China. Ecotoxicol. Environ. Saf. 2017, 145, 295–302. [Google Scholar] [CrossRef]
- Thomson, B.M.; Vannoort, R.W.; Haslemore, R.M. Dietary exposure and trends of exposure to nutrient elements iodine, iron, selenium and sodium from the 2003–4 New Zealand Total Diet Survey. Br. J. Nutr. 2008, 99, 614–625. [Google Scholar] [CrossRef]
- Gray, M.A.; Centeno, J.A.; Slaney, D.P.; Ejnik, J.W.; Todorov, T.; Nacey, J.N. Environmental exposure to trace elements and prostate cancer in three New Zealand ethnic groups. Int. J. Environ. Res. Public Health 2005, 2, 374–384. [Google Scholar] [CrossRef]
- Tuzen, M. Toxic and essential trace elemental contents in fish species from the Black Sea, Turkey. Food Chem. Toxicol. 2009, 47, 1785–1790. [Google Scholar] [CrossRef]
- Sundaray, S.K.; Nayak, B.B.; Lin, S.; Bhatta, D. Geochemical speciation and risk assessment of heavy metals in the river estuarine sediments—A case study: Mahanadi basin, India. J. Hazard. Mater. 2011, 186, 1837–1846. [Google Scholar] [CrossRef]
- Rahman, M.S.; Molla, A.H.; Saha, N.; Rahman, A. Study on heavy metals levels and its risk assessment in some edible fishes from Bangshi River, Savar, Dhaka. Bangladesh. Food Chem. 2012, 134, 1847–1854. [Google Scholar] [CrossRef]
- Raj, D.; Maiti, S.K. Sources, bioaccumulation, health risks and remediation of potentially toxic metal (loid) s (As, Cd, Cr, Pb and Hg): An epitomised review. Environ. Monit. Assess. 2020, 192, 108. [Google Scholar] [CrossRef]
- WHO. WHO Technical Report Series. Evaluation of Certain Food Additives and Contaminants. Fifty-Third Report of the Joint FAO/WHO Expert Committee on Food Additives (JECFA). Available online: http://www.Who.Int/foodsafety/publications/jecfa-reports/en/ (accessed on 20 April 2020).
- Singh, K.P.; Malik, A.; Sinha, S.; Singh, V.K.; Murthy, R.C. Estimation of source of heavy metal contamination in sediments of Gomti River (India) using principal component analysis. Water Air Soil Pollut. 2005, 166, 321–341. [Google Scholar] [CrossRef]
- Ma, X.; Zuo, H.; Tian, M.; Zhang, L.; Meng, J.; Zhou, X.; Liu, Y. Assessment of heavy metals contamination in sediments from three adjacent regions of the Yellow River using metal chemical fractions and multivariate analysis techniques. Chemosphere 2016, 144, 264–272. [Google Scholar] [CrossRef]
- Shikazono, N.; Tatewaki, K.; Mohiuddin, K.M.; Nakano, T.; Zakir, H.M. Sources, spatial variation, and speciation of heavy metals in sediments of the Tamagawa River in Central Japan. Environ. Geochem. Health 2012, 34, 13–26. [Google Scholar] [CrossRef]
- Wang, X.; Sato, T.; Xing, B.; Tao, S. Health risks of heavy metals to the general public in Tianjin, China via consumption of vegetables and fish. Sci. Total Environ. 2005, 350, 28–37. [Google Scholar] [CrossRef]
- Rath, P.; Panda, U.C.; Bhatta, D.; Sahu, K.C. Use of sequential leaching, mineralogy, morphology and multivariate statistical technique for quantifying metal pollution in highly polluted aquatic sediments—A case study: Brahmani and Nandira Rivers, India. J. Hazard. Mater. 2009, 163, 632–644. [Google Scholar] [CrossRef]
- Chung, S.Y.; Venkatramanan, S.; Park, N.; Ramkumar, T.; Sujitha, S.B.; Jonathan, M.P. Evaluation of physico-chemical parameters in water and total heavy metals in sediments at Nakdong River Basin, Korea. Environ. Earth Sci. 2016, 75, 50. [Google Scholar] [CrossRef]
- Begum, S.; Islam, M.S.; Rehnuma, M.; Kabir, M.H.; Tusher, T.R. Water quality and fish diversity status in Meghna River at Narsingdi in Bangladesh. Bangladesh J. Environ. Sci. 2019, 37, 25–31. [Google Scholar]


| Metals | Certified Metal Value, (mg/kg) | Average Recovery from Diluted Solution (%) |
|---|---|---|
| Pb | 10.0 ± 0.5 | 103 |
| Cd | 5.0 ± 0.5 | 102 |
| Cr | 50 ± 0.16 | 102 |
| Ni | 0.93 ± 0.12 | 97 |
| Cu | 50.0 ± 0.5 | 100 |
| Zn | 100.0 ± 0.5 | 97 |
| Fish | ||||||||
|---|---|---|---|---|---|---|---|---|
| Sampling Site | Species | Pb | Cd | Cr | Ni | Cu | Zn | Reference |
| Central coast | L. bata | 3.53 ± 0.56 | 0.05 ± 0.01 | BDL | 0.81 ± 0.02 | 2.93 ± 0.2 | 39.61 ± 2.97 | Present study |
| P. fuscus | 7.17 ± 1.08 | 0.08 ± 0.03 | BDL | 0.19 ± 0.017 | 14.88 ± 2.19 | 27.75 ± 1.63 | ||
| S. panijus | 6.95 ± 0.97 | 0.06 ± 0.012 | BDL | 0.02 ± 0.01 | 11.16 ± 1.23 | 45.89 ± 2.78 | ||
| Central coast | L. calcarifer | 1.33 ± 0.30 | 0.05 ± 0.03 | 0.42 ± 0.32 | NA | 0.50 ± 0.12 | 2.40 ± 0.40 | [12] |
| Noakhali | Otolothoides pama | 0.38 ± 0.12 | NA | 9.69 ± 2.04 | BDL | 30.29 ± 3.93 | 107.22 ± 16.87 | [20] |
| Apocryptes bato | 0.65 ± 0.03 | NA | 7.35 ± 3.18 | BDL | 46.98 ± 24.22 | 111.81 ± 6.37 | ||
| P. paradiseus | 0.48 ± 0.07 | NA | 7.24 ± 3.59 | BDL | 33.95 ± 4.14 | 101.38 ± 8.38 | ||
| Mystus gulio | 0.57 ± 0.04 | NA | BDL | BDL | 46.57 ± 12.39 | 129.33 ± 13.45 | ||
| Harpadon nehereus | 0.20 ± 0.02 | NA | BDL | BDL | 35.40 ± 17.83 | 106.72 ± 6.02 | ||
| Lates calcarifer | 0.44 ± 0.05 | NA | 8.84 ± 0.12 | BDL | 31.44 ± 2.97 | 103.72 ± 13.81 | ||
| Patuakhali | Tenualosa ilisha | 0.5 ± 0.5 | 0.2 ± 0.2 | 0.5 ± 0.2 | 0.5 ± 0.4 | 1.1 ± 0.6 | NA | [21] |
| Chittagong | O. pama | 0.14 ± 0.028 | NA | 1.525 ± 0.049 | 0.225 ± 0.007 | NA | 31.543 ± 1.275 | [22] |
| Polynemus paradiseus | 0.165 ± 0.02 | NA | 1.036 ± 0.005 | 0.345 ± 0.007 | NA | 33.24 ± 0.98 | ||
| Apocryptes bato | 0.086 ± 0.008 | NA | 0.709 ± 0.014 | 0.255 ± 0.007 | NA | 1458.7 ± 1.42 | ||
| Tolerance level in fish | 0.5 | 0.5 | 0.15 | - | 30 | 40 | [23] | |
| Guidelines for Bangladesh | 0.3 | 0.25 | 1 | - | 5 | 50 | [24] | |
| Shrimp | ||||||||
| Central coast | P. monodon | 7.24 ± 0.95 | 0.04 | BDL | 0.46 ± 0.03 | 42.33 ± 2.03 | 49.98 ± 2.09 | Present study |
| Chittagong | Macrobrachium rosenbergii | 0.025 ± 0.002 | NA | 1.17 ± 0.212 | 0.325 ± 0.007 | NA | 70.34 ± 1.26 | [22] |
| Metapenaeus dobsoni | 0.056 ± 0.008 | NA | 1.25 ± 0.036 | 0.34 ± 0.000 | NA | 69.05 ± 0.41 | ||
| Cox’s Bazar | P. monodon | 17.75 ± 1.5 | 0.09 ± 0.03 | 0.69 ± 0.6 | NA | 9.43 ± 2.8 | 18.89 ± 2.9 | [1] |
| Saint Martin | P. sculptilis | 0.69 ± 1.56 | 0.713 ± 0.06 | < 0.08 | NA | 5.049 ± 0.07 | 13.5 ± 0.43 | [5] |
| P. versicolor | < 0.3 | 3.505 ± 0.19 | < 0.08 | NA | 13.398 ± 0.45 | 22.413 ± 0.35 | ||
| Tolerance level in crustacean | 0.5 | 0.5 | 0.5 | - | 5 | 50 | [25] | |
| Guideline for Bangladesh | 0.5 | 0.5 | 1 | - | 5 | 50 | [24] | |
| Name of the Species | Pb | Cd | Cr | Ni | Cu | Zn |
|---|---|---|---|---|---|---|
| L. bata | 3.18 × 10⁻⁴ | 4.51 × 10⁻⁶ | BDL | 7.30 × 10⁻⁵ | 2.64 × 10⁻⁴ | 3.57 × 10⁻⁴ |
| P. fuscus | 6.46 × 10⁻⁴ | 7.21 × 10⁻⁶ | BDL | 1.72 × 10⁻² | 1.34 × 10⁻³ | 2.51 × 10⁻³ |
| S. penijus | 6.26 × 10⁻⁴ | 5.41 × 10⁻⁶ | BDL | 1.81 × 10⁻⁶ | 1.00 × 10⁻³ | 4.14 × 10⁻³ |
| P. monodon | 6.53 × 10⁻⁴ | 4.51 × 10⁻⁶ | BDL | 4.15 × 10⁻⁵ | 3.82 × 10⁻³ | 4.51 × 10⁻³ |
| Name of the Species | Pb | Cd | Ni | Cu | Zn | TTHQ/HI |
|---|---|---|---|---|---|---|
| L. bata | 9.08 × 10⁻² | 4.51 × 10⁻³ | 6.64 × 10⁻³ | 6.60 × 10⁻¹ | 1.19 × 10⁻² | 0.774 |
| P. fuscus | 1.85 × 10⁻¹ | 7.21 × 10⁻³ | 1.92 × 10⁻³ | 3.35 × 10⁻² | 8.37 × 10⁻³ | 0.236 |
| S. penijus | 1.79 × 10⁻¹ | 5.41 × 10⁻³ | 1.51 × 10⁻⁴ | 2.5 × 10⁻² | 1.38 × 10⁻¹ | 0.384 |
| P. monodon | 1.86 × 10⁻¹ | 4.51 × 10⁻³ | 3.77 × 10⁻³ | 9.55 × 10⁻² | 1.51 × 10⁻² | 0.305 |
| Average | 6.41 × 10⁻¹ | 2.16 × 10⁻² | 1.25 × 10⁻² | 8.14 × 10⁻¹ | 1.73 × 10⁻¹ | 0.416 |
| Pb | Cd | Ni | Cu | Zn | |
|---|---|---|---|---|---|
| Pb | 1 | ||||
| Cd | 0.277 | 1 | |||
| Ni | −0.816 | −0.555 | 1 | ||
| Cu | 0.623 | −0.457 | −0.084 | 1 | |
| Zn | 0.074 | −0.871 | 0.087 | 0.498 | 1 |
| PC 1 | PC 2 | |
|---|---|---|
| Pb | −0.216 | 0.645 |
| Cd | −0.647 | −0.043 |
| Ni | 0.409 | −0.467 |
| Cu | 0.288 | 0.535 |
| Zn | 0.533 | 0.278 |
Publisher’s Note: MDPI stays neutral with regard to jurisdictional claims in published maps and institutional affiliations. |
© 2022 by the authors. Licensee MDPI, Basel, Switzerland. This article is an open access article distributed under the terms and conditions of the Creative Commons Attribution (CC BY) license (https://creativecommons.org/licenses/by/4.0/).
Share and Cite
Hossain, M.B.; Bhuiyan, N.Z.; Kasem, A.; Hossain, M.K.; Sultana, S.; Nur, A.-A.U.; Yu, J.; Albeshr, M.F.; Arai, T. Heavy Metals in Four Marine Fish and Shrimp Species from a Subtropical Coastal Area: Accumulation and Consumer Health Risk Assessment. Biology 2022, 11, 1780. https://doi.org/10.3390/biology11121780
Hossain MB, Bhuiyan NZ, Kasem A, Hossain MK, Sultana S, Nur A-AU, Yu J, Albeshr MF, Arai T. Heavy Metals in Four Marine Fish and Shrimp Species from a Subtropical Coastal Area: Accumulation and Consumer Health Risk Assessment. Biology. 2022; 11(12):1780. https://doi.org/10.3390/biology11121780
Chicago/Turabian StyleHossain, Mohammad Belal, Nurer Zaman Bhuiyan, Abul Kasem, Md. Kamal Hossain, Salma Sultana, As-Ad Ujjaman Nur, Jimmy Yu, Mohammed Fahad Albeshr, and Takaomi Arai. 2022. "Heavy Metals in Four Marine Fish and Shrimp Species from a Subtropical Coastal Area: Accumulation and Consumer Health Risk Assessment" Biology 11, no. 12: 1780. https://doi.org/10.3390/biology11121780
APA StyleHossain, M. B., Bhuiyan, N. Z., Kasem, A., Hossain, M. K., Sultana, S., Nur, A.-A. U., Yu, J., Albeshr, M. F., & Arai, T. (2022). Heavy Metals in Four Marine Fish and Shrimp Species from a Subtropical Coastal Area: Accumulation and Consumer Health Risk Assessment. Biology, 11(12), 1780. https://doi.org/10.3390/biology11121780