3.1. Effects of ME and IM on SG
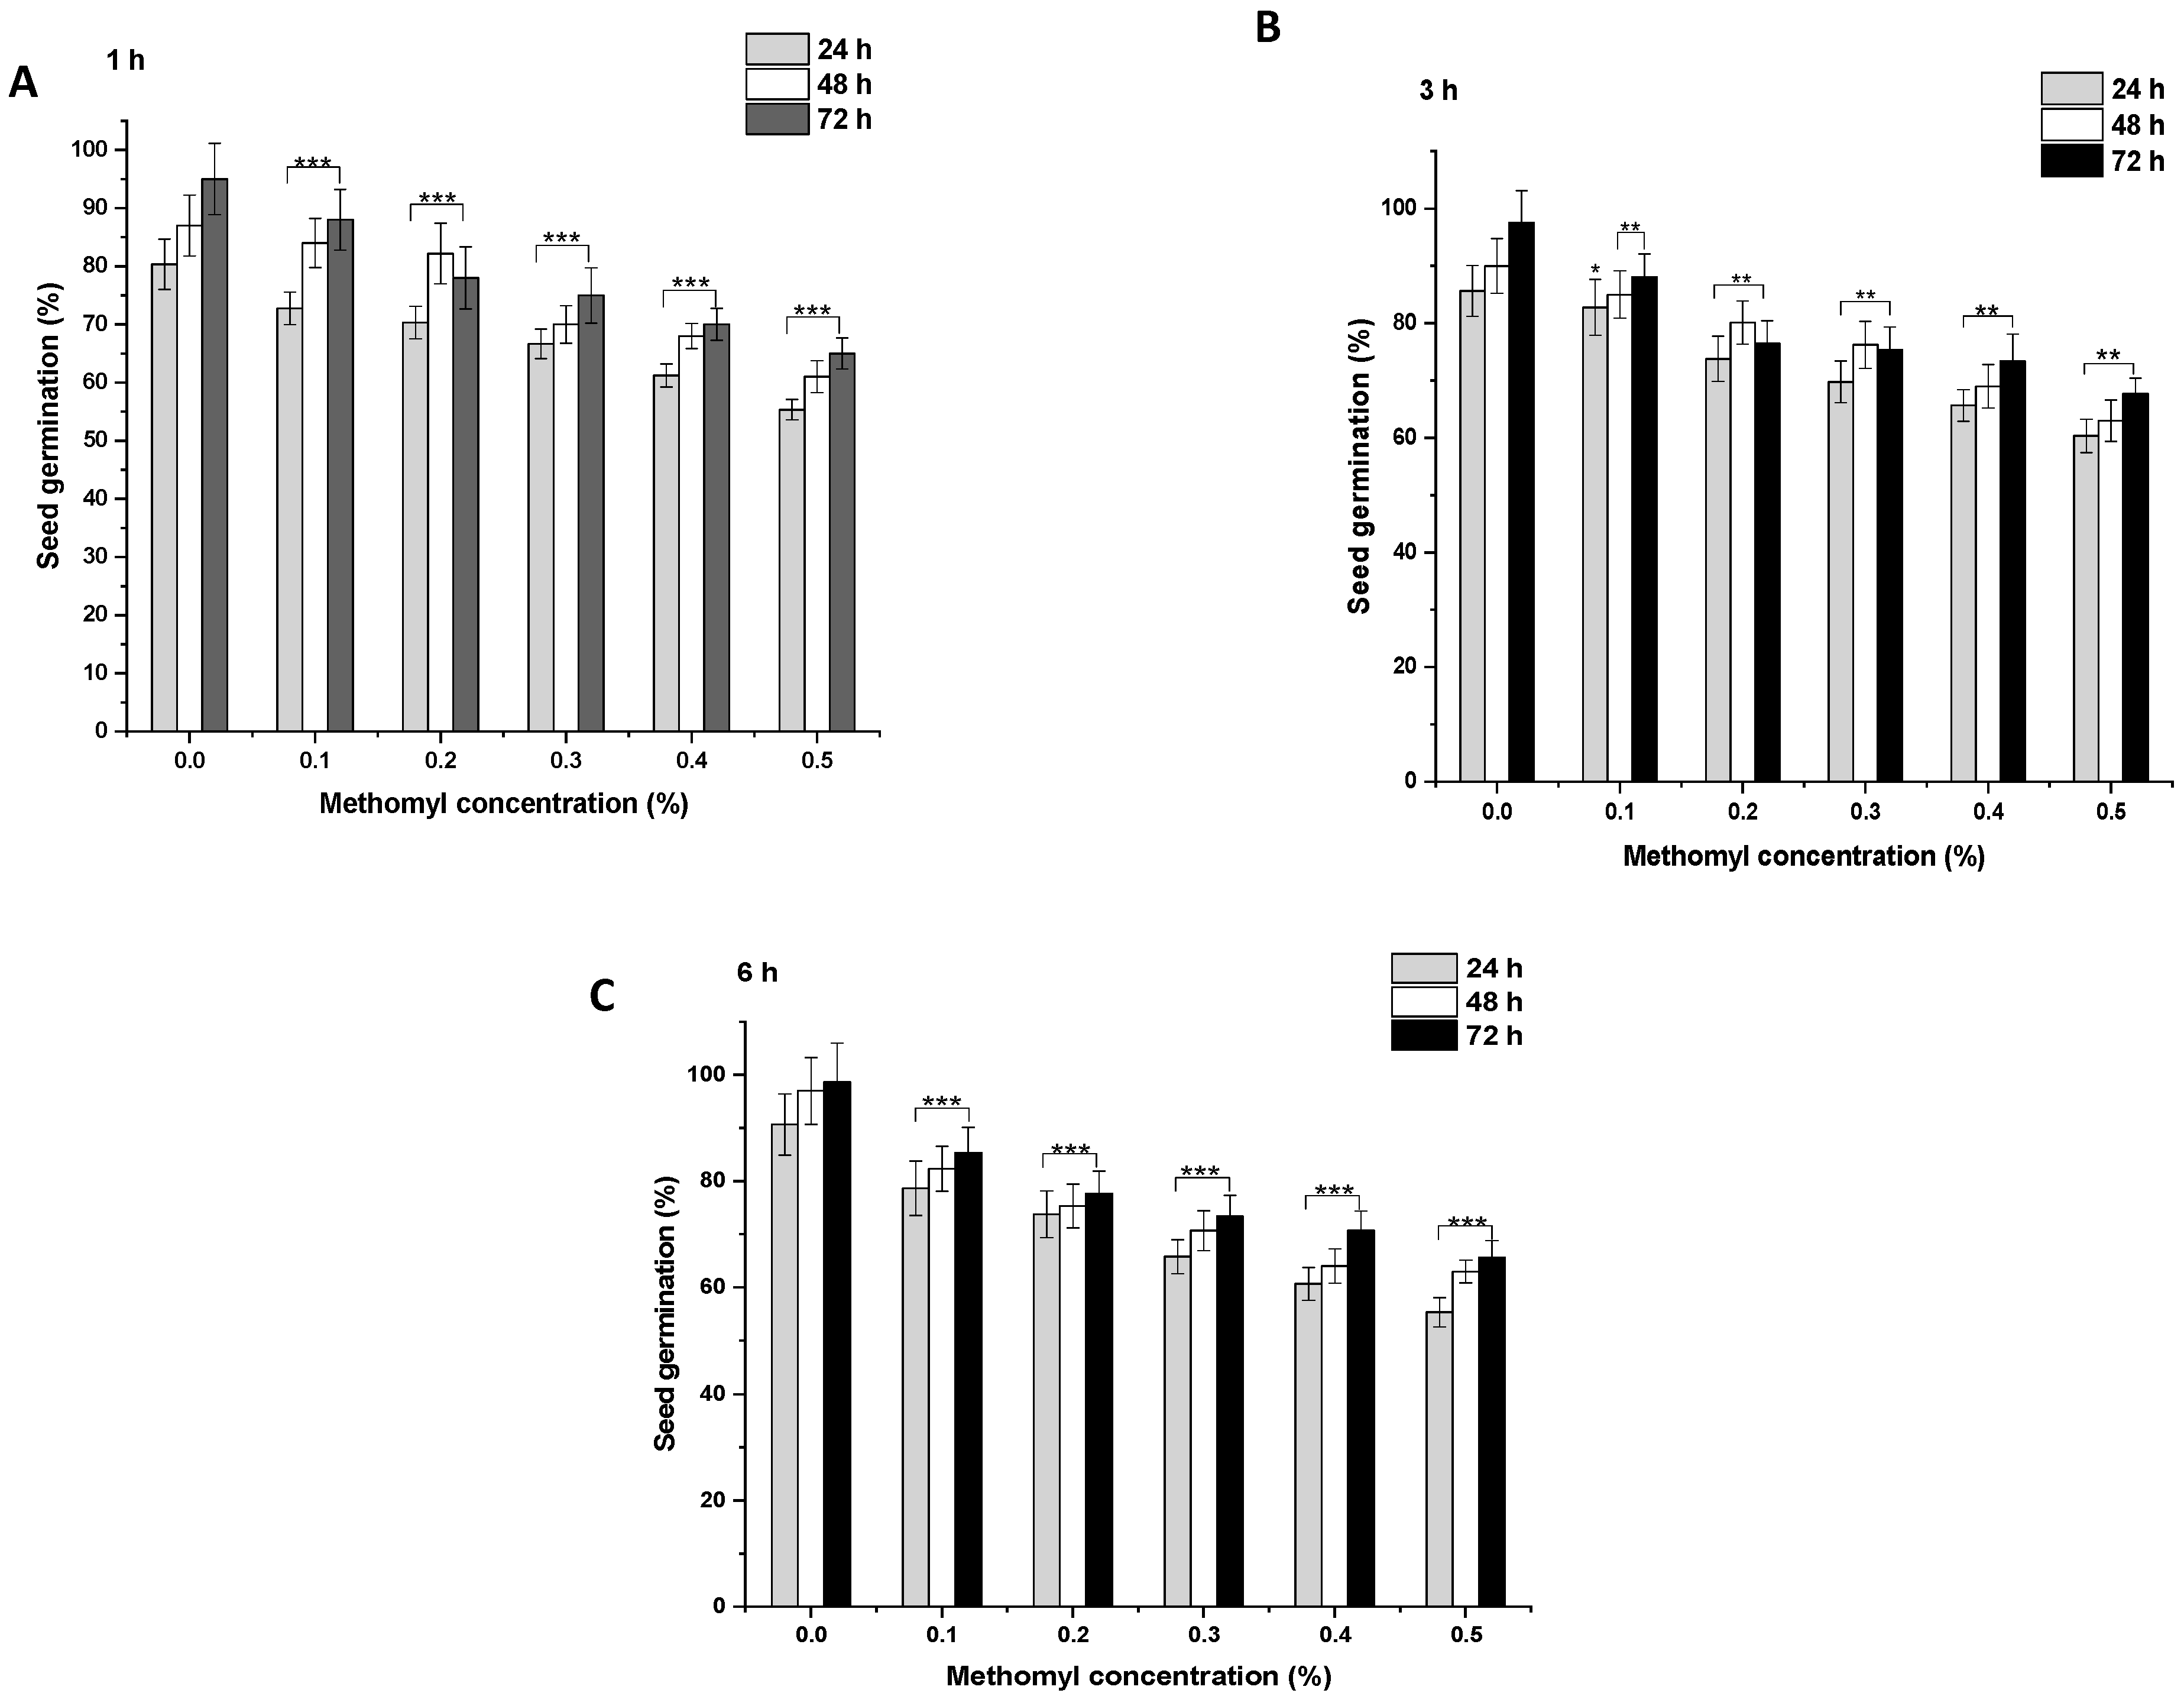
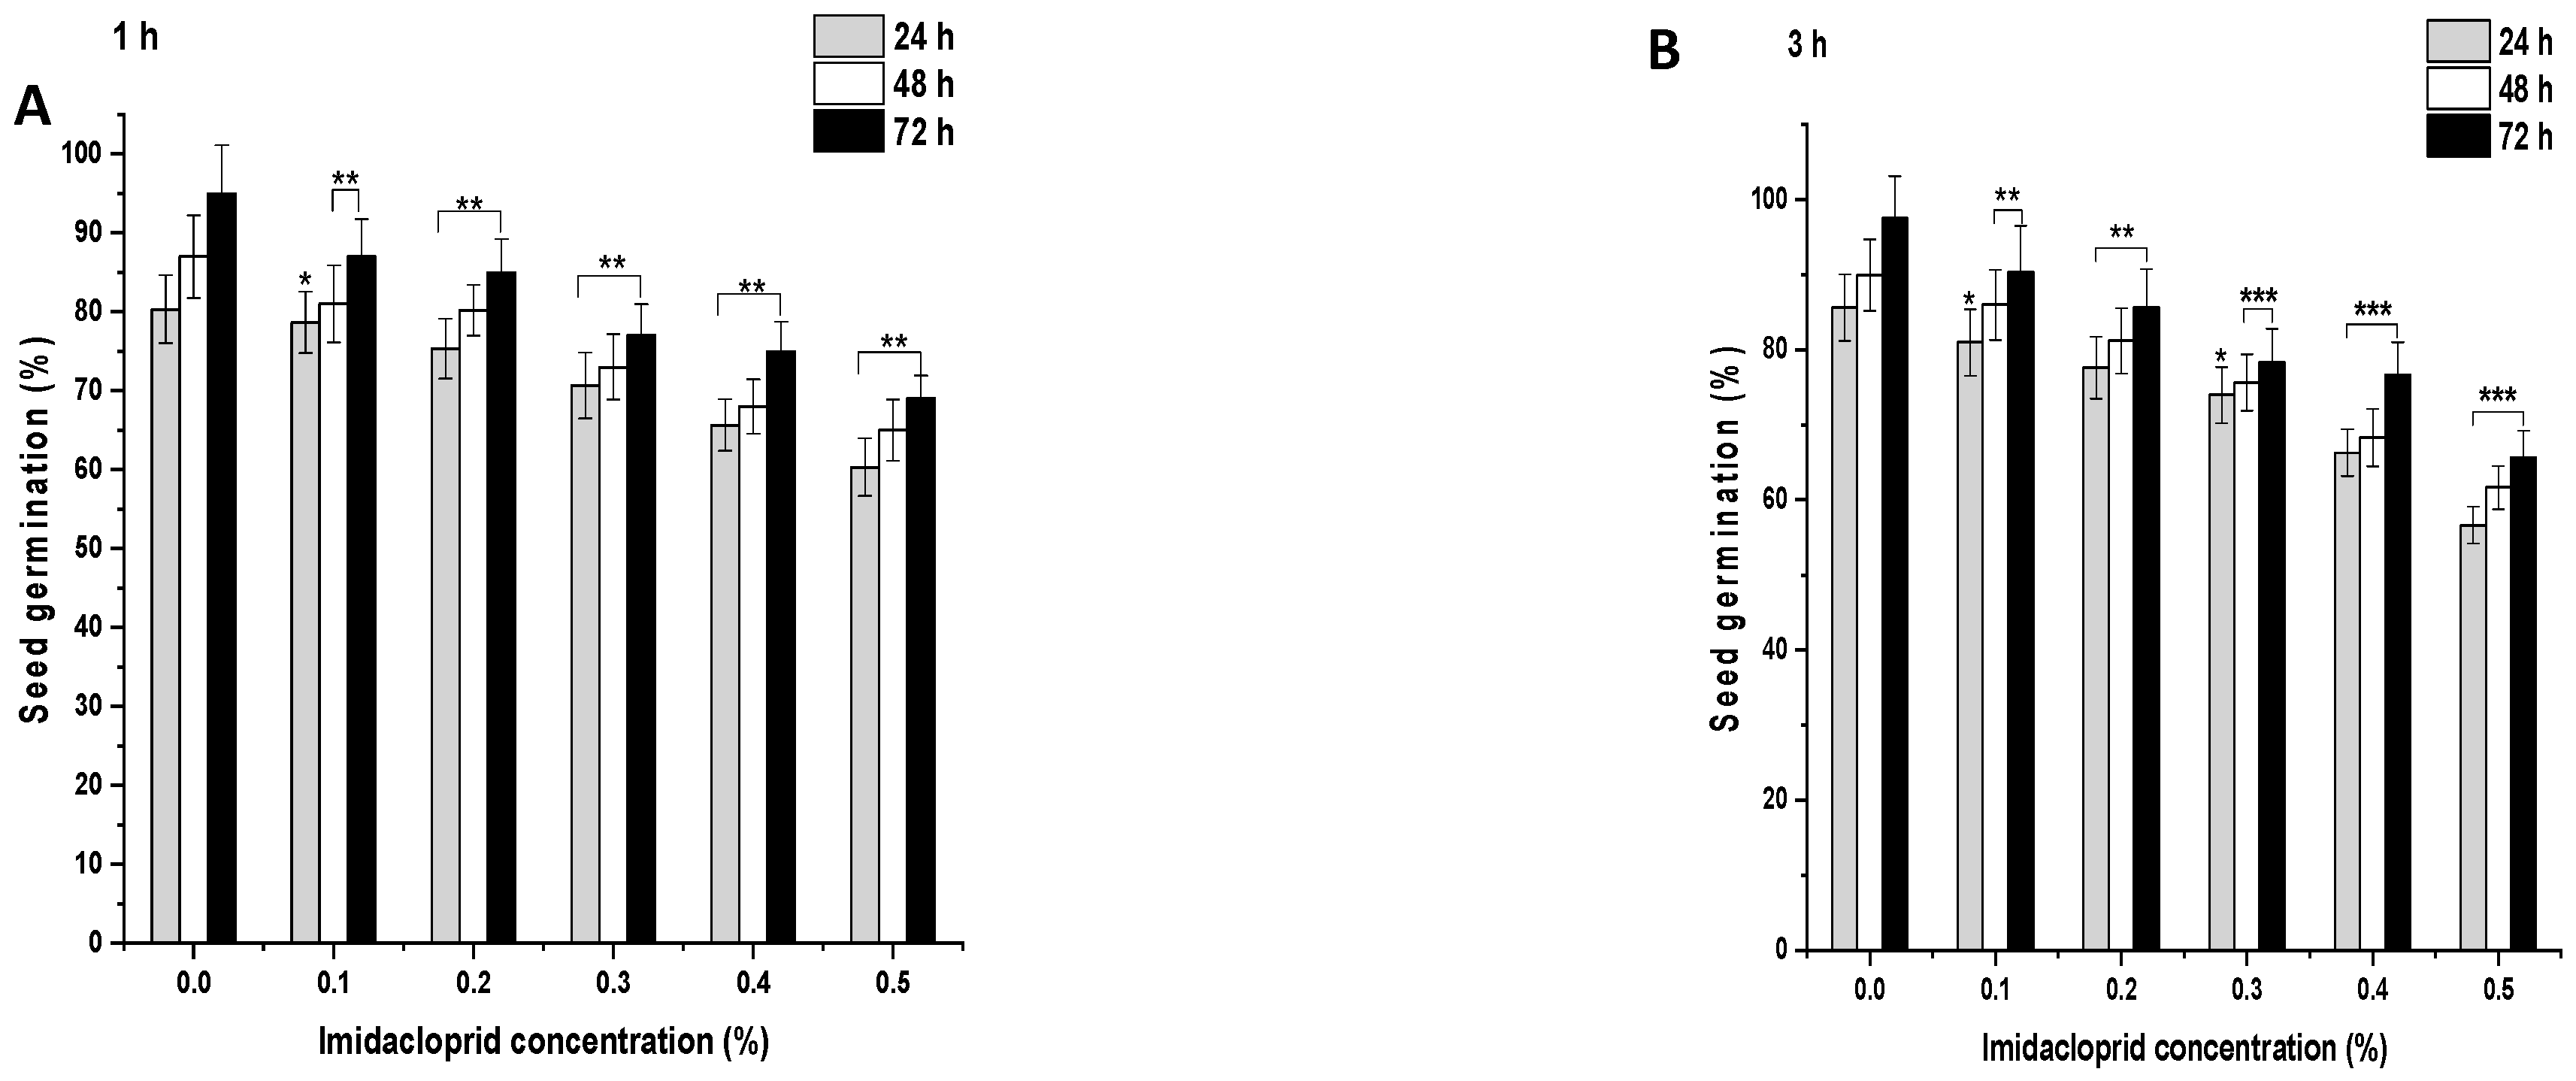
In the control group, after 1 h, 80.33% of the seeds germinated, which increased to 87% and 95% at 48 and 72 h, respectively (
Figure 2A and
Figure 3A). ME and IM treatments from 0.1% to 0.5% for 1 h resulted in a significant inhibition of SG (
p < 0.001) at 24 h in comparison to the controls. A similar trend was observed in the SG pattern at 48 and 72 h. After 1 h treatment with ME and IM, maximal SG was observed at a concentration of 0.1% at 24 h (ME: 72.77%, IM: 78.66%), at 48 h (ME: 84%, IM: 81%), and at 72 h (ME: 88%, IM: 87%). Minimal SG was reported at a 0.5% concentration at 24 h (ME: 55.33%, IM: 60.33%), at 48 h (ME: 61%, IM: 65%), and at 72 h (ME: 65%, IM: 69%). In the control group, after 3 h, 85.66% of the seeds germinated, which increased to 89.99% and 97.55% at 48 and 72 h, respectively (
Figure 2B and
Figure 3B). ME and IM treatments from 0.1% to 0.5% for 3 h resulted in significant inhibition of SG (
p < 0.01 and
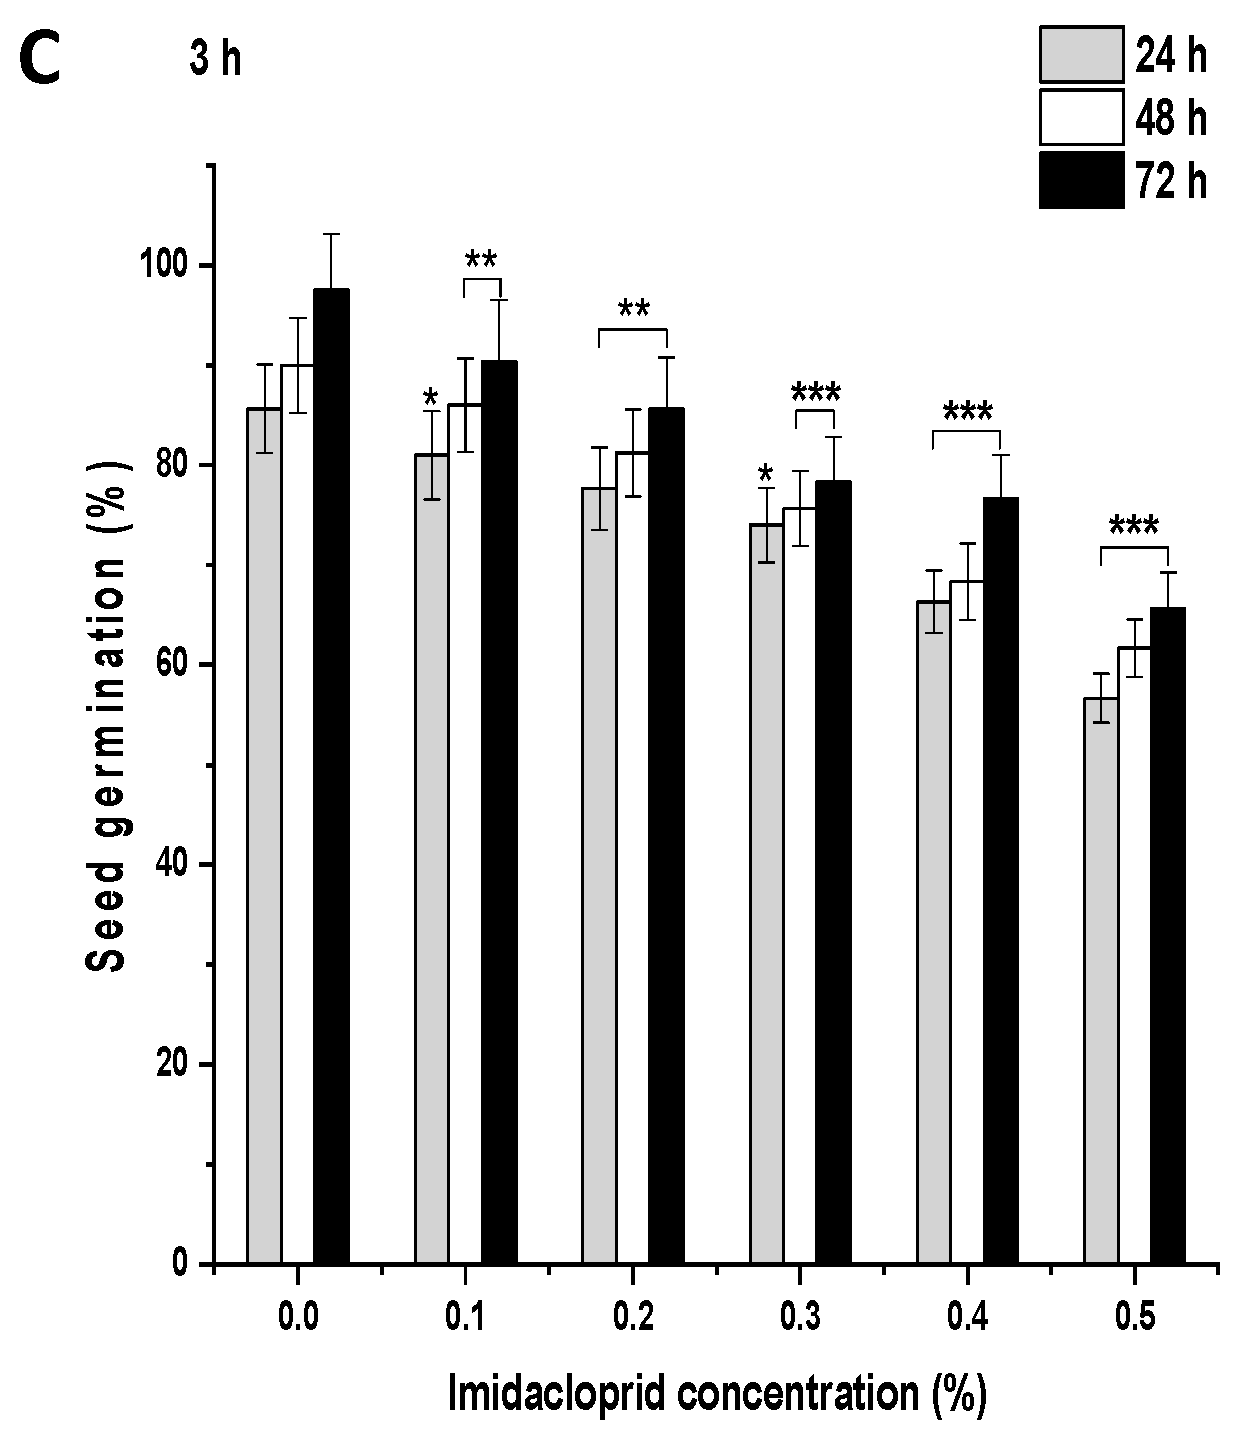
p < 0.001) at 24 h compared to the control group. A similar trend in the SG pattern was observed at 48 and 72 h. The highest SG was reported after 3 h of treatment with ME and IM at a concentration of 0.1% at 24 h (ME: 82.77%, IM: 80.99%), at 48 h (ME: 85%, IM: 86%), and at 72 h (ME: 88%, IM: 90.33%). The lowest SG was observed at a 0.5% concentration at 24 h (ME: 60.33%, IM: 56.66%), at 48 h (ME: 63%, IM: 61.66%), and at 72 h (ME: 90.33%, IM: 65.66%). In the control group of 6 h, 90.66% of the seeds germinated, which increased to 96.99% and 98.66% at 48 and 72 h, respectively (
Figure 2C and
Figure 3C). ME and IM treatment from 0.1% to 0.5% for 6 h resulted in a significant inhibition of SG (
p < 0.001) at 24 h in comparison to the control group. A similar SG pattern was observed at 48 and 72 h. After 6 h exposure with ME and IM, maximal SG occurred at a concentration of 0.1% at 24 h (ME: 78.66%, IM: 76.99%), at 48 h (ME: 82.33%, IM: 79%), and at 72 h (ME: 85.33%, IM: 90.33%). The lowest SG was reported at a 0.5% concentration at 24 h (ME: 55.33%, IM: 47.33%), at 48 h (ME: 63%, IM: 55.66%), and at 72 h (ME: 65.66%, IM 60.66%).
3.2. Effects of ME and IM on RL
In untreated seeds, the radicle length (RL) increased with an increase in time interval after treatment with double-distilled water for 1 h: 1.0 ± 0.06 at 24 h, 1.56 ± 0.07 at 48 h, and 2.98 ± 0.05 at 72 h (
Table 1,
Table 2 and
Table 3). For 1 h, 0.1% to 0.5% ME and IM treatment resulted in a significant inhibition of RL (
p < 0.05 and
p < 0.01) compared to the control group. A similar trend was observed in the RL pattern at 48 h and 72 h. Maximal RL was found at a 0.1% concentration at 24 h (ME: 0.77 ± 0.4, IM: 0.69 ± 0.02), at 48 h (ME: 1.32 ± 0.08, IM: 1.45 ± 0.02), and at 72 h (ME: 2.5 ± 0.03, IM: 2.5 ± 0.06). Minimal RL after 1 h treatment with ME and IM at a concentration of 0.5% occurred at 24 h (ME: 0.42 ± 0.03, IM: 0.50 ± 0.05), at 48 h (ME: 1.00 ± 0.04, IM: 0.60 ± 0.06), and at 72 h (ME: 1.55 ± 0.45, IM: 0.90 ± 0.05). The RL of untreated seeds increased with time, reaching 1.25 ± 0.20 at 24 h, 1.98 ± 0.40 at 48 h, and 3.15 ± 0.98 at 72 h following 3 h of treatment with double-distilled water (
Table 1,
Table 2 and
Table 3). Meanwhile, 3 h ME and IM treatment of 0.1% to 0.5% resulted in a significant inhibition of RL (
p < 0.05 and
p < 0.01) in comparison to the control group. A similar pattern of RL was observed at 48 and 72 h. After 3 h treatment with ME and IM, maximal RL was found at a concentration of 0.1% at 24 h (ME: 0.99 ± 0.04, IM: 0.89 ± 0.02), at 48 h (ME: 1.45 ± 0.30, IM: 1.45 ± 0.02), and at 72 h (ME: 2.50 ± 0.68, IM: 2.23 ± 0.06). Minimal RL was found at a 0.5% at 24 h (ME: 0.54 ± 0.03, IM: 0.52 ± 0.05), at 48 h (ME: 0.85 ± 0.04, IM: 0.63 ± 0.05), and at 72 h (ME: 1.00 ± 0.03, IM: 0.94 ± 0.045). After 6 h of treatment with double-distilled water, RL increased with time, reaching 1.32 ± 0.06 at 24 h, 2.92 ± 0.07 at 48 h, and 3.25 ± 0.94 at 72 h (
Table 1,
Table 2 and
Table 3). Meanwhile, 6 h ME and IM treatments of 0.1% to 0.5% resulted in a significant inhibition of RL (
p < 0.05 and
p < 0.01) compared to the control group. A similar trend in the RL pattern was observed at 48 and 72 h. Maximal RL was observed at a concentration of 0.1% at 24 h (ME: 0.73 ± 0.031, IM: 0.75 ± 0.01), at 48 h (ME: 0.99 ± 0.02, IM: 0.99 ± 0.02), and at 72 h (ME: 1.45 ± 0.09, IM:1.55 ± 0.06). Minimal RL was observed at a 0.5% concentration at 24 h (ME: 0.48 ± 0.001, IM: 0.45 ± 0.05), at 48 h (ME: 0.56 ± 0.012, IM: 0.50 ± 0.05), and at 72 h (ME: 0.67 ± 0.09, IM: 0.65 ± 0.045) after 6 h treatment with ME and IM.
3.3. Effects of ME and IM on MI
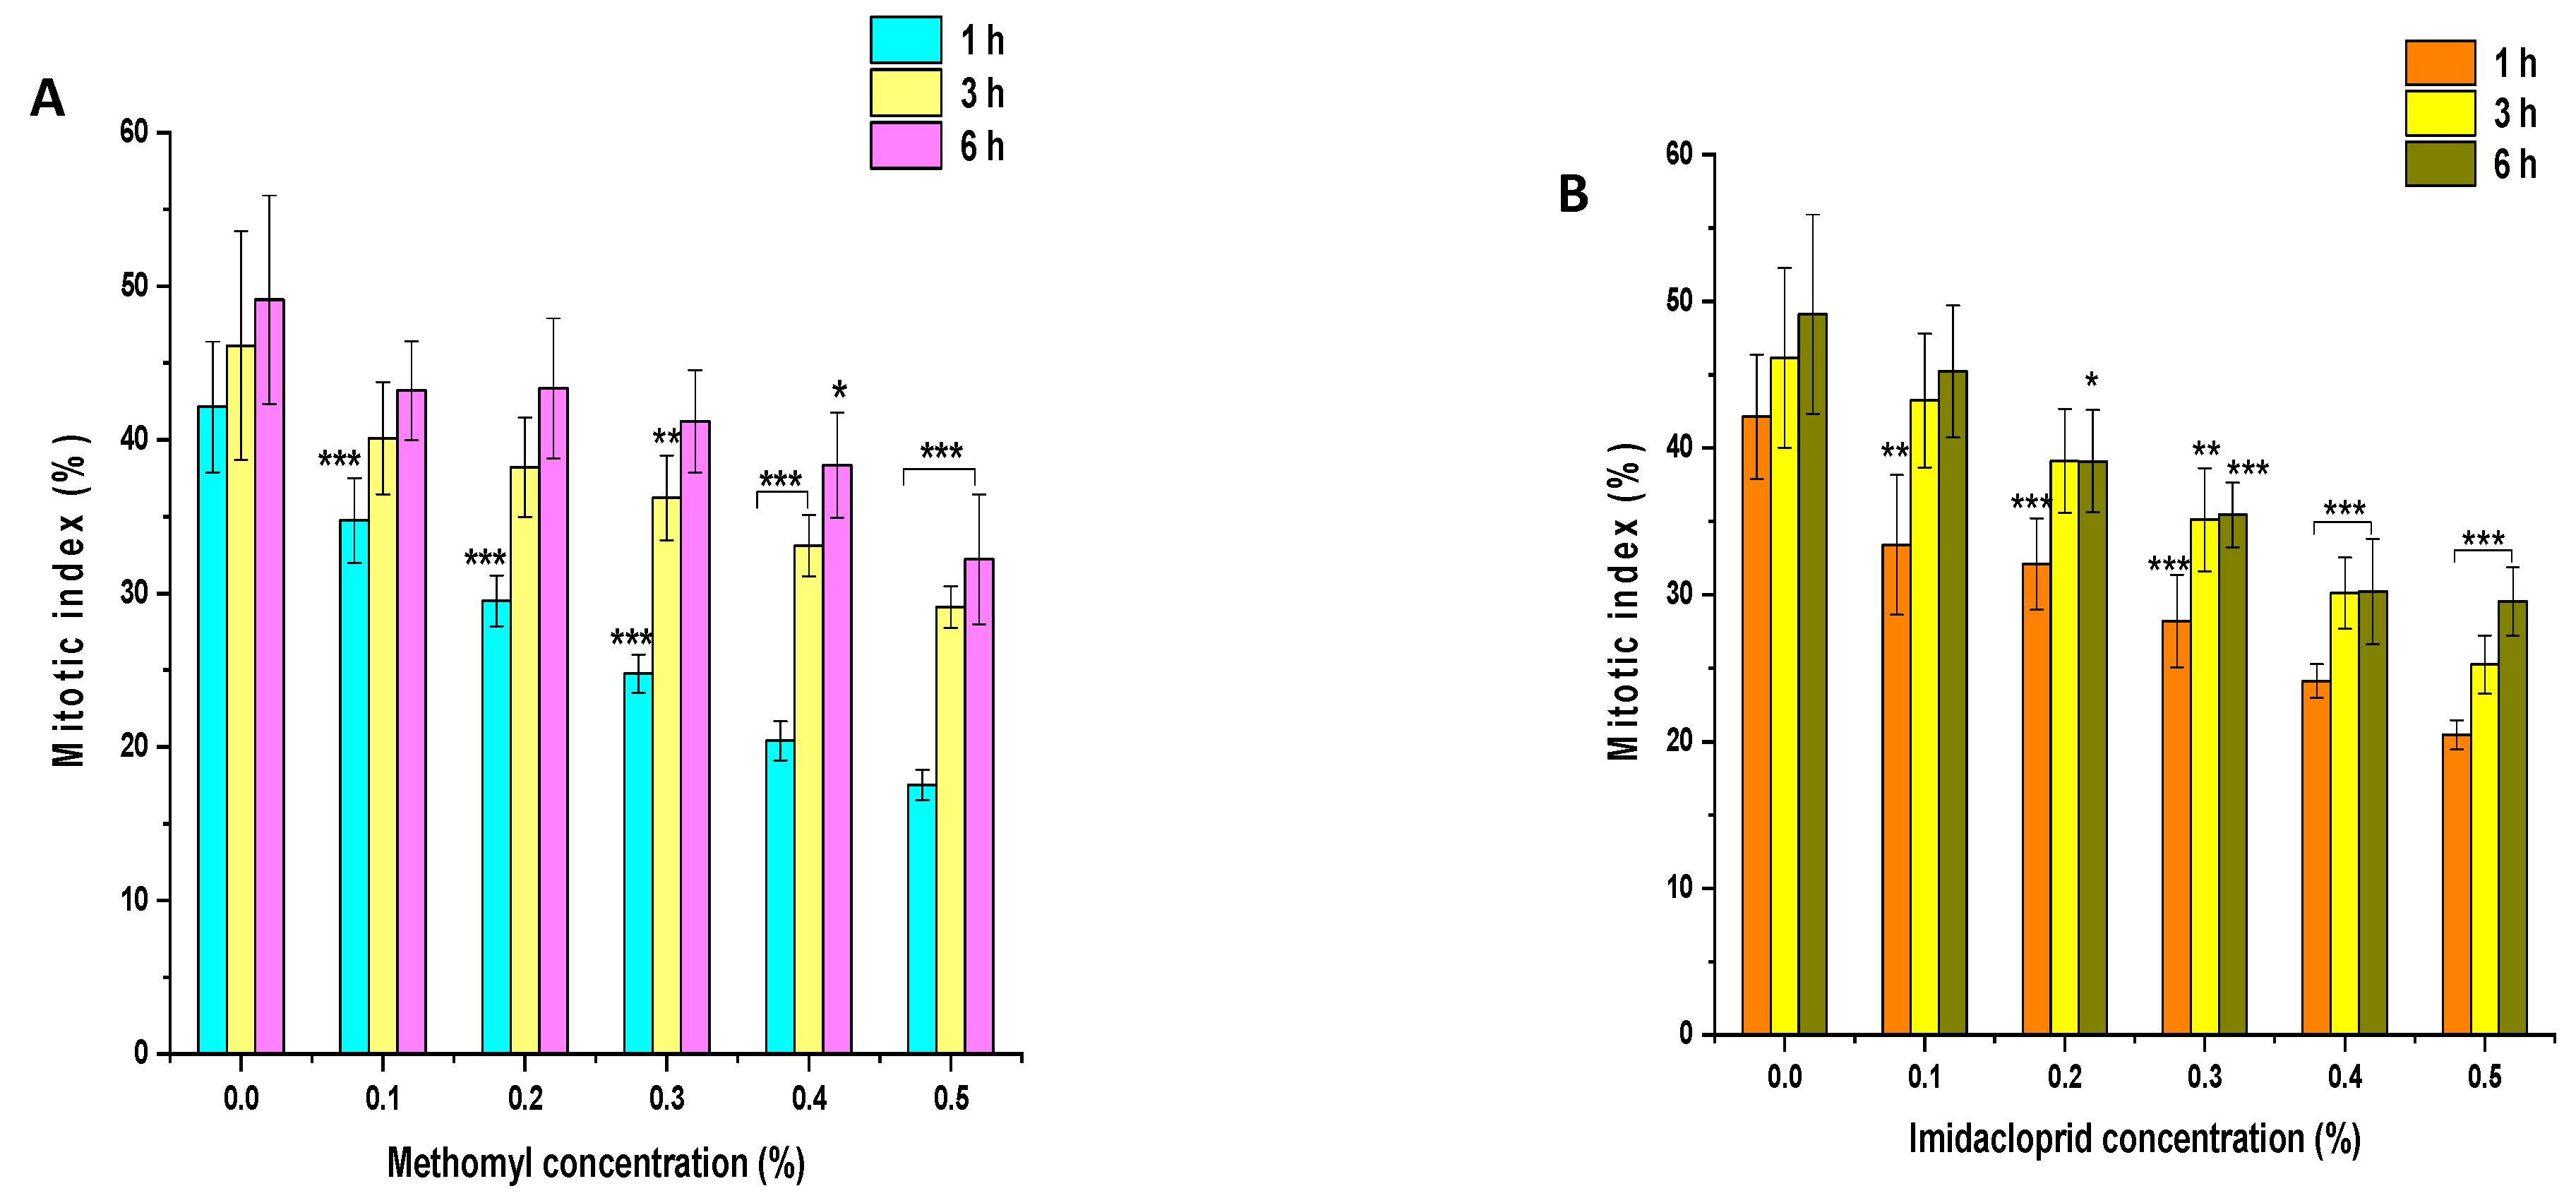
The effects of insecticides ME and IM on the MI of
P. sativum root tip cells are presented in
Figure 4A,B. In the control group, MI values were approximately 42%, 46%, and 49% in seeds treated with double-distilled water for 1, 3, and 6 h, respectively. In comparison to the control group, a significant decline (
p < 0.001) in MI was observed in seeds treated with 0.1% to 0.5% of ME for 1 h. ME treatment of 0.1 to 0.2% showed a nonsignificant decline (
p > 0.05), while 0.3% to 0.5% ME treatment resulted in a significant inhibitory effect (
p < 0.01 and
p < 0.001) on MI in comparison to the control group following 3 h treatment. The ME treatment of 0.1 to 0.3% resulted in a nonsignificant decline (
p > 0.05), while 0.4% to 0.5% ME treatment resulted in a significant decrease (
p < 0.05 and
p < 0.001) in MI in comparison to the control group following treatment for 6 h. Compared to the control group, a significant decrease (
p < 0.001) in MI was observed in seeds treated with 0.1% to 0.5% IM for 1 h. IM treatment of 0.1 to 0.2% resulted in a nonsignificant decline (
p > 0.05), while IM treatment of 0.3% to 0.5% showed a significant inhibitory effect (
p < 0.01 and
p < 0.001) on MI in comparison to the control group when treated for 3 h. The IM treatment of 0.1% resulted in a nonsignificant decline (
p > 0.05), while the IM treatment of 0.2% to 0.5% had a significant inhibitory effect (
p < 0.05 and
p < 0.001) on MI compared to the control group following 6 h treatment.
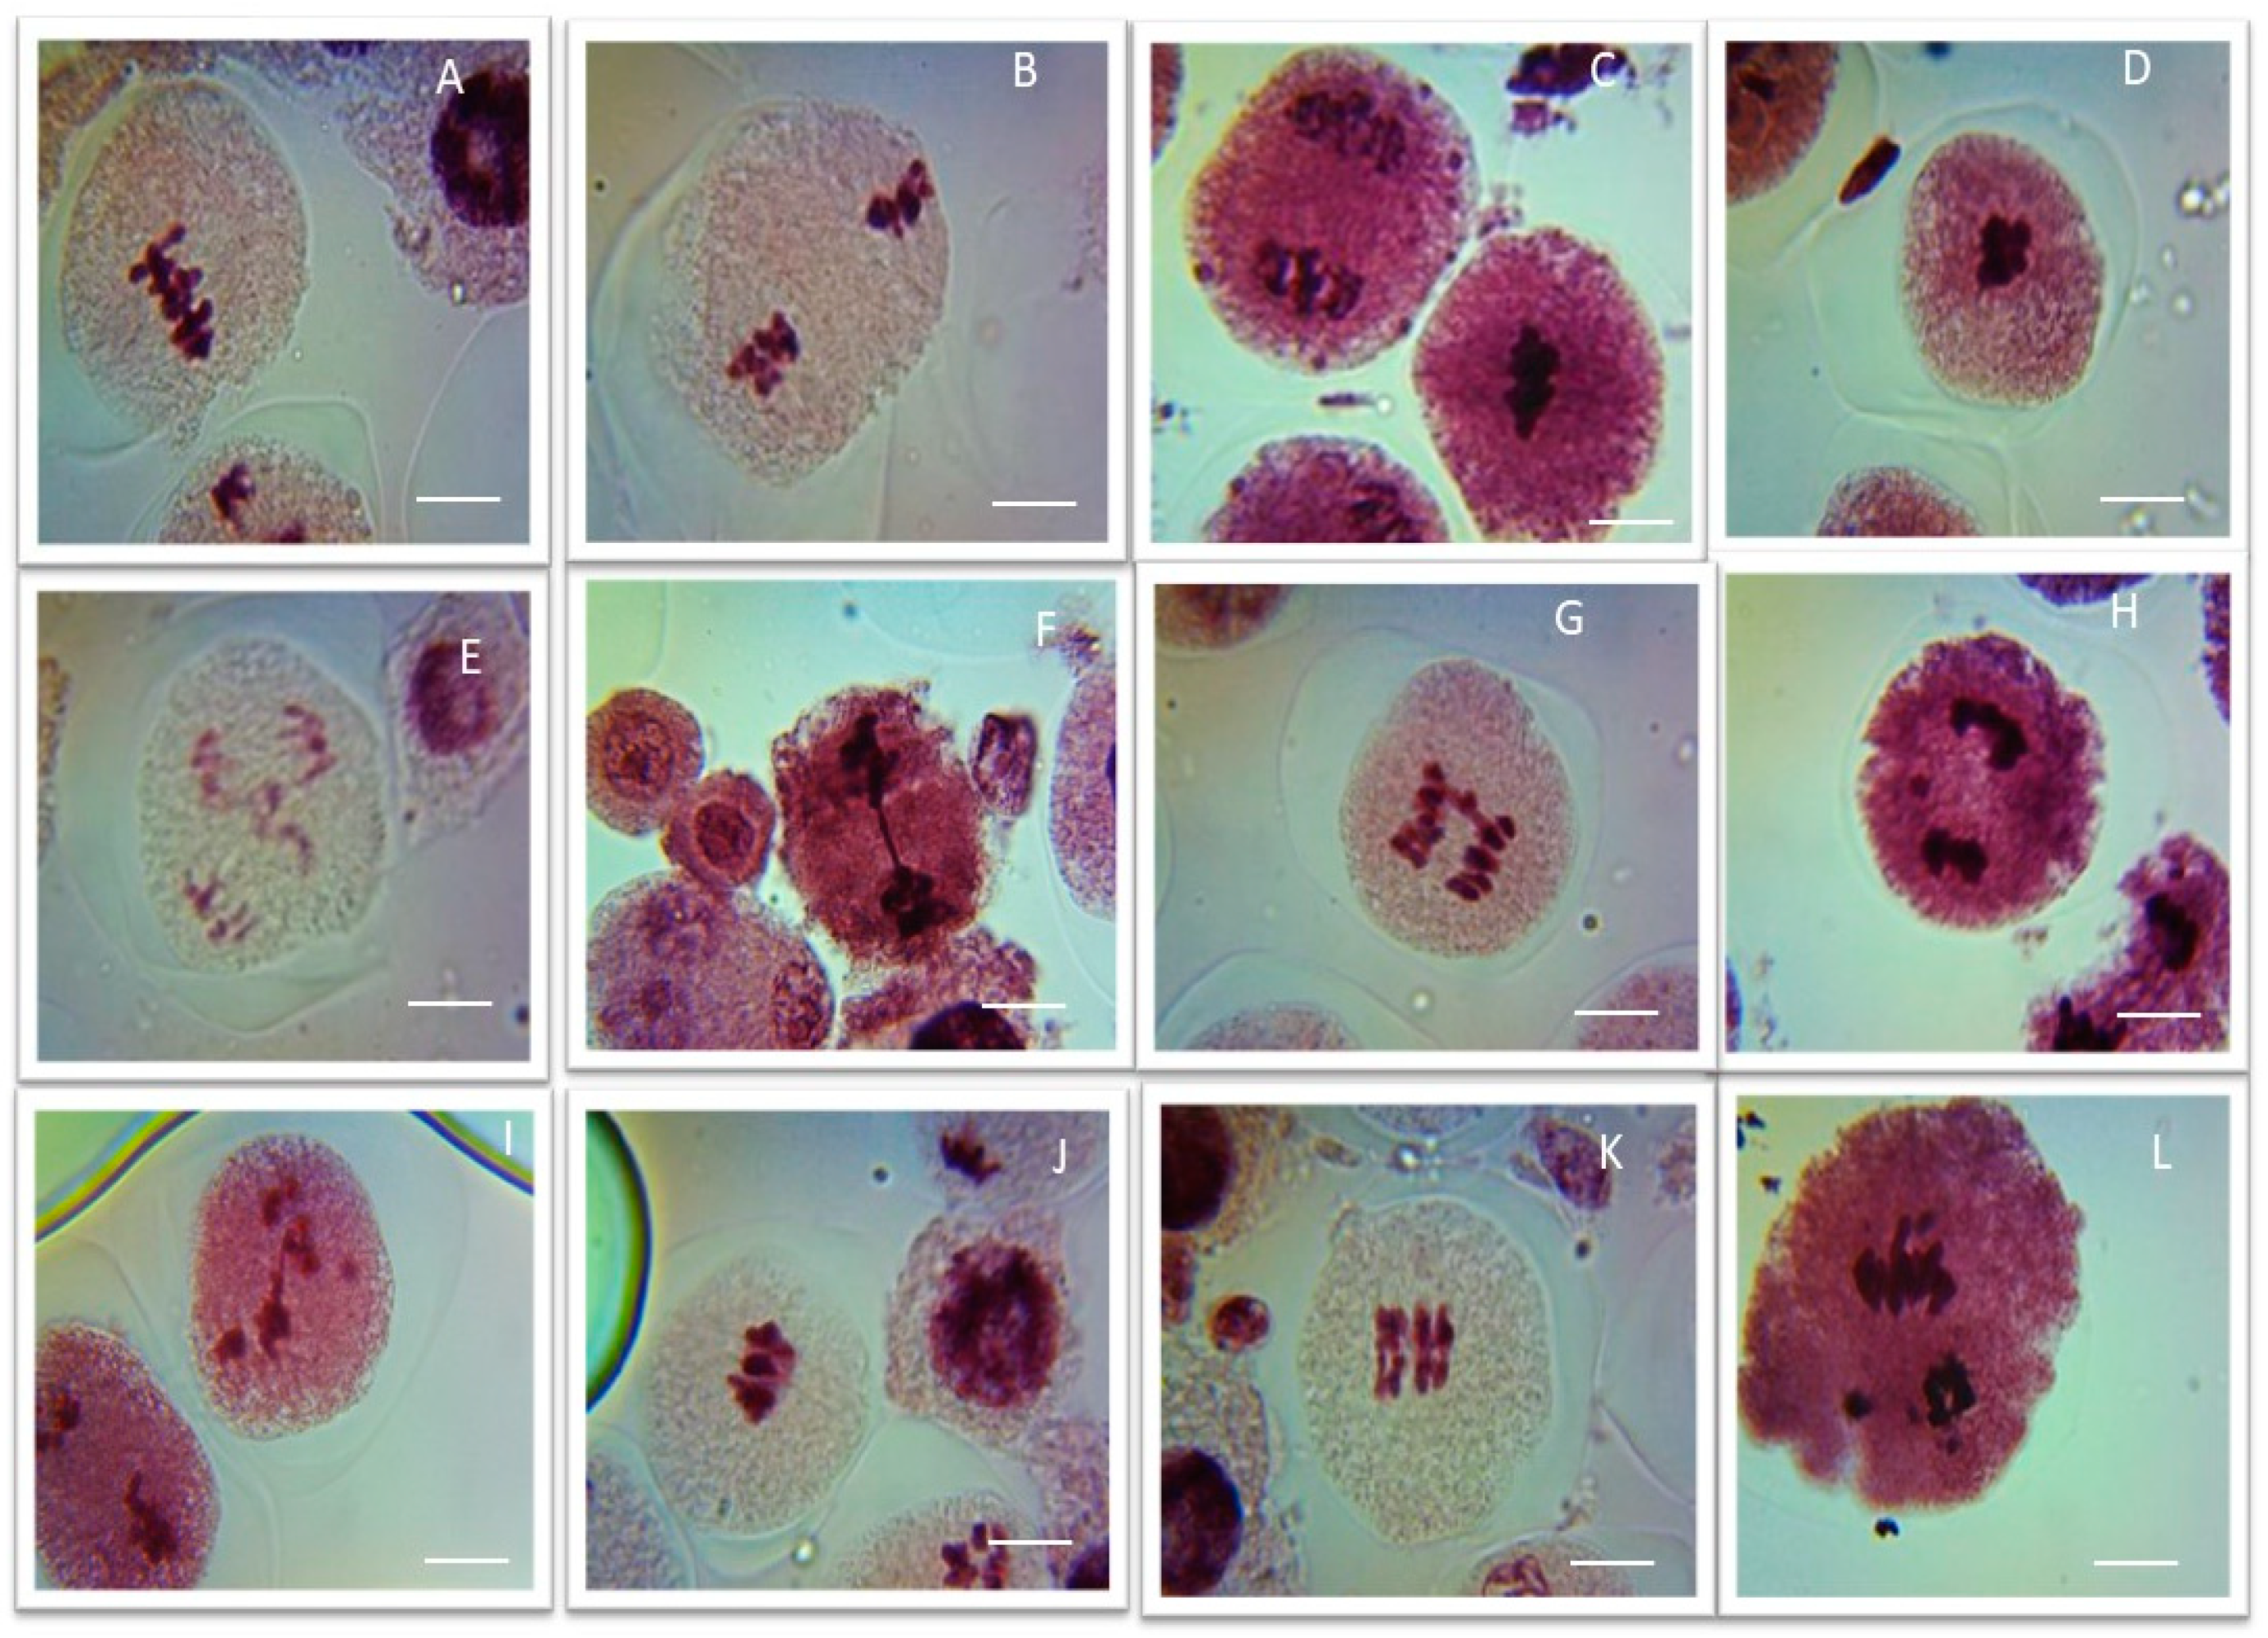
3.4. Effects of ME and IM on CAF
In the control group, no aberrant metaphases I and II or anaphases I and II were reported in the PMCs of
P. sativum after treatment with double distilled water for 1, 3, and 6 h (
Table 4,
Table 5 and
Table 6 and
Figure 5). In plants treated with ME for 1 h, the percentage of aberrant metaphases I and II and anaphases I and II increased as the concentration of ME increased. The common aberrations were PS (0.52%) at a 0.1% concentration and STC (0.55%), BR (0.88%), and PS (0.58%) at a 0.2% concentration in comparison to the control group. However, a 0.3% to 0.5% increase in the concentration resulted in a very significant increase (
p < 0.01) in the number of aberrant cells. The maximal number of aberrant cells was found at a concentration of 0.5% for CNU (2.26%), STC (2.45%), BR (1.76%), LG (1.50%), SA (1.66%), and PS (1.12%) compared to the control group. In plants treated with ME for 3 h, the percentage of aberrant metaphases I and II and anaphases I and II increased as the concentration of ME increased. At a 0.1% concentration, common aberrations were CNU (1.05%), LG (1.55%), SA (1.26%), and PS (1.26%); at a 0.2% concentration, they were CNU (2.56%), BR (1.48%) LG (2.20%), STC (1.14%), and PS (2.67%) in comparison to the control group. Further, a 0.3% to 0.5% increase in the concentration resulted in a very significant increase (
p < 0.01) in the number of aberrant cells. The maximal number of aberrant cells was found at a concentration of 0.5% in CNU (4.12%), STC (3.0%), BR (4.75%), LG (5.40%), SA (6.76%), and PS (6.22%) compared to the control group.
In plants treated with ME for 6 h, the percentage of aberrant metaphases I and II and anaphases I and II increased with an increase in the concentration of ME. At a 0.1% concentration, common aberrations were CNU (1.56%), LG (0.81%), SA (3.56%), and PS (1.67%) in comparison to the control group. Meanwhile, a 0.2% to 0.5% increase in the concentration resulted in a very significant increase (p < 0.01) in the number of aberrant cells. The maximal number of aberrant cells was found at a concentration of 0.5%, namely, CNU (9.76%), STC (9.51%), BR (12.11%), LG (12.11%), SA (13.05%), and PS (10.44%), compared to the control group.
In plants treated with IM for 1 h, the percentage of aberrant metaphases I and II and anaphases I and II increased as the concentration of IM increased. At the lowest concentration (0.1%), no chromosomal aberrations were found; at 0.2%, aberrations were CNU (0.67%), BR (0.77%), LG (0.98%), and PS (0.80%) in comparison to the control group. A further increase in the IM concentration from 0.3% to 0.5% resulted in a very significant increase (p < 0.01) in the number of aberrant cells. The maximal number of aberrant cells was found at a concentration of 0.5%, namely, CNU (2.23%), STC (1.94%), BR (2.16%), LG (2.1%), SA (2.1%), and PS (2.3%), compared to the control.
Abbreviations used for
Table 4,
Table 5 and
Table 6: clumped nuclei (CNU), stickiness (STC), bridges (BR), laggards (LG), secondary association (SA), and precocious separation (PS).
In plants treated with IM for 3 h, the percentage of aberrant metaphases I and II, and anaphases I and II increased with an increase in the concentration of IM. At the lowest concentration (0.1%), chromosomal aberrations included CNU (1.72%), BR (1.05%), LG (1.23%), and PS (1.24%) compared to the control. Further increases in the IM concentration from 0.2% to 0.5% resulted in an increase (p < 0.05 and p < 0.01) in the number of aberrant cells. The maximal number of aberrant cells was found at a concentration of 0.5%, namely, CNU (5.13%), STC (6.12%), BR (5.63%), LG (6.29%), SA (4.80%), and PS (4.20%), in comparison to the control group. In plants treated with IM for 6 h, the percentage of aberrant metaphases I and II, and anaphases I and II increased with an increase in the IM concentration. The percentage of aberrant cells increased with an increase in the concentration of IM (0.1 to 0.5%) compared to the control. The maximal number of aberrant cells was found at a concentration of 0.5%, namely, CNU (8.7%), STC (6.8%), BR (15.55%), LG (12.50%), SA (11.9%), and PS (13.21%), in comparison to the control group.


