

Quantifying Catch Rates, Shark Abundance and Depredation Rate at a Spearfishing Competition on the Great Barrier Reef, Australia

 ,
,  ,
,
Abstract
Simple Summary
Abstract
1. Introduction
2. Materials and Methods
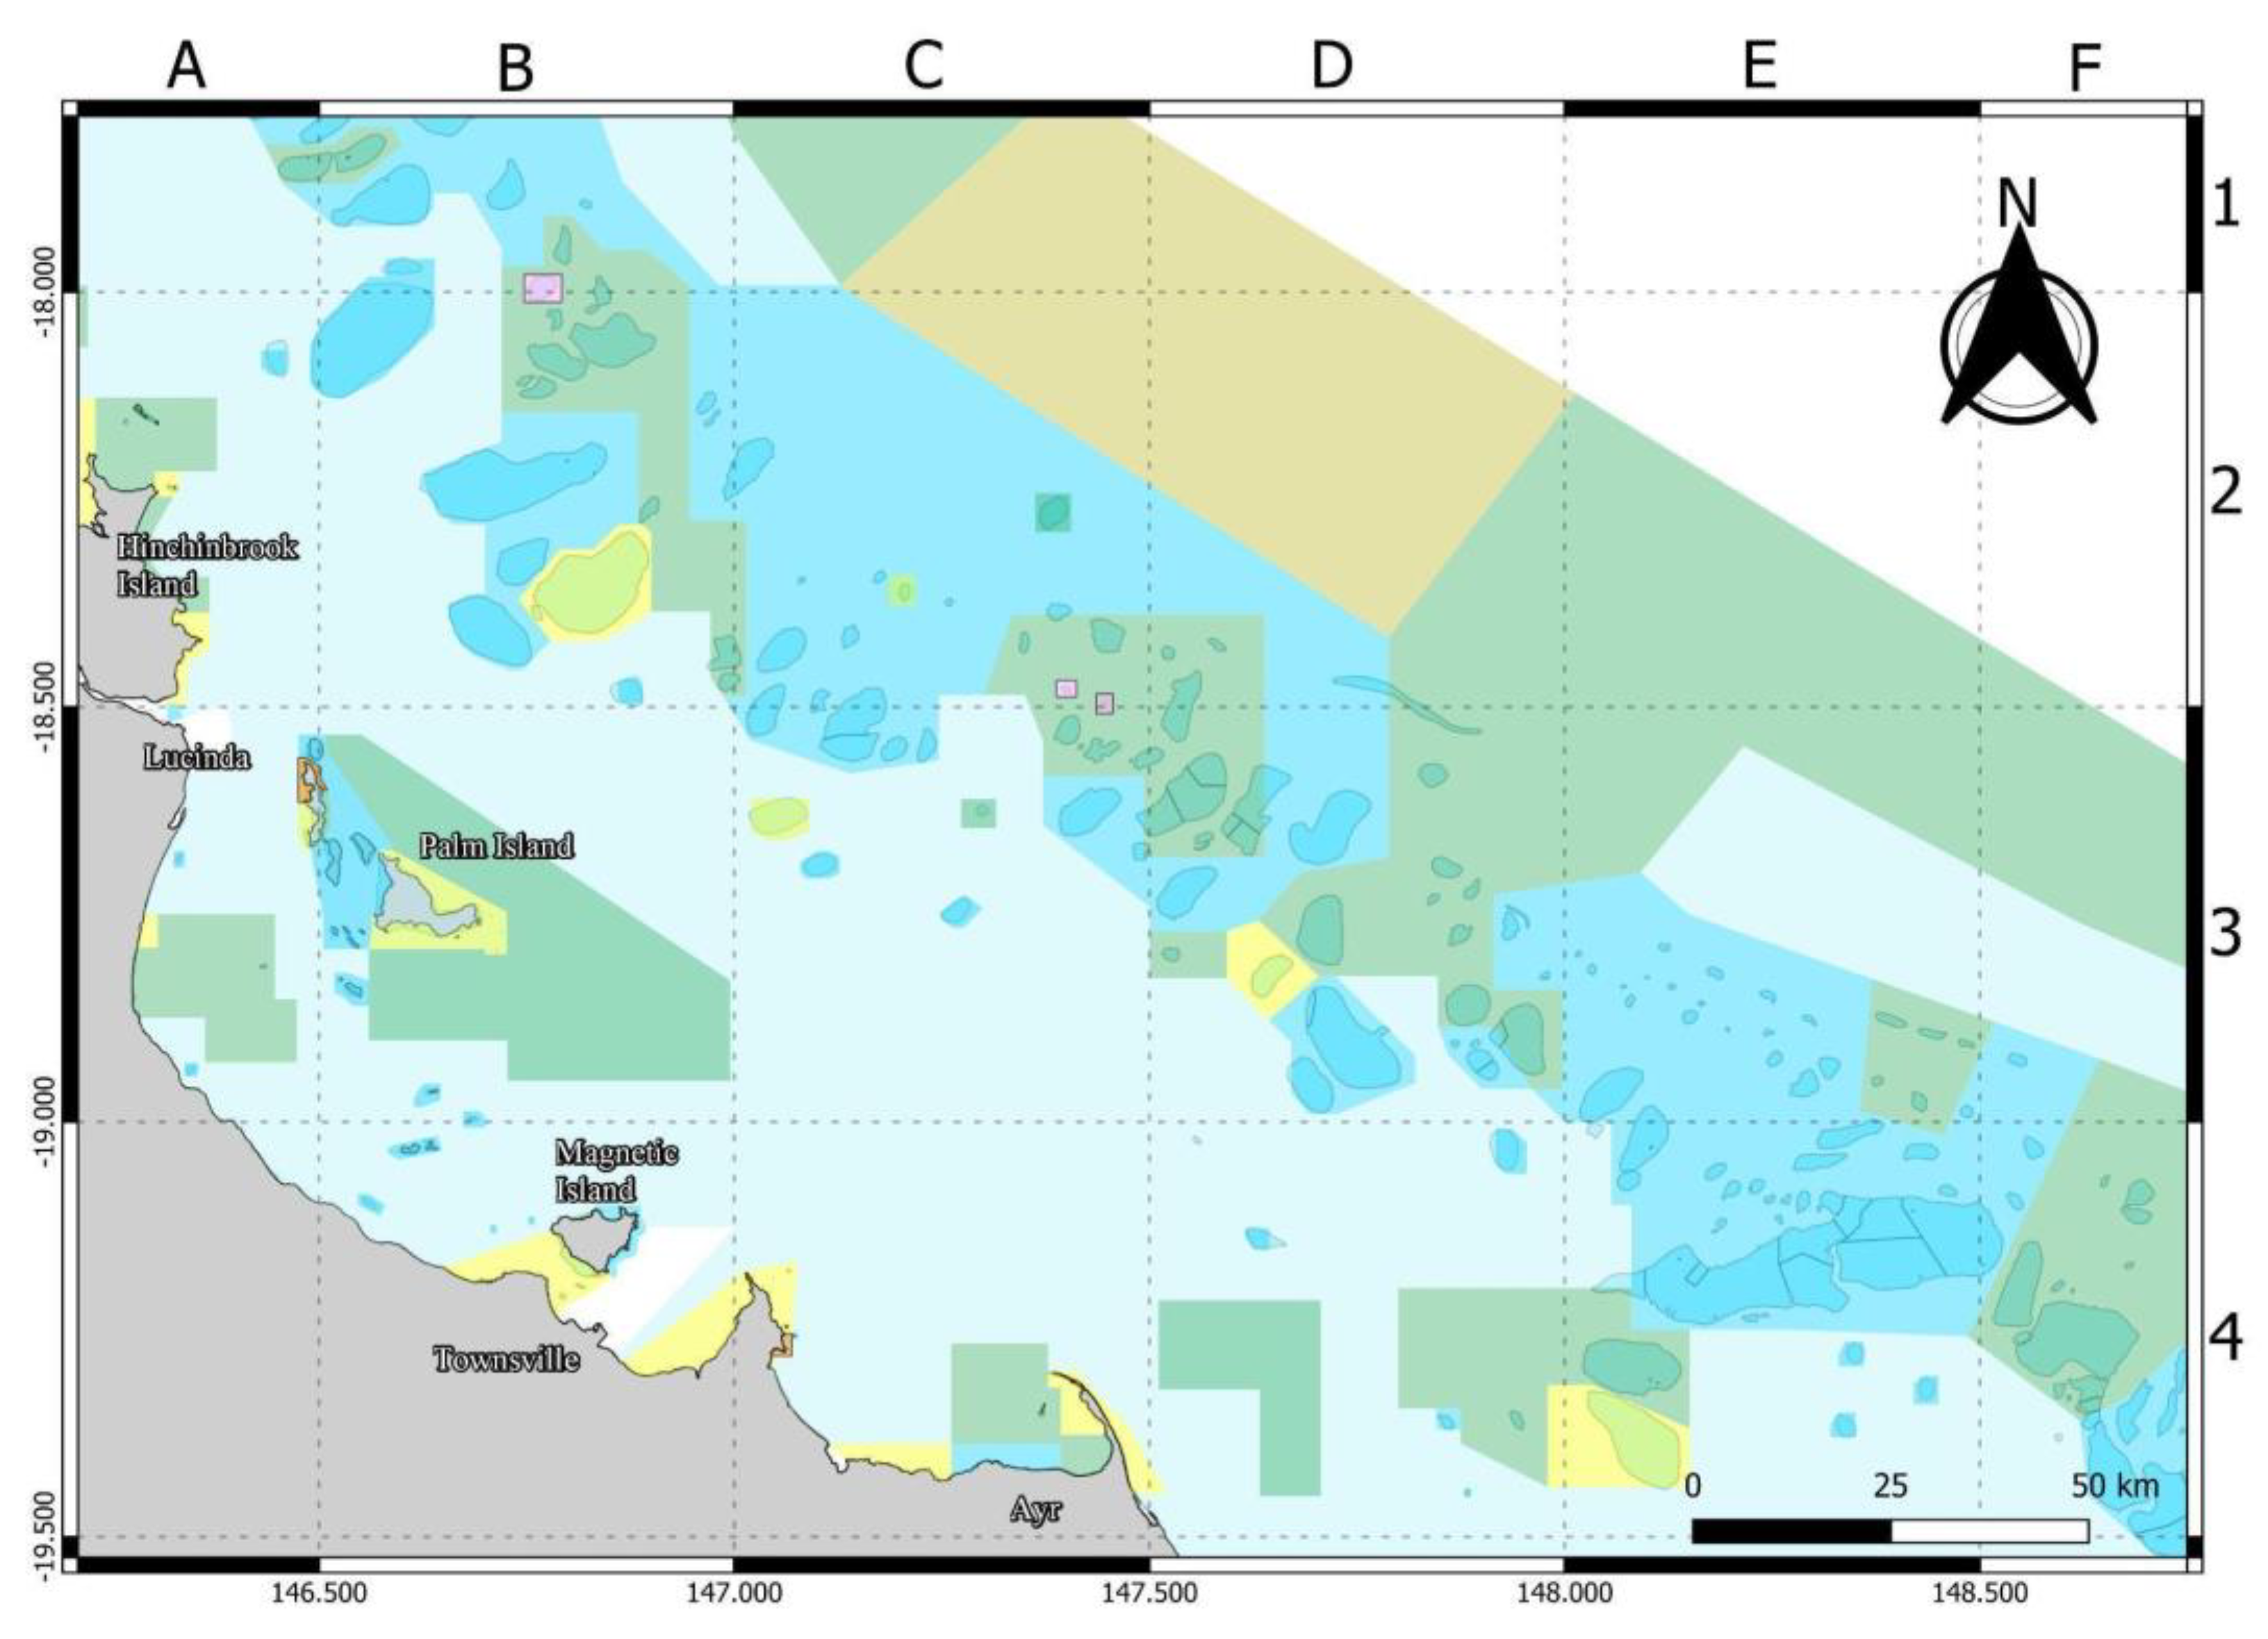
2.1. Study Area, Fisheries Management Arrangements and Competition Rules
2.2. Questionnaire, Interview and Spearfishing Methods
2.3. Statistical Analysis
2.4. Assessment to Inform Future Management
3. Results
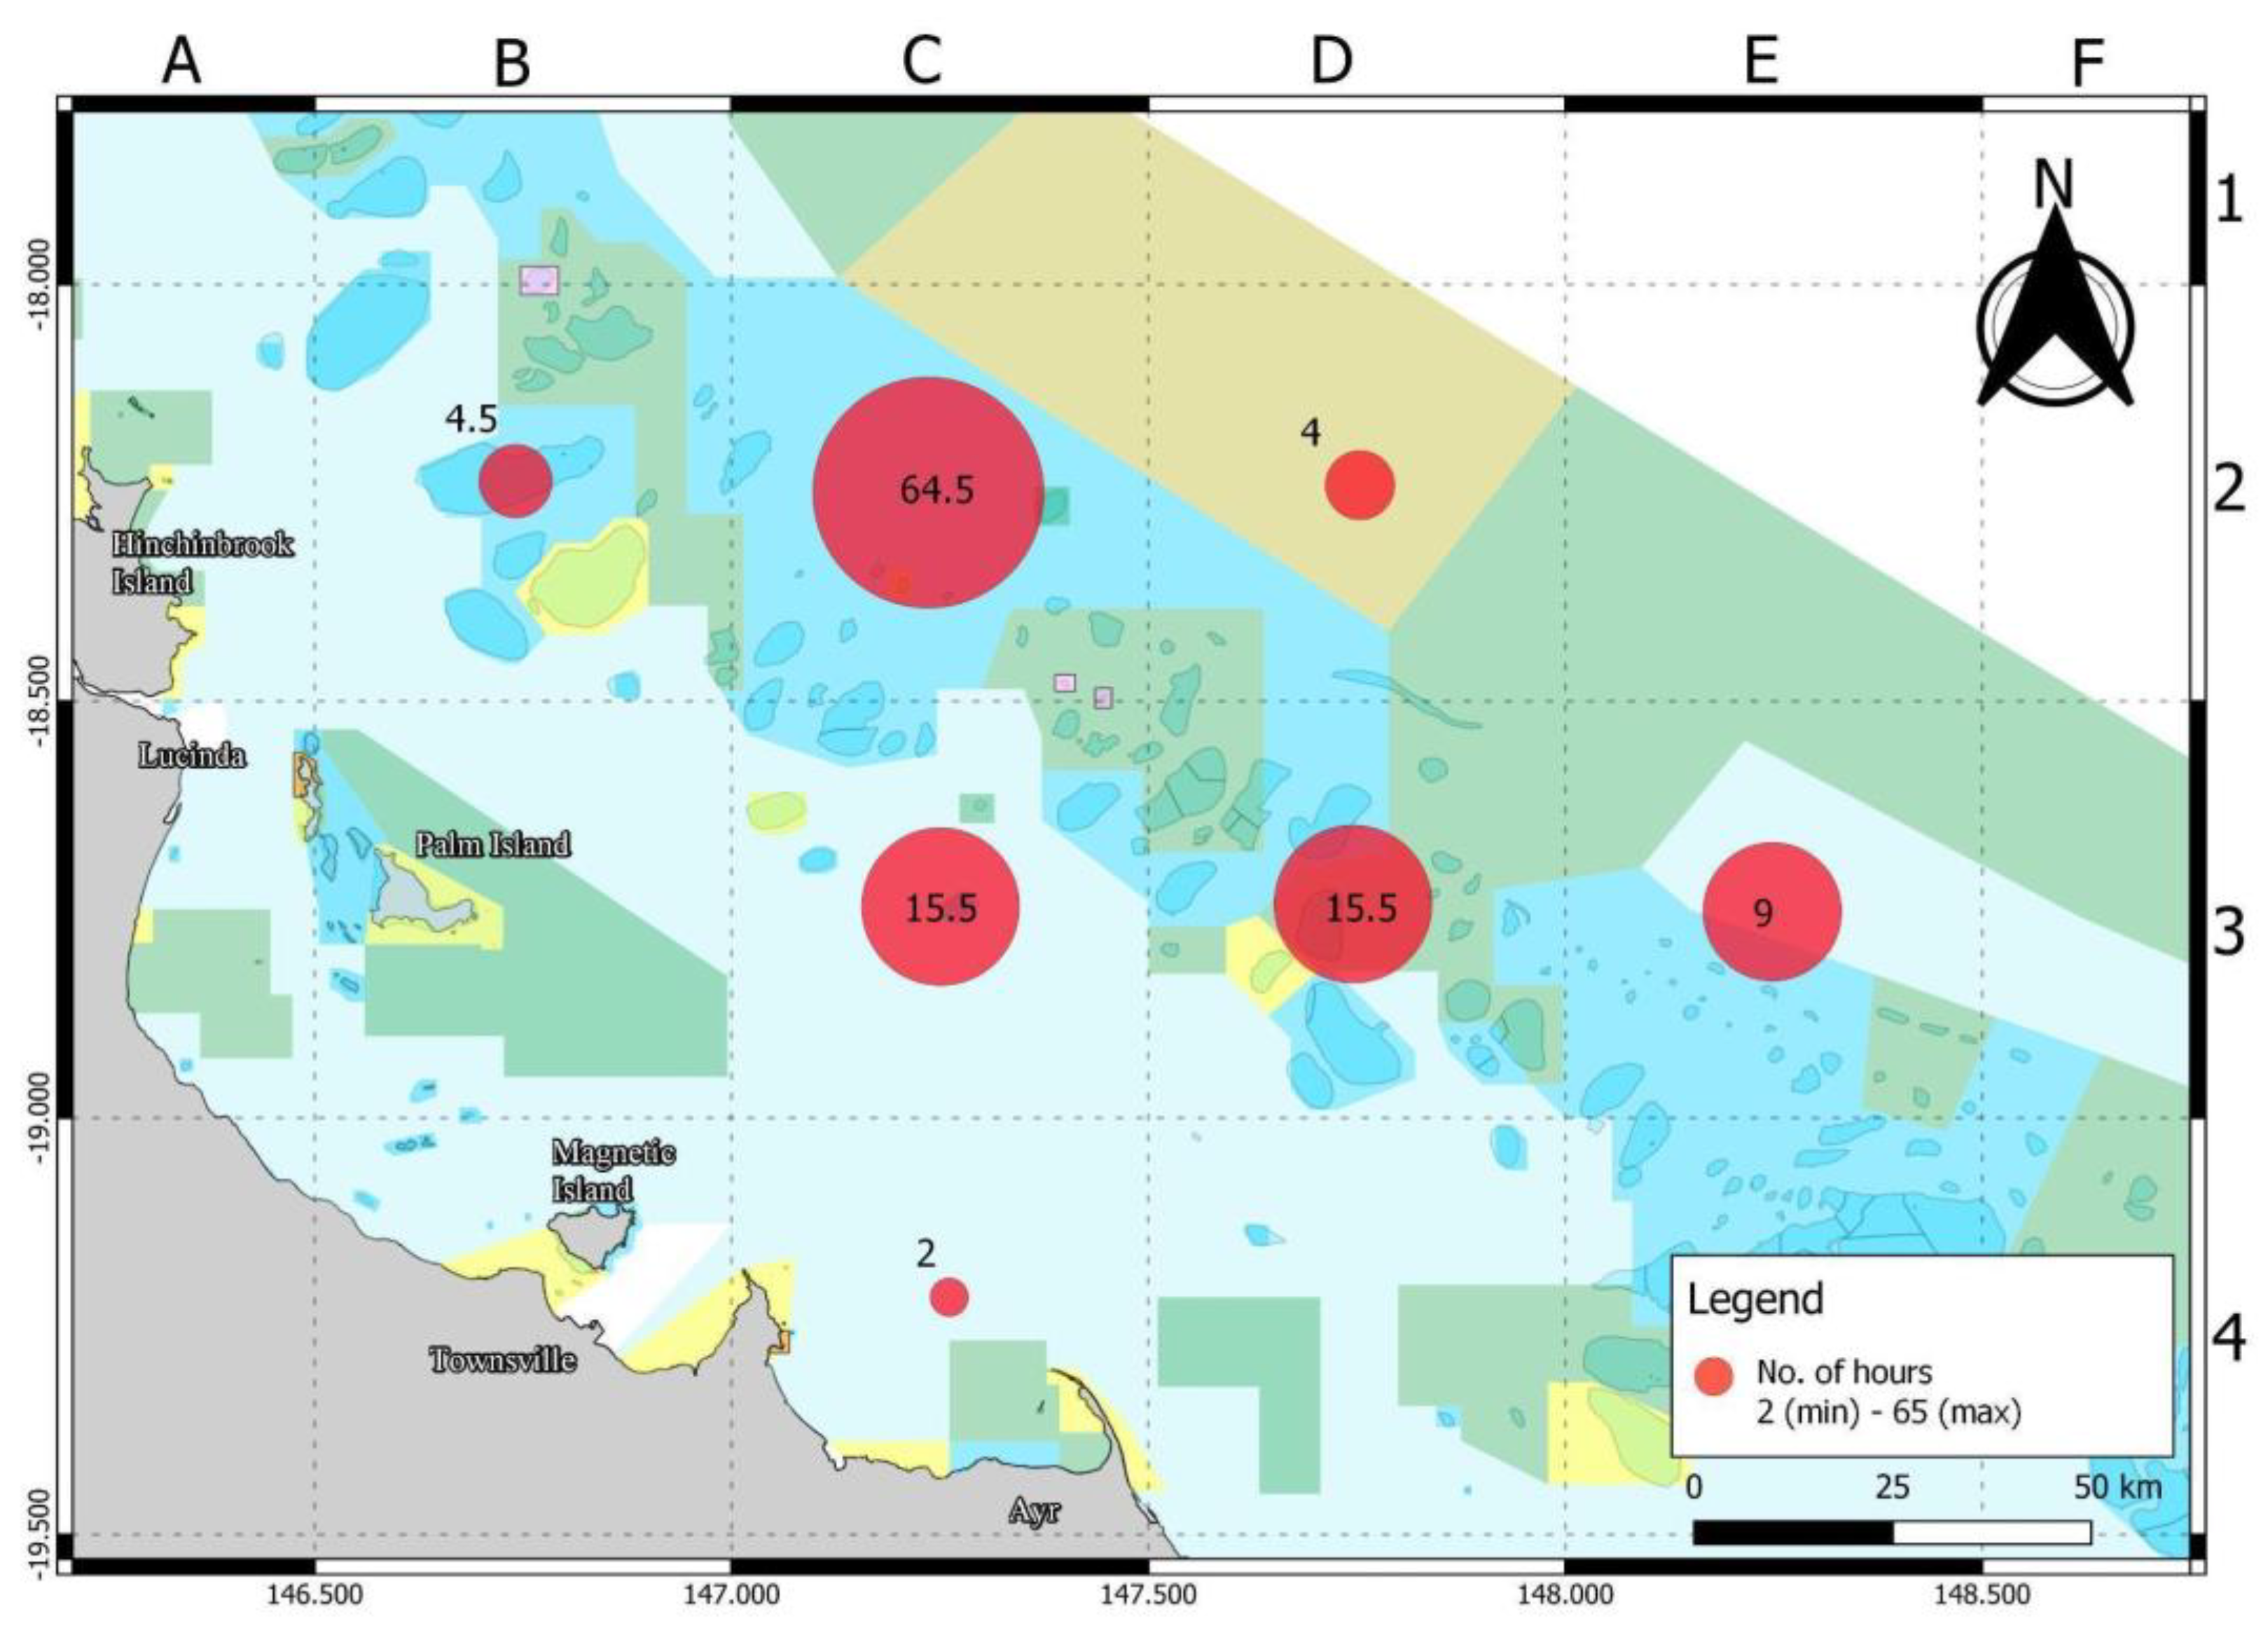
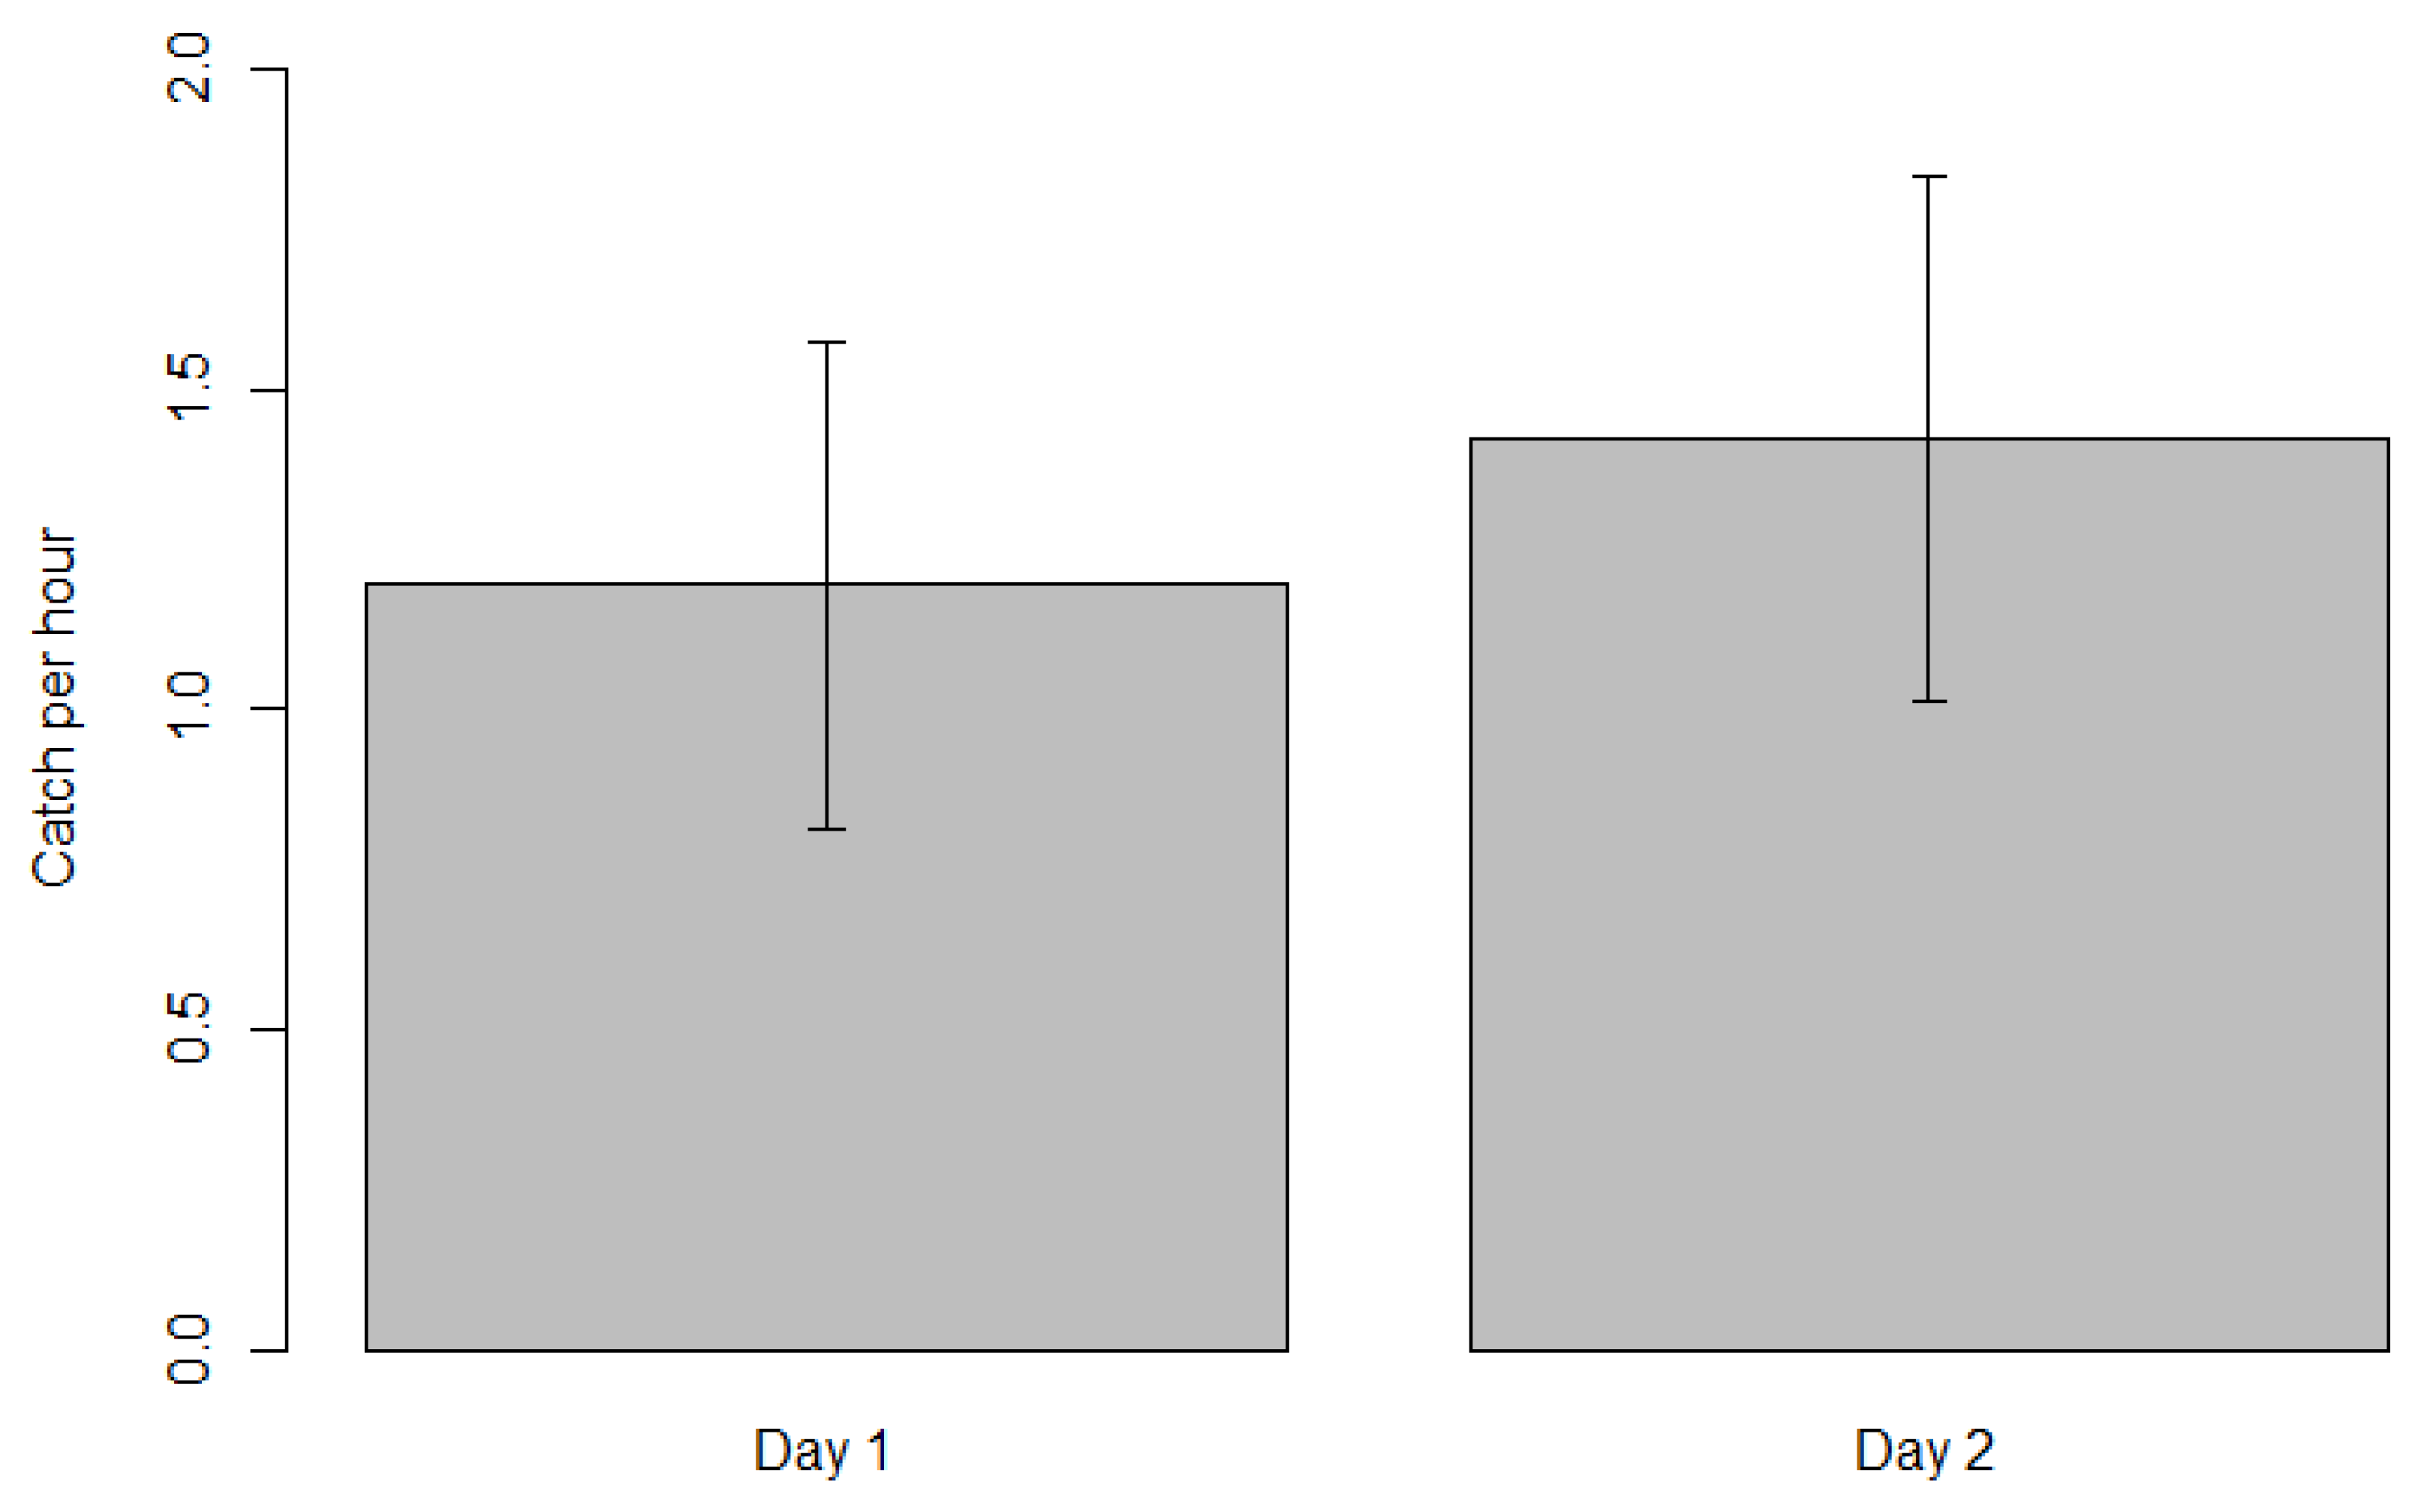
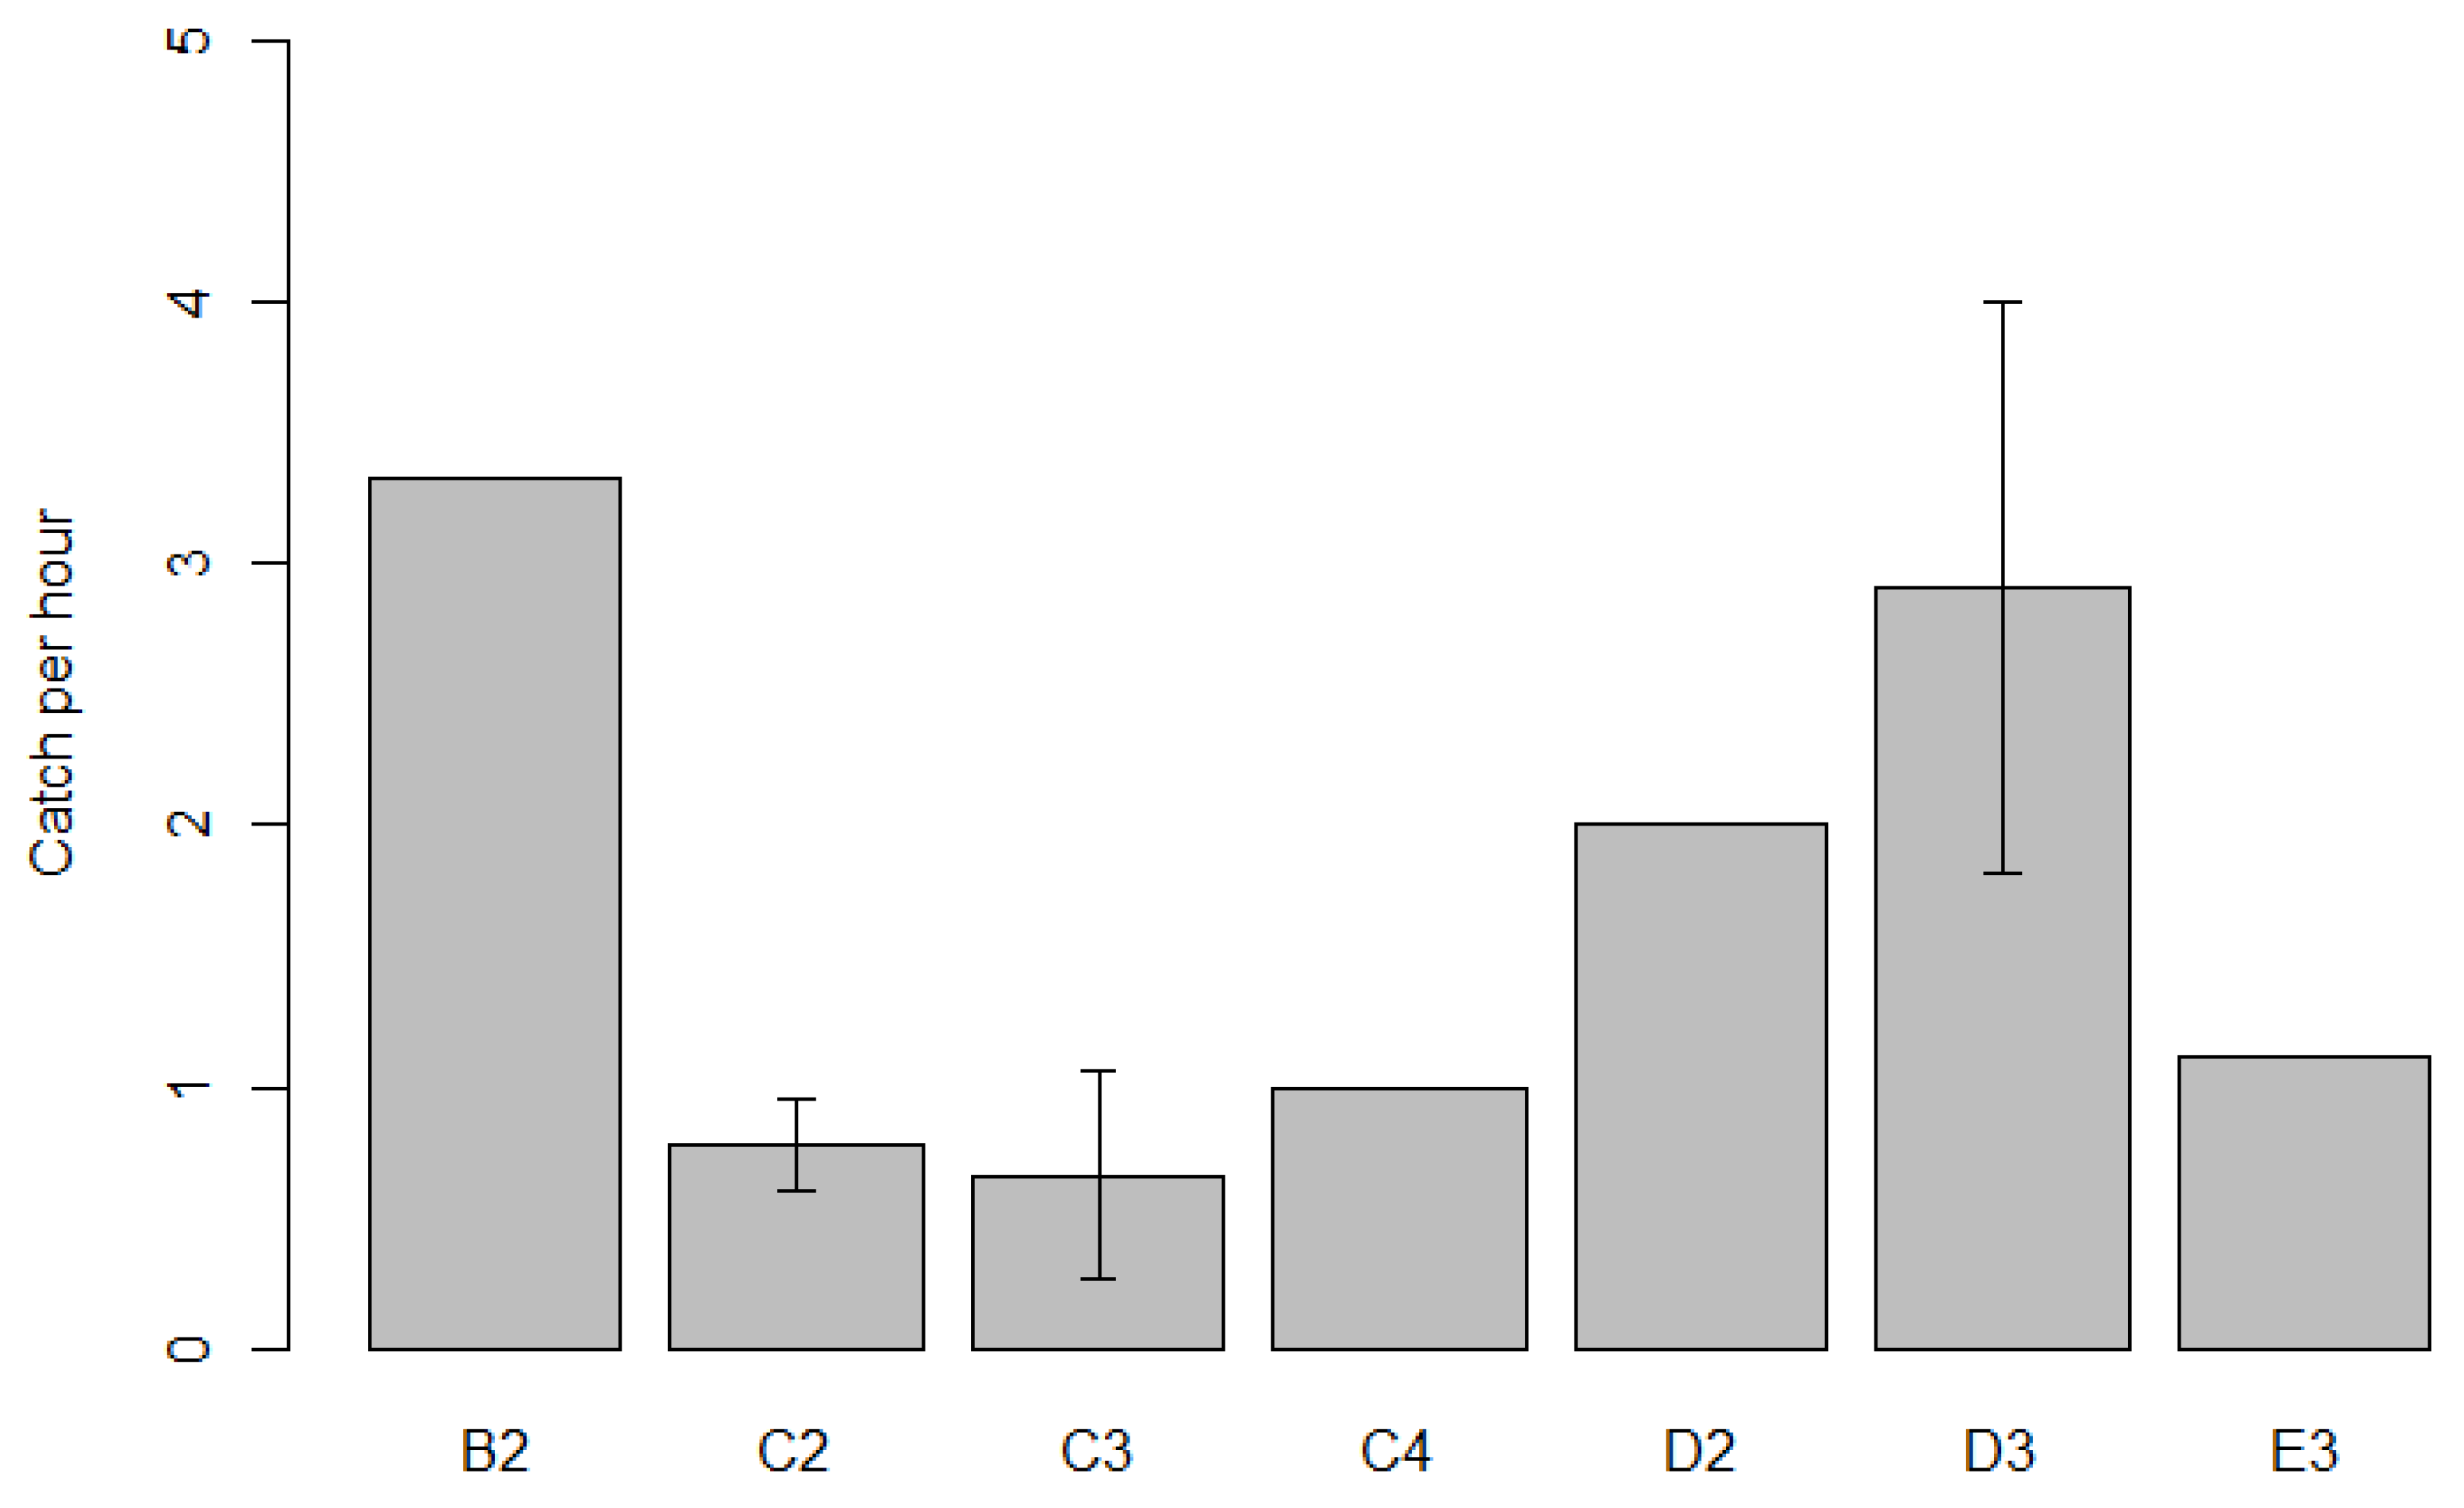
3.1. Fishing Effort
3.2. Catch
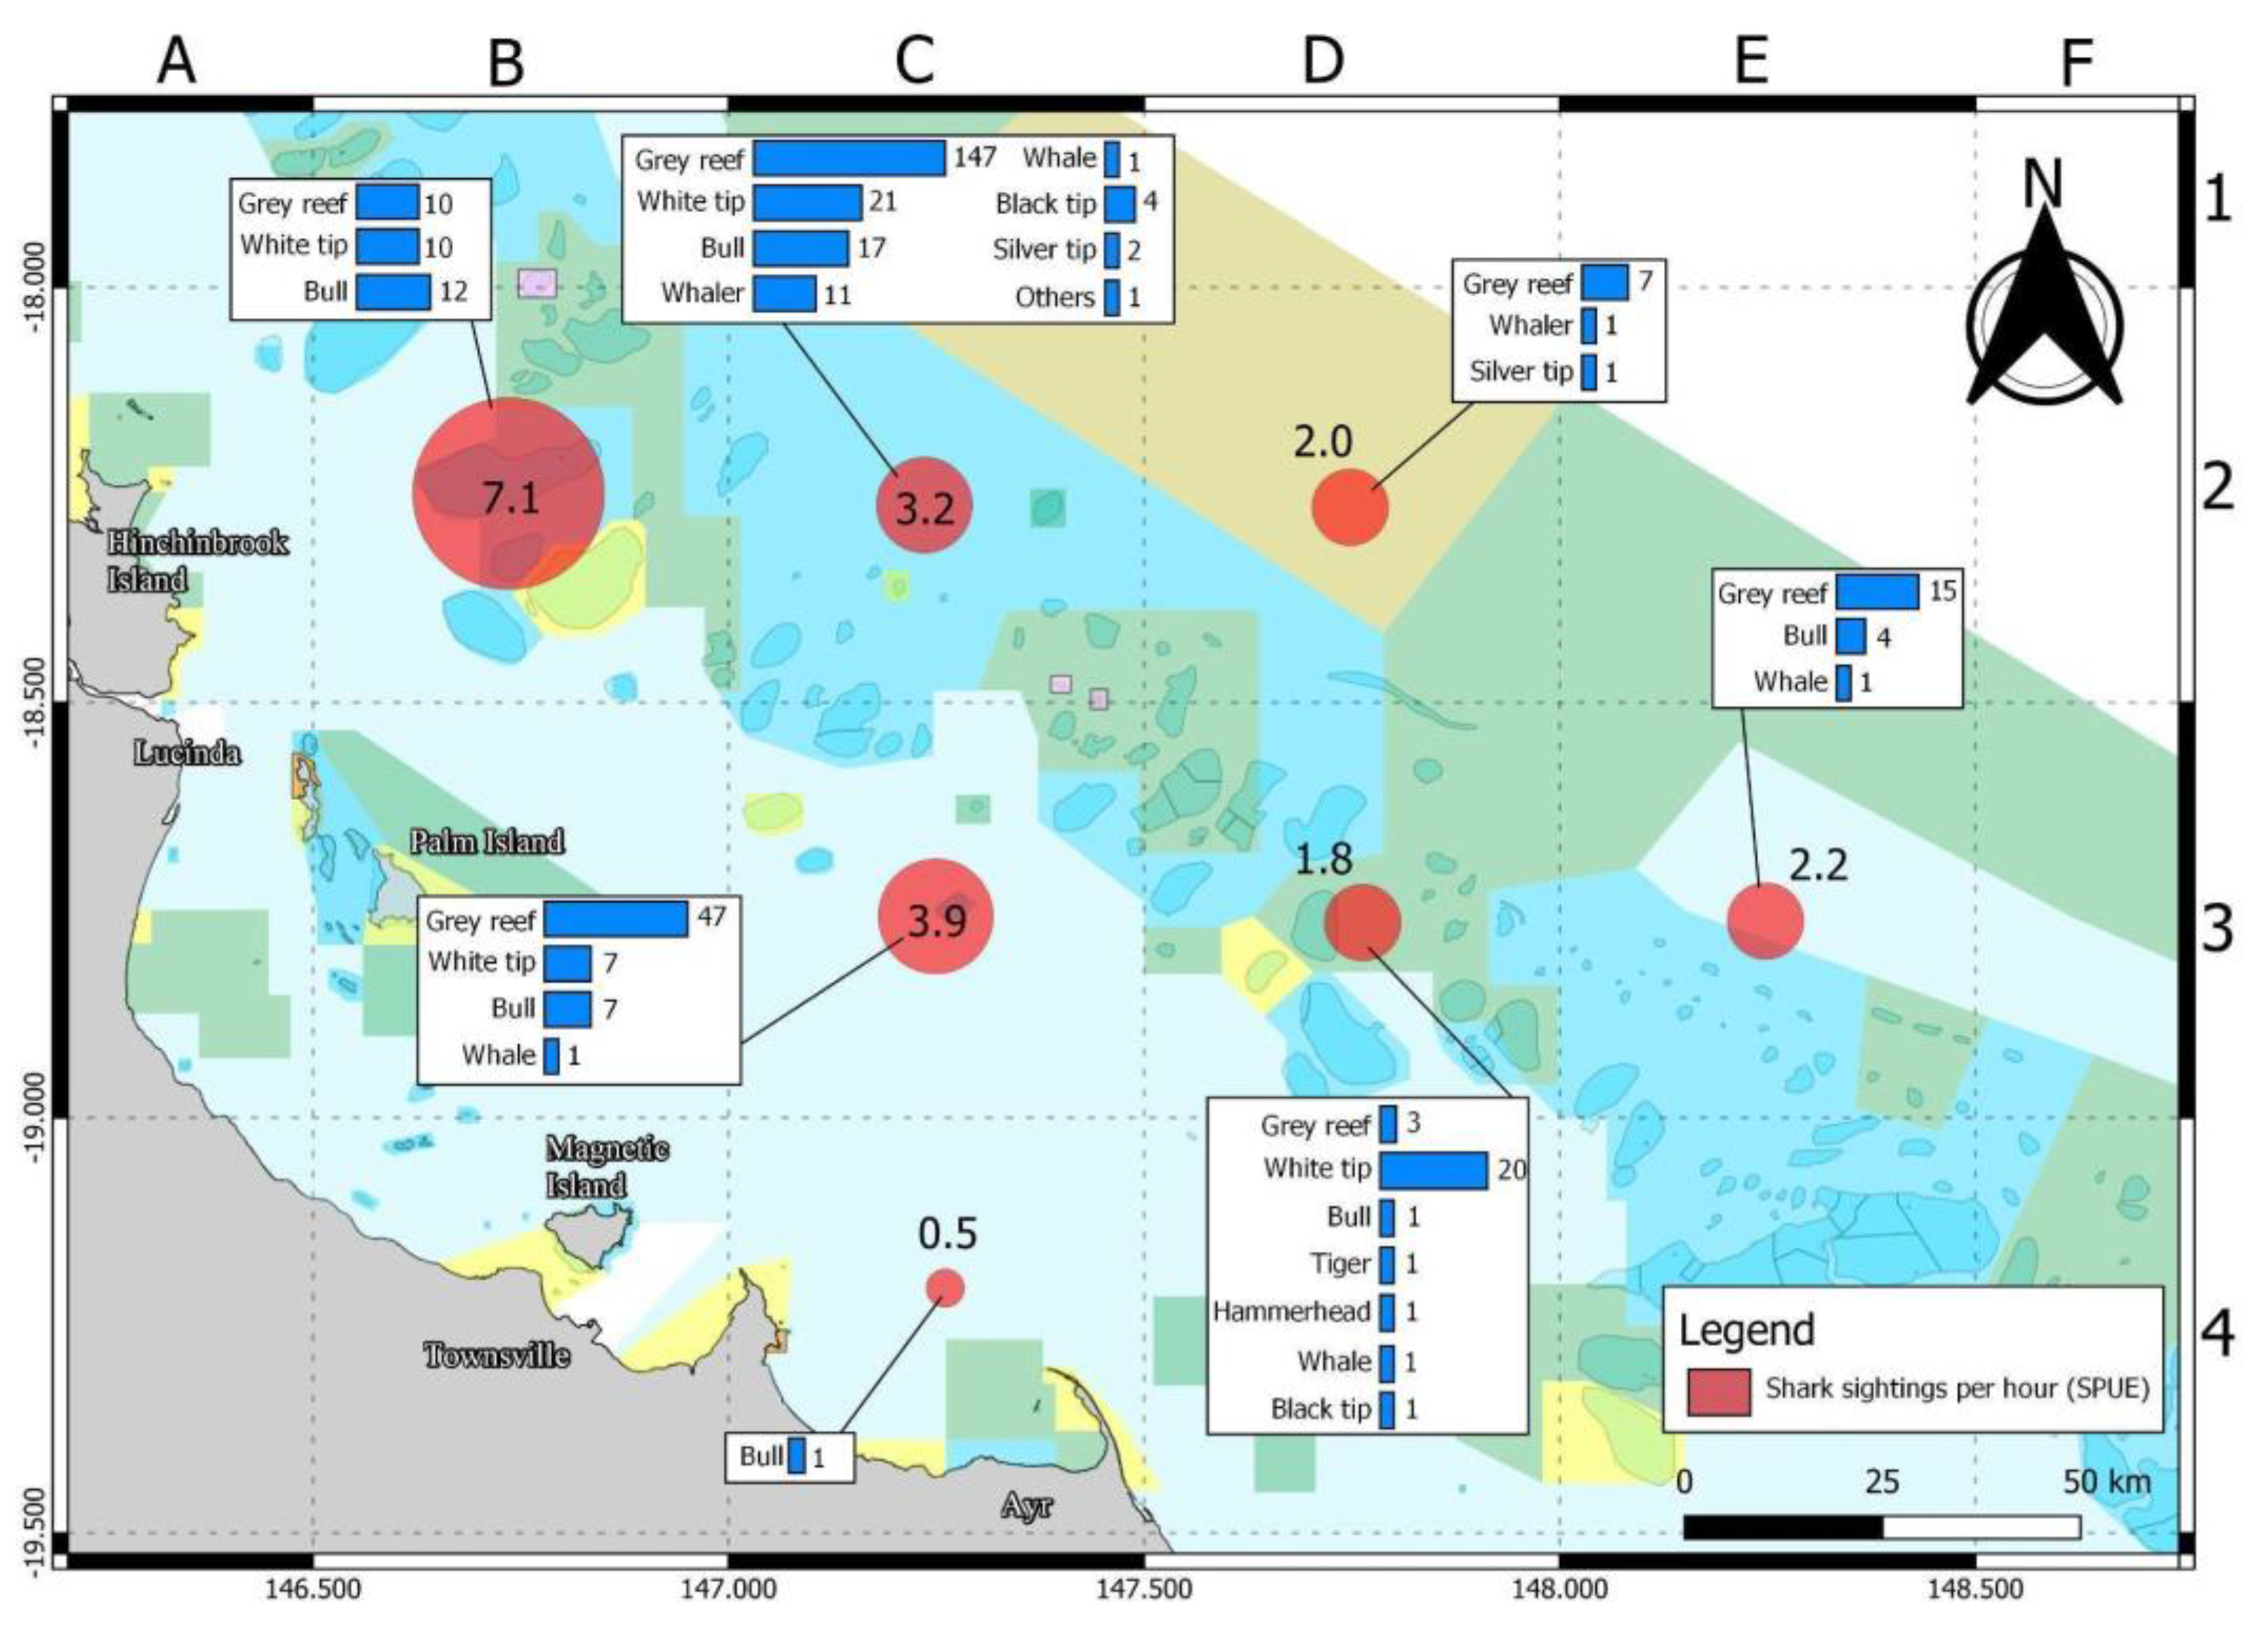
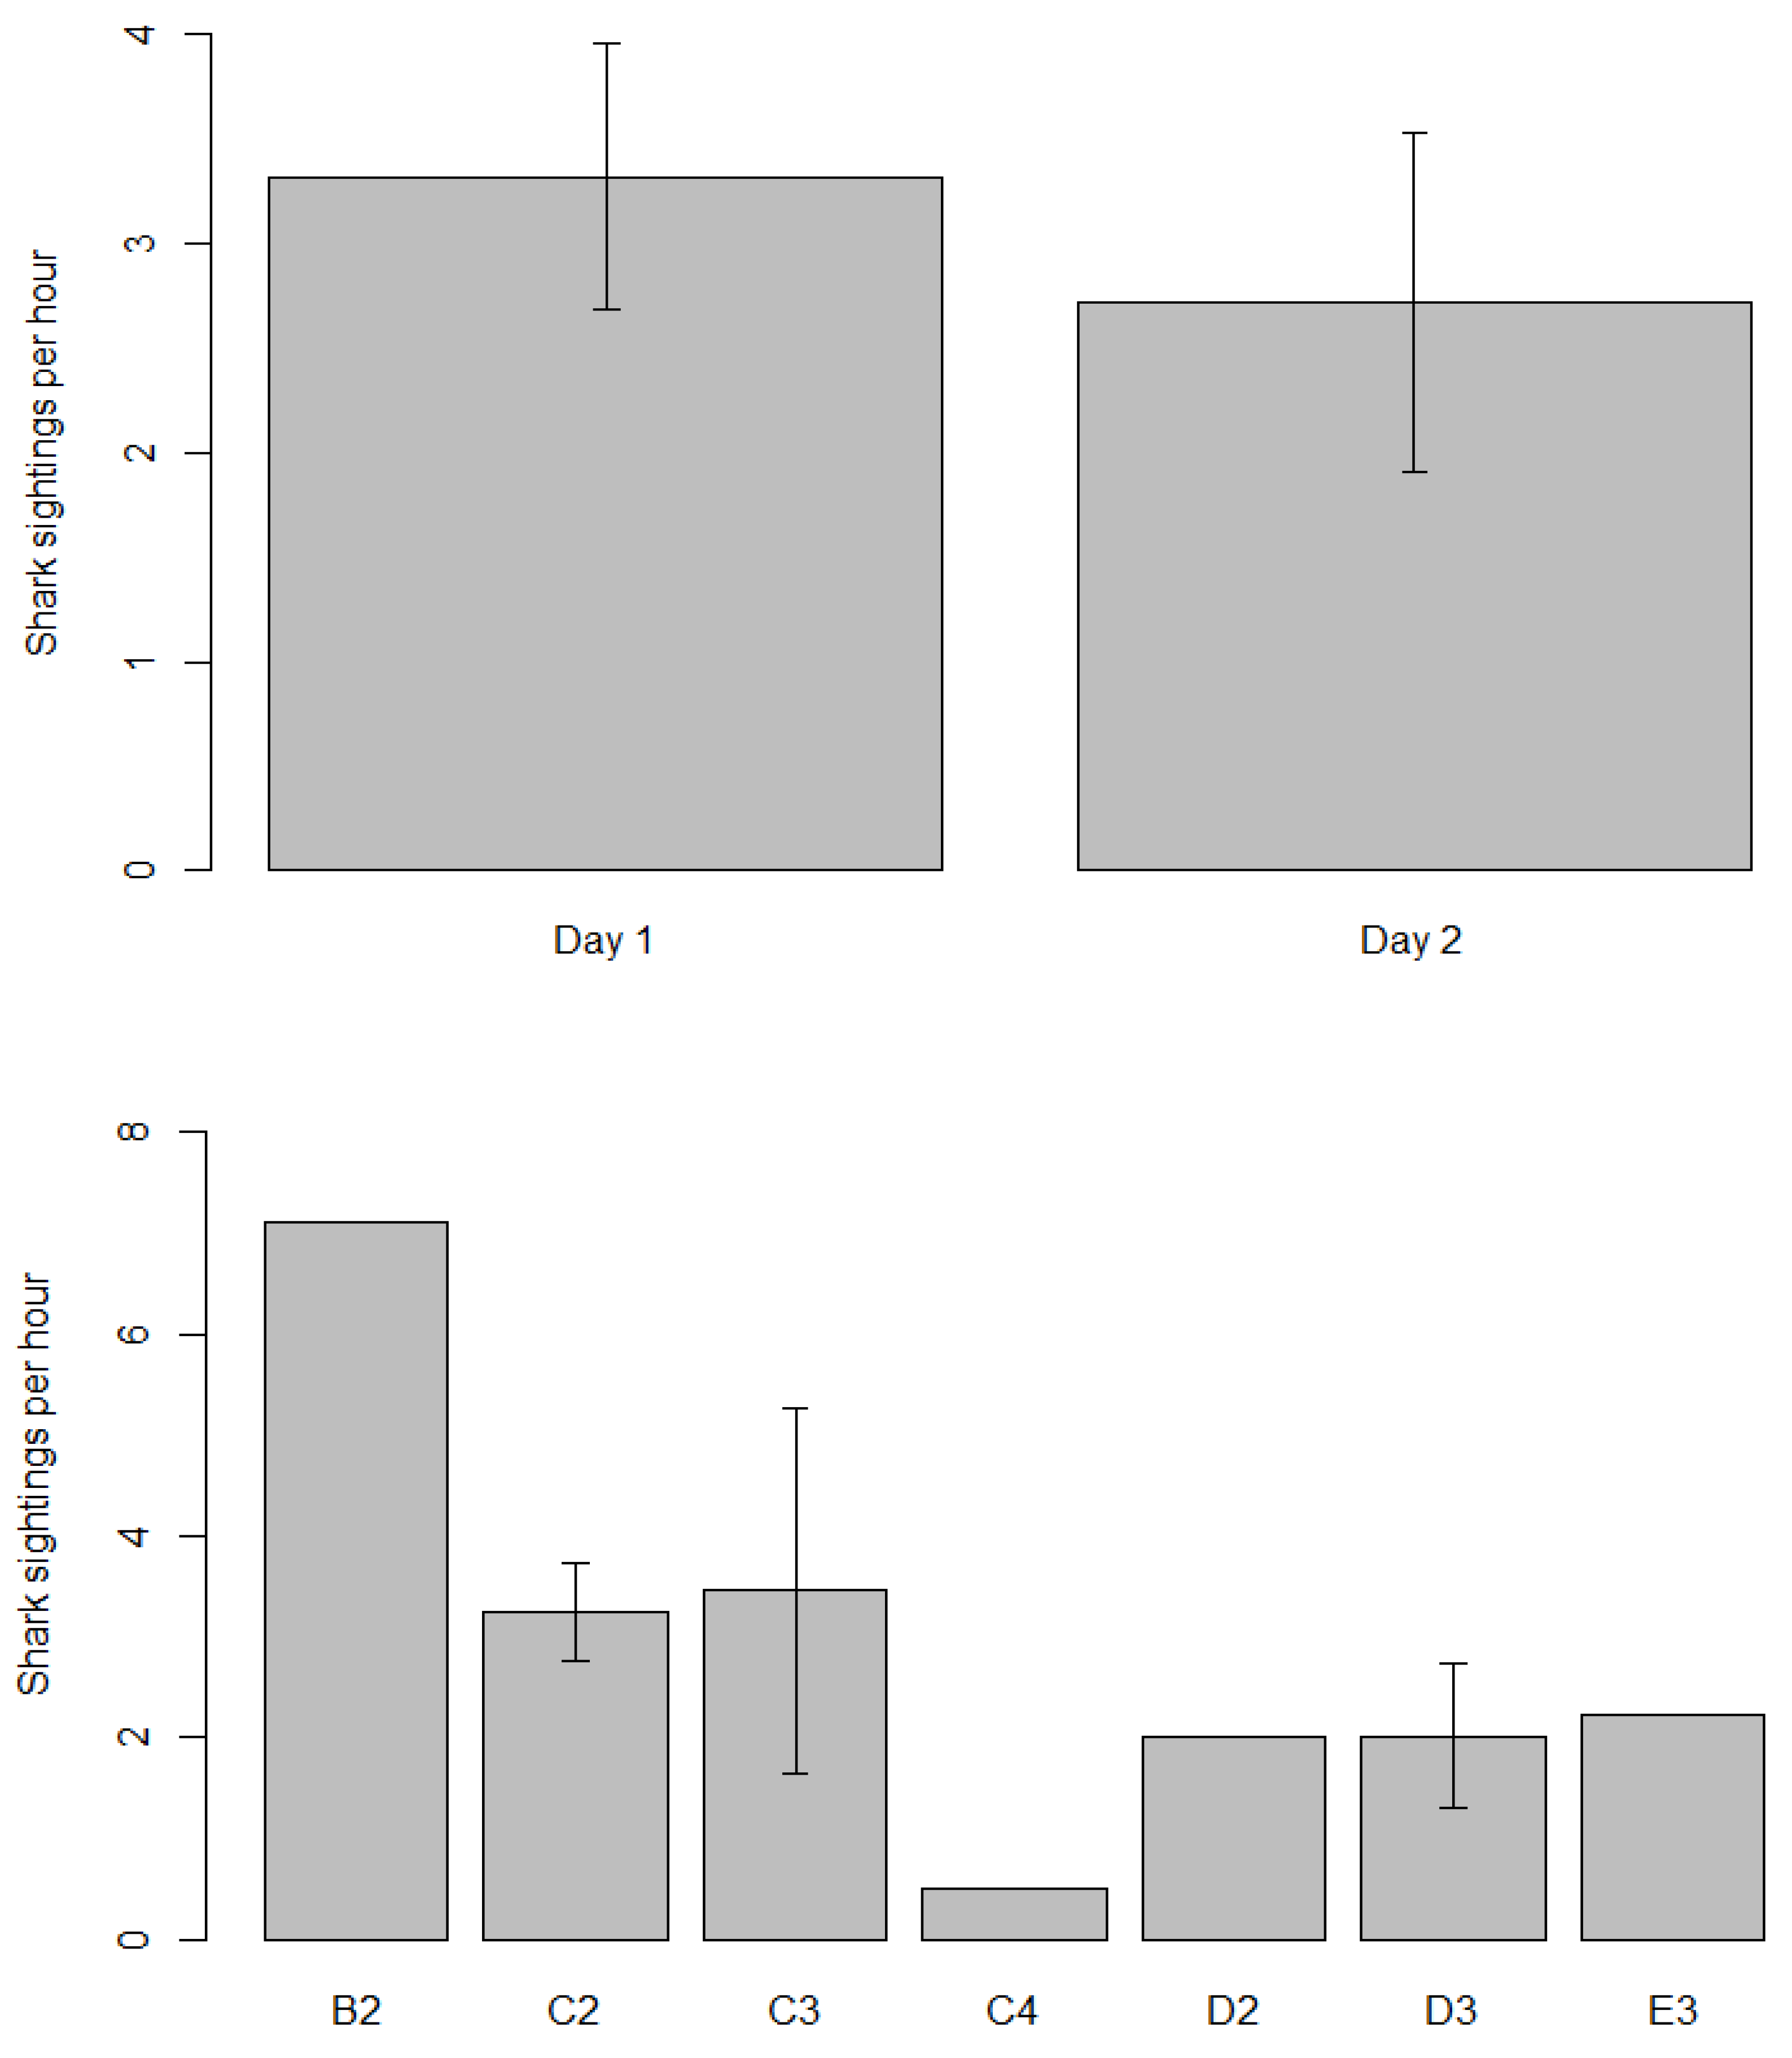
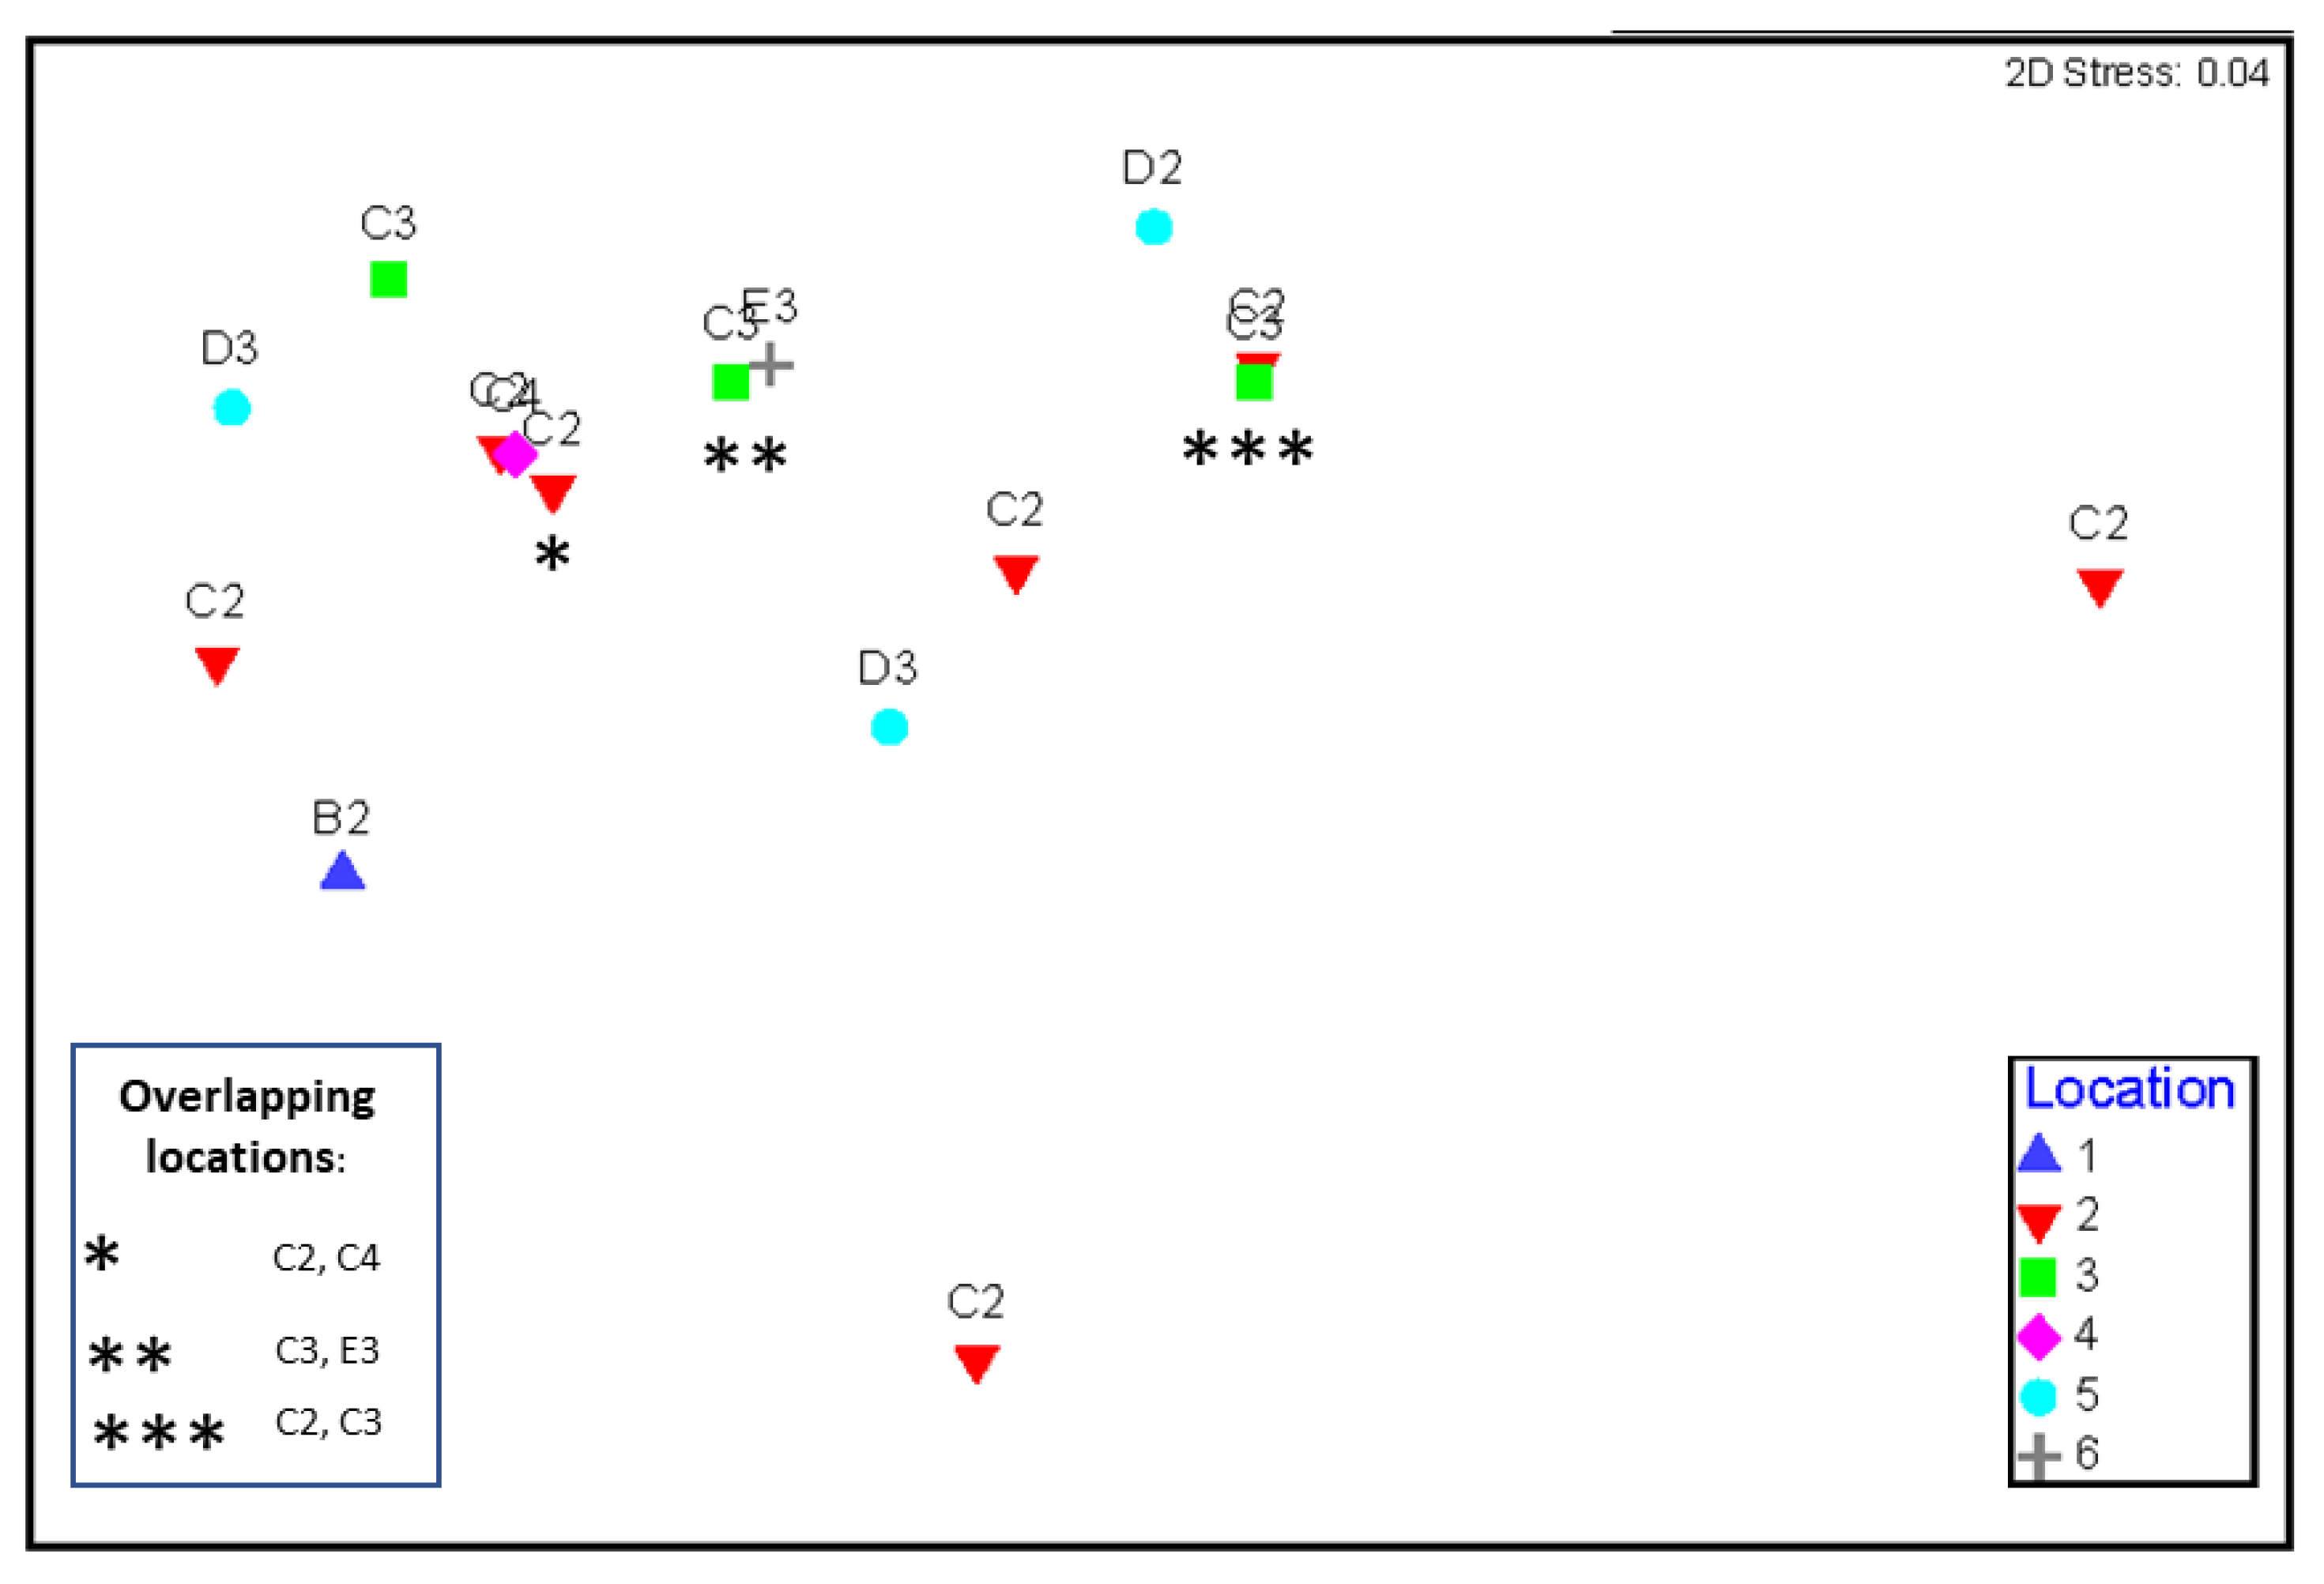
3.3. Shark Sightings
3.4. Shark Depredation
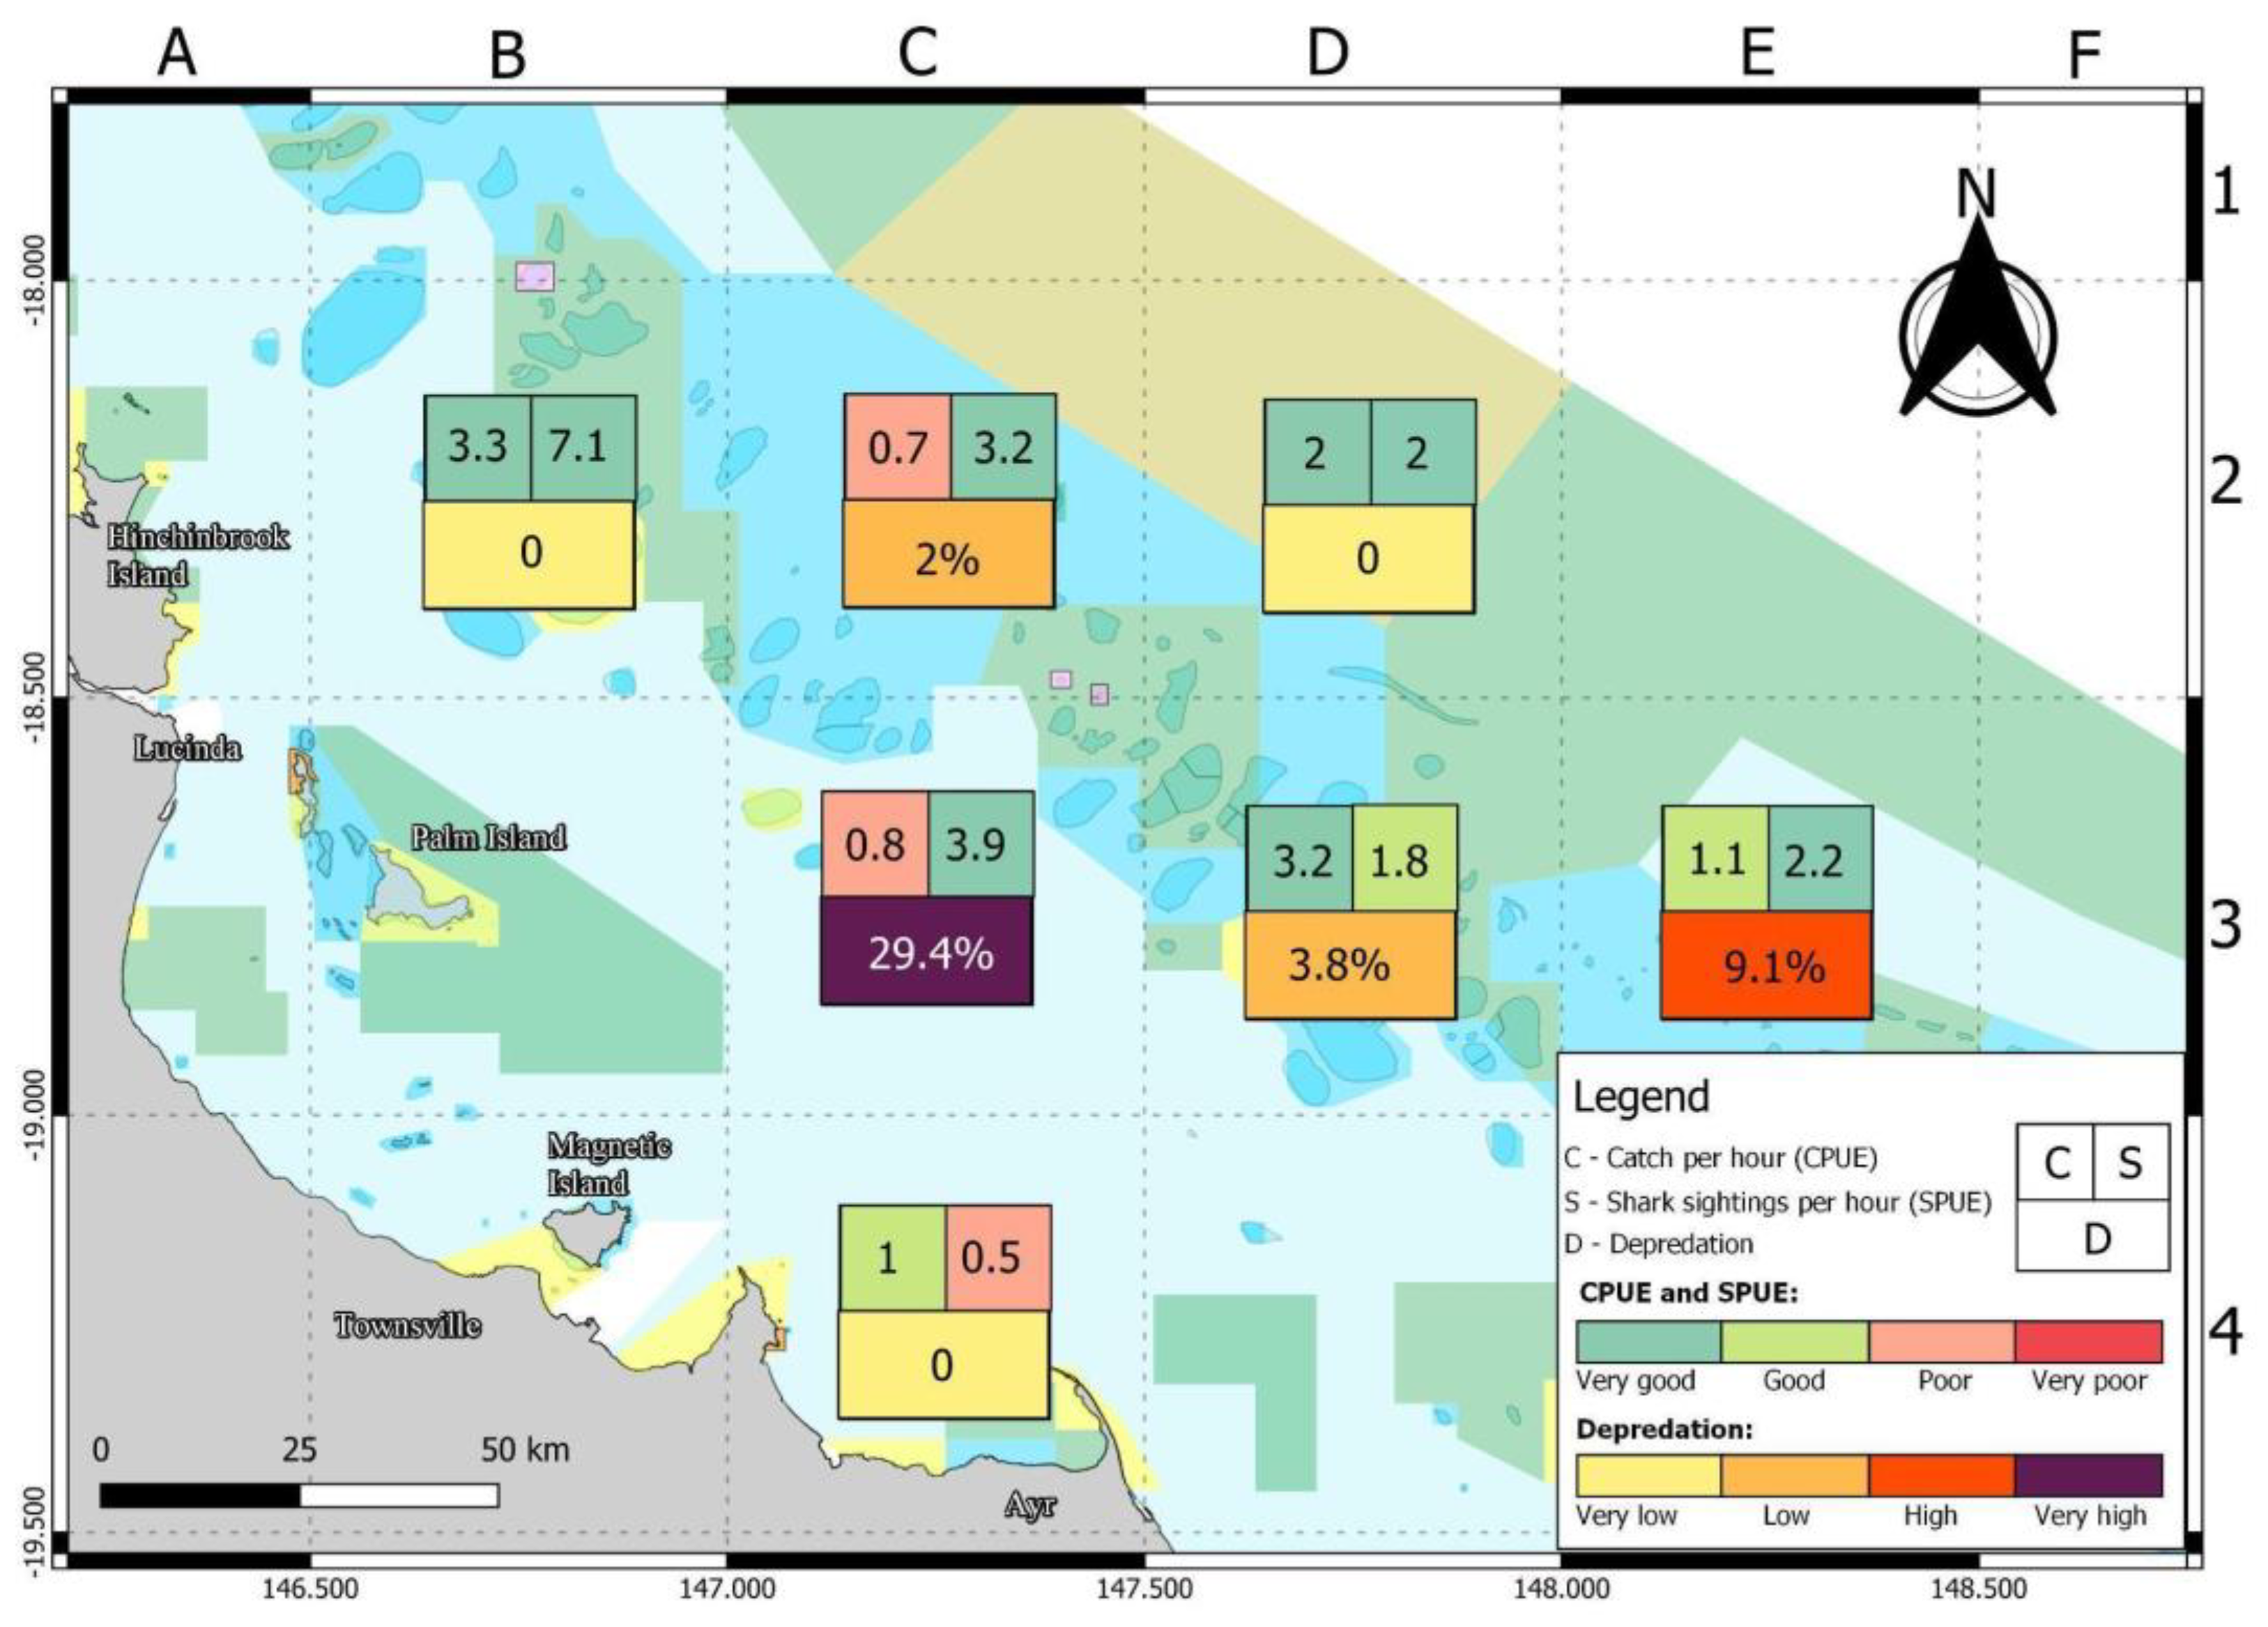
3.5. Summary of Fish Catch, Shark Sightings and Depredation
4. Discussion
4.1. Spearfishing Effort and Catch
4.2. Shark Observations
4.3. Shark Depredation
4.4. Measures for Reducing Shark Depredation
4.5. Sustainability
5. Conclusions
Supplementary Materials
Author Contributions
Funding
Informed Consent Statement
Data Availability Statement
Acknowledgments
Conflicts of Interest
Appendix A
Appendix A.1. Spearfishers and Sharks Survey 2021
- Approximate location (see attached map or name reef, island or shoal)
- How many divers in water?
- What time did divers enter the water?
- What time did divers leave the water?
- How many other boats nearby?
- Did boats have engines running during fishing?
- Was berleying used?
- Were flashers used?
- What was the average depth of water?
- How many fish did you catch, including both those kept and used for berley
- Did you see any sharks?
- If yes, what species of shark and estimated sizes did you see?
Species Number Estimated size Photo/Video? Grey reef shark White tip reef shark Bull shark Whaler shark Other - Did you experience sharks eating any of your fish (depredation)?If yes, how many fish were partly or completely depredated by sharks?
| Species of Fish | Estimated Size of Fish (cm) | Species of Shark(s) | Partial or Complete |
- 14.
- Have you been interviewed about shark depredation before?
- 15.
- How many days have you spearfishing from a boat in the last year?
- 16.
- How many years have you been spearfishing for?
- 17.
- Do you think shark numbers have increased or decreased in the past 10 years?
- 18.
- Approximately how many kilometres did you travel over the competition?
- 19.
- Approximately how many litres of fuel did you use of the competition?
- 20.
- Any other observations or comments?
References
- Young, M.; Foale, S.; Bellwood, D.R. Dynamic catch trends in the history of recreational spearfishing in Australia. Conserv. Biol. 2015, 29, 784–794. [Google Scholar] [CrossRef] [PubMed]
- Mass, T. Bluewater Hunting and Free Diving, 2020th ed.; Bluewater Freedivers Inc.: Ventura, CA, USA, 2020; 224p, ISBN-10 0578697211. [Google Scholar]
- Sbragaglia, V.; Arlinghaus, R.; Blumstein, D.T.; Coll, M.; Dedeu, A.L.; Diogo, H.; Giglio, V.J.; Gordoa, A.; Januchowski-Hartley, F.A.; Laporta, M.; et al. Spearing into the Future: A Global Review of Marine Recreational Spearfishing. EcoEvoRxiv 2021. [Google Scholar] [CrossRef]
- Godoy, N.; Gelcich, S.; Vásquez, J.A.; Castilla, J.C. Spearfishing to depletion: Evidence from temperate reef fishes in Chile. Ecol. Appl. 2010, 20, 1504–1511. [Google Scholar] [CrossRef] [PubMed]
- Frisch, A.J.; Cole, A.J.; Hobbs, J.; Rizzari, J.R.; Munkres, K.P. Effects of Spearfishing on Reef Fish Populations in a Multi-Use Conservation Area. PLoS ONE 2012, 7, e51938. [Google Scholar] [CrossRef] [PubMed]
- Pinheiro, H.T.; Joyeux, J. The role of recreational fishermen in the removal of target reef fishes. Ocean Coast. Manag. 2015, 112, 12–17. [Google Scholar] [CrossRef]
- Giglio, V.J.; Bender, M.G.; Zapelini, C.; Ferreira, C.E.L. The end of the line? Rapid depletion of a large-sized grouper through spearfishing in a subtropical marginal reef. Perspect. Ecol. Conserv. 2017, 15, 115–118. [Google Scholar] [CrossRef]
- Bradford, T.; Wolfe, K.; Mumby, P.J. Preferences and perceptions of the recreational spearfishery of the Great Barrier Reef. PLoS ONE 2019, 14, e0221855. [Google Scholar] [CrossRef]
- Young, M.; Foale, S.; Bellwood, D.R. The last marine wilderness: Spearfishing for trophy fishes in the Coral Sea. Environ. Conserv. 2016, 43, 90–95. [Google Scholar] [CrossRef]
- Pacoureau, N.; Rigby, C.L.; Kyne, P.M.; Sherley, R.B.; Winker, H.; Carlson, J.K.; Fordham, S.V.; Barreto, R.; Fernando, D.; Francis, M.P.; et al. Half a century of global decline in oceanic sharks and rays. Nature 2021, 589, 567–571. [Google Scholar] [CrossRef]
- MacNeil, M.A.; Chapman, D.D.; Heupel, M.; Simpfendorfer, C.A.; Heithaus, M.; Meekan, M.; Harvey, E.; Goetze, J.; Kiszka, J.; Bond, M.E.; et al. Global status and conservation potential of reef sharks. Nature 2020, 583, 801–806. [Google Scholar] [CrossRef]
- Burgess, G.H.; Bruce, B.D.; Cailliet, G.M.; Goldman, K.J.; Grubbs, R.D.; Lowe, C.G.; MacNeil, M.A.; Mollet, H.F.; Weng, K.C.; O’Sullivan, J.B. A Re-Evaluation of the Size of the White Shark (Carcharodon carcharias) Population off California, USA. PLoS ONE 2014, 9, e98078. [Google Scholar] [CrossRef]
- Bargnesi, F.; Lucrezi, S.; Ferretti, F. Opportunities from citizen science for shark conservation, with a focus on the Mediterranean Sea. Eur. Zool. J. 2020, 87, 20–34. [Google Scholar] [CrossRef]
- Vianna, G.M.S.; Meekan, M.G.; Bornovski, T.H.; Meeuwig, J.J. Acoustic Telemetry Validates a Citizen Science Approach for Monitoring Sharks on Coral Reefs. PLoS ONE 2014, 9, e95565. [Google Scholar] [CrossRef]
- Vliet, K.V.; Moore, C. Citizen Science Initiatives: Engaging the Public and Demystifying Science. J. Microbiol. Biol. Educ. 2016, 17, 13–16. [Google Scholar] [CrossRef]
- Gibson, K.J.; Streich, M.K.; Topping, T.S.; Stunz, G.W. Utility of citizen science data: A case study in land-based shark fishing. PLoS ONE 2019, 14, e0226782. [Google Scholar] [CrossRef] [PubMed]
- Sbragaglia, V.; Arlinghaus, R. Conservation bottom-up initiatives in marine recreational spearfishing suggest the emergence of positive attitudes towards conservation. Sci. Mar. 2020, 84, 441–444. [Google Scholar] [CrossRef]
- Welch, D.J.; Smith, A.K.; Krusic-Golub, K.; Erdmann, S.; Newman, S.J. Preliminary age-based life history characteristics of the dogtooth tuna, Gymnosarda unicolor (Ruppell, 1838), in the southwest Pacific Ocean. Aquac. Fish. 2021, 8, 323–331. [Google Scholar] [CrossRef]
- Boada, J.; Sague, O.; Gordoa, A. Spearfishing data reveals the littoral fish communities’ association to coastal configuration. Estuar. Coast. Shelf Sci. 2017, 199, 152–160. [Google Scholar] [CrossRef]
- Ward-Paige, C.A.; Lotze, H.K. Assessing the value of recreational divers for censusing elasmobranchs. PLoS ONE 2011, 6, e25609. [Google Scholar] [CrossRef]
- GBRMPA. Eye on the Reef. 2021. Available online: https://www.gbrmpa.gov.au/our-work/eye-on-the-reef (accessed on 20 December 2021).
- Bulleri, F.; Benedetti-Cecchi, L. Chasing fish and catching data: Recreational spearfishing videos as a tool for assessing the structure of fish assemblages on shallow rocky reefs. Mar. Ecol. Prog. Ser. 2014, 506, 255–265. [Google Scholar] [CrossRef][Green Version]
- Giglio, V.J.; Suhett, A.C.; Zapelini, C.S.; Ramiro, A.S.; Quimbayo, J.P. Assessing captures of recreational spearfishing in Abrolhos reefs, Brazil, through social media. Reg. Stud. Mar. Sci. 2020, 34, 100995. [Google Scholar] [CrossRef]
- Queensland Government. State of the Environment Report. Recreational Fishing Catch and Participation. 2021. Available online: https://www.stateoftheenvironment.des.qld.gov.au/biodiversity/estuarine-and-marine-ecosystems/recreational-fishing-catch-and-participation (accessed on 5 July 2022).
- Great Barrier Reef Marine Park Authority. Recreational Fishing Activities. 2022. Available online: https://www.gbrmpa.gov.au/access-and-use/zoning/recreational-fishing-activities (accessed on 6 June 2022).
- Lincoln Smith, M.P.; Bell, J.D.; Pollard, D.A.; Russell, B.C. Catch and effort of competition spearfishermen in southeastern Australia. Fish. Res. 1989, 8, 45–61. [Google Scholar] [CrossRef]
- Nakaya, S. Understanding Behaviour, Motivations and Attitudes of Spearfishers on the Great Barrier Reef through the Multidimensional Specialisation Concept. Ph.D. Thesis, James Cook University, Townsville, Australia, 1999. [Google Scholar]
- Smith, A.K. Underwater Fishing in Australia and New Zealand; Mountain Ocean and Travel Publications: Narre Warren, VIC, Australia, 2000. [Google Scholar]
- Smith, A.; Nakaya, S. Spearfishing—Is it ecologically sustainable? In Proceedings of the 3rd World Recreational Fishing Conference, Northern Territory, Australia, 21–24 May 2002; Available online: https://www.researchgate.net/profile/Adam-Smith-121/publication/257409158_SPEARFISHING_-_IS_IT_ECOLOGICALLY_SUSTAINABLE/links/00b7d5253478494b67000000/SPEARFISHING-IS-IT-ECOLOGICALLY-SUSTAINABLE.pdf (accessed on 2 January 2022).
- Mitchell, J.; McLean, D.L.; Collin, S.P.; Langlois, T.J. Shark depredation in commercial and recreational fisheries. Rev. Fish Biol. Fish. 2018, 28, 715–748. [Google Scholar] [CrossRef]
- Casselberry, G.A.; Markowitz, E.M.; Alves, K.; Dello Russo, J.; Skomal, G.B.; Danylchuk, A.J. When fishing bites: Understanding angler responses to shark depredation. Fish. Res. 2022, 246, 106–117. [Google Scholar] [CrossRef]
- Ryan, K.; Taylor, S.; McAuley, R.; Jackson, G.; Molony, B. Quantifying shark depredation events while commercial, charter and recreational fishing in Western Australia. Mar. Policy 2019, 109, 12. [Google Scholar] [CrossRef]
- Carmody, H.; Langlois, T.; Mitchell, J.; Navarro, M.; Bosch, N.; McLean, D.; Monk, J.; Lewis, P.; Jackson, G. Shark depredation in a commercial trolling fishery in sub-tropical Australia. Mar. Ecol. Prog. Ser. 2021, 676, 19–35. [Google Scholar] [CrossRef]
- Queensland Government. Queensland Shark Management Plan, 2021–2025. 2021. Available online: https://www.publications.qld.gov.au/ckan-publications-attachments-prod/resources/2879505f-f118-481c-aac5-38b952945851/queensland-shark-management-plan-2021-2025.pdf?ETag=%22c02bee17b4a21a3412af0794004ac958%22 (accessed on 7 April 2022).
- Australian Underwater Federation (AUF). 2022. Available online: https://auf.com.au/auf-membership/ (accessed on 6 June 2022).
- R Core Team. R: A Language And Environment for Statistical Computing; R Foundation for Statistical Computing: Vienna, Austria, 2013; ISBN 3-900051-07-0. Available online: http://www.R-project.org/ (accessed on 1 March 2022).
- Clarke, K.R.; Gorley, R.N. PRIMER v7 User Manual/Tutorial; PRIMER-E Ltd.: Devon, UK, 2015. [Google Scholar]
- GBRMPA. Great Barrier Reef Outlook Report 2019; Great Barrier Reef Marine Park Authority (GBRMPA): Townsville, Australia, 2019.
- Whatmough, S.; Van Putten, I.; Chin, A. From hunters to nature observers: A record of 53 years of diver attitudes towards sharks and rays and marine protected areas. Mar. Freshw. Res. 2011, 62, 755–763. [Google Scholar] [CrossRef]
- Jiménez, D.; Guerra Marrero, A.; Sarmiento-Lezcano, A.; Meyers, E.; Castro, J. First assessment of the spearfishing impact in the Canary Islands. Reg. Stud. Mar. Sci. 2020, 38, 101385. [Google Scholar] [CrossRef]
- Lloret, J.; Zaragoza, N.; Caballero, D.; Font, T.; Casadevall, M.; Riera, V. Spearfishing pressure on fish communities in rocky coastal habitats in a Mediterranean marine protected area. Fish. Res. 2008, 94, 84–91. [Google Scholar] [CrossRef]
- Terlizzi, A.; Tarantino, G.; Sbragaglia, V. Ecological, Social and Economic Aspects of Italian Marine Spearfishing Tournaments (2009–2020). Front. Mar. Sci. 2022, 9, 891246. [Google Scholar] [CrossRef]
- Schilling, H.T.; Riley, I.J.; Puckeridge, A.C.; Milne-Muller, A.; Callaghan, C.T. Economic value of regional spearfishing competitions. Fish. Res. 2022, 250, 106289. [Google Scholar] [CrossRef]
- Department of Agriculture and Fisheries Queensland Fisheries Summary Report. Catch and Effort Data for Queensland’s Commercial Fisheries. Updated Data for the 2018/2019 Year; 2019. Available online: https://www.daf.qld.gov.au/__data/assets/pdf_file/0004/1423831/queensland-fisheries-summary-report.pdf (accessed on 1 January 2022).
- Davies, T.K.; Stevens, G.; Meekan, M.G.; Struve, J.; Rowcliffe, J.M. Can citizen science monitor whale-shark aggregations? Investigating bias in mark–recapture modelling using identification photographs sourced from the public. Wildl. Res. 2012, 39, 696–704. [Google Scholar] [CrossRef]
- Lincoln Smith, M.P.; Roberts, C. Development and Implementation of a Population Estimation Protocol to Provide an Estimate of the East Coast Population Numbers for Grey Nurse Sharks (Carcharias taurus); Department of Environment, Water, Heritage and the Arts: Canberra, Australia, 2010; 65p. [Google Scholar]
- Bansemer, C.S.; Bennett, M.B. Multi-year validation of photographic identification of grey nurse sharks, Carcharias taurus, and applications for non-invasive research. Mar. Freshw. Res. 2008, 59, 322–331. [Google Scholar] [CrossRef]
- Ayling, A.M.; Choat, J.H. Abundance Patterns of Reef Sharks and Predatory Fishes on Differently Zoned Reefs in the Offshore Townsville Region: Final Report to the Great Barrier Reef Marine Park Authority, Research Publication No. 91; Great Barrier Reef Marine Park Authority: Townsville, Australia, 2008; 32p. [Google Scholar]
- Smith, A.K.; Welch, D.A.; Rupnik, M. Community Monitoring of Reef Sharks in the Coral Sea and Great Barrier Reef, Australia. Australian Underwater Federation. 2008. Available online: https://www.researchgate.net/publication/257409376_Community_Monitoring_of_Reef_Sharks_in_the_Coral_Sea_and_Great_Barrier_Reef_Australia (accessed on 2 January 2022).
- Rizzari, J.R.; Frisch, A.J.; Magnenat, K.A. Diversity, abundance, and distribution of reef sharks on outer-shelf reefs of the Great Barrier Reef, Australia. Mar. Biol. 2014, 161, 2847–2855. [Google Scholar] [CrossRef]
- Espinoza, M.; Cappo, M.; Heupel, M.R.; Tobin, A.J.; Simpfendorfer, C.A. Quantifying shark distribution patterns and species-habitat associations: Implications of marine park zoning. PLoS ONE 2014, 9, e106885. [Google Scholar] [CrossRef]
- Espinoza, M.; Lédée, E.J.; Simpfendorfer, C.A.; Tobin, A.J.; Heupel, M.R. Contrasting movements and connectivity of reef-associated sharks using acoustic telemetry: Implications for management. Ecol. Appl. 2015, 25, 2101–2118. [Google Scholar] [CrossRef]
- Heupel, M.R.; Simpfendorfer, C.A. Importance of environmental and biological drivers in the presence and space use of a reef-associated shark. Mar. Ecol. Prog. Ser. 2014, 496, 47–57. [Google Scholar] [CrossRef]
- Cubero-Pardo, P.; Herrón, P.; González-Pérez, F. Shark reactions to scuba divers in two marine protected areas of the Eastern Tropical Pacific. Aquat. Conserv. Mar. Freshw. Ecosyst. 2011, 21, 239–246. [Google Scholar] [CrossRef]
- Lester, E.; Langlois, T.; Lindgren, I.; Birt, M.; Bond, T.; McLean, D.; Vaughan, B.; Holmes, T.H.; Meekan, M. Drivers of variation in occurrence, abundance, and behaviour of sharks on coral reefs. Sci. Rep. 2022, 12, 728. [Google Scholar] [CrossRef]
- Labinjoh, L. Rates of Shark Depredation of Line-Caught Fish on the Protea Banks, KwaZulu-Natal. Master’s Thesis, University of Cape Town, Cape Town, South Africa, 2014. Available online: https://open.uct.ac.za/handle/11427/13359 (accessed on 2 December 2021).
- Vardon, J.L.; Williams, S.M.; Bucher, D.J.; Morgan, J.A.T. Identifying shark species responsible for fisheries depredation off Southeast Queensland, Australia. Mol. Biol. Rep. 2021, 48, 4961–4965. [Google Scholar] [CrossRef] [PubMed]
- Sumner, N.R.; Williamson, P.C.; Malseed, B.E. A 12-Month Survey of Recreational Fishing in the Gascoyne Bioregion of Western Australia during 1998–1999; Fisheries Research Report No. 139; Government of Western Australia, Department of Fisheries: Perth, Australia, 2002.
- Williamson, P.C.; Sumner, N.R.; Malseed, B.E. A 12-Month Survey of Recreational Fishing in the Pilbara Region of Western Australia during 1999–2000; Government of Western Australia, Department of Fisheries: Perth, Australia, 2006.
- Coulson, P.G.; Ryan, K.L.; Jackson, G. Are charter and private-boat recreational fishers learning to live with shark depredation? Mar. Policy 2022, 141, 105096. [Google Scholar] [CrossRef]
- Hoel, K.; Chin, A.; Lau, J. Clashing conservation values: The social complexities of shark depredation. Biol. Conserv. 2022, 272, 109658. [Google Scholar] [CrossRef]
- Pavlowich, T.; Kapuscinski, A.R. Understanding spearfishing in a coral reef fishery: Fishers’ opportunities, constraints, and decision-making. PLoS ONE 2017, 12, e0181617. [Google Scholar] [CrossRef] [PubMed]
- Lam, V.W.Y.; Allison, E.H.; Bell, J.D.; Blythe, J.; Cheung, W.W.L.; Frölicher, T.L.; Gasalla, M.A.; Sumaila, U.R. Climate change, tropical fisheries and prospects for sustainable development. Nat. Rev. Earth Environ. 2020, 1, 440–454. [Google Scholar] [CrossRef]
- Australian Government. Tourism Operator Emissions Calculator. 2012. Available online: https://elibrary.gbrmpa.gov.au/jspui/bitstream/11017/487/1/Tourism-Operator-Emissions-Calculator.pdf (accessed on 18 March 2022).


| Questions | Independent Variable | Dependent Variable | Statistical Test |
|---|---|---|---|
| 1. Were there any differences in shark sightings in different location grids and competition days? | Time (competition day) | SPUE (number of sharks observed per hour) | Student’s t-test |
| Location (refer to Figure 1) | Analysis of Variance (ANOVA) | ||
| 2. Were there any differences in catch per unit effort in different location grids and competition days? | Time (competition day) | CPUE (fish catch per hour) | Mann-Whitney test |
| Location (refer to Figure 1) | Kruskal-Wallis | ||
| 3. What is the most common shark species observed? | Shark species | SPUE (number of sharks observed per hour) | Kruskal-Wallis |
| 4. What is the relationship between fish catch, depth (bathymetry), and shark sightings? | Depth | SPUE (number of sharks observed per hour) | Regression analysis |
| SPUE (number of sharks observed per hour) | CPUE (fish catch per hour) | ||
| 5. What is the relationship between depredation rate and shark sightings? | SPUE (number of sharks observed per hour) | Depredation rate | Regression analysis |
| 6. Were there any differences in depredation rate in different location grid and competition days? | Time (competition day) | Depredation rate | Mann-Whitney test |
| Location (refer to Figure 1) | Kruskal-Wallis | ||
| 7. Were there any differences in the assemblage of shark sightings among location grids? | Location (days pooled) | SPUE | PERMANOVA and nMDS |
| Status | Very Good | Good | Poor | Very Poor |
| Fish catch (per hour) | 2+ | 1–2 | 0.5–0.99 | 0–0.49 |
| Shark sightings (per hour) | 2+ | 1–2 | 0.5–0.99 | 0–0.49 |
| Impact | Very Low | Low | High | Very High |
| Depredation (%) | 0–1 | 1–5 | 5.01–15 | >15 |
| Common Name | Scientific Name | Number | Weight (kg) | ||
|---|---|---|---|---|---|
| Min | Max | Average | |||
| Spanish Mackerel | Scomberomorus commerson | 20 | 4.3 | 11.6 | 6.8 |
| Grey Mackerel | Scomberomorus semifasciatus | 1 | 1.7 | 1.7 | 1.7 |
| Shark Mackerel | Grammatorcynus bicarinatus | 2 | 3.4 | 4.3 | 3.9 |
| Dogtooth Tuna | Gymnosarda unicolor | 7 | 5.1 | 20.5 | 13.7 |
| Green Jobfish | Aprion virescens | 2 | 4.5 | 4.7 | 4.6 |
| Turrum | Carangoides fulvoguttatus | 6 | 5 | 7.4 | 6.2 |
| Rainbow Runner | Elagatis bipinnulata | 2 | 2.3 | 2.4 | 2.35 |
| Queenfish | Scomberoides commersonnianus | 1 | 4.1 | 4.1 | 4.1 |
| Sailfish | Istiophorus platypterus | 1 | 34.4 | 34.4 | 34.4 |
| Common Name | Scientific Name | Day 1 | Day 2 | Total |
|---|---|---|---|---|
| Whitetip Reef Shark | Triaenodon obesus | 37 | 21 | 58 |
| Grey Reef Shark | Carcharhinus amblyrhynchos | 185 | 44 | 229 |
| Blacktip Reef Shark | Carcharhinus melanopterus | 4 | 1 | 5 |
| Bull Shark | Carcharhinus leucas | 21 | 21 | 42 |
| Silvertip Shark | Carcharhinus albimarginatus | 4 | 1 | 5 |
| Tiger Shark | Gaelocerdo cuvier | 1 | 0 | 1 |
| Silky Shark | Carcharhinus falciformis | 1 | 0 | 1 |
| Great Hammerhead | Sphyrna mokarran | 1 | 0 | 1 |
| Whale Shark | Rhinocodon typus | 5 | 0 | 5 |
| Whaler species | Carcharhinus spp. | 10 | 0 | 10 |
| Unidentified | 1 | 0 | 1 | |
| Total | 270 | 88 | 358 |
| Common Name | Scientific Name | Type | Number | Depredating Shark |
|---|---|---|---|---|
| Spanish Mackerel | Scomberomorus commerson | P | 2 | Grey Reef Shark |
| Rainbow Runner | Elagatis bipinnulata | P | 1 | Grey Reef Shark |
| Turrum | Carangoides fulvoguttatus | P | 1 | Bull Shark |
| Coral Trout | Plectropomus spp. | R | 3 | Grey Reef Shark |
| Coral Trout | Plectropomus spp. | R | 1 | Whitetip Reef Shark |
| Steephead Parrotfish | Chlorurus microrhinos | R | 1 | Great Hammerhead |
| Total | 9 |
Publisher’s Note: MDPI stays neutral with regard to jurisdictional claims in published maps and institutional affiliations. |
© 2022 by the authors. Licensee MDPI, Basel, Switzerland. This article is an open access article distributed under the terms and conditions of the Creative Commons Attribution (CC BY) license (https://creativecommons.org/licenses/by/4.0/).
Share and Cite
Smith, A.; Songcuan, A.; Mitchell, J.; Haste, M.; Schmidt, Z.; Sands, G.; Lincoln Smith, M. Quantifying Catch Rates, Shark Abundance and Depredation Rate at a Spearfishing Competition on the Great Barrier Reef, Australia. Biology 2022, 11, 1524. https://doi.org/10.3390/biology11101524
Smith A, Songcuan A, Mitchell J, Haste M, Schmidt Z, Sands G, Lincoln Smith M. Quantifying Catch Rates, Shark Abundance and Depredation Rate at a Spearfishing Competition on the Great Barrier Reef, Australia. Biology. 2022; 11(10):1524. https://doi.org/10.3390/biology11101524
Chicago/Turabian StyleSmith, Adam, Al Songcuan, Jonathan Mitchell, Max Haste, Zachary Schmidt, Glenn Sands, and Marcus Lincoln Smith. 2022. "Quantifying Catch Rates, Shark Abundance and Depredation Rate at a Spearfishing Competition on the Great Barrier Reef, Australia" Biology 11, no. 10: 1524. https://doi.org/10.3390/biology11101524
APA StyleSmith, A., Songcuan, A., Mitchell, J., Haste, M., Schmidt, Z., Sands, G., & Lincoln Smith, M. (2022). Quantifying Catch Rates, Shark Abundance and Depredation Rate at a Spearfishing Competition on the Great Barrier Reef, Australia. Biology, 11(10), 1524. https://doi.org/10.3390/biology11101524