Article

Integrative Analysis of Liver Metabolomics and Transcriptomics Reveals Oxidative Stress in Piglets with Intrauterine Growth Restriction

1
Institute of Animal Science, Chinese Academy of Agricultural Sciences, Beijing 100193, China
2
College of Animal Sciences, Shanxi Agricultural University, Jinzhong 030801, China
3
The Municipal Animal Husbandry General Station of Beijing, Beijing 100107, China
*
Authors to whom correspondence should be addressed.
These authors contributed equally to this work.
Biology 2022, 11(10), 1430; https://doi.org/10.3390/biology11101430
Submission received: 31 August 2022 / Revised: 16 September 2022 / Accepted: 27 September 2022 / Published: 29 September 2022

Abstract

:

Simple Summary

Although the correlation between oxidative stress and liver metabolic dysfunction has been established in piglets with intrauterine growth restriction, detailed information concerning the molecular mechanisms that facilitate this relationship remains limited. In the present study, metabolomic and transcriptomic techniques were used to investigate differences in gene expression and metabolites in the liver of piglets in intrauterine growth restriction and normal birth weight groups to systematically analyze the potential mechanism of metabolic characteristics induced by oxidative stress in the liver of intrauterine growth restriction piglets. Our results revealed that the intrauterine growth restriction piglets were involved in a variety of metabolic abnormalities, including mitochondrial dysfunction, imbalance of fatty acid composition, disruption to sources of one-carbon unit supply, and abnormal galactose conversion, which may be responsible for oxidative stress in the liver.

Abstract

The correlation between oxidative stress and liver metabolic dysfunction in piglets with intrauterine growth restriction (IUGR) remains limited. Therefore, the objective of the present study was to investigate potential mechanisms of metabolic characteristics induced by oxidative stress in the livers of IUGR piglets using metabolomic and transcriptomic analysis. Analysis of the phenotypic characteristics showed that the liver weight of the intrauterine growth restriction piglets was significantly lower than that of normal birth weight piglets. Intrauterine growth restriction piglets exhibited disordered hepatic cord arrangement and vacuolization as well as excessive lipid accumulation in hepatocytes. In addition, the activities of antioxidant enzymes were significantly decreased in the liver of the intrauterine growth restriction piglets, whereas the level of the lipid peroxidation marker MDA was significantly increased. Finally, our findings revealed that intrauterine growth restriction piglets were involved in a variety of metabolic abnormalities, including mitochondrial dysfunction, imbalance of fatty acid composition, disruption to sources of one-carbon unit supply, and abnormal galactose conversion, which may be responsible for oxidative stress in the liver. In summary, these data provided a detailed theoretical reference for revealing the hepatic metabolic characteristics of intrauterine growth restriction piglets.

1. Introduction

Piglet mortality is an ongoing concern in global pork production. The first week after birth is the most critical for piglet survival due to the higher risk of death during this period [1]. Low birth weight is likely to be an important determinant of the high mortality rate of neonatal piglets as low birth weight piglets usually die from crushing, weakness, starvation, and other congenital defects within the first few days of life [2]. Most low birth weight piglets are recognized as intrauterine growth restriction (IUGR) piglets. They usually suffer from intrauterine crowding and placental inefficiency, which stunts fetal growth potential [3]. IUGR in piglets not only shows higher mortality and morbidity in the short term but is also related to disturbances in metabolism, stunted growth, and poor carcass quality [4]. Considerable evidence suggests that oxidative stress is a major contributor to metabolic disorders in various IUGR models. Some studies have shown that a suboptimal prenatal environment can trigger fetal oxidative stress, which may be the main cause of metabolic organ dysfunction, resulting in inflammation, apoptosis, and autophagy, ultimately impairing fetal growth [5]. However, detailed information regarding oxidative stress leading to metabolic abnormalities in individuals with IUGR remains limited.
The liver plays a central role in the management of systemic homeostasis by regulating energy metabolism; therefore, liver dysfunction may cause widespread metabolic disorders. Previous studies have shown that individuals with IUGR exhibit hepatic dysfunction [6,7]. In piglets, IUGR alters the expression of genes associated with hepatic energy production and mitochondrial biogenesis, which impairs hepatic mitochondrial oxidative phosphorylation and reduces hepatic mitochondrial DNA content [8,9,10]. In addition, compromised utilization of circulating triglycerides and less optimized lipid metabolism have been reported in IUGR piglets [11]. Our previous study revealed dysregulation of glucocorticoids in the liver of IUGR piglets [12]. We hypothesized that the liver metabolism of IUGR piglets would also be abnormal. It is well known that glucocorticoid secretion occurs mainly in response to cellular stress activities through the hypothalamic–pituitary–adrenal (HPA) axis [13]. Although the above reports have directly or indirectly established a negative correlation between oxidative stress and liver metabolic dysfunction in IUGR piglets, the molecular mechanisms that facilitate this relationship require further investigation.
Omics technology has accelerated the development of quantitative and high-throughput. Though integrating multiomics analysis, key molecular functions and metabolic pathways involved in complex biological processes can be explored in-depth [14]. In our previous study, we successfully conducted transcriptome sequencing of the livers of IUGR piglets [12]. Hence, in this study, we first applied metabolome to assess liver metabolic changes between IUGR and normal birth weight (NBW) groups. Second, we conducted an integrative analysis of metabolomics and transcriptomics to explore the potential mechanism of metabolic characteristics induced by oxidative stress in the liver of IUGR piglets.

2. Materials and Methods

2.1. Sample Collection

All animals were treated humanely according to the criteria outlined in the “Guide for the Care and Use of Laboratory Animals” published by the Institute of Animal Sciences, Chinese Academy of Agricultural Sciences (Beijing, China). The experimental protocols used in this study were approved by the Animal Care and Use Committee (IAS2021-65).
In total, 17 full-term neonatal piglets (Landrace sires × Large White dams) were recruited, including 9 IUGR piglets and 8 NBW controls. According to the criteria [15]. The body weight of IUGR piglets should be chosen less than two standard deviations within the average weight in the litter, whereas the body weight of NBW piglets should be within one standard deviation of the average weight. In addition, IUGR piglets were categorized based on their head morphological characteristics using a previously described method [16]: (1) steep-dolphin-like forehead, (2) bulging eyes, and (3) wrinkles perpendicular to the mouth. Piglets with at least one of the three characteristics were defined as IUGR.
Both the body and liver weights of the piglets were measured after sacrifice. Liver samples were collected, washed, and frozen in liquid nitrogen for further use.

2.2. Widely Targeted Metabolomics and Analysis

Metabolomics analyses were performed at MetWare Biotechnology Co., Ltd. (Wuhan, China) as previously described [17], including liver tissue extraction, metabolite identification, and quantification.
For each metabolite, Student’s t-test was used to assess the statistical significance of p values, and OPS-DA was used to determine the variable importance of projection (VIP) scores. Significantly differential metabolites between the groups were determined under the criteria: VIP ≥ 1, p < 0.05, and absolute Log2FC (fold change) ≥ 1. All analyses were performed using R statistical software V.3.6.1 (Vienna, Austria).

2.3. Bioinformatic Analysis of Transcriptome

RNA sequencing sources were collected from the Sequence Read Archive (Bio-Project: PRJNA597972; https://www.ncbi.nlm.nih.gov/bioproject/PRJNA597972 (accessed on 1 May 2022). Due to the update of the pig reference genome, the filtered sequence reads were realigned to the Sscrofa11.4 reference genome from the Ensembl annotation system. Bioinformatics analysis was performed as previously described [12] and integrative analysis was performed by MetaboAnalyst V.5.0 tools (McGill University, Quebec, QC, Canada; https://www.metaboanalyst.ca/ (accessed on 15 July 2022).

2.4. Detection of Oxidative Stress Biomarkers in Liver

Commercial kits for detecting the total antioxidant capacity (T-AOC), superoxide dismutase (SOD), glutathione peroxidase (GSH-Px), catalase (CAT), glutathione (GSH), and malondialdehyde (MDA) were purchased from the Nanjing Jiancheng Institute of Biotechnology (Nanjing, China), and liver tissue was processed and biochemically analyzed following to the manufacturer’s instructions.

2.5. Transmission Electron Microscopy Analysis

The procedure for liver hematoxylin eosin (H&E) and Oil Red O (ORO) staining was performed according to previous reports [18]. Liver tissue specimens were dehydrated, fixed, and stained with H&E or ORO dye. The histopathology of liver tissues was evaluated through a light microscope (Nikon ECLIPSE 80i; Nikon Corporation, Tokyo, Japan). Two independent observers performed a double-blind assessment and each was observed in at least three different viewpoints.

2.6. Liver Morphological Evaluation

Liver samples for transmission electron microscopy (TEM) were prepared according to previously described [19]. Briefly, the liver tissue was sequentially fixed in 2.5% glutaraldehyde and 1% osmium tetroxide, dehydrated, and finally embedded. Then the tissue was sliced into ultrathin sections (60–80 nm) and stained with 2% uranyl acetate and lead citrate, observed under TEM (Hitachi HT-7700, Tokyo, Japan).

2.7. RNA Isolation and Real-Time qPCR

Total RNA of liver was extracted using InvitrogenTM TRIzol (Thermo Fisher Scientific, Carlsbad, CA, USA). cDNA was synthesized using PrimeScript™ RT reagent Kit (Takara, kusatsu, shiga, Japan). Real-time qPCR was performed in Bio-Rad fluorescence detection system (CFX96 RealTime PCR, Bio-Rad Laboratories, Hercules, CA, USA) as previously described [20]. Real-time qPCR was repeated three times independently and the 2−ΔΔCt method was used to measure the relative mRNA expression of target genes [21]. GAPDH was a reference gene and the primers information are listed in Supplementary file: Table S1.

2.8. Statistical Analysis

Statistical analysis was performed using SPSS v.21.0 (IBM Headquarters, Chicago, IL, USA). The Student’s t-test was used to analyze the differences between the two groups. The data are presented as means ± standard deviation (SD), and p values are indicated by asterisks to indicate statistically significant differences (* p < 0.05; ** p < 0.01).

3. Results

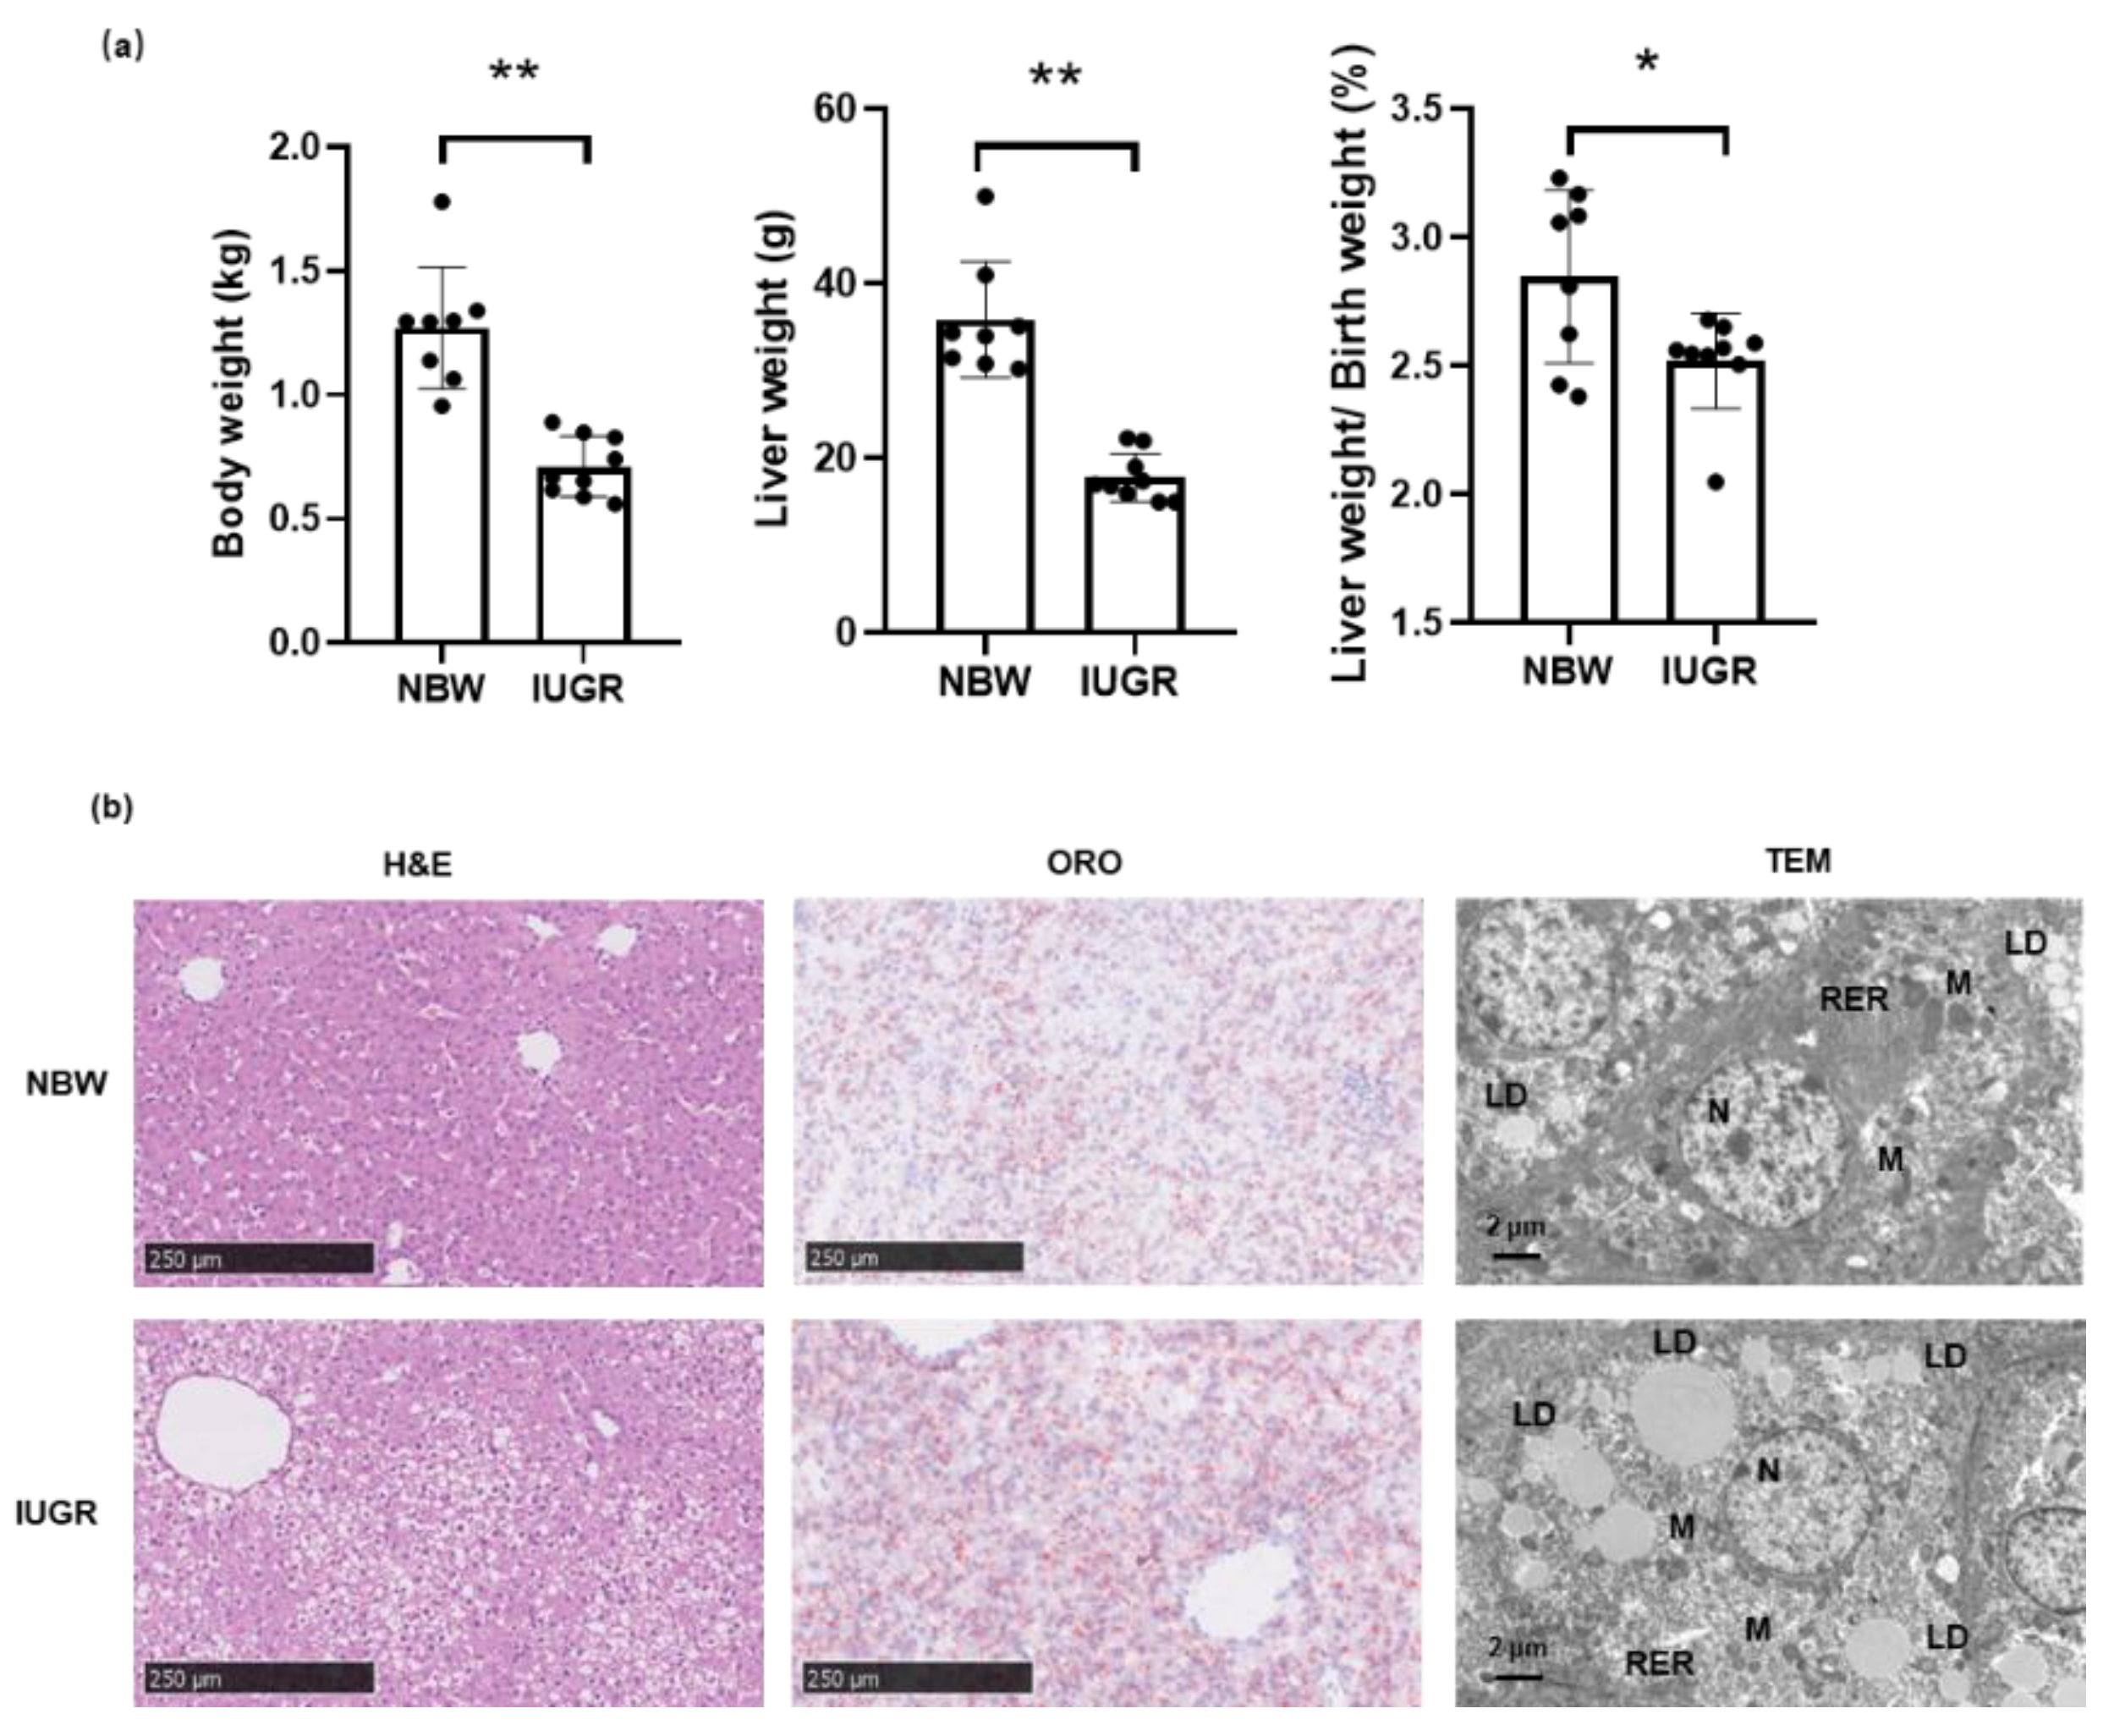
3.1. Phenotypic Traits of Piglets in IUGR and NBW Groups

The body weight of all piglets in this study are shown in Figure 1a. As expected, the initial body weight of newborn IUGR piglets was approximately 44% lower than that of NBW piglets. At the same time, both the absolute and relative weights of the liver were significantly lower in IUGR piglets than in NBW piglets.
Histopathological examinations of hepatic sections from IUGR and NBW piglets are presented in Figure 1b. The NBW group exhibited normal histomorphological structures. Conversely, apparent vacuolization and disordered arrangement of the hepatic cords were observed in the hepatocytes of IUGR piglets. Notably, ORO staining revealed increased lipid accumulation in the IUGR group. Furthermore, TEM showed significant pathological changes in the hepatocyte ultrastructure of IUGR piglets, consistent with our previous results that IUGR piglets have shorter, globular, and smaller mitochondria compared to the NBW group; in addition, a greater volume and number of lipid drops were observed in the cytoplasm.

3.2. Liver Cellular Stress in the Liver of Piglets

To explore hepatic oxidative stress in piglets, we examined the key antioxidant activities, including SOD, CAT, GSH-Px, T-AOC, as well as the level of GSH in liver tissues from IUGR and NBW groups. The antioxidative enzymes activities of SOD, CAT, T-AOC, GSH-Px, and the level of GSH in the liver of IUGR piglets were noticeably decreased compared to those in the NBW group. Meanwhile, the level of the lipid peroxidation marker MDA was significantly increased in the IUGR group compared with that in NBW group (Figure 2).

3.3. Liver Metabolic Profiles in IUGR and NBW Piglets

To better explore the underlying mechanisms of liver metabolism in IUGR piglets, we employed a targeted UPLC−MS/MS approach for comprehensive metabolic profiling of the livers from the IUGR and NBW piglets. Based on metabolomics and multivariate statistical analyses, 866 known metabolites were detected in the IUGR and NBW groups. PCA score plots showed a clear separation trend (Figure 3a). Subsequently, an OPLS-DA model was constructed with one predictive and two orthogonal components (R2X = 0.434, R2Y = 0.998, Q2 = 0.894), based on the detected metabolites (Figure 3b). These results indicated that the liver metabolic profile of IUGR piglets is distinct from that of NBW controls, demonstrating satisfactory modeling and predictive abilities.
Significantly different liver metabolites (DMs) between IUGR and NBW piglets were selected under the criteria: VIP ≥ 1, p < 0.05, and absolute Log2FC ≥ 1. Ultimately, 94 DMs, including 65 downregulated and 29 upregulated DMs, were identified (Figure 3c; Supplementary file: Table S2). Among them, urobilin showed the highest decrease among the identified metabolites in IUGR piglets with Log2FC = −6.79, and L-theanine was the most increased metabolite with Log2FC = 2.35. KEGG analysis revealed that the DMs were significantly enriched in linoleic acid metabolism, galactose metabolism, oxytocin signaling pathway, aldosterone synthesis and secretion, and biosynthesis of unsaturated fatty acids (p ˂ 0.05), as shown in Figure 3d. Among the DMs involved in the above pathways, the levels of gamma-linolenic acid (GLA), arachidonic acid (AA, 20:4n-6), hydroxy octadecaenoic acids (HODEs; 9-HODE and 13-HODEs), eicosapentaenoic acid (EPA, 20:5n-3), and N-acetyl-D-galactosamine were significantly lower in the IUGR group than those in the NBW group. Conversely, the relative abundance of galactitol, inositol, sorbitol, cyclic ADP ribose (cADPR), and nicotinic acid adenine dinucleotide (NAD+) was higher in the IUGR group than in the NBW piglets.

3.4. Liver Transcriptomic Analysis of IUGR and NBW Piglets

We selected five IUGR and four NBW piglet samples from the previously published RNA sequencing data of neonatal piglets for transcriptomic analysis, and screened out 1828 differentially expressed genes (DEGs) (padj ≤ 0.05; Fold Change ≥ 2 or ≤ 0.5), of which 643 were upregulated and 1185 were downregulated in the IUGR group (Figure 4a–c, Supplementary file: Table S3). Subsequently, we performed KEGG pathway enrichment analysis to explore the potential functions of these DEGs and displayed the top 20 enriched pathways in the IUGR group compared to the NBW group (Figure 4d). The top enriched pathways, such as glycine, serine, and threonine metabolism, glutathione metabolism, p53 signaling pathway, and cellular senescence, were all closely related to oxidative stress.

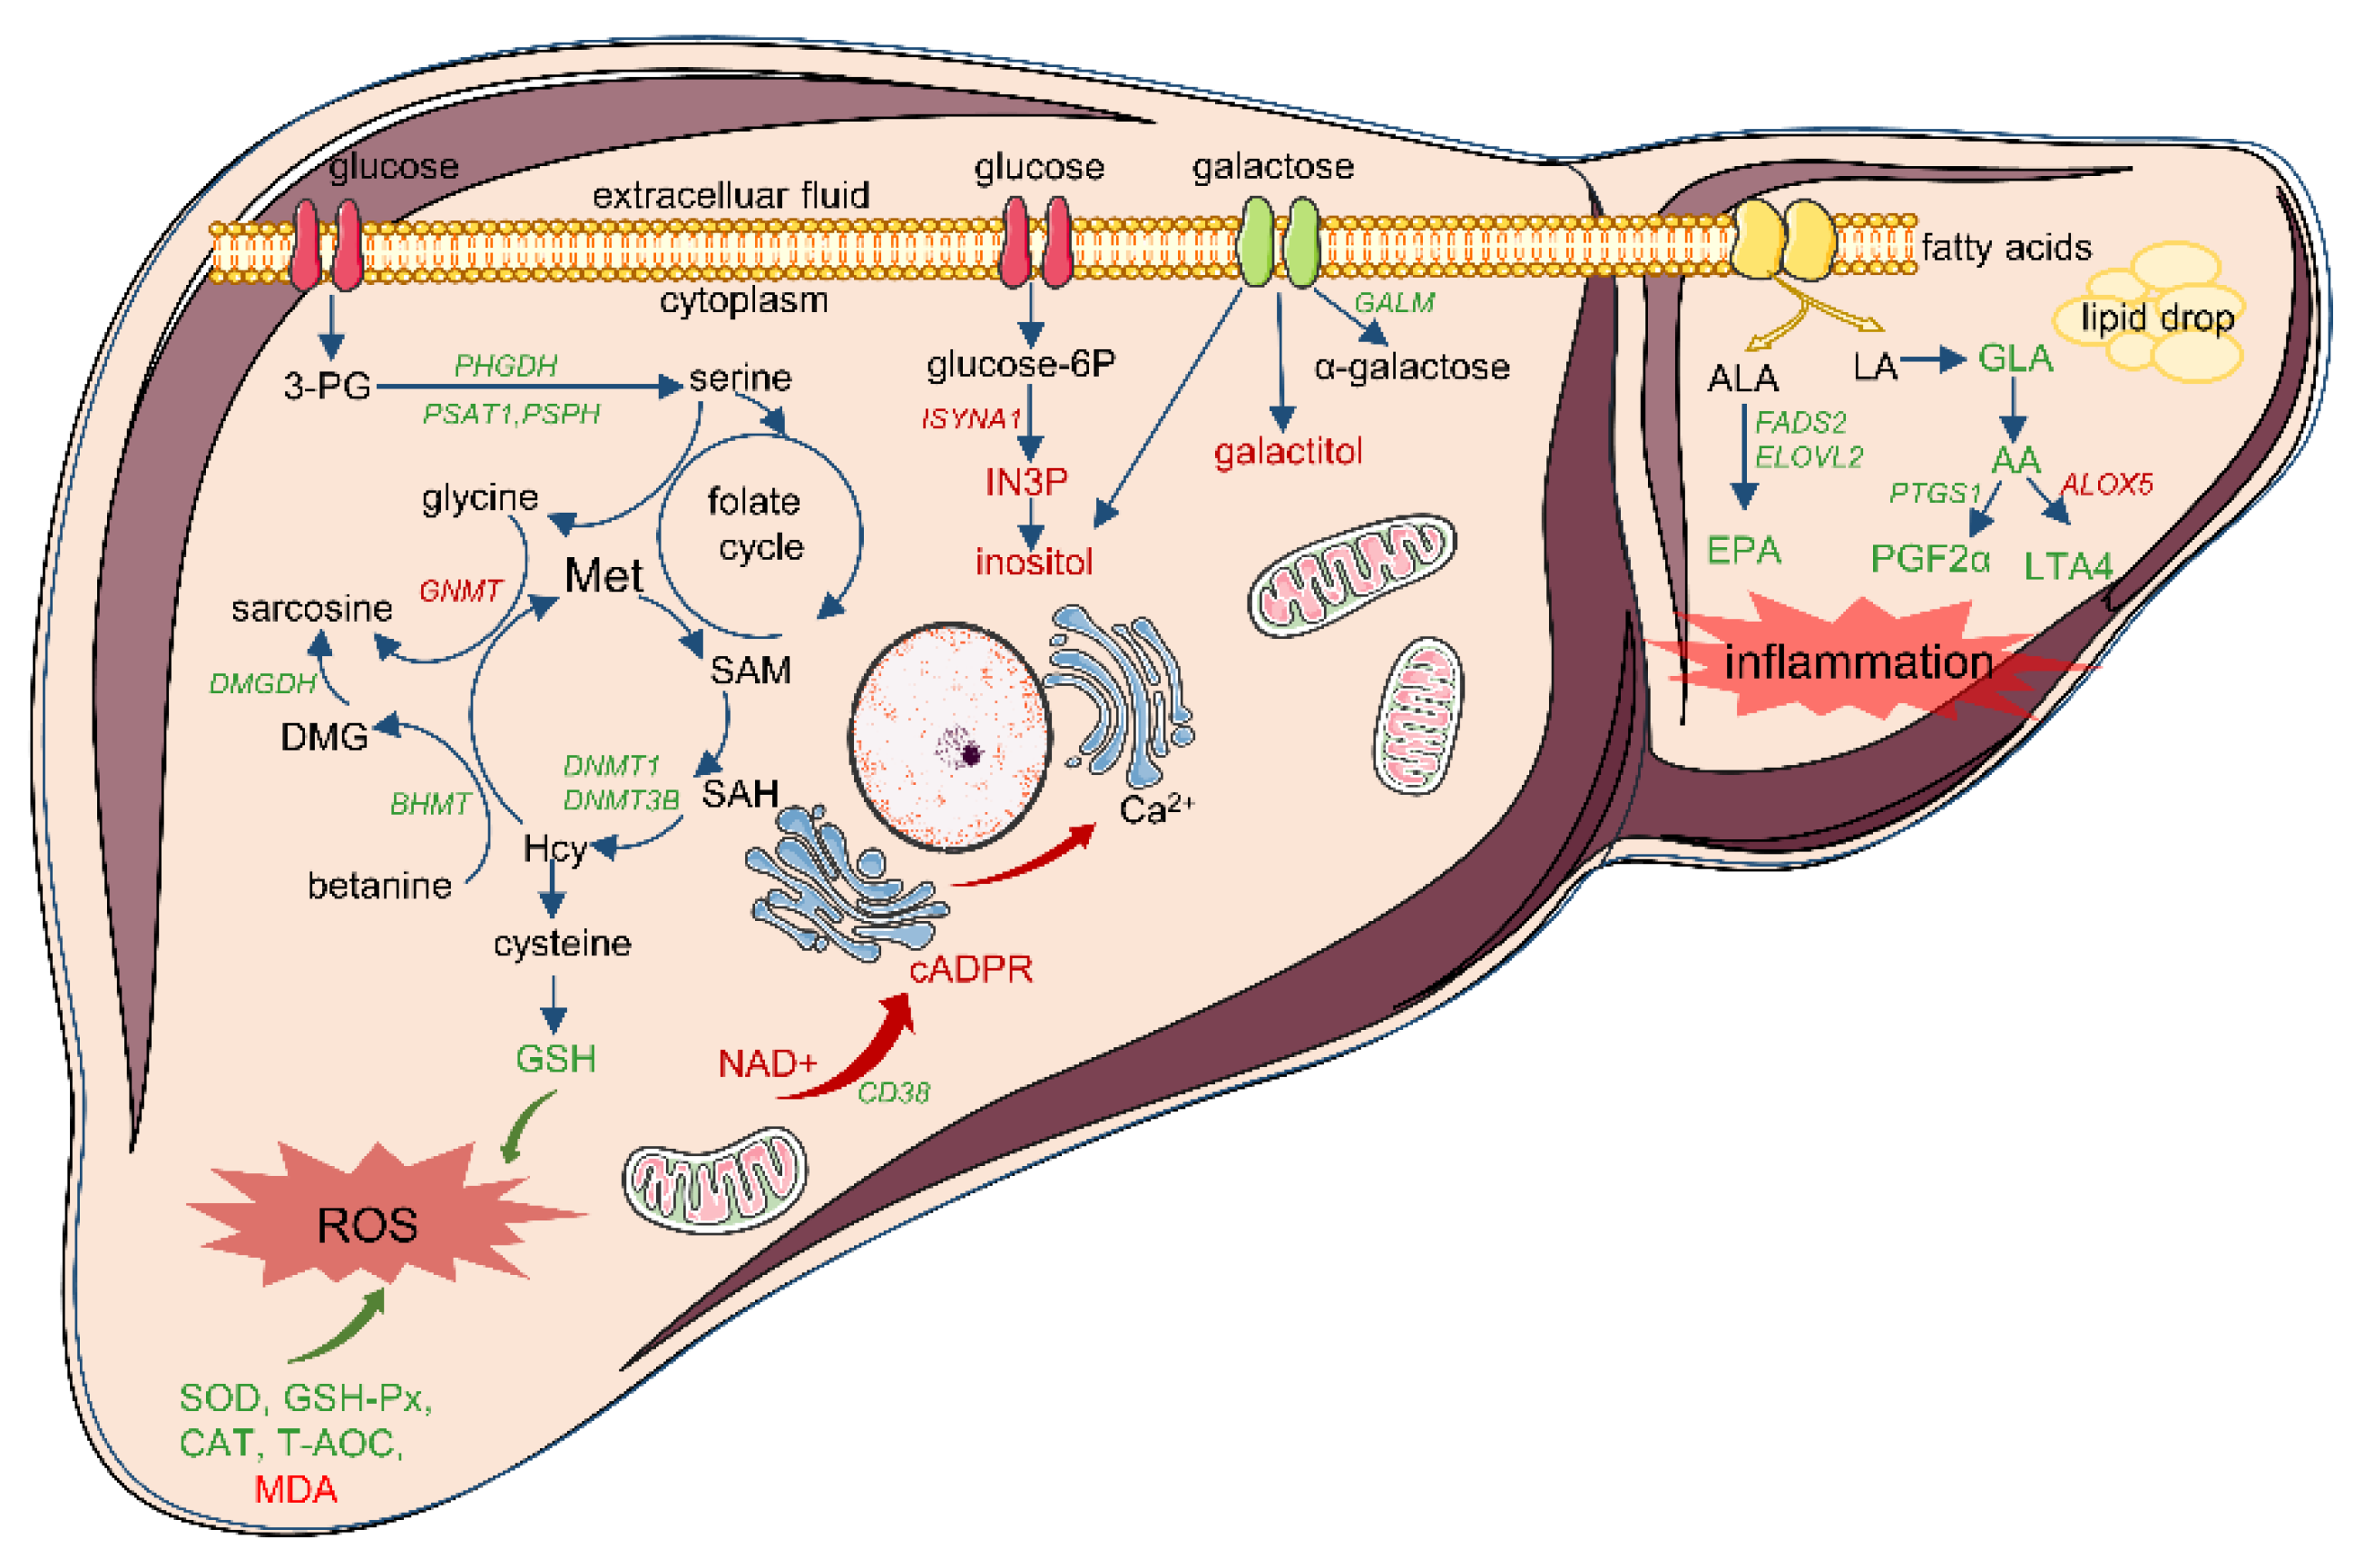
3.5. Integrative Analysis of Differential Transcriptomic and Metabolomic Profiles between IUGR and NBW Piglets

Given that the molecular mechanisms and metabolic pathways in the livers of IUGR piglets have not been fully elucidated, we conducted a comprehensive metabolome and transcriptome analysis to understand the regulatory network of hepatic metabolism in IUGR piglets. By mapping all DEGs and DMs to the KEGG pathway database, we obtained their common pathway in which both the DMs and DEGs were involved by joint pathway analysis. The interrelations of the integrated pathways were further obtained globally diagram using visual network analysis (Figure 5, Supplementary file: Table S4). Based on the integrated analysis, we further focused on the DEGs and DMs involved in these pathways, which were closely related to oxidative stress. These pathways were classified into four categories based on physiological processes, including mitochondrial dysfunction (nicotinate and nicotinamide metabolism, oxytocin signaling pathway, aldosterone synthesis and secretion, and calcium signaling pathways), imbalance of fatty acid composition (biosynthesis of unsaturated fatty acids, linoleic acid metabolism, alpha-linolenic acid metabolism, and arachidonic acid metabolism), disruption to sources of one-carbon unit supply (glycine, serine and threonine metabolism, and cysteine and methionine metabolism), as well as abnormal galactose conversion (galactose metabolism, fructose and mannose metabolism, and inositol phosphate metabolism) (Table 1).

3.6. The Validation of DEGs Expression Involved in the Integrated Pathways between IUGR and NBW Piglets

We selected several key DEGs involved in the integrated pathways that may directly or indirectly regulate oxidative stress in the liver of IUGR piglets and to validate their expression patterns. The results showed that the mRNA expressions of NNMT, CAMK1D, CACNB1, GNMT, and ISYNA1 were significantly increased in IUGR piglets, whereas the mRNA expressions of CD38, BST1, CYP2C, FADS2, PTGS1, ELOVL2, ACOT7, GALM, PHGDH, PSAT1, PSPH, BHMT, DMGDH, and DNMT1 were significantly increased in the NBW group (Figure 6a). Moreover, the similar pattern for the expression of all genes was found between the real-time qPCR and our previous RNA-seq data (Figure 6b).

4. Discussion

According to Barker’s ‘thrifty phenotype’ hypothesis, liver growth is impaired in IUGR individuals, as indicated by a decrease in abdominal circumference at birth [22]. Consistent with this, we observed similar results in our previous and current study [12,23], as both the absolute and relative weight of the liver were significantly lower in IUGR piglets. Combined with our previous report, IUGR piglets undergo rapid catch-up growth in the early postnatal period; this may be due to the malnourished liver adapting to the abundant postnatal environment, and gaining excessive growth relative to other organs, which may in turn be detrimental to hepatic function, further exacerbating risk of metabolic syndrome [24].
Previous studies have revealed that mitochondrial dysfunction in the liver often causes increased levels of superoxide radical metabolites, which may lead to oxidative damage. Mitochondria are abundant in the liver, and when mitochondria are damaged or dysfunctional, the liver is bound to suffer from oxidative stress [25]. Similarly, many studies have revealed mitochondrial stress in the liver of IUGR individuals [8,9,10,26]. In aerobic respiration, mitochondria use oxygen as the terminal electron acceptor; however, this process produces damaging reactive oxygen species (ROS). Oxidative stress occurs when an imbalance appears between ROS and antioxidant enzymes, which leads to the transformation of ROS into less harmful molecules [27]. NAD+ is an enzyme cofactor, and its metabolites are key regulators of mitochondrial oxidative metabolism and stress resistance [28]. Recent studies have shown that cADPR, an important metabolite of NAD+, is decomposed by the NAD+-dependent enzyme CD38, which has been proposed as a second messenger that regulates intracellular calcium levels in various cellular processes [29]. In this study, compared with the NBW group, abnormal expression of NAD +-consuming enzymes (CD38, SIRT4, BST1, and NNMT) and calcium signaling-related genes (CAMK1D, CAMK1, CALML4, CACNB1, and CACNB3), as well as altered concentrations of NAD+, N-methyl-2-pyridone-5-carboxamide, and cADPR were observed in the IUGR group. Meanwhile, the above DEGs and DMs were involved in nicotinate and nicotinamide metabolism, aldosterone synthesis and secretion, as well as the oxytocin signaling pathway, which were significantly enriched in the IUGR group. Recent evidence suggests that oxytocin signaling and the renin–angiotensin–aldosterone system (RAAS) are closely related to glucose uptake and lipid utilization, whereas dysfunction of oxytocin and the RAAS may lead to ROS imbalance and contribute to the pathogenesis of insulin resistance and dyslipidemia [30,31]. Therefore, the molecular mechanism of the dysregulated intracellular NAD+ levels observed in the livers of IUGR piglets may involve the disruption of calcium homeostasis, leading to the excess production of ROS.
Furthermore, in this study, abnormal regulation of fatty acids was observed in IUGR piglets. Linoleic acid (LA) metabolism and unsaturated fatty acid biosynthesis pathways were significantly enriched in the IUGR group, coupled with a decreased concentration of long-chain (≥C20) polyunsaturated fatty acids (LC-PUFA), such as EPA and AA. Long-chain PUFA is an important component of all cell membranes, especially AA and EPA, which are important precursors for the synthesis of first messengers and eicosapanoic acid compounds, and an imbalance in the n-3/n-6 ratio in LC-PUFAs is associated with metabolic syndrome [32]. Moreover, AA and its primary metabolites play an important role in the pro-inflammatory process and increase the ROS generation [33]. EPA is involved in reducing lipid accumulation and alleviating pathology in the liver [34]. In addition, LA and α-linolenic acid (ALA) are precursors for the synthesis of LC-PUFA. The synthesis process from PUFA to LC-PUFA needs the synergistic activities of fatty acid desaturase (FADS) and elongase (ELOVL) [35,36]. Moreover, alterations involving the LC-PUFA synthesis pathway causes an imbalance in the n-3/n-6 ratio and lipid peroxidation, which also leads to the production of ROS, subsequently damaging cellular functions [37]. Previous studies have found that abnormal expression of ELOVL2 and FADS2 in liver may lead to membrane fatty acid remodeling and impaired membrane lipid homeostasis [38]. In this result, the mRNA expression levels of ELOVL2, FADS2, ACOT7, CYP2C, CYP4A, PTGS1, ALOX5, and GGT5, which are involved in EPA and AA metabolism, were also altered in the livers of IUGR piglets. In addition, we also found increased hepatocyte lipid droplets in IUGR piglets, combined with av increased triglyceride content as reported in previous studies [12], which may be due to the imbalance of the n-3/n-6 ratio. Moreover, as the final products of lipid peroxidation, MDA is the main marker of superoxide free radicals [39]. High concentration of MDA was observed in the livers of IUGR piglets, suggesting that fatty acid metabolism disorder contributes to excessive oxidized stress in the liver of IUGR piglets.
Compared with those in the NBW group, the levels of SOD, CAT, GSH-Px, T-AOC, and GSH, all of which are antioxidant enzymes that eliminate ROS, were significantly decreased in the IUGR group, suggesting that the antioxidative abilities of the liver in IUGR piglets were impaired. In particular, GSH is an important scavenging molecule synthesized from glutamate, glycine, and cysteine, which protects cells from oxidation and maintains redox homeostasis [40]. From our results, the DEGs and DMs involved in glycine, serine, and threonine metabolism, as well as cysteine and methionine metabolism, were significantly enriched in the IUGR group. These metabolic pathways are involved in the supply of carbon sources in one-carbon metabolism and GSH production. In these pathways, the gene expression levels involved in de novo serine synthesis (PHGDH, PSAT1, and PSPH), and the glycine cleavage system (GNMT, ALAS2, DMGDH, BHMT, GATM, GCAT, and AGXT2), as well as dimethylglycine (DMG), were dysregulated in the livers of IUGR piglets. In addition, serine metabolism fuels the methionine salvage pathway, which is the main mechanism of synthesizing of the methyl donor S-adenosyl methionine (SAM). Subsequently, SAM provides methyl groups for epigenetic methylation and is metabolized to homocysteine (Hcy), which can enter the trans-sulfuration pathway to produce cysteine and finally GSH [41]. According to our results, the DNA methyltransferases DNMT1 and DNMT3b were also downregulated in the livers of IUGR piglets. Therefore, all the dysregulation of DGEs and DMs involved in the one-carbon cycle in IUGR piglets may be one mechanism by which IUGR influences hepatic GSH production.
Moreover, excessive accumulation of sugar alcohol derivatives such as galactitol, sorbitol, and inositol was observed in the liver of IUGR piglets, all of which are involved in galactose metabolism. Galactose is normally converted into glucose through the Leloir pathway and then enters the glycolysis pathway or is stored as glycogen in the liver [42]. The key enzyme GALM-catalyzed galactose isomerization is the first step in this process [43]. Abnormal regulation of GALM in this metabolic process affects galactose conversion, resulting in the accumulation of galactose and its metabolic derivatives [44]. In our results, lower expression of GLAM, as well as higher levels of galactitol, sorbitol, and inositol, revealed that the galactose conversion pathway is blocked in the liver of IUGR piglets. It has been reported that accumulated galactitol may lead to free radical build-up, disrupting normal osmotic pressure and leading to redox imbalance in the liver [45]. In addition, inositol as a structural basis for secondary messengers in eukaryotic cells, is important in a variety of physiological processes such as intracellular growth, membrane biogenesis, and signal transmission [46]. Although inositol can be obtained from dietary supply, the amount of endogenous inositol synthesized in the liver is far higher than that ingested through diet. The synthesis of inositol begins with the isomerization of glucose-6-phosphate (glucose-6P) to inositol 3-phosphate (IN3P) by ISYNA1, followed by dephosphorylation to free inositol [47]. Therefore, in this study, the higher expression of ISYNA1 mRNA may be the reason for the higher levels of inositol in livers of IUGR piglets. Clinically, altered concentration of inositol in plasma or urine is related to insulin resistance and diabetes, and a higher concentration of inositol has been proposed as a marker of IUGR in both humans [48] and pigs [49]. This is because inositol responds to insulin stimulation in the form of inositol phosphoglycans (IPGs) in liver tissue; decreased inositol availability or IPGs may lead to increased inositol circulation in insulin-resistant animals or humans [46,50]. Furthermore, it has been reported that increased inositol in fetuses with IUGR may reflect decreased glucose metabolic efficiency, which ultimately affects insulin secretion and fetal growth [51]. These results may suggest that galactose and its metabolites deteriorate liver energy homeostasis and cause oxidative stress in IUGR piglets (Figure 7).

5. Conclusions

In summary, the current study provides evidence that differences in gene expression and metabolites between the livers of IUGR and NBW piglets are involved in a variety of metabolic abnormalities, including mitochondrial dysfunction, imbalance of fatty acid composition, disruption to sources of one-carbon unit supply, and abnormal galactose conversion, thereby enhancing hepatic oxidative stress. Furthermore, oxidative stress status and hepatocyte damage were confirmed in the liver of IUGR piglets through the detection of antioxidant indices combined with morphological characteristics of the liver of IUGR piglets. Taken together, these data provide a detailed reference for understanding the metabolic characteristics of the liver in IUGR piglets and indicate that the mechanism of disordered metabolism in IUGR piglets might be associated with increased hepatic oxidative stress which ultimately affects the phenotypic characteristics of IUGR animals.

Supplementary Materials

The following supporting information can be downloaded at: www.mdpi.com/article/10.3390/biology11101430/s1. Table S1: Primer sequences of the DEGs identified by quantitative real-time polymerase chain reaction; Table S2: DMs between the IUGR and NBW piglets (VIP ≥ 1, p < 0.05, and absolute Log2FC ≥ 1); Table S3: DEGs between the IUGR and NBW piglets (log2Fold Change > 1 or <−1, padj < 0.05); Table S4: DEGs and DMs involved in the integrated pathways between the IUGR and NBW piglets.

Author Contributions

Conceptualization, H.G. and X.C.; methodology, J.Z.; software, F.Z.; validation, Z.X., L.Z. and L.W.; formal analysis, H.G.; investigation, B.W.; resources, Z.X.; data curation, H.G.; writing—original draft preparation, H.G.; writing—review and editing, B.W. and L.W.; supervision, L.W. All authors have read and agreed to the published version of the manuscript.

Funding

This research was supported by the Central Public-Interest Scientific Institution Basal Research Fund (2021-YWF-ZYSQ-15), the National Natural Science Foundation of China (32172738), Beijing Natural Science Foundation (6164041), and the Agricultural Science and Technology Innovation Program (ASTIP-IAS02).

Institutional Review Board Statement

The study was conducted in accordance with the “Guide for the Care and Use of Laboratory Animals” and approved by the Institute of Animal Sciences, Chinese Academy of Agricultural Sciences (Beijing, China). The animal study protocol was approved by the Animal Care and Use Committee (IAS2021-65).

Informed Consent Statement

Informed consent was obtained from all subjects involved in the study.

Data Availability Statement

Not applicable.

Acknowledgments

The authors thank all the members of our laboratory for their practical, cordial, and selfless support to this project.

Conflicts of Interest

The authors declare no conflict of interest.

References

  1. Riddersholm, K.V.; Bahnsen, I.; Bruun, T.S.; de Knegt, L.V.; Amdi, C. Identifying Risk Factors for Low Piglet Birth Weight, High within-Litter Variation and Occurrence of Intrauterine Growth-Restricted Piglets in Hyperprolific Sows. Animals 2021, 11, 2731. [Google Scholar] [CrossRef] [PubMed]
  2. Amdi, C.; Klarlund, M.V.; Hales, J.; Thymann, T.; Hansen, C.F. Intrauterine growth-restricted piglets have similar gastric emptying rates but lower rectal temperatures and altered blood values when compared with normal-weight piglets at birth1,2. J. Anim. Sci. 2016, 94, 4583–4590. [Google Scholar] [CrossRef] [PubMed]
  3. Wang, X.; Zhu, Y.; Feng, C.; Lin, G.; Wu, G.; Li, D.; Wang, J. Innate differences and colostrum-induced alterations of jejunal mucosal proteins in piglets with intra-uterine growth restriction. Br. J. Nutr. 2018, 119, 734–747. [Google Scholar] [CrossRef] [PubMed]
  4. Wu, G.; Bazer, F.W.; Wallace, J.M.; Spencer, T.E. Board-invited review: Intrauterine growth retardation: Implications for the animal sciences. J. Anim. Sci. 2006, 84, 2316–2337. [Google Scholar] [CrossRef]
  5. Oke, S.; Hardy, D. The Role of Cellular Stress in Intrauterine Growth Restriction and Postnatal Dysmetabolism. Int. J. Mol. Sci. 2021, 22, 6986. [Google Scholar] [CrossRef]
  6. Peterside, I.E.; Selak, M.A.; Simmons, R.A. Impaired oxidative phosphorylation in hepatic mitochondria in growth-retarded rats. Am. J. Physiol. Metab. 2003, 285, E1258–E1266. [Google Scholar] [CrossRef]
  7. Limesand, S.W.; Jensen, J.; Hutton, J.C.; Hay, W.W., Jr. Diminished beta-cell replication contributes to reduced beta-cell mass in fetal sheep with intrauterine growth restriction. Am. J. Physiol. Regul. Integr. Comp. Physiol. 2005, 288, R1297–R1305. [Google Scholar] [CrossRef]
  8. Su, W.; Xu, W.; Zhang, H.; Ying, Z.; Zhou, L.; Zhang, L.; Wang, T. Effects of dietary leucine supplementation on the hepatic mitochondrial biogenesis and energy metabolism in normal birth weight and intrauterine growth-retarded weanling piglets. Nutr. Res. Pract. 2017, 11, 121–129. [Google Scholar] [CrossRef]
  9. Feng, C.; Bai, K.; Wang, A.; Ge, X.; Zhao, Y.; Zhang, L.; Wang, T. Effects of dimethylglycine sodium salt supplementation on growth performance, hepatic antioxidant capacity, and mitochondria-related gene expression in weanling piglets born with low birth weight1. J. Anim. Sci. 2018, 96, 3791–3803. [Google Scholar] [CrossRef]
  10. Zhang, H.; Li, Y.; Hou, X.; Zhang, L.; Wang, T. Medium-chain TAG improve energy metabolism and mitochondrial biogenesis in the liver of intra-uterine growth-retarded and normal-birth-weight weanling piglets. Br. J. Nutr. 2016, 115, 1521–1530. [Google Scholar] [CrossRef] [Green Version]
  11. Li, W.; Li, B.; Lv, J.; Dong, L.; Zhang, L.; Wang, T. Choline supplementation improves the lipid metabolism of intrauterine-growth-restricted pigs. Asian-Australas. J. Anim. Sci. 2018, 31, 686–695. [Google Scholar] [CrossRef] [PubMed]
  12. Gao, H.; Zhang, L.; Wang, L.; Liu, X.; Hou, X.; Zhao, F.; Yan, H.; Wang, L. Liver transcriptome profiling and functional analysis of intrauterine growth restriction (IUGR) piglets reveals a genetic correction and sexual-dimorphic gene expression during postnatal development. BMC Genom. 2020, 21, 701. [Google Scholar] [CrossRef] [PubMed]
  13. Gong, S.; Sun, G.Y.; Zhang, M.; Yuan, H.J.; Zhu, S.; Jiao, G.Z.; Luo, M.J.; Tan, J.H. Mechanisms for the species difference between mouse and pig oocytes in their sensitivity to glucorticoids. Biol. Reprod. 2017, 96, 1019–1030. [Google Scholar] [CrossRef] [PubMed]
  14. Putri, S.P.; Nakayama, Y.; Matsuda, F.; Uchikata, T.; Kobayashi, S.; Matsubara, A.; Fukusaki, E. Current metabolomics: Practical applications. J. Biosci. Bioeng. 2013, 115, 579–589. [Google Scholar] [CrossRef]
  15. Wang, X.; Lin, G.; Liu, C.; Feng, C.; Zhou, H.; Wang, T.; Li, D.; Wu, G.; Wang, J. Temporal proteomic analysis reveals defects in small-intestinal development of porcine fetuses with intrauterine growth restriction. J. Nutr. Biochem. 2014, 25, 785–795. [Google Scholar] [CrossRef]
  16. Hansen, C.F.; Hales, J.; Amdi, C.; Moustsen, V.A. Intrauterine growth-restricted piglets defined by their head shape have impaired survival and growth during the suckling period. Anim. Prod. Sci. 2019, 59, 1056. [Google Scholar] [CrossRef]
  17. Tang, Y.; Pan, Y.; Chen, Y.; Kong, X.; Chen, J.; Zhang, H.; Tang, G.; Wu, J.; Sun, X. Metabolomic Profiling of Aqueous Humor and Plasma in Primary Open Angle Glaucoma Patients Points towards Novel Diagnostic and Therapeutic Strategy. Front. Pharmacol. 2021, 12, 621146. [Google Scholar] [CrossRef]
  18. Riva, G.; Villanova, M.; Cima, L.; Ghimenton, C.; Bronzoni, C.; Colombari, R.; Crestani, M.; Sina, S.; Brunelli, M.; D’Errico, A.; et al. Oil Red O Is a Useful Tool to Assess Donor Liver Steatosis on Frozen Sections during Transplantation. Transplant. Proc. 2018, 50, 3539–3543. [Google Scholar] [CrossRef]
  19. Du, J.; Zhang, X.; Han, J.; Man, K.; Zhang, Y.; Chu, E.S.; Nan, Y.; Yuemin, N. Pro-Inflammatory CXCR3 Impairs Mitochondrial Function in Experimental Non-Alcoholic Steatohepatitis. Theranostics 2017, 7, 4192–4203. [Google Scholar] [CrossRef]
  20. Ren, L.; Zhang, C.; Tao, L.; Hao, J.; Tan, K.; Miao, K.; Yu, Y.; Sui, L.; Wu, Z.; Tian, J.; et al. High-resolution profiles of gene expression and DNA methylation highlight mitochondrial modifications during early embryonic development. J. Reprod. Dev. 2017, 63, 247–261. [Google Scholar] [CrossRef] [Green Version]
  21. Livak, K.J.; Schmittgen, T.D. Analysis of relative gene expression data using real-time quantitative PCR and the 2(-Delta Delta C(T)) Method. Methods 2001, 25, 402–408. [Google Scholar] [CrossRef] [PubMed]
  22. Barker, D.J.; Martyn, C.N.; Osmond, C.; Hales, C.N.; Fall, C.H. Growth in utero and serum cholesterol concentrations in adult life. BMJ 1993, 307, 1524–1527. [Google Scholar] [CrossRef]
  23. Shen, L.; Gan, M.; Zhang, S.; Ma, J.; Tang, G.; Jiang, Y.; Li, M.; Wang, J.; Li, X.; Che, L.; et al. Transcriptome Analyses Reveal Adult Metabolic Syndrome with Intrauterine Growth Restriction in Pig Models. Front. Genet. 2018, 9, 291. [Google Scholar] [CrossRef] [PubMed]
  24. Jebasingh, F.; Thomas, N. Barker Hypothesis and Hypertension. Front. Public Health 2022, 9, 767545. [Google Scholar] [CrossRef] [PubMed]
  25. Begriche, K.; Massart, J.; Robin, M.A.; Bonnet, F.; Fromenty, B. Mitochondrial adaptations and dysfunctions in nonalcoholic fatty liver disease. Hepatology 2013, 58, 1497–1507. [Google Scholar] [CrossRef]
  26. Wang, J.; Chen, L.; Li, D.; Yin, Y.; Wang, X.; Li, P.; Dangott, L.J.; Hu, W.; Wu, G. Intrauterine Growth Restriction Affects the Proteomes of the Small Intestine, Liver, and Skeletal Muscle in Newborn Pigs. J. Nutr. 2008, 138, 60–66. [Google Scholar] [CrossRef]
  27. Cadenas, E.; Davies, K.J. Mitochondrial free radical generation, oxidative stress, and aging. Free Radic. Biol. Med. 2000, 29, 222–230. [Google Scholar] [CrossRef]
  28. Gasser, A.; Bruhn, S.; Guse, A.H. Second Messenger Function of Nicotinic Acid Adenine Dinucleotide Phosphate Revealed by an Improved Enzymatic Cycling Assay. J. Biol. Chem. 2006, 281, 16906–16913. [Google Scholar] [CrossRef]
  29. Koch-Nolte, F.; Kernstock, S.; Mueller-Dieckmann, C.; Weiss, M.S.; Haag, F. Mammalian ADP-ribosyltransferases and ADP-ribosylhydrolases. Front. Biosci. 2008, 13, 6716–6729. [Google Scholar] [CrossRef]
  30. Ding, C.; Leow, M.K.S.; Magkos, F. Oxytocin in metabolic homeostasis: Implications for obesity and diabetes management. Obes. Rev. 2018, 20, 22–40. [Google Scholar] [CrossRef] [Green Version]
  31. Mkhize, B.C.; Mosili, P.; Ngubane, P.S.; Sibiya, N.H.; Khathi, A. Diet-induced prediabetes: Effects on the activity of the renin–angiotensin–aldosterone system in selected organs. J. Diabetes Investig. 2022, 13, 768–780. [Google Scholar] [CrossRef] [PubMed]
  32. Fekete, K.; Györei, E.; Lohner, S.; Verduci, E.; Agostoni, C.; Decsi, T. Long-chain polyunsaturated fatty acid status in obesity: A systematic review and meta-analysis. Obes. Rev. 2015, 16, 488–497. [Google Scholar] [CrossRef]
  33. Chandrasekharan, J.A.; Marginean, A.; Sharma-Walia, N. An insight into the role of arachidonic acid derived lipid mediators in virus associated pathogenesis and malignancies. Prostaglandins Other Lipid Mediat. 2016, 126, 46–54. [Google Scholar] [CrossRef]
  34. Depner, C.M.; Philbrick, K.A.; Jump, D.B. Docosahexaenoic acid attenuates hepatic inflammation, oxidative stress, and fibrosis without decreasing hepatosteatosis in a Ldlr(-/-) mouse model of western diet-induced nonalcoholic steatohepatitis. J. Nutr. 2013, 143, 315–323. [Google Scholar] [CrossRef] [PubMed]
  35. AlSaleh, A.; Maniou, Z.; Lewis, F.J.; Hall, W.L.; Sanders, T.A.B.; O’Dell, S.D. ELOVL2 gene polymorphisms are associated with increases in plasma eicosapentaenoic and docosahexaenoic acid proportions after fish oil supplement. Genes Nutr. 2013, 9, 362. [Google Scholar] [CrossRef] [PubMed]
  36. Steer, C.D.; Hibbeln, J.R.; Golding, J.; Davey Smith, G. Polyunsaturated fatty acid levels in blood during pregnancy, at birth and at 7 years: Their associations with two common FADS2 polymorphisms. Hum. Mol. Genet. 2012, 21, 1504–1512. [Google Scholar] [CrossRef] [PubMed]
  37. Maguolo, A.; Zusi, C.; Giontella, A.; Del Giudice, E.M.; Tagetti, A.; Fava, C.; Morandi, A.; Maffeis, C. Influence of genetic variants in FADS2 and ELOVL2 genes on BMI and PUFAs homeostasis in children and adolescents with obesity. Int. J. Obes. 2020, 45, 56–65. [Google Scholar] [CrossRef]
  38. Gomez Rodriguez, A.; Talamonti, E.; Naudi, A.; Kalinovich, A.V.; Pauter, A.M.; Barja, G.; Bengtsson, T.; Jacobsson, A.; Pamplona, R.; Shabalina, I.G. Elovl2-Ablation Leads to Mitochondrial Membrane Fatty Acid Remodeling and Reduced Efficiency in Mouse Liver Mitochondria. Nutrients 2022, 14, 559. [Google Scholar] [CrossRef]
  39. Zhao, Y.; Li, M.Z.; Shen, Y.; Lin, J.; Wang, H.R.; Talukder, M.; Li, J.L. Lycopene Prevents DEHP-Induced Leydig Cell Damage with the Nrf2 Antioxidant Signaling Pathway in Mice. J. Agric. Food Chem. 2019, 68, 2031–2040. [Google Scholar] [CrossRef]
  40. López-Navarro, M.E.; Jarquín-Martínez, M.; Sánchez-Labastida, L.A.; Ramírez-Rosales, D.; Godínez-Victoria, M.; Quintas-Granados, L.I.; Trujillo-Ferrara, J.G. Decoding Aging: Understanding the Complex Relationship among Aging, Free Radicals, and GSH. Oxidative Med. Cell. Longev. 2020, 2020, 3970860. [Google Scholar] [CrossRef]
  41. Morellato, A.E.; Umansky, C.; Pontel, L.B. The toxic side of one-carbon metabolism and epigenetics. Redox Biol. 2020, 40, 101850. [Google Scholar] [CrossRef] [PubMed]
  42. Coelho, A.I.; Berry, G.T.; Rubio-Gozalbo, M.E. Galactose metabolism and health. Curr. Opin. Clin. Nutr. Metab. Care 2015, 18, 422–427. [Google Scholar] [CrossRef]
  43. Yazici, H.; Canda, E.; Altınok, Y.A.; Ucar, S.K.; Coker, M. Two siblings with galactose mutarotase deficiency: Clinical differences. JIMD Rep. 2021, 63, 25–28. [Google Scholar] [CrossRef] [PubMed]
  44. Thakur, M.; Shaeib, F.; Khan, S.N.; Kohan-Ghadr, H.R.; Jeelani, R.; Aldhaheri, S.R.; Gonik, B.; Abu-Soud, H.M. Galactose and its Metabolites Deteriorate Metaphase II Mouse Oocyte Quality and Subsequent Embryo Development by Disrupting the Spindle Structure. Sci. Rep. 2017, 7, 231. [Google Scholar] [CrossRef] [PubMed]
  45. Azman, K.F.; Zakaria, R. d-Galactose-induced accelerated aging model: An overview. Biogerontology 2019, 20, 763–782. [Google Scholar] [CrossRef]
  46. Chatree, S.; Thongmaen, N.; Tantivejkul, K.; Sitticharoon, C.; Vucenik, I. Role of Inositols and Inositol Phosphates in Energy Metabolism. Molecules 2020, 25, 5079. [Google Scholar] [CrossRef]
  47. Bevilacqua, A.; Bizzarri, M. Inositols in Insulin Signaling and Glucose Metabolism. Int. J. Endocrinol. 2018, 2018, 1968450. [Google Scholar] [CrossRef]
  48. Dessi, A.; Fanos, V. Myoinositol: A new marker of intrauterine growth restriction? J. Obstet. Gynaecol. 2013, 33, 776–780. [Google Scholar] [CrossRef]
  49. Nissen, P.M.; Nebel, C.; Oksbjerg, N.; Bertram, H.C. Metabolomics Reveals Relationship between Plasma Inositols and Birth Weight: Possible Markers for Fetal Programming of Type 2 Diabetes. J. Biomed. Biotechnol. 2010, 2011, 378268. [Google Scholar] [CrossRef]
  50. Ortmeyer, H.K.; Huang, L.C.; Zhang, L.; Hansen, B.C.; Larner, J. Chiroinositol deficiency and insulin resistance. II. Acute effects of D-chiroinositol administration in streptozotocin-diabetic rats, normal rats given a glucose load, and spontaneously insulin-resistant rhesus monkeys. Endocrinology 1993, 132, 646–651. [Google Scholar] [CrossRef]
  51. Lefort, G.; Servien, R.; Quesnel, H.; Billon, Y.; Canario, L.; Iannuccelli, N.; Canlet, C.; Paris, A.; Vialaneix, N.; Liaubet, L. The maturity in fetal pigs using a multi-fluid metabolomic approach. Sci. Rep. 2020, 10, 19912. [Google Scholar] [CrossRef] [PubMed]
Figure 1. Phenotypic traits of piglets between IUGR and NBW group. (a) Body weight, liver weight, as well as the relative liver weight of the piglets. The data are presented as the means ± SD, and p values are indicated by asterisks to indicate statistically significant differences (* p < 0.05; ** p < 0.01). (b) Histopathological characteristics of liver in IUGR and NBW piglets, light microscopy of hematoxylin eosin (H&E) and Oil Red O (ORO) staining, as well as transmission electron micrographs (TEM). Abbreviations: N, nucleus; M: mitochondria; RER: rough endoplasmic reticulum; LD: lipid droplets.
Biology 11 01430 g001
Figure 2. The activity of SOD, CAT, GSH-Px, T-AOC, MDA, and the concentration of GSH in liver between IUGR and NBW piglets. Differences were assessed by t-test (n = 8) and asterisks represent the p values (* p < 0.05; ** p < 0.01).
Biology 11 01430 g002
Figure 3. Metabolomics analysis of liver in the IUGR and NBW piglets. (a) Principal component analysis (PCA) scores plot derived from liver metabolomics between the NBW and IUGR group. (b) The permutation tests between NBW and IUGR group. (c) Volcano plot of DMs between NBW and IUGR piglets. Red, green, and gray dots indicate significantly upregulated, significantly downregulated, and non-significant metabolites, respectively. (d) The top 20 enriched KEGG pathways in the IUGR piglets.
Biology 11 01430 g003
Figure 4. Bioinformatics analysis of liver transcriptome between the IUGR and NBW piglets. (a) The number of DEGs between the IUGR and NBW piglets. (b) Volcano plot of DEGs between the IUGR and NBW piglets. (c) The cluster heatmap between the IUGR and NBW piglets. (d) The top 20 enriched KEGG pathway terms were significantly altered in the IUGR piglets.
Biology 11 01430 g004
Figure 5. A network of interrelationships that integrate pathways in metabolomics and transcriptomics.
Biology 11 01430 g005
Figure 6. Verification of DEGs expression involved in the integrated pathways between IUGR and NBW piglets. (a) The relative expression of mRNA was determined by real-time qPCR. Results were presented as means ± SD. Differences were assessed by t-test (n = 8) and asterisks represent the p values (** p < 0.01). (b) log2Foldchange of selected genes between real-time qPCR and RNA-seq analysis.
Biology 11 01430 g006
Figure 7. Summary of the DEGs and DMs were involved in a variety of metabolic abnormalities induced by oxidative stress in the liver of IUGR piglets. Abbreviations of DEGs identified by the transcriptomics analysis are shown in italics with red (high expression in IUGR group) or green (high expression in NBW group). DMs identified by metabolomics analysis are indicated either in red (highly expressed in the IUGR group) or green (highly expressed in the NBW group) color. Abbreviations: SAM, S-adenosylmethionine; SAH, S-adenosylhomocysteine; Hcy, homocysteine; LA, linolenic acid; ALA, alpha-linolenic acid; GLA, gamma-linolenic acid; EPA, eicosapentaenoic acid; NAD+, nicotinamide adenine dinucleotide; 3PG, 3-phospho glycerate; cADPR, cyclic ADP ribose; ROS, reactive oxygen species; SAM, S-adenosyl methionine; Hcy, homocysteine; IN3P, inositol 3-phosphate; Met, methionine; SAH, s-adenosylhomocysteine.
Biology 11 01430 g007
Table 1. Major DEGs and DMs included in the integrated pathway related to oxidative stress.
Physiological
Process
Pathway TermDEGsDMs
Mitochondrial dysfunctionNicotinate and nicotinamide metabolism (ko00760);
Oxytocin signaling pathway (ko04921);
Aldosterone synthesis and secretion (ko04925);
Calcium signaling pathway (ko04020)
NT5E, CD38, SIRT4, NNMT, NT5C3A, ENPP3, BST1, NMRK2, LIPE, HSD3B, CDKN1A, CAMK1D, CAMK1, ADCY1, CACNB1, EGFR, CALML4, CACNB3, KCNJ2, PLCE1, PHKA2, ERBB2, GNAL, PLCD1, P2RX3, CXCR4NAD+, cADPR, AA,
N’-Methyl-2-pyridone-5-carboxamide,
6-hydroxy-3-succinylpyridine
Imbalance of fatty acid compositionBiosynthesis of unsaturated fatty acids (ko01040);
Linoleic acid metabolism (ko00591);
alpha-Linolenic acid metabolism (ko00592);
Arachidonic acid metabolism (ko00590)
CYP2C, FADS2, CYP4A24, PTGS1, GGT5, ALOX5, CBR3, AKR1C2, ELOVL2, ACOT HSD17B12AA, GLA, EPA, 9,10-DiHOME, 12,13-DiHOME, FFA(18:4)
Disruption to sources of one-carbon unit supplyGlycine, serine and threonine metabolism (ko00260);
Cysteine and methionine metabolism (ko00270)
GATM, PSAT1, PHGDH, PSPH, DAO, GLYCTK, ALAS2, BHMT, DMGDH, AGXT2, PIPOX, GCAT, GNMT, GCLC, DNMT3B, LDHA, DNMT1, SRM, BCAT1N,N-Dimethylglycine,
5′-Deoxy-5′-(Methylthio) Adenosine
Abnormal galactose conversionGalactose metabolism (ko00052);
Inositol phosphate metabolism (ko00562);
Fructose and mannose metabolism (ko00051)
ISYNA1, PIK3C2G, GANC, GALM, MGAM2, LCT, MGAM, PFKFB4, TKFC, PI4KA, PLCE1, PLCD1, MTMR7galactitol, inositol, sorbitol,
3-hydroxyhippuric acid,
mannitol,
N-acetyl-D-galactosamine,
GDP-fucose
Publisher’s Note: MDPI stays neutral with regard to jurisdictional claims in published maps and institutional affiliations.

