Article

Chloroplast Localized FIBRILLIN11 Is Involved in the Osmotic Stress Response during Arabidopsis Seed Germination

1
Department of Molecular Biology, Graduate School, Sejong University, Seoul 05006, Korea
2
Department of Life Science, Dongguk University-Seoul, Ilsandong-gu, Goyang-si 10326, Korea
3
Department of Bioindustry and Bioresource Engineering, Plant Engineering Research Institute, Sejong University, Seoul 05006, Korea
*
Author to whom correspondence should be addressed.
Biology 2021, 10(5), 368; https://doi.org/10.3390/biology10050368
Submission received: 19 March 2021 / Revised: 22 April 2021 / Accepted: 23 April 2021 / Published: 25 April 2021
(This article belongs to the Section Plant Science)

Abstract

:

Simple Summary

The FIBRILLIN11 (FBN11) of Arabidopsis has a lipid-binding FBN domain and a kinase domain. FBN11 is present in chloroplasts and is involved in salt and osmotic stress responses during seed germination. In mannitol, the seed germination rate of the fbn11 mutants significantly reduced compared to that of the wild type. The ABA-dependent and -independent stress response regulating genes were differentially expressed in fbn11 mutants and wild-type when grown in mannitol supplemented medium. These results suggest that chloroplast localized FBN11 is involved in mediating osmotic stress tolerance through the signaling pathway that regulates the stress response in the nucleus.

Abstract

Plants live in ever-changing environments, facing adverse environmental conditions including pathogen infection, herbivore attack, drought, high temperature, low temperature, nutrient deficiency, toxic metal soil contamination, high salt, and osmotic imbalance that inhibit overall plant growth and development. Plants have evolved mechanisms to cope with these stresses. In this study, we found that the FIBRILLIN11 (FBN11) gene in Arabidopsis, which has a lipid-binding FBN domain and a kinase domain, is involved in the plant’s response to abiotic stressors, including salt and osmotic stresses. FBN11 protein localizes to the chloroplast. FBN11 gene expression significantly changed when plants were exposed to the abiotic stress response mediators such as abscisic acid (ABA), sodium chloride (NaCl), and mannitol. The seed germination rates of fbn11 homozygous mutants in different concentrations of mannitol and NaCl were significantly reduced compared to wild type. ABA-dependent and -independent stress response regulatory genes were differentially expressed in the fbn11 mutant compared with wild type when grown in mannitol medium. These results suggest a clear role for chloroplast-localized FBN11 in mediating osmotic stress tolerance via the stress response regulatory signaling pathway in the nucleus.

1. Introduction

FIBRILLINs (FBNs) are structural proteins found in plastoglobules (PGs), which are lipoprotein particles present in chloroplasts [1]. They combine with carotenoids to form fibril structures within pepper chromoplasts [2]. They are named FIBRILLINs for their participation in microfibrils. They are also a major PG component in chloroplasts and constitute a large group of proteins known to play conserved roles in photosynthesis in cyanobacteria to higher plants [3,4]. Recent research suggests that FBNs are involved in the stress response and in the formation of plastid structures in plants [5,6,7,8,9,10,11,12,13,14]. These responses include disease resistance mechanisms, hormonal signaling, growth and development, and lipid transport between PGs and thylakoid membranes [11]. FBN localization within plastids is dependent on its isoelectric point [6] and hydrophobicity. According to previous studies, FBN1a, 1b, 2, 4, 7a, 7b, and 8 are in the PG core, FBN10 is in the PG-thylakoid, FBN5 is in the stroma, and FBN3a, 3b, 6, 9, and 11 are expected to be located in the thylakoid [15].
The role of FBN in abiotic stress has been studied for decades, but little is known about its function(s). FBN gene expression is regulated by diverse, complex mechanisms responsive to numerous stresses, including high temperature, low temperature, high light, drought, wounds, and herbicides [11]. In drought or cold stress, FBN1a expression is induced, while FBN2 expression is suppressed. FBN1b expression is induced by drought but not by cold stress [16]. In response to high light, plants produce abscisic acid (ABA) as a stress signal, and ABA regulates FBN expression through ABA-responsive regulators ABSCISIC ACID-INSENSITIVE 1 (ABI1) and ABSCISIC ACID-INSENSITIVE 2 (ABI2). The resulting FBN accumulation enhances photosystem II resistance to photoinhibition [6]. CDSP34 from tomato was found to be regulated by ABA and high illumination conditions [5,17]. In Arabidopsis, cold/light stress-related jasmonic acid (JA) biosynthesis was conditioned by the accumulation of PG-associated FIB1/2 proteins [10]. Arabidopsis homozygous fbn5-knockout mutant line showed the suppressed expressions of genes involved in JA biosynthesis compared to that of the wild type under high light conditions [18]. In rice, overexpressing OsFBN1 reduced the grain-filling percent and JA levels and increased the formation of PGs, under heat stress in rice [13,19].
ABA is a plant hormone involved in seed germination, dormancy, organ size, stomatal closure, osmotic regulation, and growth inhibition that integrates various stress signals and controls downstream stress responses [20,21]. Plants constantly regulate ABA levels in response to changing environmental conditions [22]. Representative mechanisms for plant responses to environmental stress are ABA-dependent and ABA-independent [23]. In these processes, various transcription factors are involved in the transcriptional activation of stress response genes [22]. Dehydration-responsive element-binding protein 2A/2B (DREB2A/2B), ABSCISIC ACID–RESPONSIVE ELEMENT BINDING PROTEIN1 (AREB1), RD22BP1, MYC/MYB/CRT, ARBE, and MYCRS/MYBRS interact with cis-acting elements, such as DRE/CRT, ARBE, and MYCRS/MYBRS, respectively, to regulate expression of stress response genes.
Drought stress mainly causes changes in osmotic pressure between plant cells and the external environment, resulting in dehydration, while salt exposure stresses plant cell osmotic and ionic homeostasis. Drought and salt commonly activate osmotic stress response pathways [24,25,26]. AREB/ABF (ABA-responsive element-binding protein/factor) is an ABA-dependent bZIP transcription factor that interacts with the ABRE (PyACGTGG/TC) region promoters of many ABA-responsive genes conserved in several plant species. Arabidopsis has nine AREB/ABF genes. AREB1/ABF2, AREB2/ABF4, and ABF3 are induced by osmotic stress. DREB proteins belonging to the AP2/ERF transcription factor gene family are also associated with drought and osmotic stress resistance [27]. Among these, DREB1A and DREB2A specifically interact with cis-acting dehydration-responsive elements (C-repeats) involved in drought and cold stress response gene expression [22,28]. RD29A is induced through an ABA-independent pathway, and RD22 (mediated by ABA) can be activated directly by high salinity and cold stress [28]. Salt and osmotic stress also rapidly activate SnRK2-family protein kinases. Ten SnRK2s, excluding SnRK2.9, are activated by osmotic stress [23,24]. The mechanism by which ABA activates SnRK2 has been identified, but the mechanism by which osmotic stress activates SnRK2 is not yet known. According to a recent study, the B2, B3, and B4 subgroups of Raf-like protein kinase [3] are rapidly activated by osmotic stress, and their activity is required for phosphorylation and activation of SnRK2 [26].
This study aimed to investigate the function of FBN11 in the abiotic stress response. FBN11 is the only FBN protein with a kinase domain. FBN11 structural features and intracellular location were analyzed in this study, and FBN11 expression during an abiotic stress response was analyzed. Differences in stress response between fbn11 T-DNA-inserted homozygous mutants and wild-type plants under abiotic stress conditions were analyzed. Expression of genes encoding major regulatory transcription factors involved in ABA-dependent and ABA-independent stress response regulatory pathways were analyzed during seed germination under osmotic stress.

2. Materials and Methods

2.1. Protein Sequence and Phylogenetic Tree Analysis

The protein sequences of the Arabidopsis thaliana FBN genes were obtained from TAIR (https://www.arabidopsis.org/ accessed on 24 June 2019) using a previously reported method [29]. These sequences were used to query NCBI BLAST (https://blast.ncbi.nlm.nih.gov/Blast.cgi accessed on 25 June 2019) to search for FBN protein sequences from other plant species. The FBN protein sequences of Chlamydomonas were obtained from the Phytozome12 database (https://phytozome.jgi.doe.gov/pz/portal.html accessed on 28 May 2020). The obtained sequences were aligned using ClustalW with MEGA 7.0 (https://www.megasoftware.net/ accessed on 29 May 2020). The phylogenetic tree was generated using the 1000 bootstrap replication of MEGA 7.0, using the Maximum Likelihood (ML) method.

2.2. Subcellular Localization

FBN11 cDNA lacking its TAG stop codon was amplified by PCR and inserted into Xba1 and Sma1 sites in the p326-sGFP vector to construct FBN11-sGFP. FBN11-sGFP was transfected with polyethylene glycol (PEG) into protoplasts isolated from leaves of Arabidopsis or Nicotiana benthamiana [30]. Transfected protoplasts were incubated in darkness for 22 h at 25 °C. Fluorescence was observed using a confocal laser microscope (Confocal, Leica TCS SP5). GFP fluorescence was excited at 488 nm and detected at 505 at 525 nm. Chlorophyll autofluorescence was exited at 488 nm and detected between 640 and 700 nm.

2.3. Plant Material and Growth Conditions

The seeds of Salk_146998C (fbn11-1) and Salk_052070C (fbn11-2), which are T-DNA-insert FBN11 gene mutants (AT5G53450), were purchased from the Arabidopsis Biological Resource Center (ABRC: http://abrc.osu.edu/ accessed on 2 March 2016). Arabidopsis wild type (Col-0), and FBN11 gene mutants fbn11-1 and fbn11-2, were sterilized with 70% ethanol and 0.5% sodium hypochlorite (NaClO). Seeds that had been subjected to imbibition at 4 °C for 3 d were germinated on 1/2 MS (Murashige and Skoog) agar medium containing 1% sucrose and grown to seedlings for 7 d. Seedlings were transferred to a pot with soil and grown at 23 °C under 16 h light/8 h dark conditions.

2.4. T-DNA Insertion Homozygous Mutant Selection

The T-DNA insertion homozygous mutants were selected by analyzing size differences between PCR products amplified with an FBN11 gene-specific primer and the T-DNA border-specific primer, indicating T-DNA insertion in the gene. Primers for selecting T-DNA insertion mutants were designed using the T-DNA design site (http://signal.salk.edu/tdnaprimers.2.html accessed on 4 March 2017). To select fbn11-1 (SALK_146998C), LP 5′-TATTAAGGCACGTGTGGAAGG-3′ and RP 5’-GCAACGCTTACAGTACCATGG-3′ were used, and LP 5′-CGAATTTTCAAACCCTAAATCG-3′ and RP 5’ TTGTAAATTCGGCAGATTTGG-3′ were used to select fbn11-2 (SALK_052070C). The T-DNA left specific primer, LBb1.3 (5′-ATTTTGCCGATTTCGGAAC-3′), was used (Table S4) to detect T-DNA insertion in the FBN11 gene.

2.5. Seed Germination Test

The germination rates of fbn11 mutant and wild-type (WT) seeds were assayed under ABA hormone exposure, high salinity, and osmotic stress due to high mannitol exposure [31]. Wild-type and fbn11 homozygous mutant lines were seeded in 1/2 MS medium without a stressor or in the presence of ABA (1 μM), NaCl (200 mM), or mannitol (300 mM). In the germination experiment, 50 seeds were seeded onto three plates for each experimental group, and the germination rate was measured every 12 h at 23 °C. The percentage of germinated seeds was measured for 7 d after sowing. Germination rates were calculated by dividing the number of germinating seeds (based on when the infiltrated seed coat swelled to reveal young roots) by the total number of seeds.

2.6. Primer Design and Construction

Primers used to analyze the expression of the main regulatory transcription factors in the osmotic stress response pathways were prepared using Primer3Plus (http://www.bioinformatics.nl/cgi-bin/primer3plus/primer3plus.cgi accessed on 29 August 2019). Primers for the ABA-dependent/independent pathway-related transcription factor genes ABF1-4, CBF1-3, DREB2A, and FBN11 were generated based on program selection conditions, with primer lengths of 17–25 bases, 40–60% GC content, and 55–65 °C Tms. To select optimal primer pairs, we confirmed whether sequences were specific to each gene using NCBI BLAST. Primers were synthesized on a 25 nmol scale, and the BioRP purification method was selected when ordering oligos from Bioneer (https://www.bioneer.co.kr/ accessed on 30 August 2019) (Table S1).

2.7. Abiotic Stress Treatments

Seedlings were grown for 10 d in 1/2 MS medium, then transferred to normal medium without a stressor (1% sucrose + 1/2 MS) as a control, or to a solid medium with 100 μM ABA, 150 mM NaCl, or 300 mM mannitol in 1% sucrose + 1/2 MS for stress testing. At each hour after initiating stress treatments, the root was removed from germinating seeds using scissors, placed in a 2 mL tube, quickly frozen in liquid nitrogen, and stored. Alternatively, 18-day-old seedlings grown in control medium were transferred to 1/2 MS liquid medium containing 1 μM ABA, 150 mM NaCl, or 300 mM mannitol and monitored hourly. At multiple points after initiating treatment, seedling roots were removed with scissors, frozen, and stored as described above.

2.8. Measurements of Root Growth

Wild-type and mutant (fbn11-1 and fbn11-2) seedlings grown in 1/2 MS normal medium with 1% sucrose were transferred to a stressor medium containing 20 μM ABA, 200 mM NaCl, or 300 mM mannitol. Plates were incubated for eight days in a 23 °C incubator. Root growth from marked starting points was measured using Image J (https://imagej.nih.gov/ij/ accessed on 24 September 2019).

2.9. RNA Isolation

Total RNA was extracted from wild-type and fbn11 mutants using TRIzol (Favorgen). Plant samples (100 mg) were ground with liquid nitrogen and mixed with 1 mL TRIzol, and allowed to stand at room temperature for 5 min, followed by the addition of 0.2 mL of chloroform. The mixture was left at room temperature for 15 min, then centrifuged at 4 °C for 15 min. After centrifugation, the supernatant was transferred to a 1.5 mL tube, and isopropyl alcohol (IPA) (0.5 mL) was added. RNA pellets were precipitated by centrifugation for 15 min at 4 °C, and pellets were washed with 1 mL of 75% ethanol. Finally, pellets were dried on a clean bench, and 10–30 μL DEPC was added to dissolve each pellet. The dissolved pellets were treated with RNase-free DNase I (Thermo Fisher Scientific, Seoul, South Korea) to remove genomic DNA contamination.

2.10. cDNA Synthesis and Quantitative Polymerase Chain Reaction Analyses

cDNA was synthesized from 1 μg of total RNA using the method described below. A total of 10 μL of reaction solution containing 1 μg of total RNA, 125 μM of dNTP, and 2.5 μM of oligo-dT was prepared, incubated at 65 °C for 5 min, and quickly transferred to ice. To this solution, 4 μL of 5X buffer, 20 unit of inhibitor, 200 unit of reverse transcriptase, and 4.5 μL of DEPC were added, and cDNA synthesis was completed at 42 °C for 50 min followed by 95 °C for 5 min using a PCR machine.
cDNA was diluted to 7.1 ng/μL, and real-time qPCR was performed in 96-well blocks using the Step-One Plus RealTime PCR System (Applied Biosystems, Seoul, South Korea) according to the manufacturer’s protocol using PCR primers and SYBR Green Premix (Toyobo, Seoul, South Korea). In this experiment, the housekeeping gene AteIF4a (AT3G13920) was used as an internal control [32], and the Ct value of the target gene was normalized. Then, the expression value relative to the control was determined by the 2−ΔΔCt method. All qRT-PCR used total RNA samples extracted from three independent biological replicates. The specificity of qRT-PCR was determined by analyzing the amplified products’ melting curves using standard methods installed in the system.

3. Results

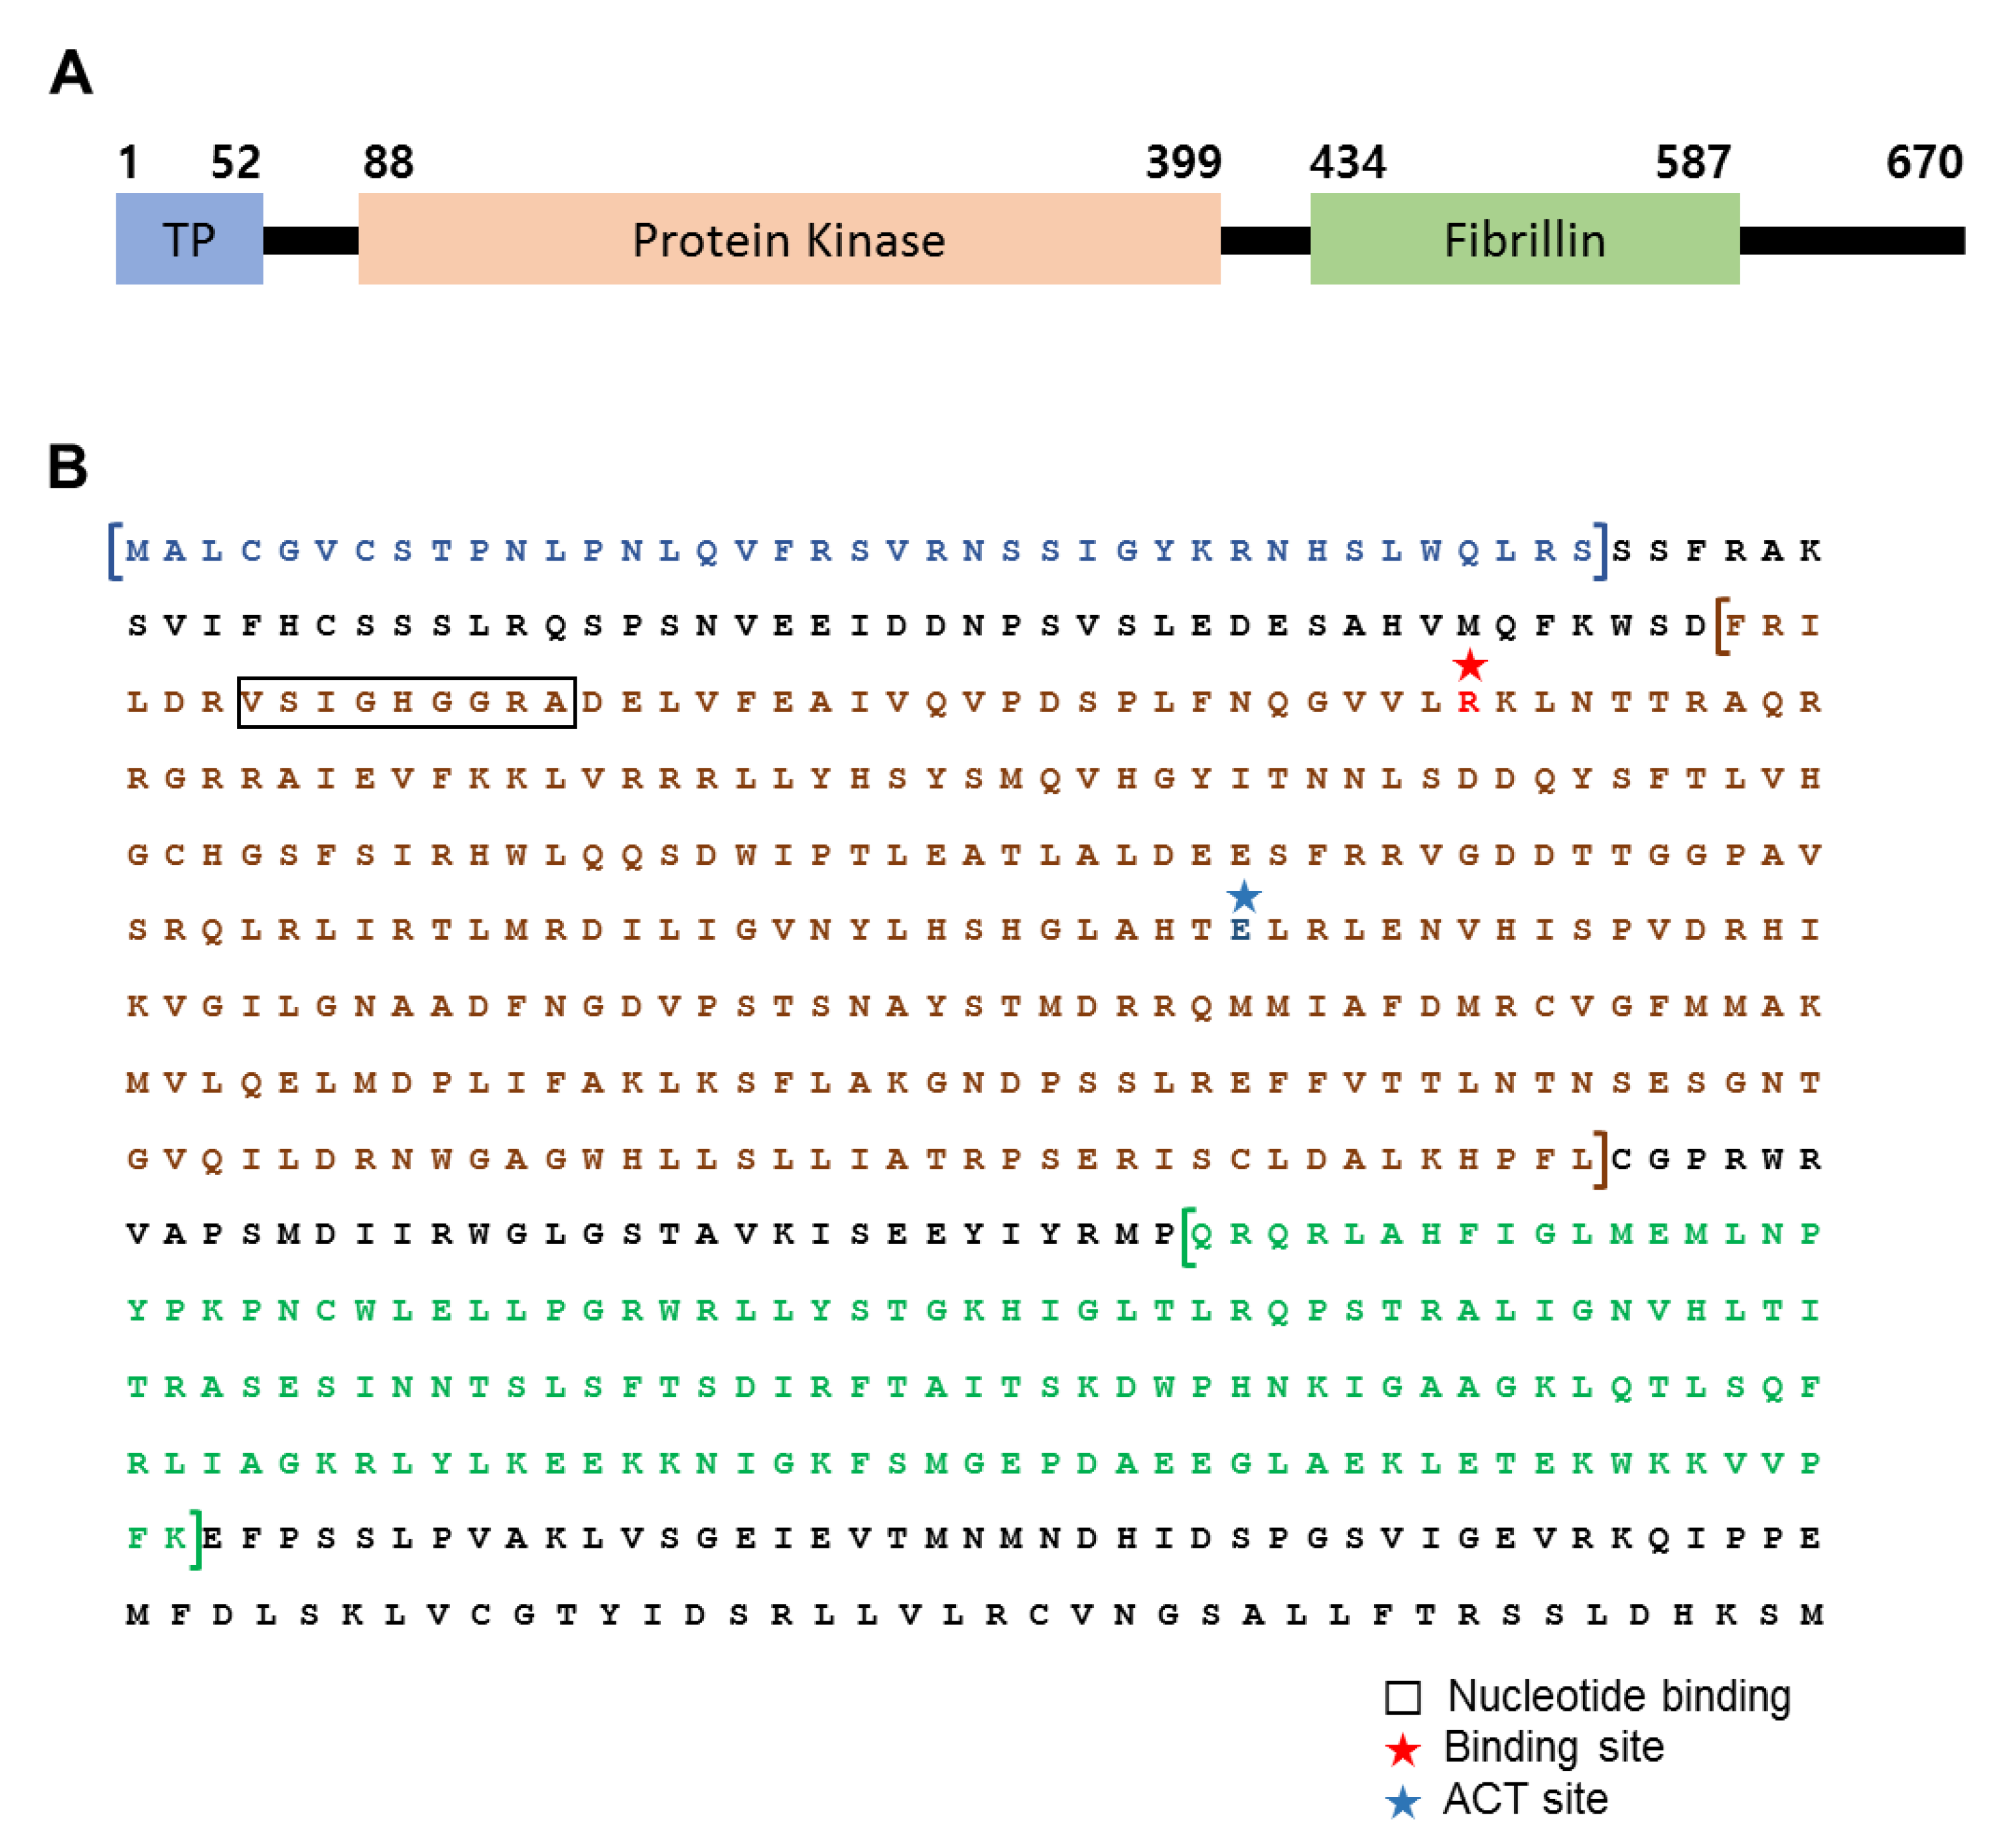
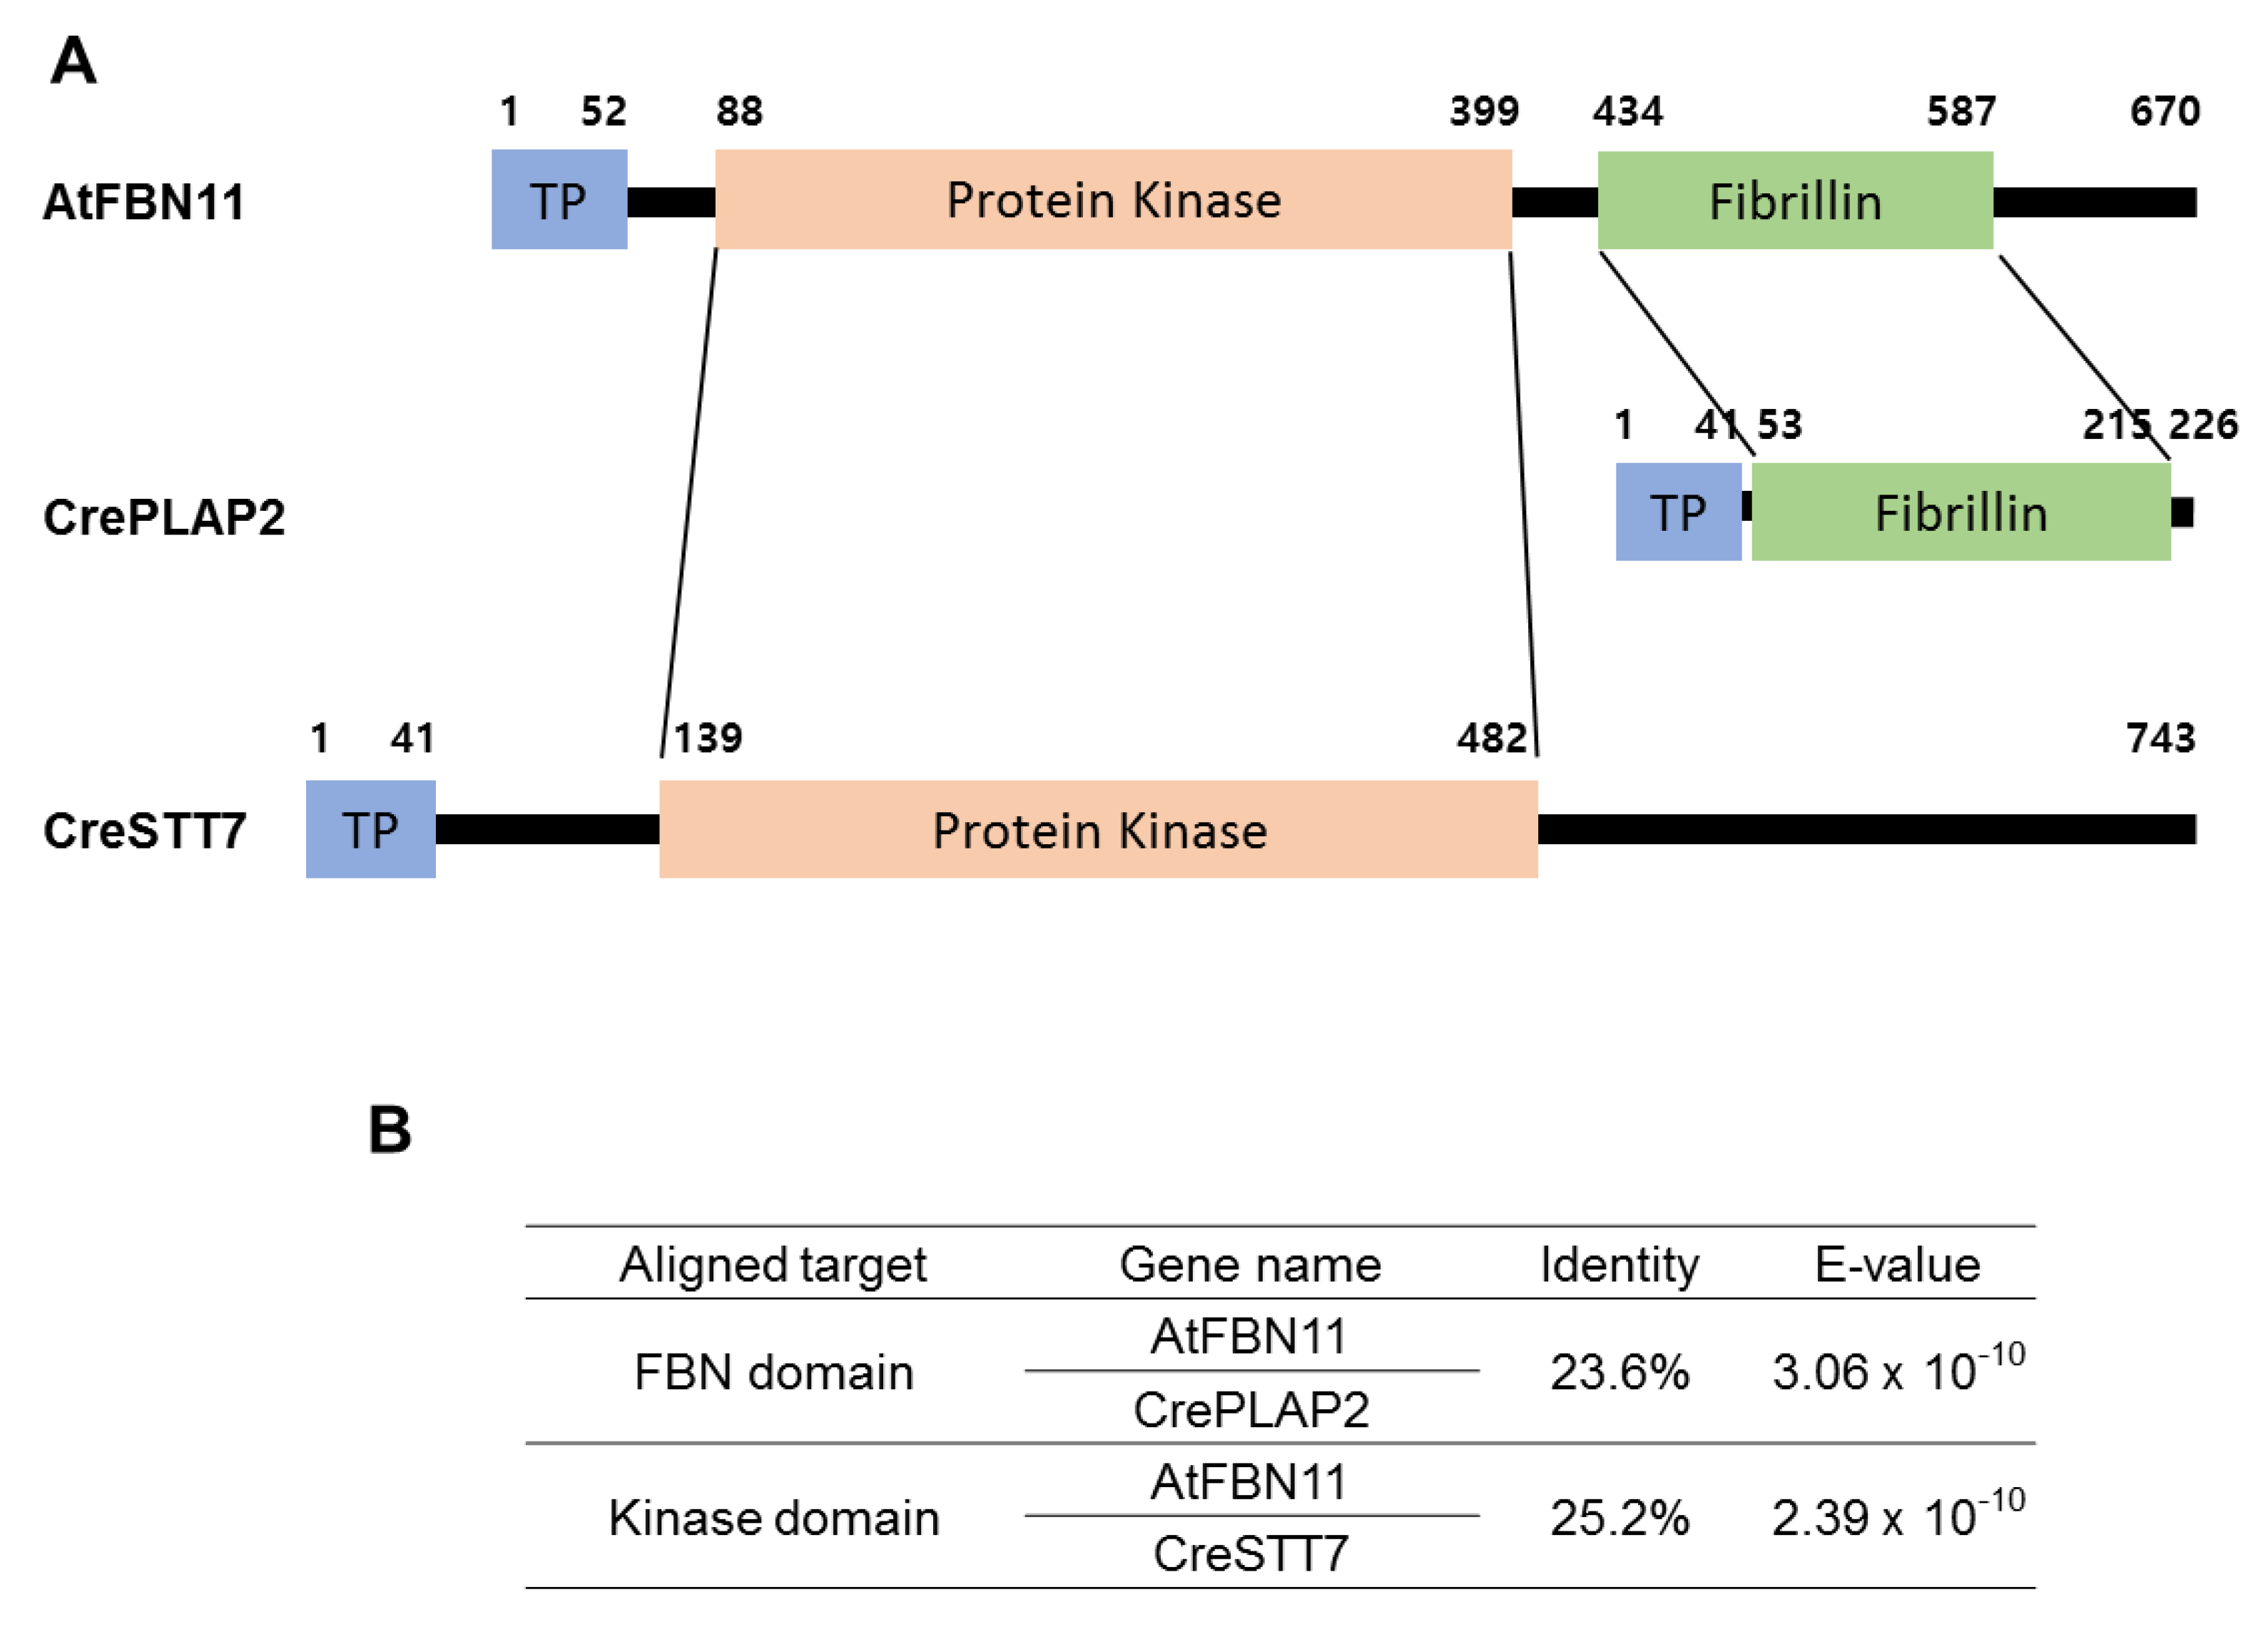
3.1. Structural Features of FBN11

Analysis of FBN11 protein sequence homology using BLASTP showed that FBN11 possesses a serine/threonine-protein kinase domain spanning amino acids 88 to 399 and an FBN domain spanning amino acids 434 to 587 (a unique feature among other FBN gene families) (Figure 1A). The kinase domain was analyzed using SWISS-MODEL (https://swissmodel.expasy.org/ accessed on 2 June 2020), which builds tertiary structure models based on homology to solved structures. Mitogen-activated protein kinase 7 (4ic7.2.A) was the template model with the highest homology (19.62%) among the 50 identified templates (Figure S1). ExPASy prosite (https://prosite.expasy.org/ accessed on 2 June 2020), which can be used to find and characterize domains within proteins, suggests that the kinase domain has two ATP binding sites (involving amino acids 94 and 126, respectively) and one active site (proton acceptor at amino acid position 255) (Figure 1B).
The structure and characteristics of FBN11 protein were analyzed using a program on the protein analysis website (https://web.expasy.org/cgi-bin/protparam/protparam accessed on 2 June 2020). FBN11 was richest in leucine (Leu; 11.3%), followed by serine (Ser) and arginine (Arg) (Table S2). The secondary structure of FBN11 consists of 32.09% alpha-helix (Hh), 19.25% extended strand (Ee), and 44.33% random coil (Cc) (Table S2). The isoelectric point (pH at which the protein’s positive and negative charges are equal) was 9.43, and the instability index indicating protein stability in vitro was 49.17. The aliphatic index (an indicator of thermal stability) was 90.34, which indicates high heat stability. The GRAVY value was −0.242, indicating that FBN11 is hydrophobic (Table S3).
The subcellular location of FBN11 was predicted by TargetP (http://www.cbs.dtu.dk/services/TargetP/ accessed on 2 June 2020 ), which predicted that FBN11 might localize to the chloroplast, with a chloroplast transport peptide sequence value of 0.976. FBN11 analysis using TMMM (http://www.cbs.dtu.dk/services/TMHMM/ accessed on 2 June 2020) gave a spiral crossing membrane value of 0 and determined the number of amino acids in the helix to be 0.03, suggesting that there are no transmembrane segments.
Summarizing the above results, FBN11 is a soluble hydrophobic FBN domain-containing protein with a kinase domain fused to the N-terminal region and a predicted chloroplast localization sequence.

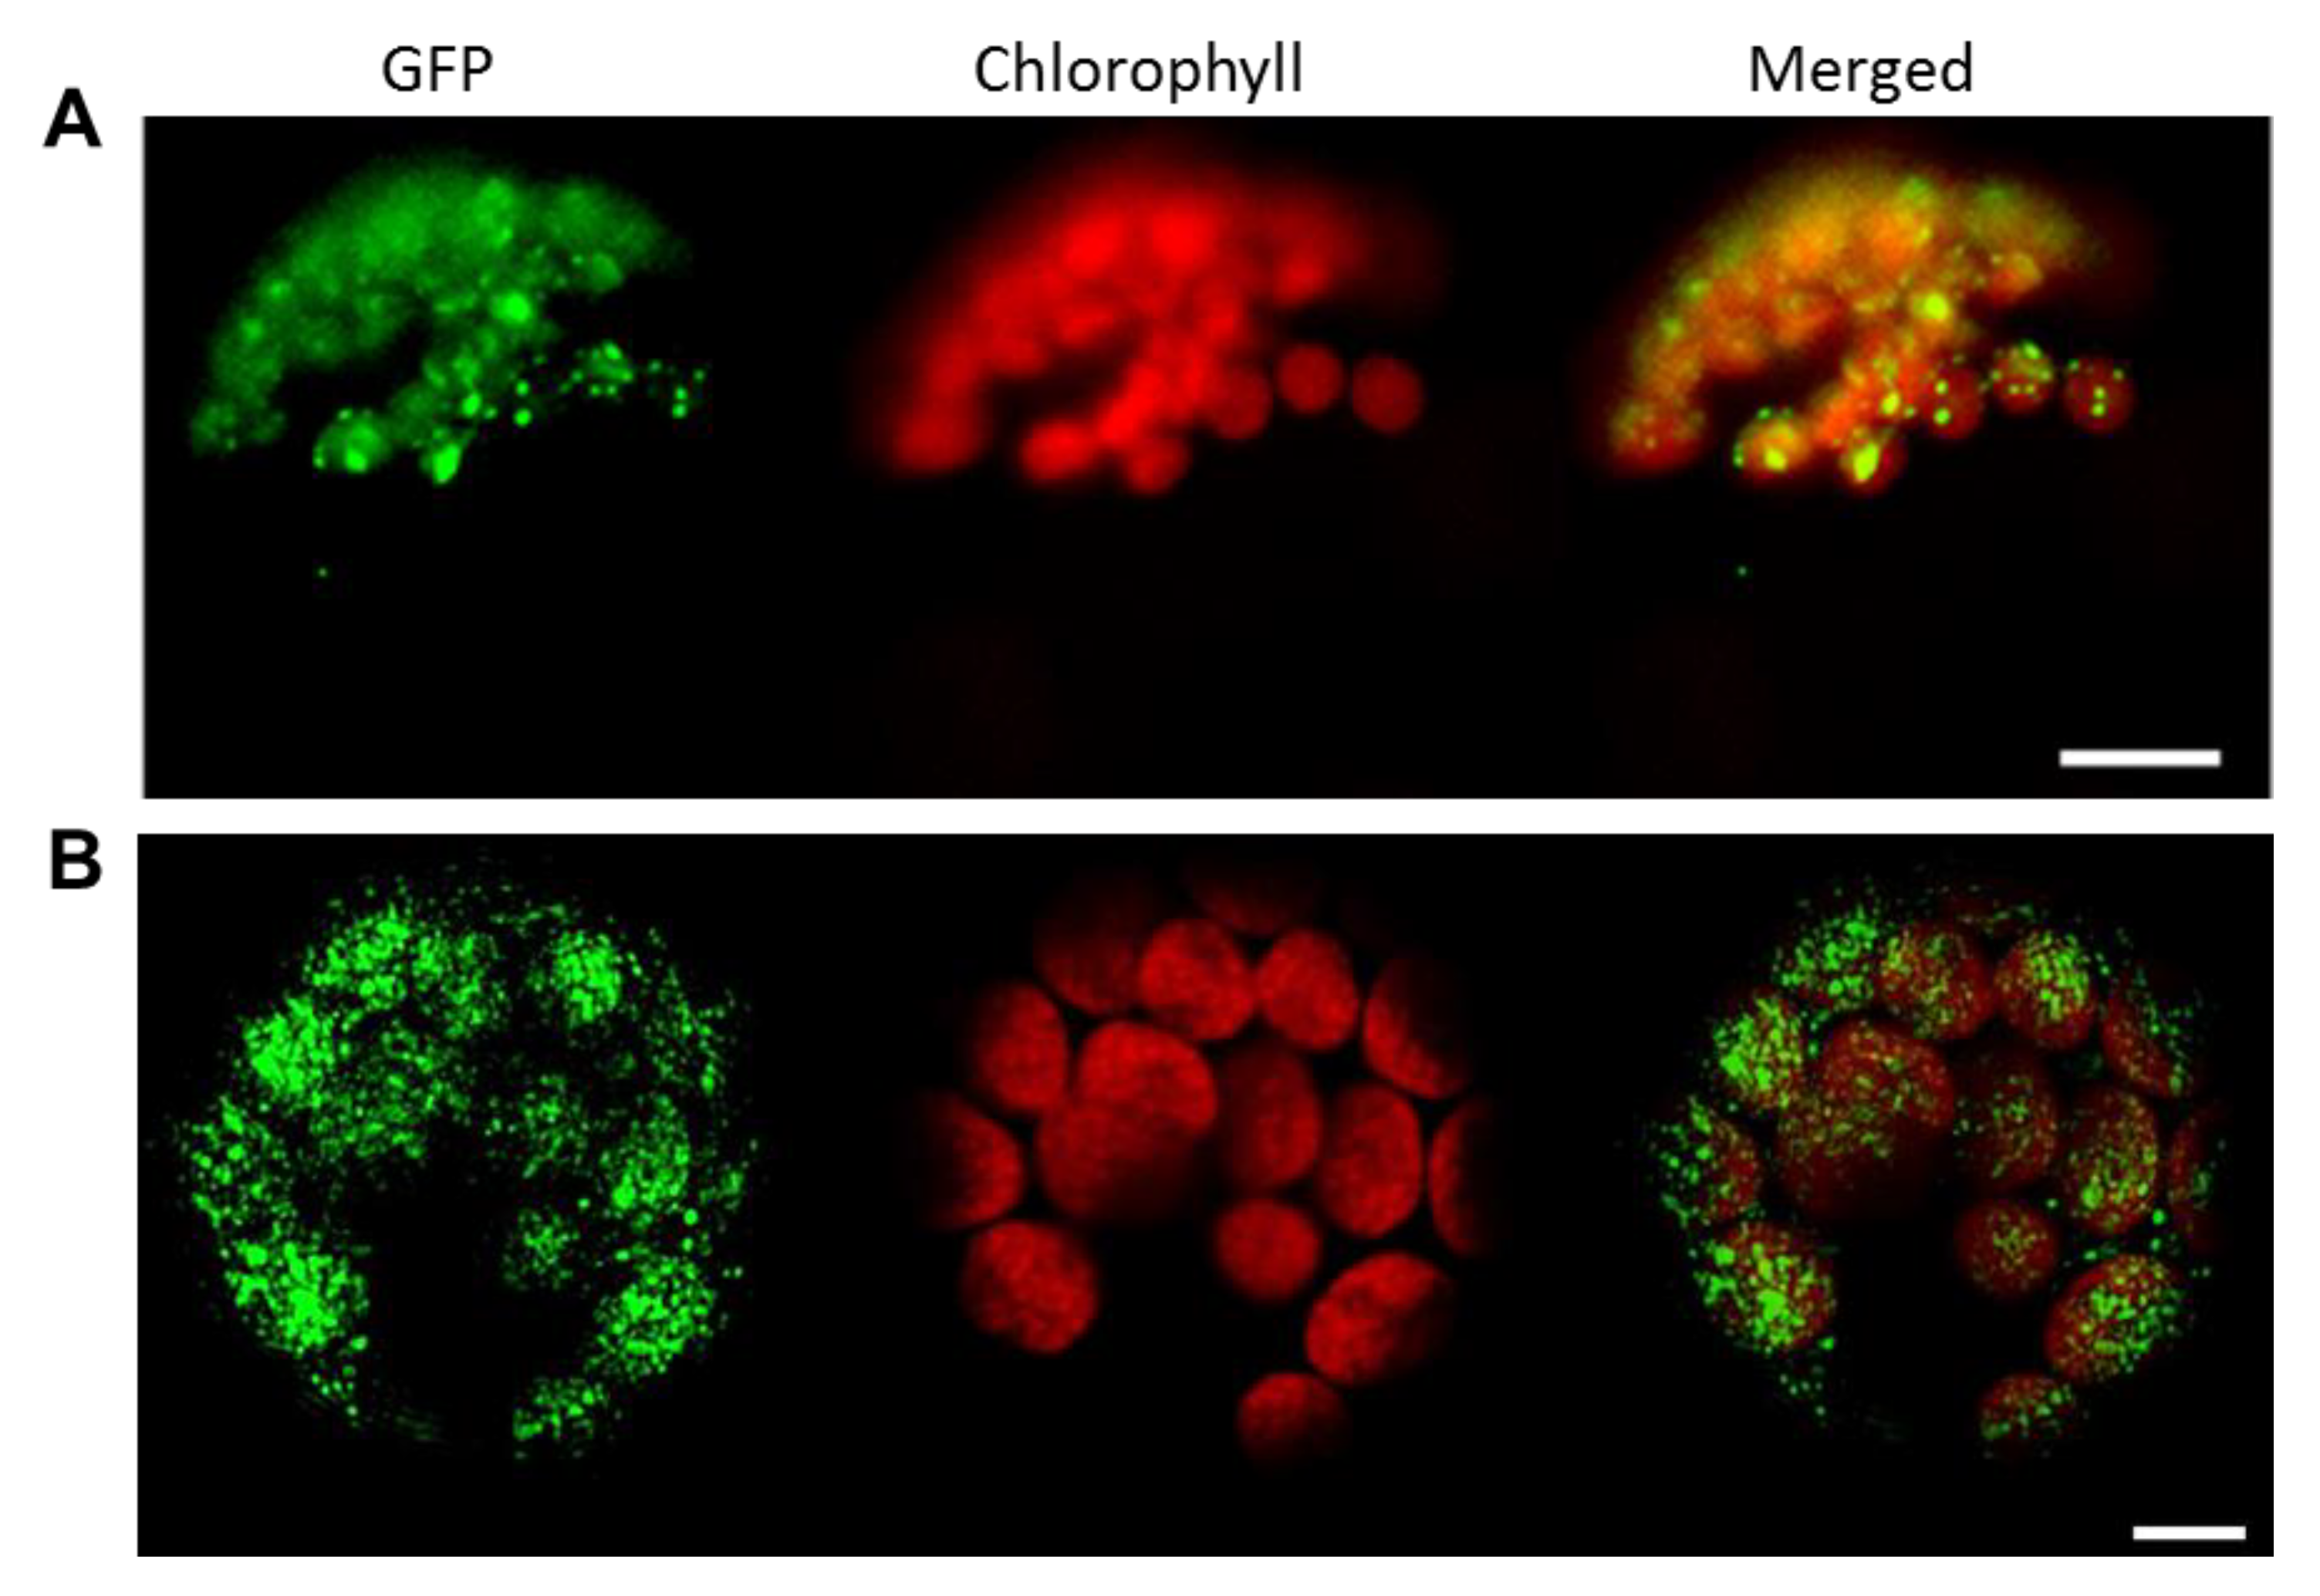
3.2. FBN11 Subcellular Location

FBNs have been reported to be present in chloroplasts [33]. To visualize subcellular localization of FBN11, a vector containing FBN11-sGFP under CaMV 35S promoter control was introduced into Arabidopsis and tobacco protoplasts, and sGFP green fluorescence was observed using fluorescence and confocal fluorescence microscopy, respectively. The small circular dense green fluorescent light of FBN11-sGFP overlaps with chlorophyll autofluorescence in the chloroplasts of Arabidopsis and tobacco. The location of FBN11-GFP in chloroplasts in two different plant species suggested that wild-type FBN11 may also exist in chloroplasts (Figure 2).

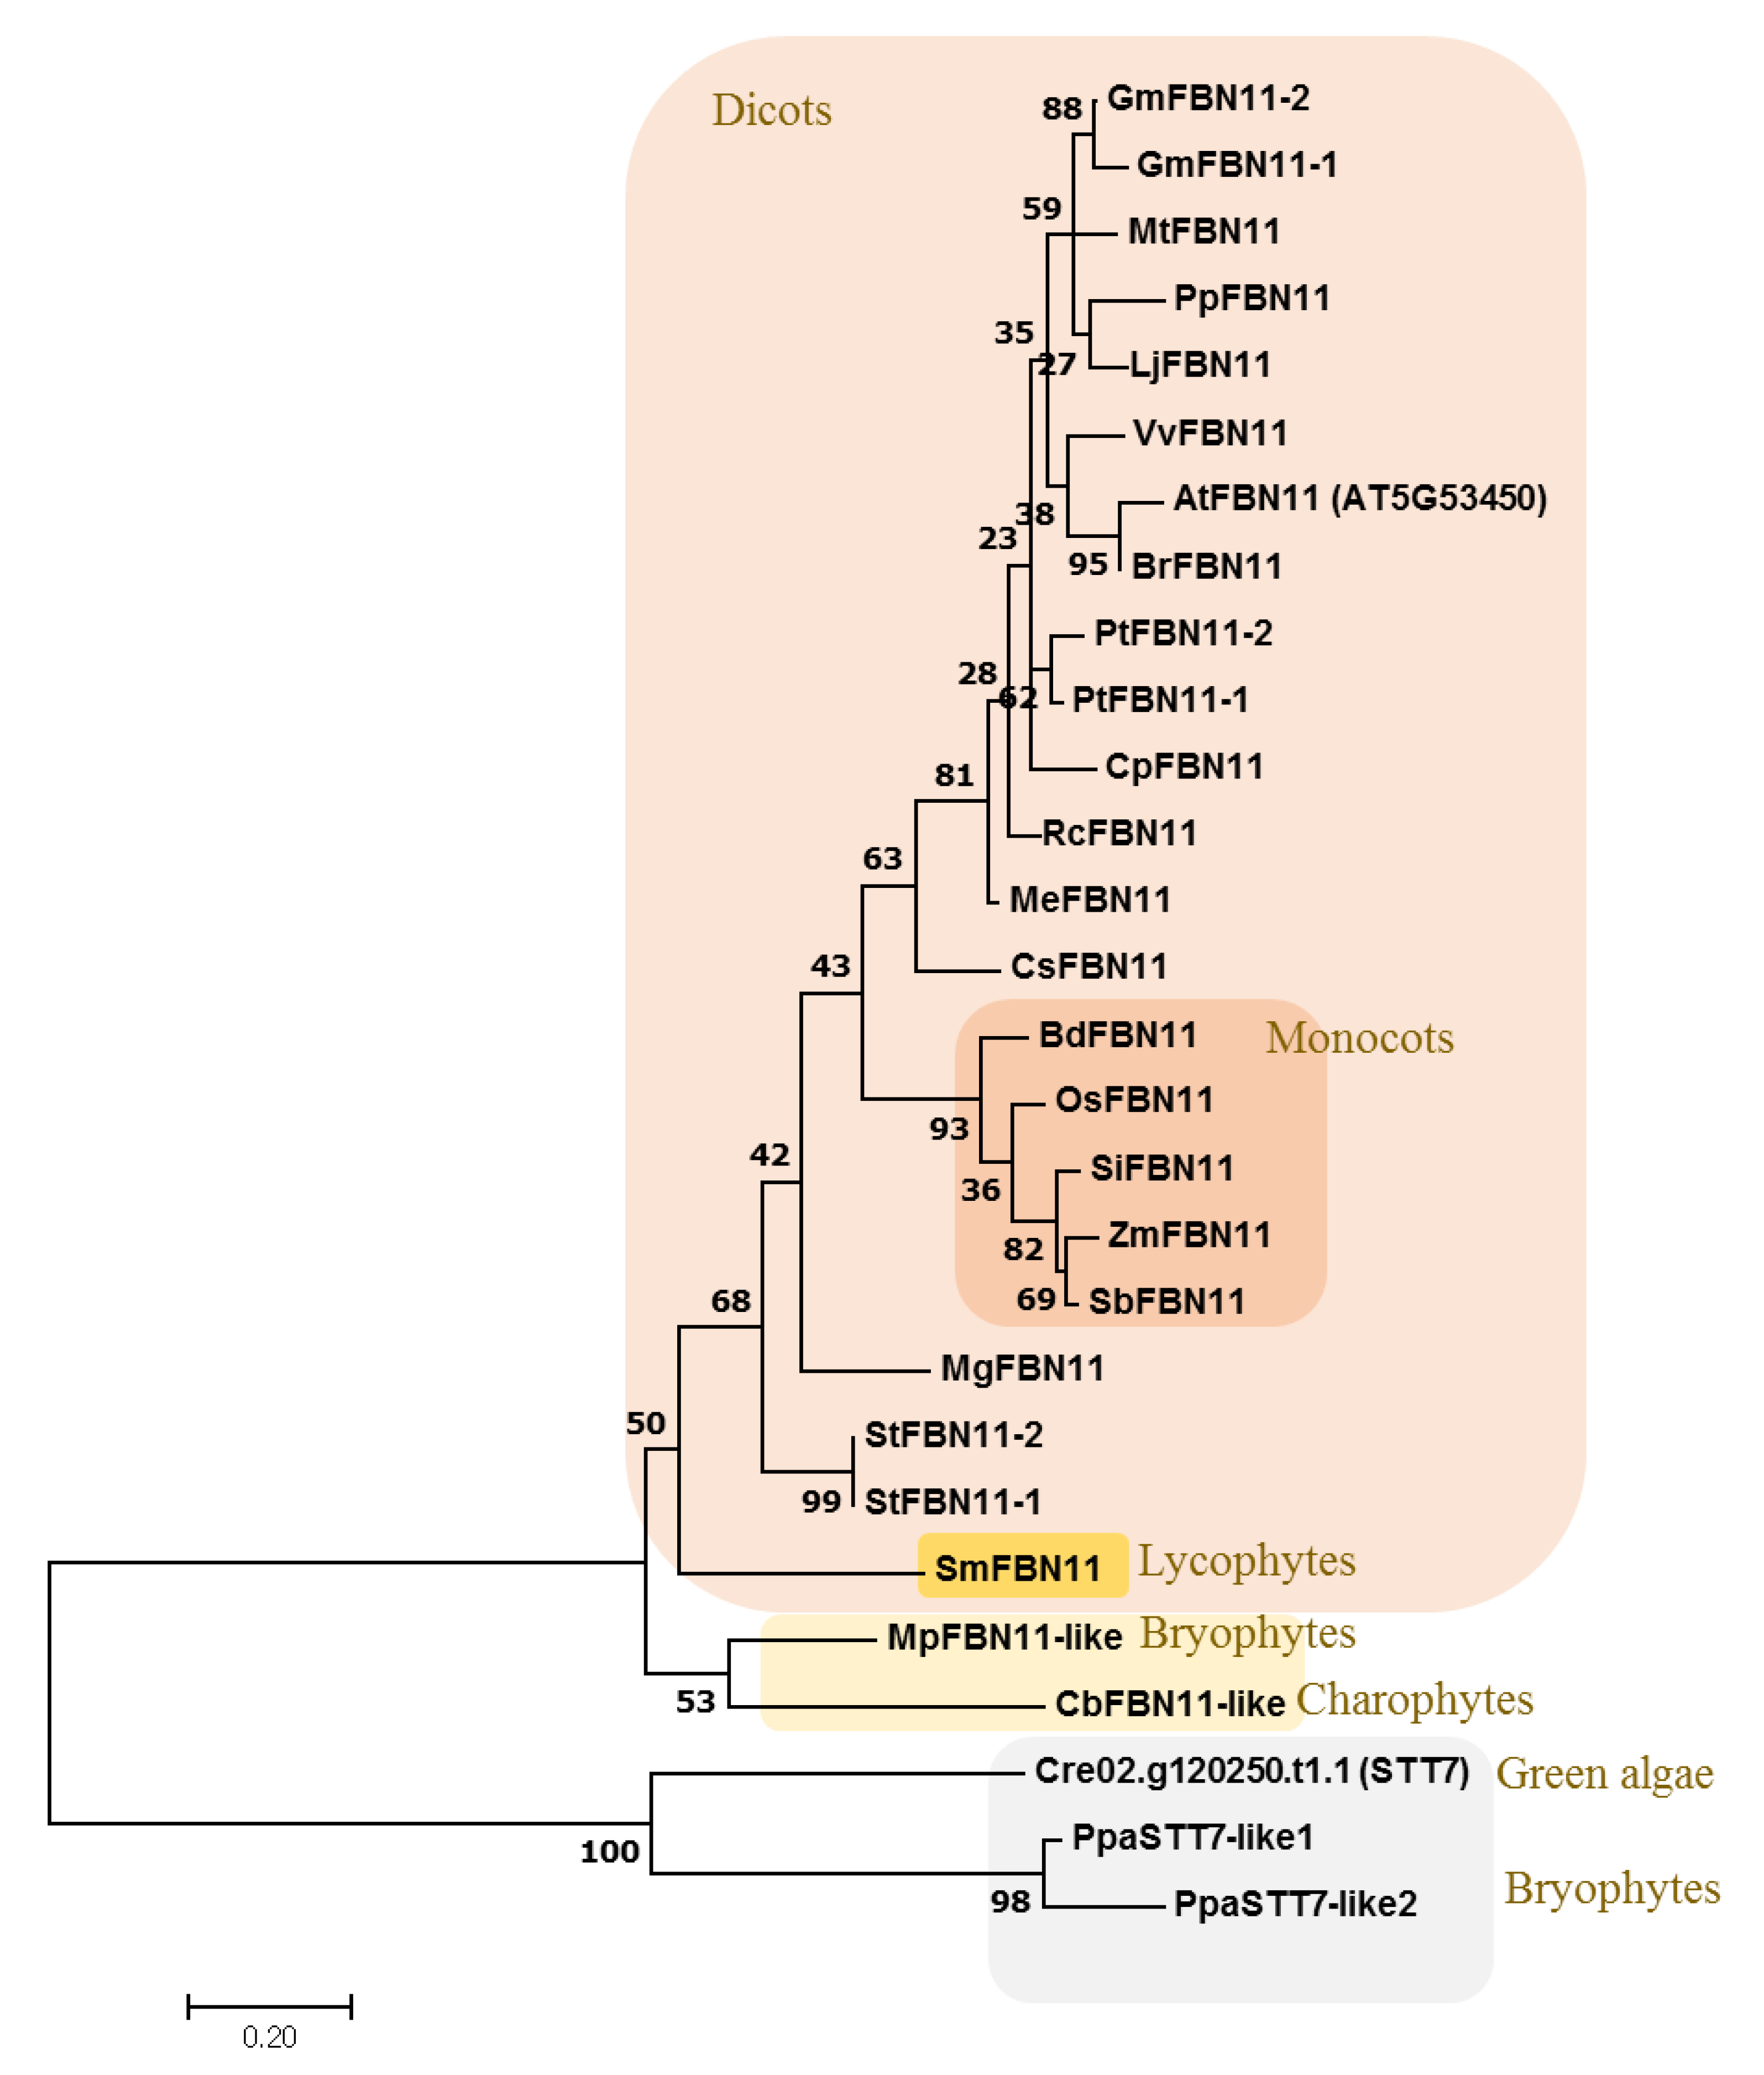
3.3. Evolution of FBN11

FBN11 orthologs were retrieved from the genome database of 14 dicotyledons, 5 monocotyledonous higher plants, Selaginella moellendorffii [(spike moss), which is representative lycophytes], Physcomitrella patens and Marchantia polymorpha (bryophytes), Chara braunii (charophytes), and Chlamydomonas reinhardtii (green algae) (Table S4). A phylogenetic tree was created to investigate the evolution of FBN11 in land plants (Figure 3). The tree indicated that FBN11 of lycophytes existed in the same clade (88–48% identity with AtFBN11) with FBN11s of higher plants. In addition, FBN11 orthologs (47–36% identity with AtFBN11) of Chara braunii and Marchantia polymorpha were distributed into the clade distinct from FBN11 orthologs of spike moss. STT7 of green algae Chlamydomonas reinhardtii and the bryophytes Physcomotrella patens have only a region similar to the kinase of FBN11 of higher plants. The above analysis suggests the existence of FBN11 in the higher plant after lycophytes during evolution.
Comparing the FBN gene family between Arabidopsis and the green algae Chlamydomonas revealed a total of 10 FBNs (PLAP) of Chlamydomonas showing homology with Arabidopsis (Table S5). After amino acid sequence analysis, the kinase domain of Arabidopsis FBN11 showed 34% homology with the kinase domain of CreSTT7 from Chlamydomonas and 26% homology with CrePLAP2 from Chlamydomonas (Figure 4, Figure S2). Analysis of FBN11 orthologs between higher plants and single-celled green algae suggests the possibility that kinase and FBN genes existed independently in the single-celled alga Chlamydomonas but were conjoined in FBN11 higher plants via a form of fusion by domain shuffling during evolution (Figure 4, Table S5).

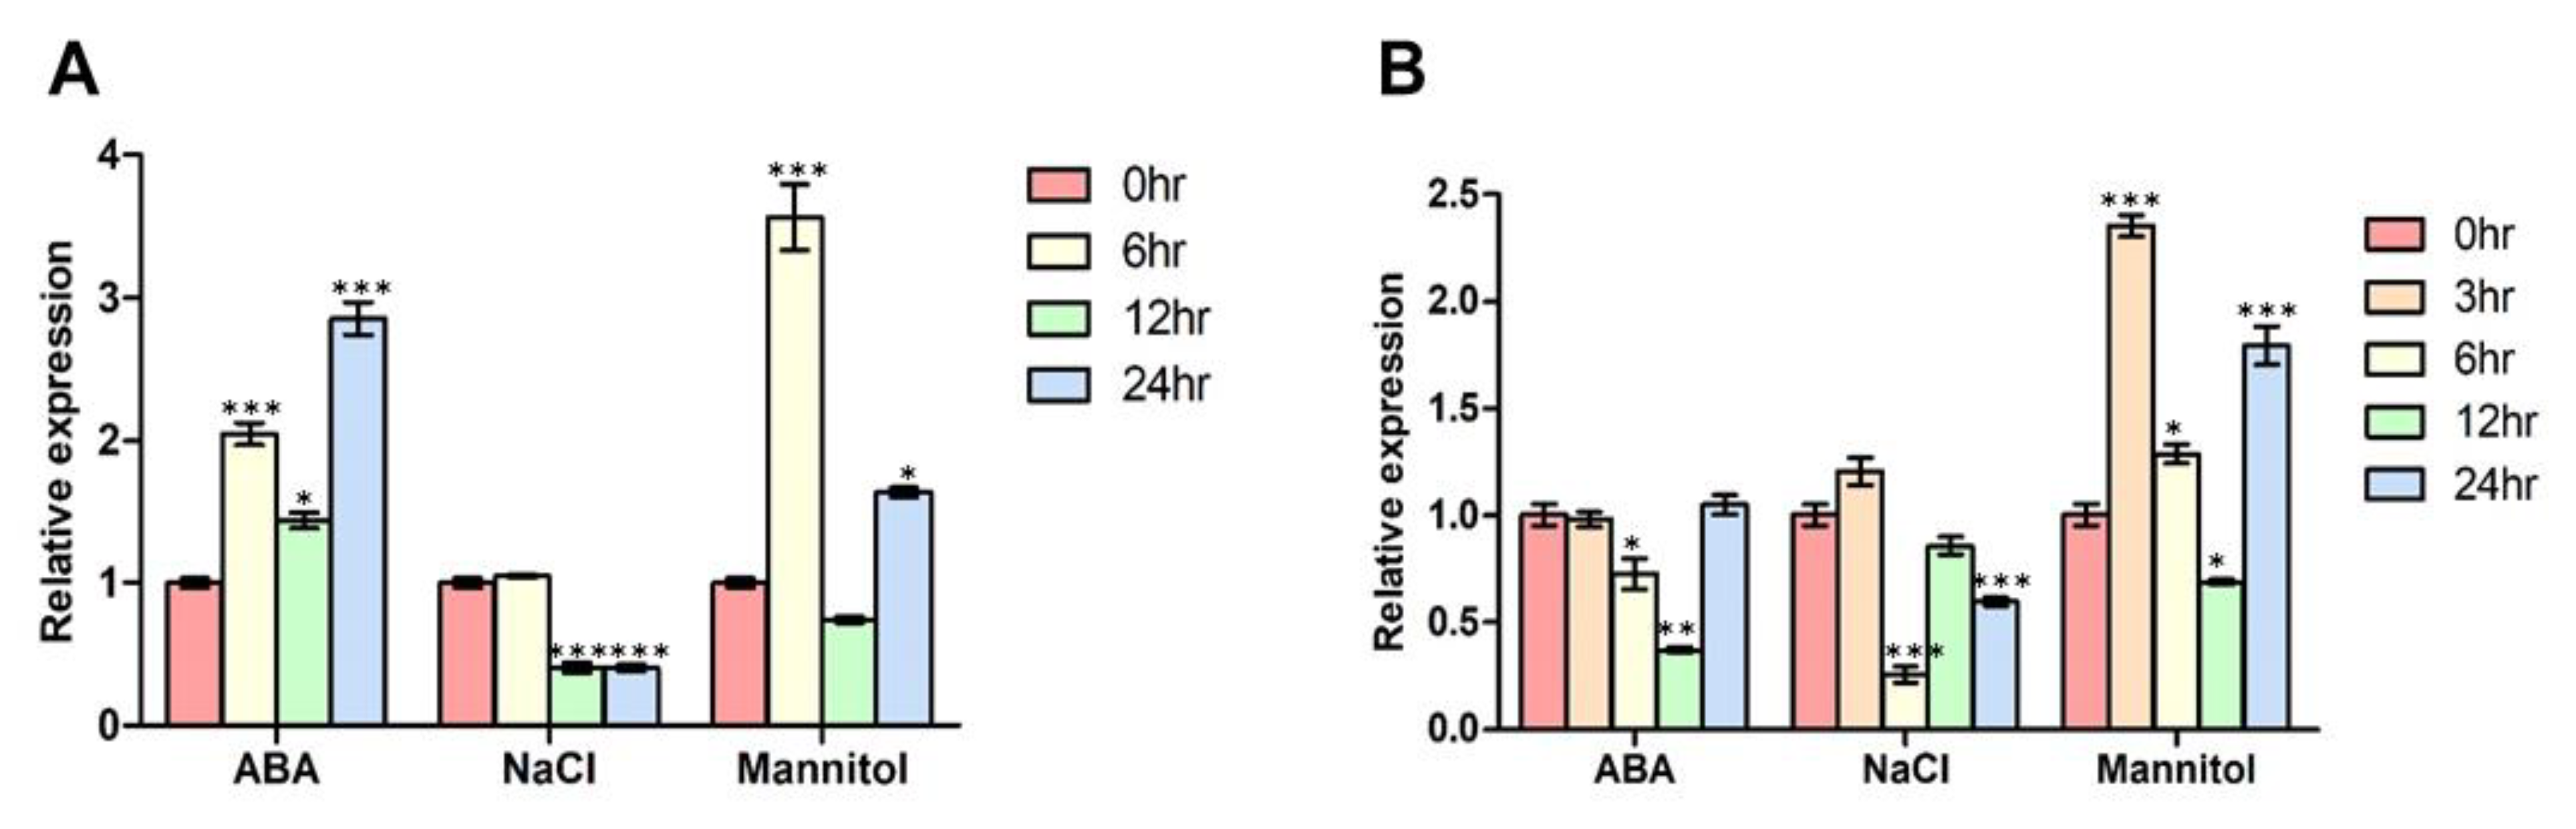
3.4. FBN11 Expression Profiles in Developing Tissue ± ABA, NaCl, or Mannitol Exposure

FBN11 expression in various tissues ± abiotic stress conditions was investigated using data from the TAIR eFP browser (http://bar.utoronto.ca/efp2/Arabidopsis/Arabidopsis_eFPBrowser2.html accessed on 7 June 2019). FBN11 was expressed in all tissues, including leaves, stems, flowers, roots, and siliques (Figure S3A). Among the five tissue types, expression was highest in the leaves, followed by flower, silique, stem, and root, in descending order (Figure S4A). FBN11 expression increased at 30 min, 1 h, and 3 h in 7-day-old wild-type seedlings treated with 10 μM ABA (Figure S3B). When 18-day-old seedlings were treated with 150 mM NaCl, FBN11 expression increased significantly at 3 h and 6 h, decreased at 12 h, and increased again at 24 h (Figure S3C). When 18-day-old seedlings were treated with 300 mM mannitol, the results were similar to those for treatment with 150 mM NaCl (Figure S3D).
To confirm that the results of the above analyses are reproducible, total RNA was extracted from each stressed tissue type from 10- and 18-day old seedlings for RT-qPCR analysis of FBN11 expression. When seedlings were treated with 100 μM ABA, FBN11 expression was elevated at 6 h, 12 h, and 24 h. When seedlings were treated with 150 mM NaCl, FBN11 expression remained unchanged for up to 6 h, then declined at 12 h. In tissues treated with 300 mM mannitol, FBN11 expression increased significantly at 6 h, decreased at 12 h, then increased again at 24 h compared to untreated tissue (Figure 5A). In order to investigate the expression pattern of FBN11 at low concentrations of ABA, 1 μM ABA was treated for 18-days-old seedlings. Treatment with 1 μM ABA did not induce FBN11 expression. Expression was slightly reduced at 6 and 12 h in 18-days-old seedlings. Exposure to 150 mM NaCl tended to decrease FBN11 expression compared to non-treated control tissues. When seedlings were treated with 300 mM mannitol, FBN11 expression was significantly increased at 3, 6, and 24 h (Figure 5B). When wild-type plants were treated with 150 mM NaCl, the expression of FBN11 was decreased at 6 h (Figure 5B), but a contrast pattern appears in the Arabidopsis gene expression atlas (eFP browser) under the same conditions that showed an induced expression (Figure S3). The difference between these two experiments cannot rule out the possibility that the expression of the AteIF4a internal control gene was affected by NaCl treatment. In both experiments, FBN11 expression was significantly and rapidly increased by treatment with 300 mM mannitol. These results suggest that FBN11 is induced by osmotic changes and functions as an important osmotic stress response gene.

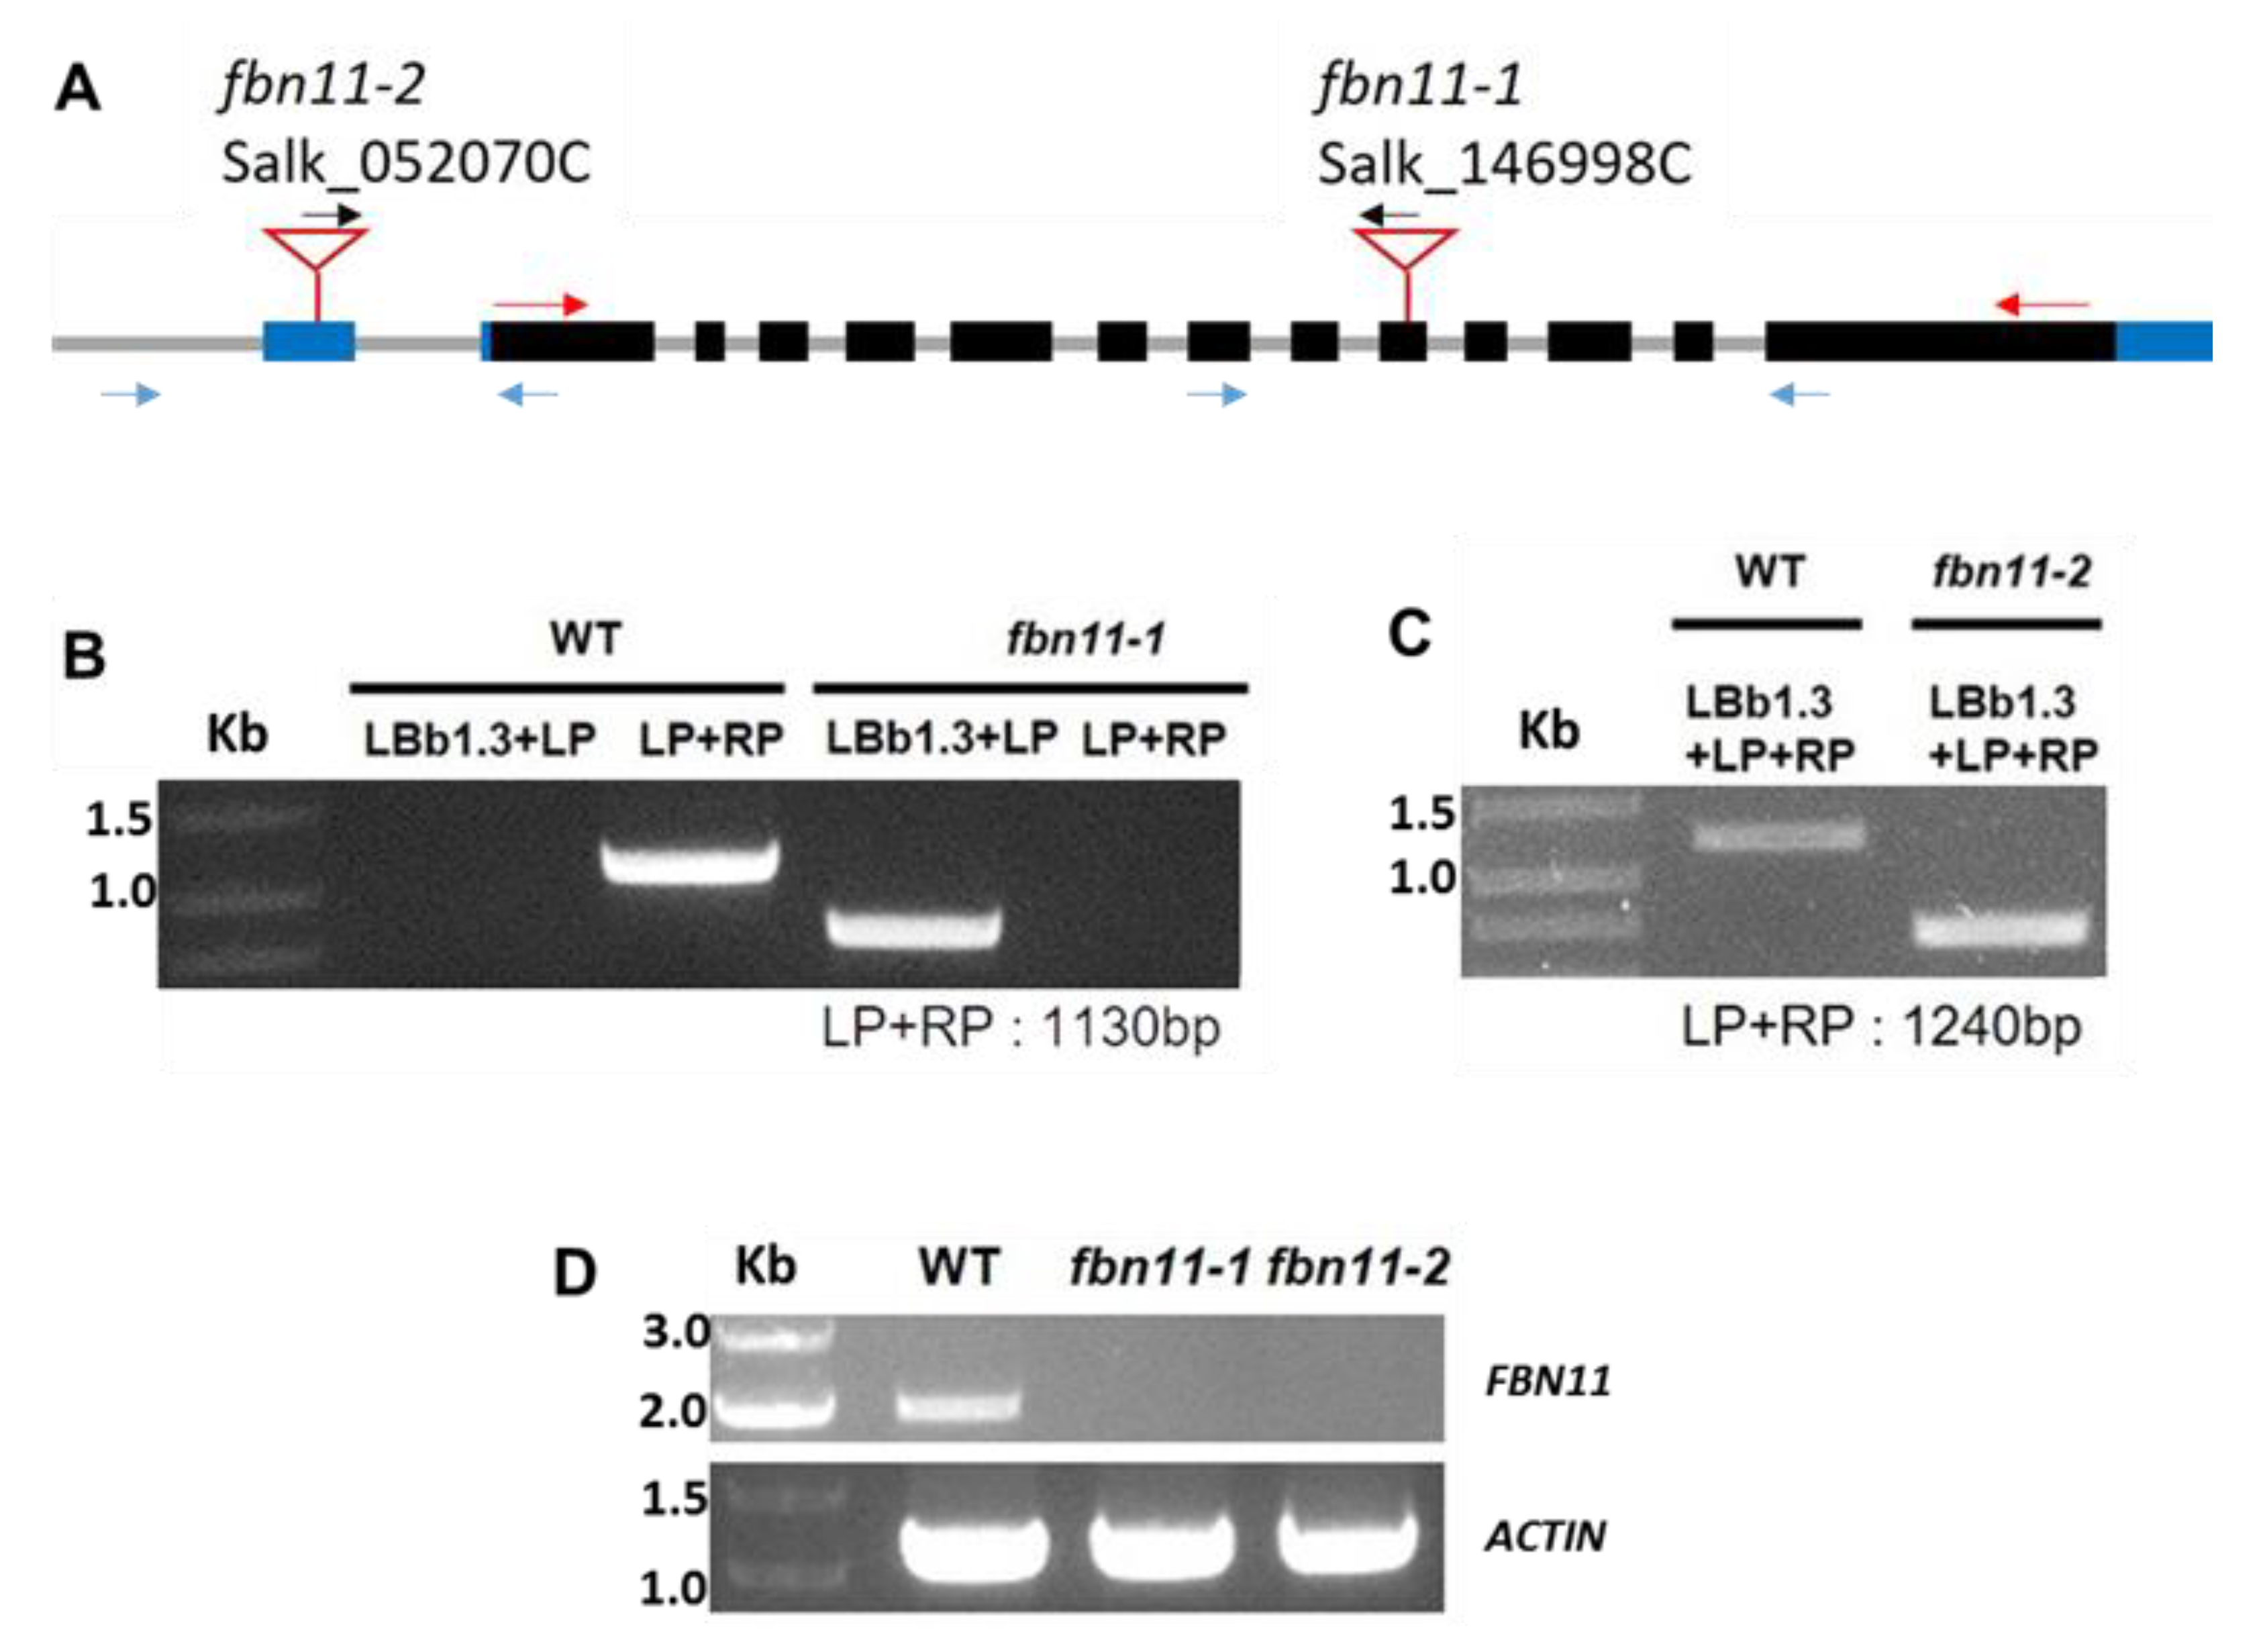
3.5. Characterization of fbn11 Mutants

To characterize FBN11′s possible role in abiotic stress tolerance, fbn11 homozygous loss of function mutants (due to T-DNA insertion into FBN11 genomic DNA) were identified. Using FBN11 gene-specific primers and a T-DNA border primer, homozygous mutants were selected from the salk_052070C and salk_146998C lines based on differences in PCR product size. Two types of fbn11homozygous mutants were selected. As shown in the graphical representation of the FBN11 gene, one has fbn11-2 with T-DNA inserted in the 5’-UTR region, and the other has fbn11-1 with T-DNA inserted in the 9th exon (Figure 6A). Genomic DNA was isolated from wild-type and mutant leaves, and PCR was performed using a T-DNA left border targeting primer (LBb1.3) and an FBN11 gene-specific primer pair (LP and RP primers for T-DNA orientation). As shown in Figure 6B,C, 1130 and 1240 bp bands were found in the wild type, and smaller bands were found in the fbn11-1 and fbn11-2 mutants. RT-PCR results confirmed the loss of FBN11 transcripts in both homozygous mutants (Figure 6D).

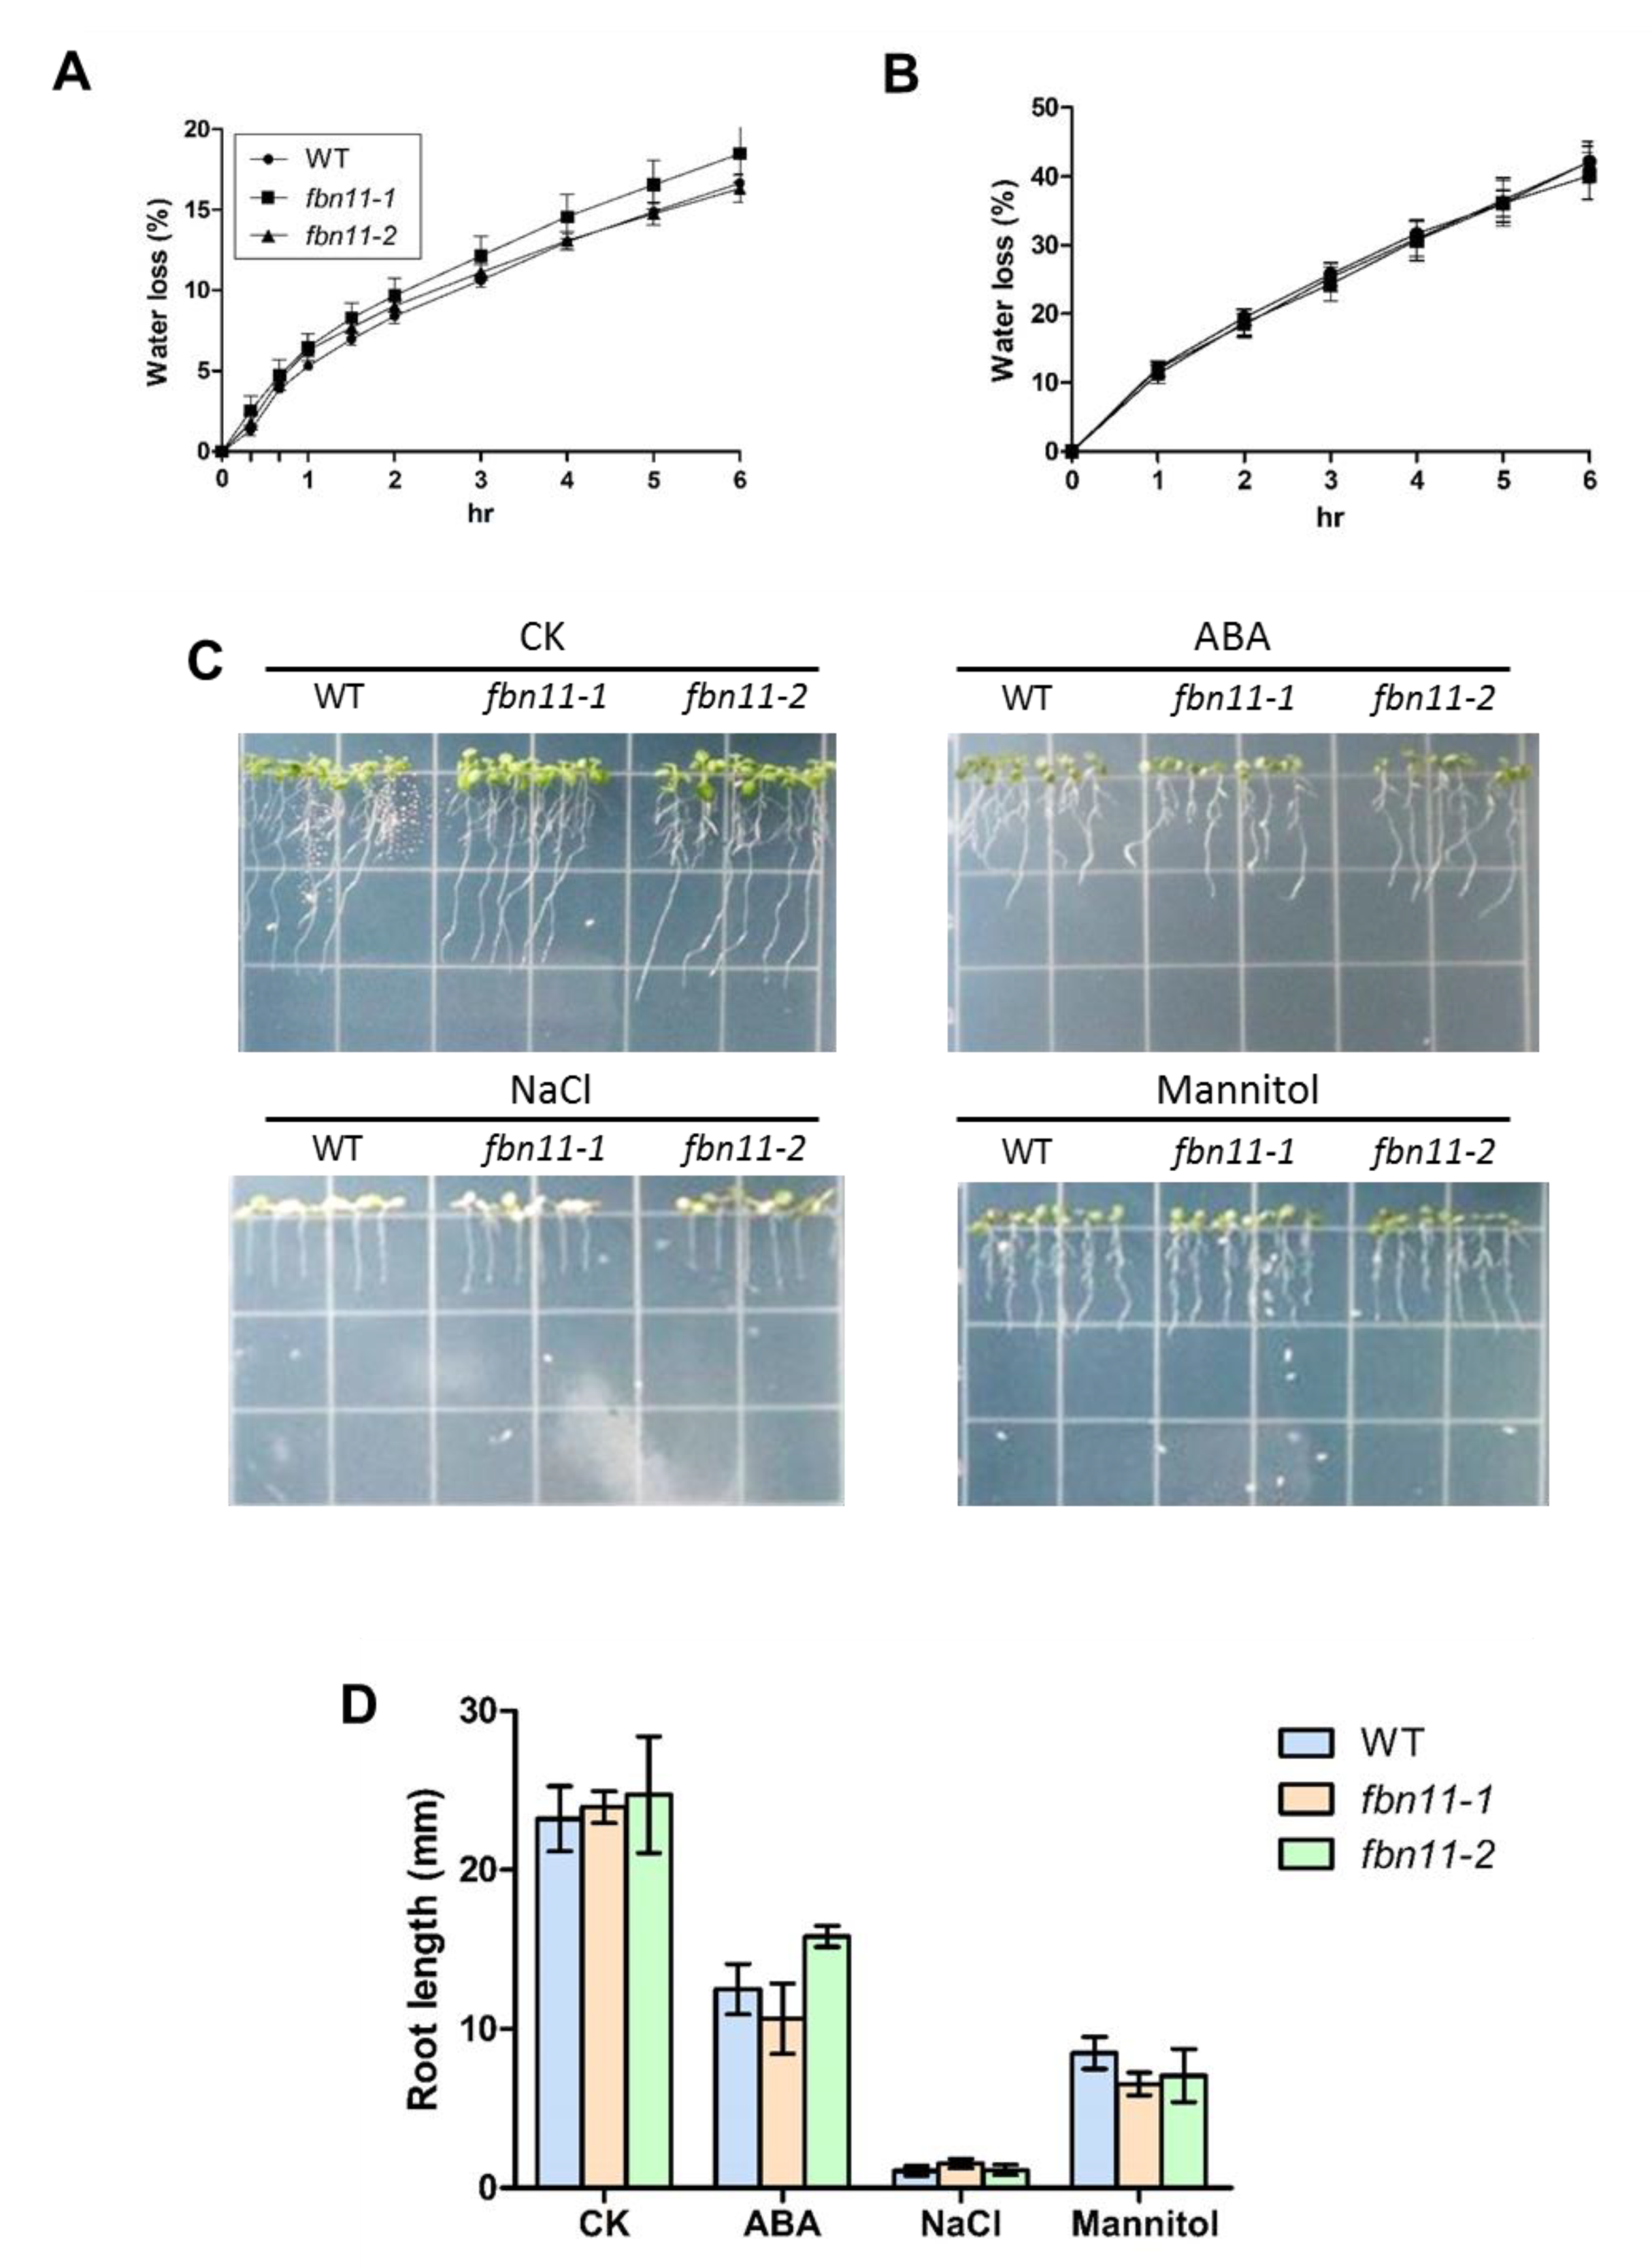
3.6. Phenotype Comparison between Wild Type and fbn11 Mutants Exposed to Abiotic Stresses

To elucidate FBN11 function in abiotic stress, phenotypic differences in drought stress were investigated using wild-type, fbn11-1, and fbn11-2 mutants. The rate of water loss is an early indicator of drought stress tolerance. According to the water loss measurement method proposed by Baek et al. [34], four-week-old wild-type and mutant shoots were cut from the roots, separated, and weighed immediately. They were placed at room temperature in a covered plate and reweighed periodically to determine the decrease rate of weight (Figure 7A). To verify these results by an alternative method, three-week-old wild-type and mutant leaves of the same developmental period were separated from the plant and placed in a dry environment using a hood, and the rate of water loss was again measured (Figure 7B). There was no more than a 2% difference in water loss rate between wild type and fbn11 mutant plants in both cases.
To determine whether the fbn11 mutant displayed a difference in root development, a 5-day-old seedling was transferred from 1/2 MS medium to medium containing 20 μM ABA, 200 mM NaCl, or 300 mM mannitol, and root growth and development was observed for eight days (Figure 7C). The distance that the root tips extended over eight days was measured using Image J software (https://imagej.nih.gov/ij/ accessed on 24 September 2019). Root length in normal medium extended by 23.2 mm in wt, 23.9 mm in fbn11-1, and 24.7 mm in fbn11-2. Average root growth in 20 μM ABA medium was 12.5 mm (wt), 10.6 mm (fbn11-1), and 15.8 mm (fbn11-2). Average growth in 200 mM NaCl medium was 1.08 mm (wt), 1.54 mm (fbn11-1), and 1.13 mm (fbn11-2). Average growth in 300 mM mannitol was 8.49 mm (wt), 6.55 mm (fbn11-1), and 7.07 mm (fbn11-2). In all cases, no distinct difference was found between wild type and mutant (Figure 7D). Taken together, loss of FBN11 function did not significantly impact plant response to ABA, NaCl, or mannitol treatment.

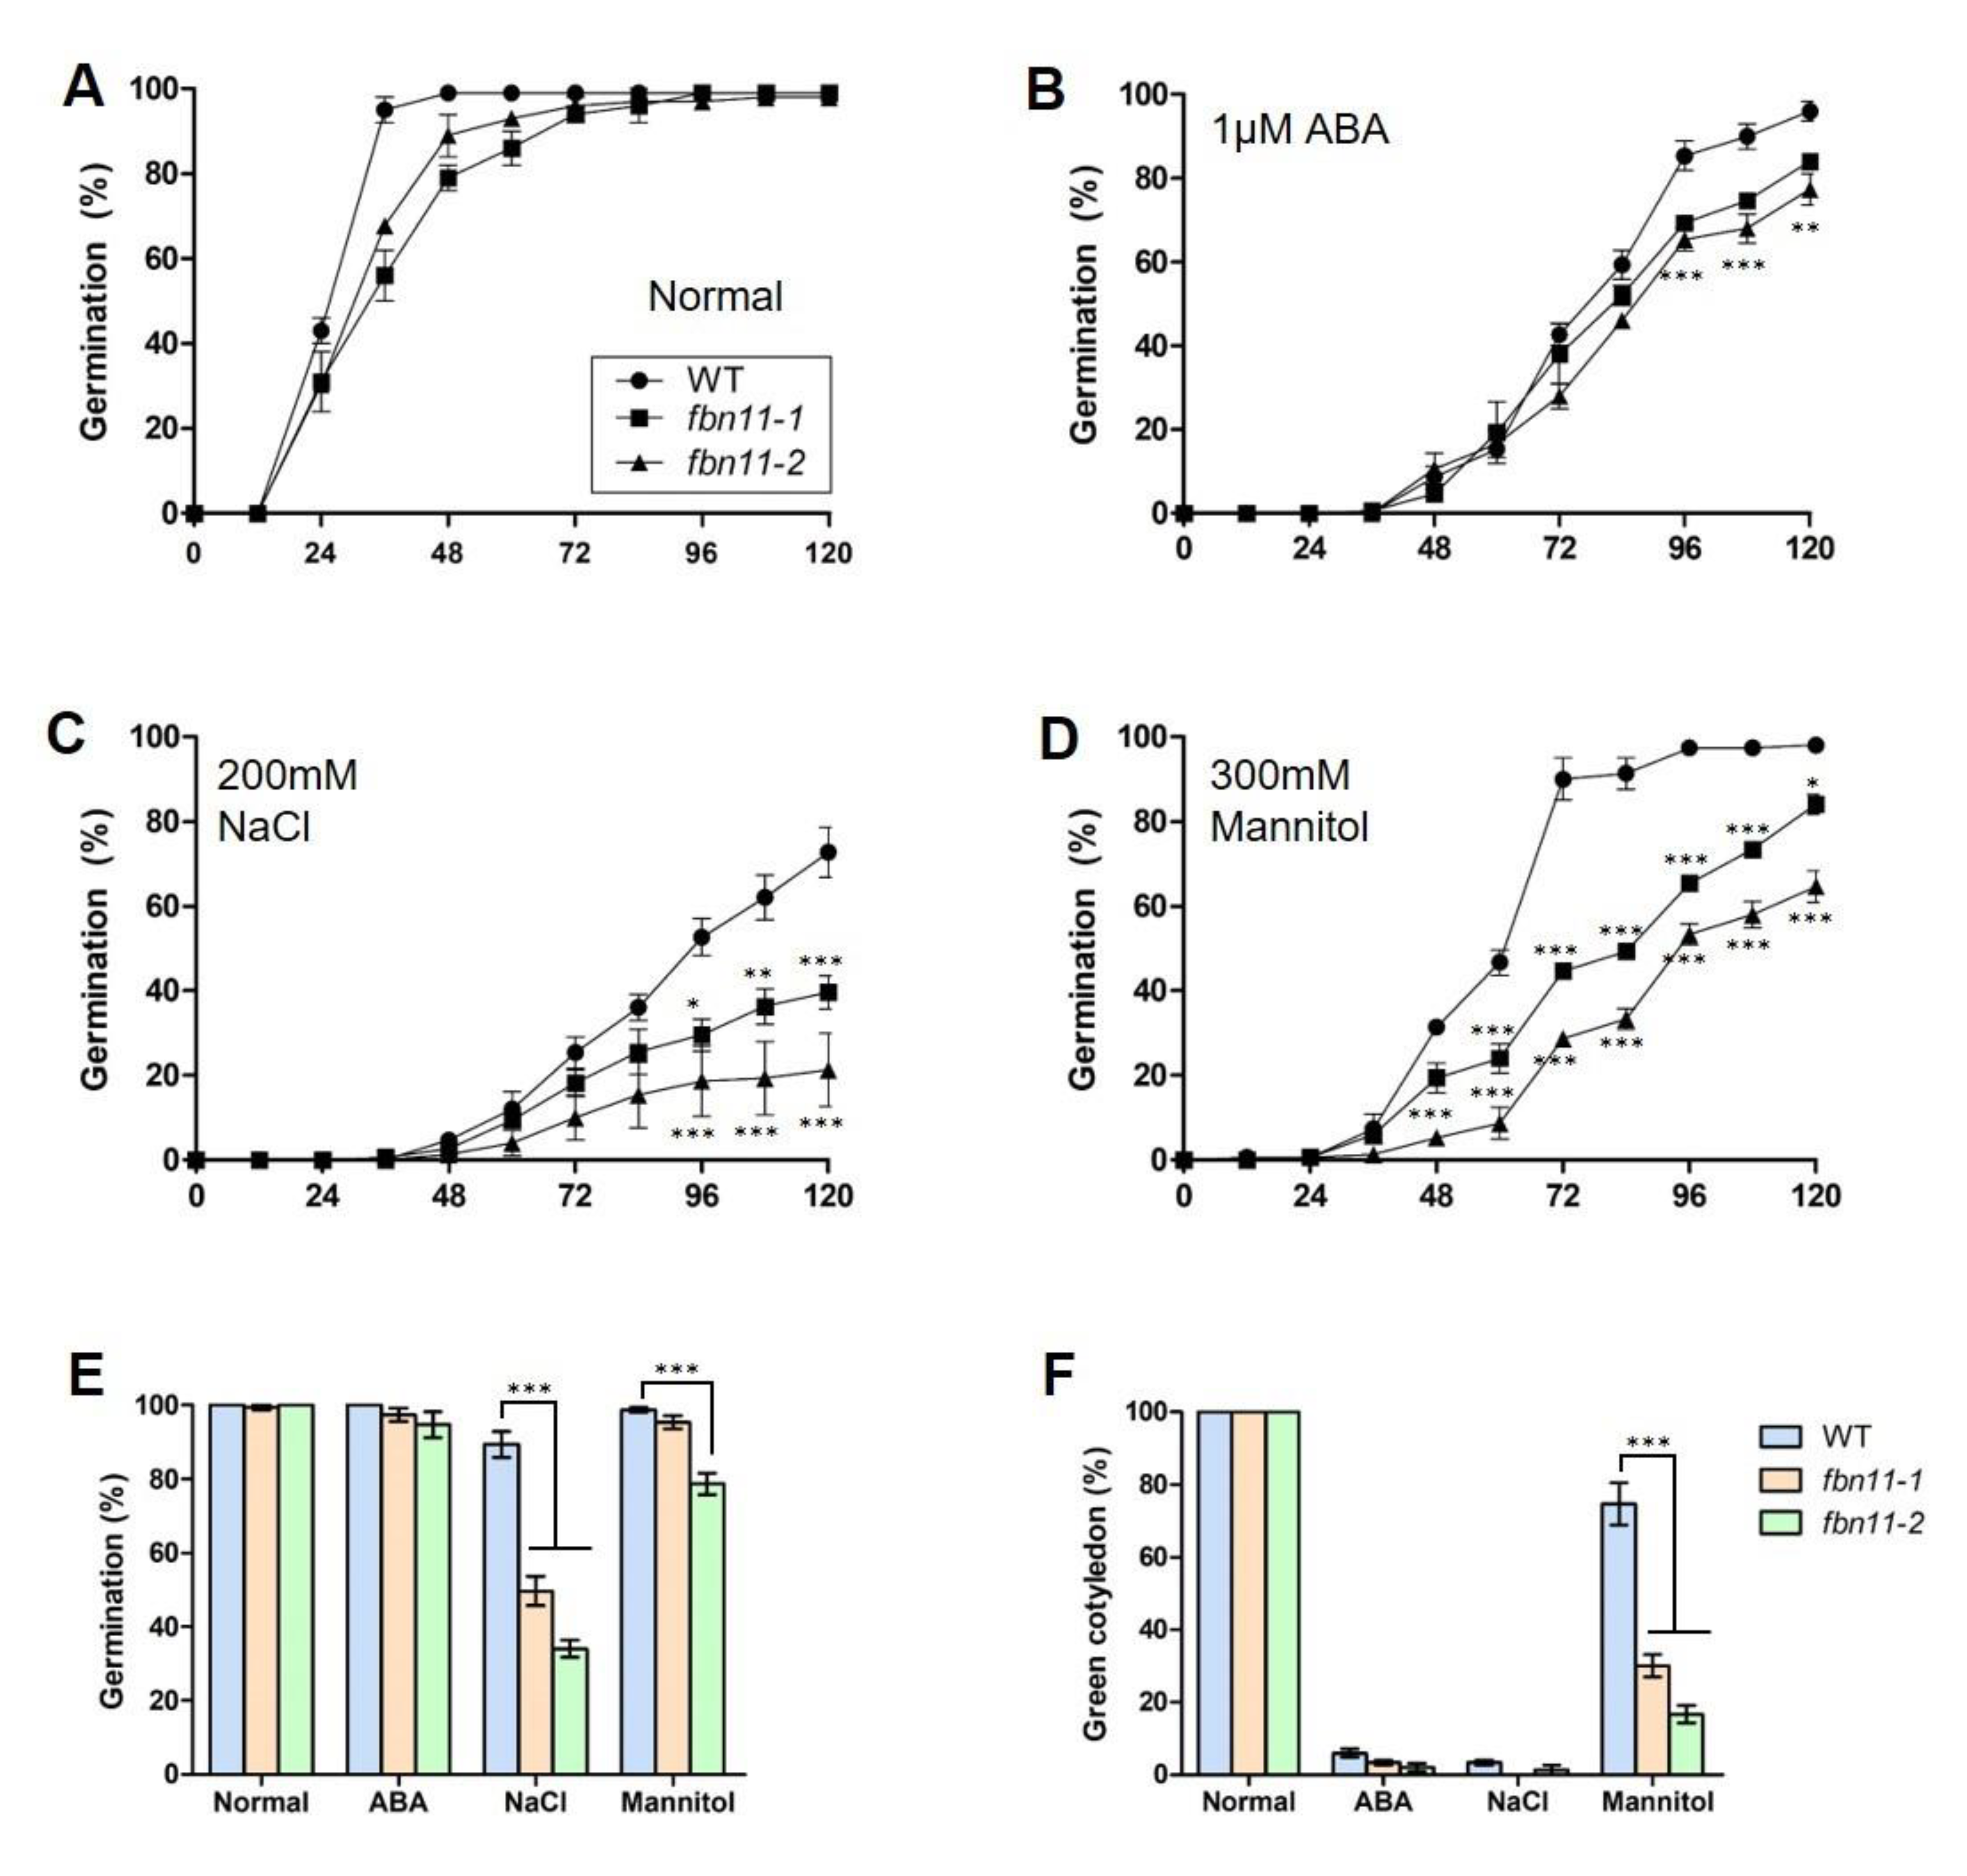
3.7. Analysis of fbn11 Effect on Seed Germination Pattern under Different Stress Conditions

Expression profiles of 14 FBN family genes in the late stage of seed maturation revealed the strongest FBN11 expression (Figure S4). These results suggest a possible role for FBN11 in seed germination.
The germination rates of wild type and fbn11 homozygous mutant seeds were compared under stressed conditions. In standard 1/2 MS medium with no stress treatment, germination of fbn11 mutant seeds was 48 h slower than wild type. A 100% germination rate was observed at 72 h. At that point, there was no difference between wild type and mutant germination rates (Figure 8A). The germination rate of fbn11 mutants in 1/2 MS medium supplemented with 1 μM ABA decreased after 96 h compared to that of the wild type (Figure 8B). In the medium supplemented with 200 mM NaCl, seed germination rates of both wild type and fbn11 mutants were slow for 48 h, and the difference in germination rates between wild-type and fbn11 mutants increased after 72 h, suggesting that the germination rate of fbn11 was lower than that of the wild type (Figure 8C). In the medium containing 300 mM mannitol, a clear difference in germination rates of wild-type and fbn11 mutants began to be apparent by 48 h. Under these conditions, the wild-type germination rate increased sharply at 72 h, whereas fbn11 mutant seed germination remained delayed (Figure 8D). Figure 7E,F show the final germination and green cotyledon formation rates of wild type and fbn11 mutant seeds after 7 d in ABA, NaCl, or mannitol supplemented medium. Compared to wild type, the fbn11 mutant germination rate was decreased in stress-inducing media. The germination rate of fbn11-2 in NaCl and mannitol medium was significantly lower than that of the fbn11-1 mutant and the wild type (Figure 8E). In addition, the green cotyledon formation rate was significantly lower in fbn11 mutants, especially in mannitol, compared to wild type (Figure 8F and Figure S5). In osmotic stress, fbn11-2 with T-DNA inserted in the first exon of 5’-UTR showed a stronger seed germination inhibition phenotype than fbn11-1 inserted in the tenth exon (Figure 6, Figure 8). This phenomenon suggests the possibility that truncated FBN11 produced by T-DNA insertion in fbn11-1 may play an incomplete role (Figure S6). Taken together, these results indicate that FBN11 responds sensitively to mannitol-induced osmotic stress.

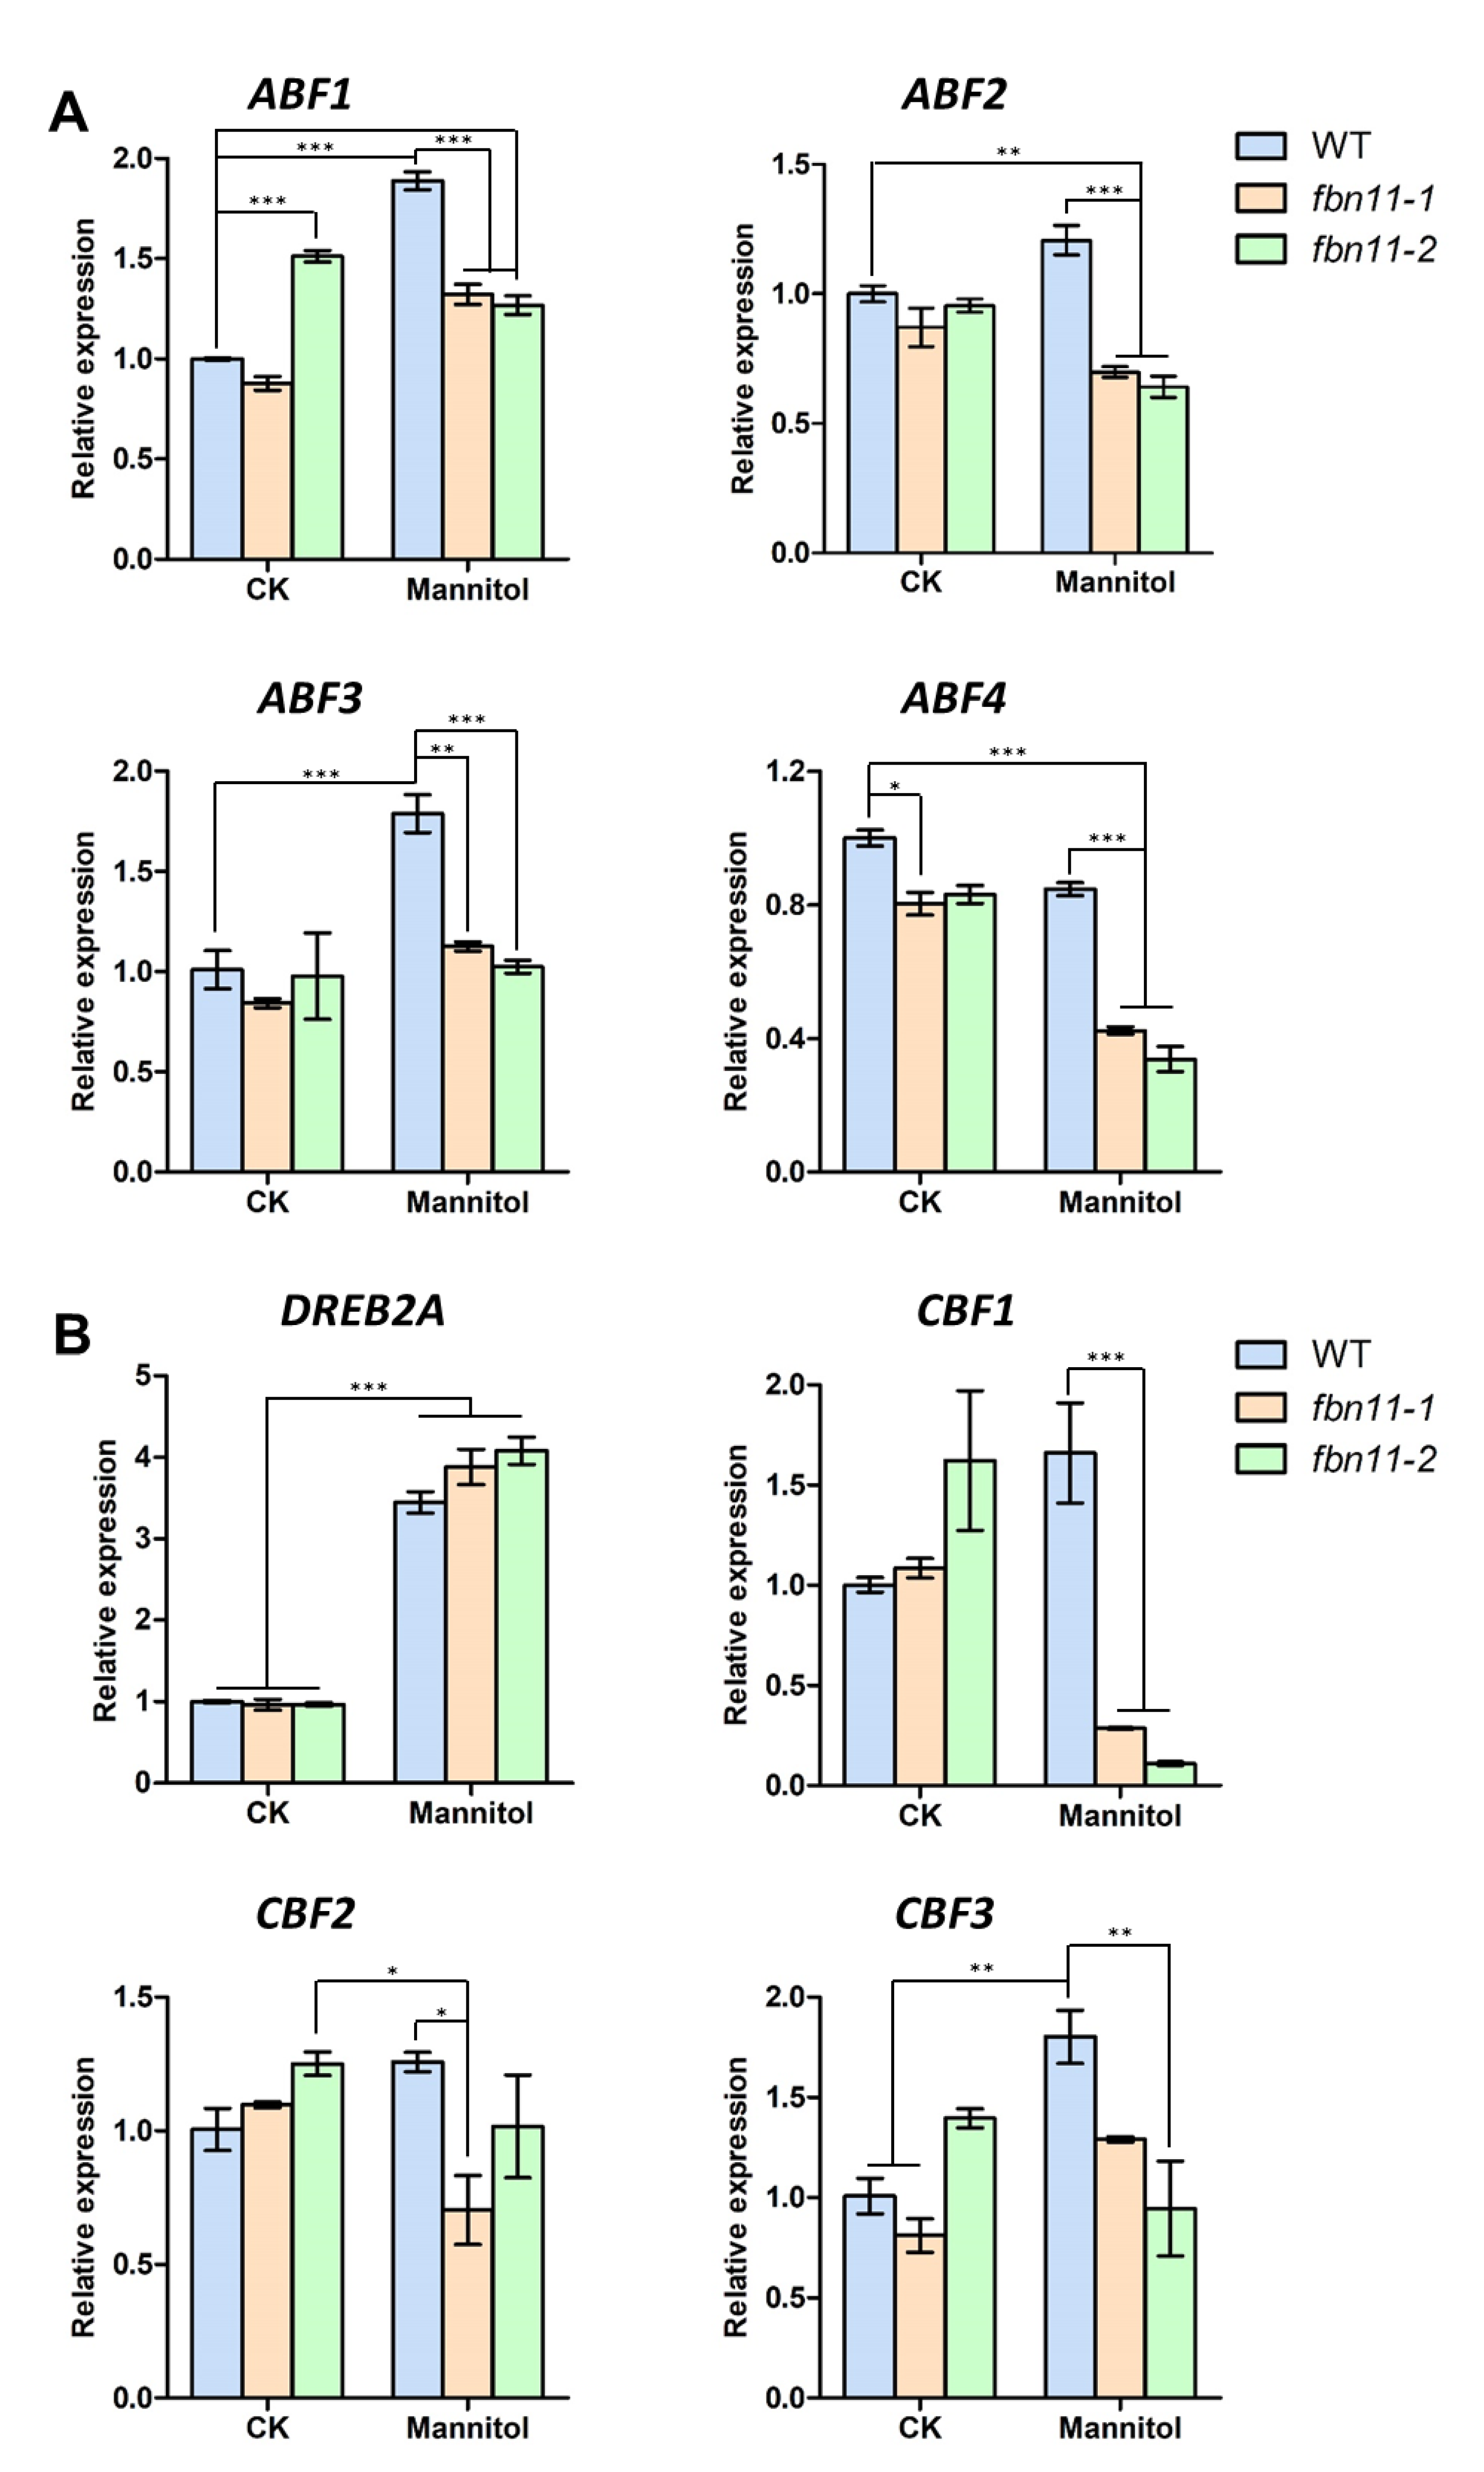
3.8. Expression of Abiotic Stress-Marker Transcription Factors in fbn11 during Seed Germination under Osmotic Stress
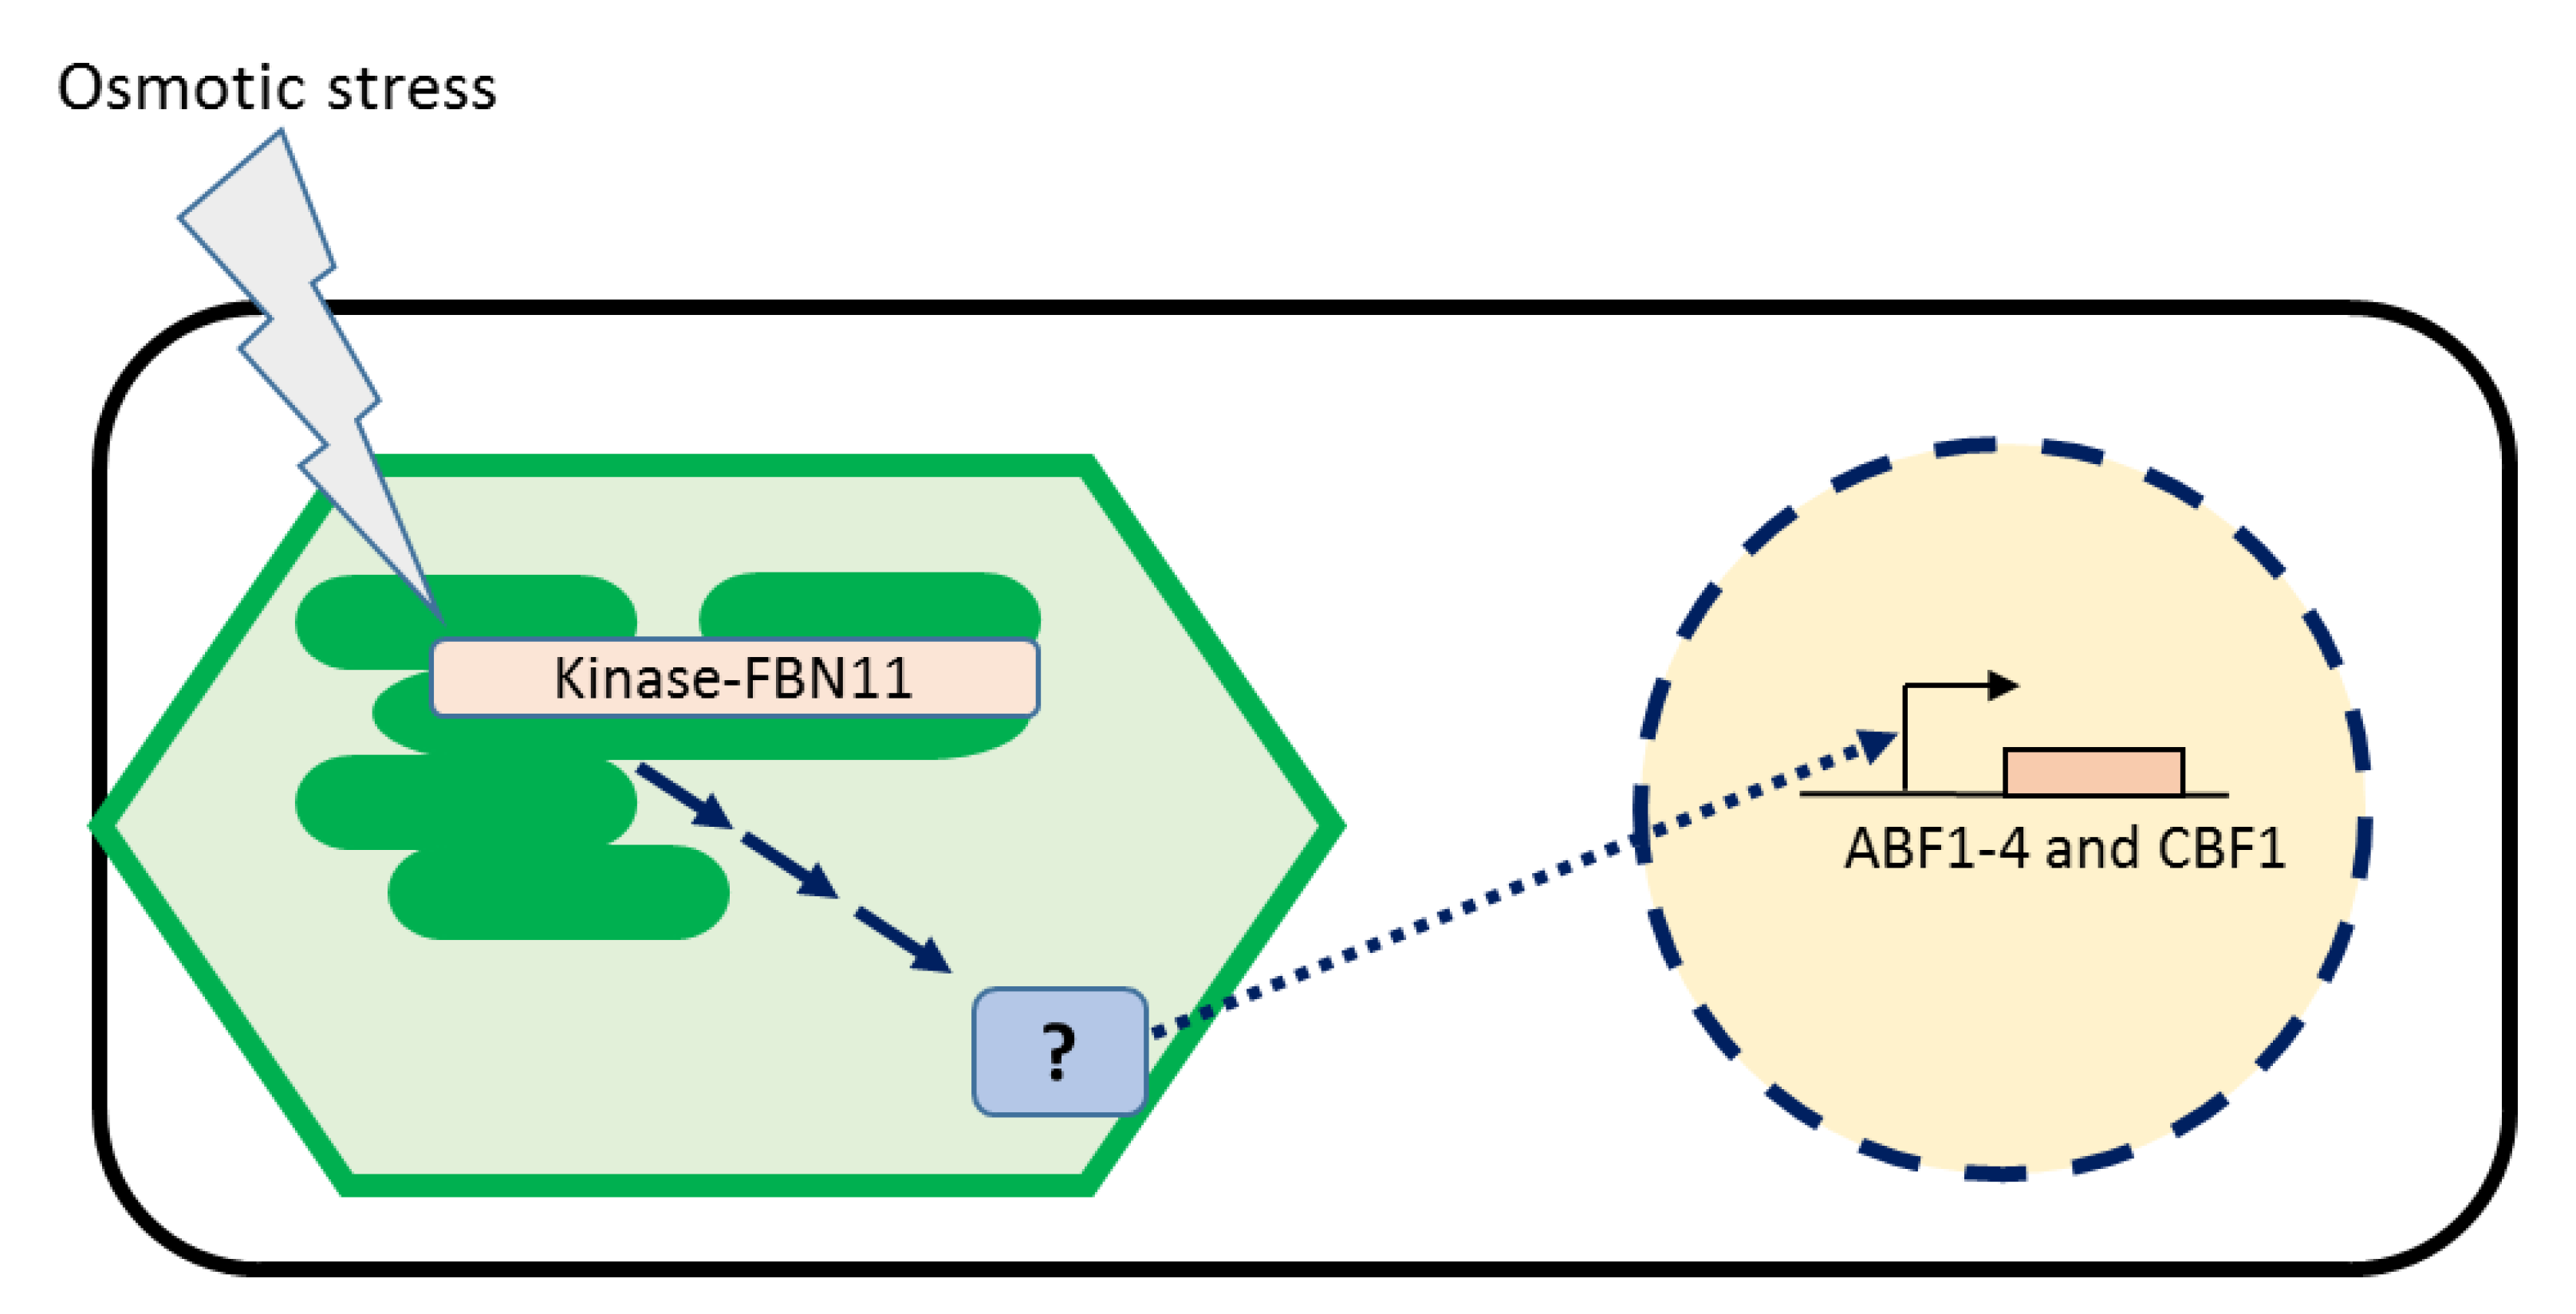
When wild-type seedlings were treated with osmotic stress, or mannitol, FBN11 expression increased (Figure 5), and seed germination and cotyledon formation rates were decreased in fbn11 mutants compared with wild type (Figure 8E,F). Since this result suggests that FBN11 present in chloroplasts may regulate the expression of genes involved in the osmotic stress response, we assessed by RT-qPCR whether expression of transcription factors involved in ABA-dependent/independent pathways of abiotic stress response changes (Figure 9). The seeds used in these experiments were directly germinated for 116 h on a solid medium containing 300 mM mannitol, at which point, wild-type seeds were all germinated, and germinated and non-germinated seeds of fbn11 mutants were collected. Total RNA was extracted. In ABF1-4, a representative transcription factor family in the ABA-dependent pathway, when osmotic stress was applied to wild-type seed germination, ABF1 and ABF3 increased, but ABF2 and ABF4 did not change significantly. By contrast, fbn11 mutants showed a decrease in ABF1-4 expression during seed germination compared to wild type. Considering that no significant difference in ABF1-4 expression is seen between wild-type and fbn11 mutants under normal conditions, decreased expression in fbn11 knockouts suggests that FBN11 regulates ABF1-4 expression under osmotic stress (Figure 9A).
Changes in expression of DREB2A and CBF1-3, representative transcription factors in the ABA-independent pathway, were also investigated during germination of wild-type and fbn11 mutant seeds under osmotic stress. Expression of DREB2A was significantly increased in both wild-type and fbn11 mutants by treatment with mannitol, but no difference in expression was observed between wild-type and the fbn11 mutants. CBF2 and CBF3 showed a tendency to increase during osmotic stress in wild type slightly, but the expression in fbn11 mutants was similar to that of wild type under normal and osmotic stress conditions. By contrast, CBF1 (CRT/DRE-binding factor 1, also named DREB1B) expression significantly increased during osmotic stress in the wild type but decreased significantly in the fbn11 mutants. These results suggest that in response to stress, FBN11 present in chloroplasts may affect the expression of different stress response modulators (Figure 9B).

4. Discussion

FBN11 is a unique FBN paralog with a kinase in its N-terminal region, unlike FBNs found in higher plants (Figure 1). The primary structure of the FBN11 kinase domain revealed probable tertiary structural similarity (19.62%) with human mitogen-activated protein kinase 7 (MAPK7) (tertiary molecular model: 4ic7.1.A). MAPK is involved in biotic and abiotic stress responses in plants [35]. The characteristic of FBN11 having FBN domains that have similarities with MAP Kinase suggests that FBN11 may be involved in recognition and response to stress in chloroplasts. Whether FBN11 kinase plays a role in chloroplasts and which chloroplast protein(s) is/are its cognate substrate(s) should be the subjects of future studies.
FBN11 exists only in higher plants. In this study, we identified independent genes homologous to the kinase or FBN domains in the green algae Chlamydomonas genome database. Our results suggest the possibility that FBN11 was generated by domain shuffling, resulting in a kinases/FBN fusion during the evolution of higher land plants from green algae (Figure 4). The conserved presence of FBN11 in higher plants suggests the existence of a defense mechanism involving signal transduction in chloroplasts in response to biotic and abiotic stresses.
FBN proteins have an FBN domain, which is a hydrophobic region with the potential to bind fat-soluble molecules. FBN1 in red pepper binds to carotenoids to form microfibril structures [2]. The FBN domain of FBN5 can help maintain the activity of solanesyl diphosphate synthase by binding solanesyl diphosphate, a hydrophobic tail structure of plastoquinone involved in photosynthetic electron transport [36]. A possible function of the FBN domain of FBN11 may be an induction of kinase domain activity by binding to an as yet unidentified hydrophobic substrate.
All FBN family genes discovered to date are present in chloroplasts or plastids. Most of them are present in plastoglobules (plastid localized lipoprotein particles) [15]. Some, such as FBN5, are present in the chloroplast stroma [36]. FBN11 has been confirmed to be present in chloroplasts (Figure 2). It has been predicted, based on its isoelectric point and Ref. [6] and hydrophobicity, to exist in the thylakoid. FBN11 has no transmembrane domain and is weakly hydrophobic. Although we have confirmed that FBN11 is present in the chloroplast, its precise localization within the chloroplast remains elusive.
FBN11 gene expression increases under osmotic stress [23] (Figure 5 and Figure S3), and seed germination and cotyledon formation were adversely affected under osmotic stress conditions in fbn11 mutants (Figure 8 and Figure S5). These results suggest that FBN11 mediates a regulatory response to osmotic stress. Transcription factors involved in ABA-dependent and ABA-independent pathways have been reported to regulate gene expression in response to osmotic stress [23,28]. The ABA-dependent signaling pathway activates and regulates the ABF/ABRE transcription factor through multisite phosphorylation of conserved domains by SNF1-related kinase2 (SnRK2s) upon osmotic stress [37,38,39]. The ABA-independent pathway involves induction of DREB2A protein by drought and high salt concentrations. DREB2A specifically binds to the DNA sequence 5’-[AG]CCGAC-3’ and interacts with ABF/AREB/factors. Transcription factors of the ABA-dependent pathway regulate stress response genes or interact with DRE/CRT cis-elements to express downstream genes involved in drought and salt stress responses [40].
In this experiment, four types of ABA-dependent transcriptional regulators (ABF1-4) showed no significant change in gene expression under osmotic stress during seed germination in wild-type but displayed significantly decreased transcripts in fbn11 mutants relative to wild-type (Figure 9A). Among the four transcriptional regulators of the ABA-independent pathway, only DREB2A expression increased significantly in wild-type and fbn11 mutant germinating seeds under osmotic stress. Under osmotic stress during seed germination, CBF1 expression decreased in the fbn11 mutants (Figure 9B). These results suggest that FBN11 present in chloroplasts responds to osmotic stress by regulating ABF1-4 expression in ABA-dependent and CBF1 in ABA-independent pathways in the nucleus by retrograde signaling.
Plants detect biotic or abiotic environmental stresses via organelles within their cells and respond with changes in gene expression and/or metabolic or physiological changes. The signal-sensing organelles (endoplasmic reticulum (ER) and chloroplasts) experience protein misfolding or accumulation of unfolded protein during environmental stresses. Such stresses are detected by a specific sensor protein in the ER membrane [41]. Chloroplasts are organelles in which many metabolic reactions, including photosynthesis, occur, and metabolic balance is easily disturbed by environmental changes. These disturbances are transmitted to the nucleus through retrograde signals, allowing chloroplasts to regulate cellular activity [42,43,44].
This study raises many unanswered questions but supports the following hypothesis (diagrammed in Figure 10). When subjected to osmotic stress during seed germination, the chloroplast recognizes this osmotic stress, producing an unknown lipid molecule that acts as a secondary signal transducer by binding to the FBN domain of FBN11, thereby activating the kinase domain to transduce a retrograde signal. This retrograde signal responds to osmotic stress by regulating the expression of ABF1-4 and CBF1 transcription factors in the nucleus (Figure 10). The expression of FBN11 is predicted to be regulated by the OBP3, a Dof transcription factor, which responds to salicylic acid (SA). On the contrary, SA treatment upregulates FBN11 expression, and jasmonate treatment downregulates FBN11 [45]. ABF1 plays an essential role in the salt/osmotic stress-resistant germination phenotype by suppressing a negative regulator of light development, DEETIOLATED 1 (DET1) [46]. ABF1 is also activated by SNF1-related kinase 2s (SnRK2s) in response to osmotic stress during vegetative growth [27]. CBF1 directly controls the expression of two Arabidopsis glycosyltransferase genes, UGT79B2 and UGT79B3, which confer salt stress tolerance via modulating anthocyanin accumulation [47]. These results suggest that FBN11 may be involved in disease resistance as well as osmotic stress.

Supplementary Materials

Supplementary Materials can be found at https://www.mdpi.com/article/10.3390/biology10050368/s1. Figure S1: Tertiary structure analyses of the FBN11 kinase domain using SWISS-MODEL. Figure S2: (A) Amino acid alignment between the kinase domain of Arabidopsis FBN11 and CreSTT7 of Chlamydomonas. (B) Amino acid alignment between FBN11 and the CrePLAP2 FBN domain of Chlamydomonas. Figure S3: FBN11 gene expression profiles in various tissues under various abiotic stresses. Figure S4: Expression profiles of FBN family genes in stage 10 seeds without siliques. Figure S5: Seed germination phenotypes of wild type and fbn11 homozygous mutants under stress. Figure S6: fbn11-1 truncated transcript and deduced protein sequences. Figure S7: RT-PCR expression analysis of AteIF4 during seed germination of wild type and fbn11 mutants non-treated (CK) and treated with 300 mM mannitol. Table S1: Primers used in this study. Table S2: Amino acid composition and secondary structure of FBN11. Table S3: FBN11 physical parameters. Table S4: FBN11 orthologs analysis of plant evolution. Table S5: FBN gene family comparison between Arabidopsis and Chlamydomonas reinhardtii.

Author Contributions

Y.-R.C. and I.K. performed the experiments; H.-U.K., Y.-R.C., M.K. and J.S. analyzed the data; Y.-R.C., M.K., J.S. and H.-U.K. wrote the manuscript. All authors have read and agreed to the published version of the manuscript.

Funding

This work was supported by grants from the Mid-Career Researcher Program of the National Research Foundation of Korea (NRF-2020R1A2C2008175), the New Breeding Technologies Development Program (Project No. PJ01532401), and the Next Generation BioGreen21 program (Project No. PJ015714), Rural Development Administration, Republic of Korea, and the Korea Institute of Planning and Evaluation for Technology in Food, Agriculture, Forestry, and Fisheries (IPET) (319107-4), Republic of Korea.

Institutional Review Board Statement

Not applicable.

Informed Consent Statement

Not applicable.

Data Availability Statement

Not applicable.

Conflicts of Interest

The authors declare no conflict of interest.

Abbreviations

FBNFIBRILLIN
PGPlastoglobule
ABAAbscisic acid
DREBDehydration responsive element binding protein
AREBAbscisic acid-responsive element binding protein
TAIRThe Arabidopsis Information Resource
NCBINational Center for Biotechnology Information
ABRCArabidopsis Biological Resource Center
sGFPsynthetic green fluorescence protein
CaMVCauliflower mosaic virus

References

  1. Austin, J.R., 2nd; Frost, E.; Vidi, P.A.; Kessler, F.; Staehelin, L.A. Plastoglobules are lipoprotein subcompartments of the chloroplast that are permanently coupled to thylakoid membranes and contain biosynthetic enzymes. Plant Cell 2006, 18, 1693–1703. [Google Scholar] [CrossRef] [PubMed] [Green Version]
  2. Deruere, J.; Romer, S.; d’Harlingue, A.; Backhaus, R.A.; Kuntz, M.; Camara, B. Fibril assembly and carotenoid overaccumulation in chromoplasts: A model for supramolecular lipoprotein structures. Plant Cell 1994, 6, 119–133. [Google Scholar]
  3. Pozueta-Romero, J.; Rafia, F.; Houlne, G.; Cheniclet, C.; Carde, J.P.; Schantz, M.L.; Schantz, R. A ubiquitous plant housekeeping gene, PAP, encodes a major protein component of bell pepper chromoplasts. Plant Physiol. 1997, 115, 1185–1194. [Google Scholar] [CrossRef] [Green Version]
  4. Lohscheider, J.N.; Rio Bartulos, C. Plastoglobules in algae: A comprehensive comparative study of the presence of major structural and functional components in complex plastids. Mar. Genom. 2016, 28, 127–136. [Google Scholar] [CrossRef]
  5. Langenkamper, G.; Manac’h, N.; Broin, M.; Cuine, S.; Becuwe, N.; Kuntz, M.; Rey, P. Accumulation of plastid lipid-associated proteins (fibrillin/CDSP34) upon oxidative stress, ageing and biotic stress in Solanaceae and in response to drought in other species. J. Exp. Bot. 2001, 52, 1545–1554. [Google Scholar] [CrossRef] [Green Version]
  6. Yang, Y.; Sulpice, R.; Himmelbach, A.; Meinhard, M.; Christmann, A.; Grill, E. Fibrillin expression is regulated by abscisic acid response regulators and is involved in abscisic acid-mediated photoprotection. Proc. Natl. Acad. Sci. USA 2006, 103, 6061–6066. [Google Scholar] [CrossRef] [Green Version]
  7. Ytterberg, A.J.; Peltier, J.B.; van Wijk, K.J. Protein profiling of plastoglobules in chloroplasts and chromoplasts. A surprising site for differential accumulation of metabolic enzymes. Plant Physiol. 2006, 140, 984–997. [Google Scholar] [CrossRef] [Green Version]
  8. Brehelin, C.; Kessler, F.; van Wijk, K.J. Plastoglobules: Versatile lipoprotein particles in plastids. Trends Plant Sci. 2007, 12, 260–266. [Google Scholar] [CrossRef] [PubMed] [Green Version]
  9. Singh, D.K.; Maximova, S.N.; Jensen, P.J.; Lehman, B.L.; Ngugi, H.K.; McNellis, T.W. FIBRILLIN4 is required for plastoglobule development and stress resistance in apple and Arabidopsis. Plant Physiol. 2010, 154, 1281–1293. [Google Scholar] [CrossRef] [PubMed] [Green Version]
  10. Youssef, A.; Laizet, Y.; Block, M.A.; Marechal, E.; Alcaraz, J.P.; Larson, T.R.; Pontier, D.; Gaffe, J.; Kuntz, M. Plant lipid-associated fibrillin proteins condition jasmonate production under photosynthetic stress. Plant J. 2010, 61, 436–445. [Google Scholar] [CrossRef]
  11. Singh, D.K.; McNellis, T.W. Fibrillin protein function: The tip of the iceberg? Trends Plant Sci. 2011, 16, 432–441. [Google Scholar] [CrossRef]
  12. Gamez-Arjona, F.M.; de la Concepcion, J.C.; Raynaud, S.; Merida, A. Arabidopsis thaliana plastoglobule-associated fibrillin 1a interacts with fibrillin 1b in vivo. FEBS Lett. 2014, 588, 2800–2804. [Google Scholar] [CrossRef] [Green Version]
  13. Li, J.; Yang, J.; Zhu, B.; Xie, G. Overexpressing OsFBN1 enhances plastoglobule formation, reduces grain-filling percent and jasmonate levels under heat stress in rice. Plant Sci. 2019, 285, 230–238. [Google Scholar] [CrossRef] [PubMed]
  14. Jiang, Y.; Hu, H.; Ma, Y.; Zhou, J. Genome-wide identification and characterization of the fibrillin gene family in Triticum aestivum. PeerJ 2020, 8, e9225. [Google Scholar] [CrossRef] [PubMed]
  15. Lundquist, P.K.; Poliakov, A.; Bhuiyan, N.H.; Zybailov, B.; Sun, Q.; van Wijk, K.J. The functional network of the Arabidopsis plastoglobule proteome based on quantitative proteomics and genome-wide coexpression analysis. Plant Physiol. 2012, 158, 1172–1192. [Google Scholar] [CrossRef] [Green Version]
  16. Laizet, Y.; Pontier, D.; Mache, R.; Kuntz, M. Subfamily organization and phylogenetic origin of genes encoding plastid lipid-associated proteins of the fibrillin type. J. Genome Sci. Technol. 2004, 3, 19–28. [Google Scholar] [CrossRef]
  17. Gillet, B.; Beyly, A.; Peltier, G.; Rey, P. Molecular characterization of CDSP 34, a chloroplastic protein induced by water deficit in Solanum tuberosum L. plants, and regulation of CDSP 34 expression by ABA and high illumination. Plant J. 1998, 16, 257–262. [Google Scholar] [CrossRef]
  18. Otsubo, M.; Ikoma, C.; Ueda, M.; Ishii, Y.; Tamura, N. Functional Role of Fibrillin5 in Acclimation to Photooxidative Stress. Plant Cell Physiol. 2018, 59, 1670–1682. [Google Scholar] [CrossRef] [PubMed]
  19. Li, J.; Li, X.; Khatab, A.A.; Xie, G. Phylogeny, structural diversity and genome-wide expression analysis of fibrillin family genes in rice. Phytochemistry 2020, 175, 112377. [Google Scholar] [CrossRef]
  20. Kumar, M.; Kesawat, M.S.; Ali, A.; Lee, S.C.; Gill, S.S.; Kim, H.U. Integration of Abscisic Acid Signaling with Other Signaling Pathways in Plant Stress Responses and Development. Plants 2019, 8, 592. [Google Scholar] [CrossRef] [PubMed] [Green Version]
  21. Chen, K.; Li, G.J.; Bressan, R.A.; Song, C.P.; Zhu, J.K.; Zhao, Y. Abscisic acid dynamics, signaling, and functions in plants. J Integr. Plant Biol. 2020, 62, 25–54. [Google Scholar] [CrossRef] [PubMed] [Green Version]
  22. Tuteja, N. Abscisic Acid and abiotic stress signaling. Plant Signal Behav. 2007, 2, 135–138. [Google Scholar] [CrossRef] [PubMed] [Green Version]
  23. Yoshida, T.; Mogami, J.; Yamaguchi-Shinozaki, K. ABA-dependent and ABA-independent signaling in response to osmotic stress in plants. Curr. Opin. Plant Biol. 2014, 21, 133–139. [Google Scholar] [CrossRef] [PubMed]
  24. Kumar, K.; Kumar, M.; Kim, S.R.; Ryu, H.; Cho, Y.G. Insights into genomics of salt stress response in rice. Rice (N. Y.) 2013, 6, 27. [Google Scholar] [CrossRef] [PubMed] [Green Version]
  25. Park, H.J.; Kim, W.Y.; Yun, D.J. A New Insight of Salt Stress Signaling in Plant. Mol. Cells 2016, 39, 447–459. [Google Scholar] [CrossRef] [PubMed]
  26. Soma, F.; Takahashi, F.; Suzuki, T.; Shinozaki, K.; Yamaguchi-Shinozaki, K. Plant Raf-like kinases regulate the mRNA population upstream of ABA-unresponsive SnRK2 kinases under drought stress. Nat. Commun. 2020, 11, 1373. [Google Scholar] [CrossRef] [Green Version]
  27. Yoshida, T.; Fujita, Y.; Maruyama, K.; Mogami, J.; Todaka, D.; Shinozaki, K.; Yamaguchi-Shinozaki, K. Four Arabidopsis AREB/ABF transcription factors function predominantly in gene expression downstream of SnRK2 kinases in abscisic acid signalling in response to osmotic stress. Plant Cell Environ. 2015, 38, 35–49. [Google Scholar] [CrossRef] [Green Version]
  28. Sakuma, Y.; Maruyama, K.; Osakabe, Y.; Qin, F.; Seki, M.; Shinozaki, K.; Yamaguchi-Shinozaki, K. Functional analysis of an Arabidopsis transcription factor, DREB2A, involved in drought-responsive gene expression. Plant Cell 2006, 18, 1292–1309. [Google Scholar] [CrossRef] [Green Version]
  29. Kim, E.H.; Lee, D.W.; Lee, K.R.; Jung, S.J.; Jeon, J.S.; Kim, H.U. Conserved Function of Fibrillin5 in the Plastoquinone-9 Biosynthetic Pathway in Arabidopsis and Rice. Front. Plant Sci. 2017, 8, 1197. [Google Scholar] [CrossRef] [Green Version]
  30. Shen, J.; Fu, J.; Ma, J.; Wang, X.; Gao, C.; Zhuang, C.; Wan, J.; Jiang, L. Isolation, culture, and transient transformation of plant protoplasts. Curr. Protoc. Cell Biol. 2014, 63, 1–17. [Google Scholar] [CrossRef]
  31. Li, X.; Liang, Y.; Gao, B.; Mijiti, M.; Bozorov, T.A.; Yang, H.; Zhang, D.; Wood, A.J. ScDREB10, an A-5c type of DREB Gene of the Desert Moss Syntrichia caninervis, Confers Osmotic and Salt Tolerances to Arabidopsis. Genes 2019, 10, 146. [Google Scholar] [CrossRef] [Green Version]
  32. Lee, K.; Lee, H.G.; Yoon, S.; Kim, H.U.; Seo, P.J. The Arabidopsis MYB96 Transcription Factor Is a Positive Regulator of ABSCISIC ACID-INSENSITIVE4 in the Control of Seed Germination. Plant Physiol. 2015, 168, 677–689. [Google Scholar] [CrossRef] [Green Version]
  33. Kessler, F.; Schnell, D.; Blobel, G. Identification of proteins associated with plastoglobules isolated from pea (Pisum sativum L.) chloroplasts. Planta 1999, 208, 107–113. [Google Scholar] [CrossRef] [PubMed]
  34. Baek, D.; Chun, H.J.; Kang, S.; Shin, G.; Park, S.J.; Hong, H.; Kim, C.; Kim, D.H.; Lee, S.Y.; Kim, M.C.; et al. A Role for Arabidopsis miR399f in Salt, Drought, and ABA Signaling. Mol. Cells 2016, 39, 111–118. [Google Scholar] [PubMed] [Green Version]
  35. Lin, L.; Wu, J.; Jiang, M.; Wang, Y. Plant Mitogen-Activated Protein Kinase Cascades in Environmental Stresses. Int. J. Mol. Sci. 2021, 22, 1543. [Google Scholar] [CrossRef] [PubMed]
  36. Kim, E.H.; Lee, Y.; Kim, H.U. Fibrillin 5 Is Essential for Plastoquinone-9 Biosynthesis by Binding to Solanesyl Diphosphate Synthases in Arabidopsis. Plant. Cell 2015, 27, 2956–2971. [Google Scholar] [CrossRef]
  37. Uno, Y.; Furihata, T.; Abe, H.; Yoshida, R.; Shinozaki, K.; Yamaguchi-Shinozaki, K. Arabidopsis basic leucine zipper transcription factors involved in an abscisic acid-dependent signal transduction pathway under drought and high-salinity conditions. Proc. Natl. Acad. Sci. USA 2000, 97, 11632–11637. [Google Scholar] [CrossRef] [Green Version]
  38. Furihata, T.; Maruyama, K.; Fujita, Y.; Umezawa, T.; Yoshida, R.; Shinozaki, K.; Yamaguchi-Shinozaki, K. Abscisic acid-dependent multisite phosphorylation regulates the activity of a transcription activator AREB1. Proc. Natl. Acad. Sci. USA 2006, 103, 1988–1993. [Google Scholar] [CrossRef] [Green Version]
  39. Fujii, H.; Verslues, P.E.; Zhu, J.K. Identification of two protein kinases required for abscisic acid regulation of seed germination, root growth, and gene expression in Arabidopsis. Plant. Cell 2007, 19, 485–494. [Google Scholar] [CrossRef] [Green Version]
  40. Sakuma, Y.; Maruyama, K.; Qin, F.; Osakabe, Y.; Shinozaki, K.; Yamaguchi-Shinozaki, K. Dual function of an Arabidopsis transcription factor DREB2A in water-stress-responsive and heat-stress-responsive gene expression. Proc. Natl. Acad. Sci. USA 2006, 103, 18822–28827. [Google Scholar] [CrossRef] [Green Version]
  41. Hsu, C.L.; Prasad, R.; Blackman, C.; Ng, D.T. Endoplasmic reticulum stress regulation of the Kar2p/BiP chaperone alleviates proteotoxicity via dual degradation pathways. Mol. Biol. Cell 2012, 23, 630–641. [Google Scholar] [CrossRef]
  42. Wagner, D.; Przybyla, D.; Op den Camp, R.; Kim, C.; Landgraf, F.; Lee, K.P.; Wursch, M.; Laloi, C.; Nater, M.; Hideg, E.; et al. The genetic basis of singlet oxygen-induced stress responses of Arabidopsis thaliana. Science 2004, 306, 1183–1185. [Google Scholar] [CrossRef] [PubMed]
  43. Kim, C.; Meskauskiene, R.; Zhang, S.; Lee, K.P.; Lakshmanan Ashok, M.; Blajecka, K.; Herrfurth, C.; Feussner, I.; Apel, K. Chloroplasts of Arabidopsis are the source and a primary target of a plant-specific programmed cell death signaling pathway. Plant Cell 2012, 24, 3026–3039. [Google Scholar] [CrossRef] [PubMed] [Green Version]
  44. Zhu, J.K. Abiotic Stress Signaling and Responses in Plants. Cell 2016, 167, 313–324. [Google Scholar] [CrossRef] [PubMed] [Green Version]
  45. Kang, H.G.; Foley, R.C.; Onate-Sanchez, L.; Lin, C.; Singh, K.B. Target genes for OBP3, a Dof transcription factor, include novel basic helix-loop-helix domain proteins inducible by salicylic acid. Plant J. 2003, 35, 362–372. [Google Scholar] [CrossRef] [PubMed]
  46. Fernando, V.C.D.; Al Khateeb, W.; Belmonte, M.F.; Schroeder, D.F. Role of Arabidopsis ABF1/3/4 during det1 germination in salt and osmotic stress conditions. Plant Mol. Biol. 2018, 97, 149–163. [Google Scholar] [CrossRef] [PubMed]
  47. Li, P.; Li, Y.J.; Zhang, F.J.; Zhang, G.Z.; Jiang, X.Y.; Yu, H.M.; Hou, B.K. The Arabidopsis UDP-glycosyltransferases UGT79B2 and UGT79B3, contribute to cold, salt and drought stress tolerance via modulating anthocyanin accumulation. Plant. J. 2017, 89, 85–103. [Google Scholar] [CrossRef] [PubMed] [Green Version]
Figure 1. Arabidopsis FBN11 protein structural characteristics. (A) Schematic of FBN11 domain structure with positions labeled in amino acid numbering. 1–52; transit peptide, 88–399; Protein kinase domain (serine/threonine-protein kinase), 434–587; Fibrillin conserved domain. (B) The amino acid sequence of FBN11. Blue brackets indicate TP, brown brackets indicate the kinase domain, and green brackets indicate the fibrillin domain. The red star indicates a nucleotide-binding site predicted to bind nucleotide phosphates. A binding site describes an interaction between a single amino acid and another chemical entity. The blue star indicates a catalytic residue in the kinase active site (ACT).
Biology 10 00368 g001
Figure 2. Localization of FBN11-GFP fusion protein to Arabidopsis thaliana (A) and Nicotiana benthamiana (B) protoplasts. GFP = green fluorescence protein imaging; Chlorophyll = chloroplast red auto fluorescence; Merged = merged GFP and chloroplast fluorescent images. Scale bars = 20 μm (A. thaliana ) and 5 μm (N. benthamiana).
Biology 10 00368 g002
Figure 3. The phylogenetic tree between FBN11 orthologs from dicot (14 species), monocots (5 species), lycophytes (1 species), bryophytes (2 species), charophytes (1 species), and chlorophyte (1 species). The tree was analyzed using the Maximum Likelihood (ML) method. Bootstrap values are given at the nodes as a percentage of 1000 replicates. The scale bar indicates the number of amino acid substitutions per site. At: Arabidopsis thaliana, Br: Brassica rapa, Cp: Carica papaya, Cs: Cucumis sativus, Gm: Glycine max, Lj: Lotus japonicas, Me: Manihot esculenta, Mg: Mimulus guttatus, Mt: Medicago truncatula, Rc: Ricinus communis, Pp: Prunus persica, Pt: Populus trichocarpa, St: Solanum tuberosum, Vv: Vitis vinifera, Bd: Brachypodium distachyon, Os: Oryza sativa, Sb: Sorghum bicolor, Si: Setaria italic, Zm: Zea mays, Sm: Selaginella moellendorffii, Ppa: Physcomitrella patens, Mp: Marchantia polymorpha, Cb: Chara braunii, Cre: Chlamydomonas reinhardtii. Information for these genes is in Table S4.
Biology 10 00368 g003
Figure 4. Comparison of domain structure and homology between Arabidopsis FBN11 and C.reinhardtii PLAP2 and STT7. (A) FBN11 has a transit peptide in aa 1–51, a protein kinase domain at aa 88–199, and an FBN domain at aa 434–587. CrePLAT2 has a transit peptide in aa 1–44 and a second transit peptide in aa 53–215. CreSTT7 has a transit peptide in aa 1–41 and a protein kinase domain at aa 139–482. (B) Amino acid sequence identity between the kinase and FBN domains of Arabidopsis FBN11 and the corresponding kinase domain of CreSTT7 and FBN domain of CrePLAP2, respectively.
Biology 10 00368 g004
Figure 5. FBN11 expression in Arabidopsis seedlings in response to ABA, NaCl, or mannitol. (A) Ten-days-oldArabidopsis seedlings were treated with 100 μM ABA, 150 mM NaCl, or 300 mM mannitol for 0, 6, 12, and 24 h in solid MS medium. (B) Eighteen-day-old Arabidopsis seedlings were treated with 1 μM ABA, 150 mM NaCl, or 300 mM mannitol for 0, 3, 6, 12, and 24 h in the liquid medium. FBN11 expression in (A,B) is normalized with housekeeping gene AteIF4a expression and compared with the non-treated control seedlings. Statistical analysis is by one-way ANOVA with Tukey’s multiple comparisons test (* p < 0.05, ** p < 0.01, *** p < 0.001).
Biology 10 00368 g005
Figure 6. Identification of fbn11-1 and fbn11-2 homozygous mutants containing T-DNA inserts. (A) Schematic diagrams of mutant FBN11 genes with T-DNA insertions. Black boxes, grey lines, and blue boxes represent exons, introns, and untranslated regions, respectively. (B,C) Genotyping of wild-type, fbn11-1, and fbn11-2 homozygous mutant plants by genomic DNA PCR. PCR primer positions are shown by arrows (Blue for LP and RP, Red for RT-PCR). Expected PCR product sizes for T-DNA detection in genes amplified with the primer pairs 11-1LP and 11-1RP (1130 bp), 11-2LP, and 11-2RP (1240 bp) are indicated in B and C. (D) RNA transcript levels of FBN11 genes in wild type (WT) and homozygous fbn11-1, and fbn11-2 mutant seedlings. RT-PCR of total RNAs isolated from 3 week old Arabidopsis plant. ACTIN was used as a loading control.
Biology 10 00368 g006
Figure 7. Measurement of water loss due to drought stress conditions and effect on root growth. (A) Four-week-old plant shoots were detached from the root and weighed immediately. Shoots were then placed in covered plates at room temperature and weighed at various time intervals. Loss of fresh weight was calculated based on the initial shoot weight. At least three biological replicates were measured for each sample. (B) Rates of water loss by leaves were also measured. Short-term assays were performed with detached leaves of matching developmental stage and size from 21-day-old plants. Five leaves per individual were excised, weighed fresh, subjected to the drying atmosphere of a flow laminar hood, and weighed at fixed time points while drying. Kinetic analyses of water loss were performed and are represented as percentages of initial fresh weight at each time point. (A,B) There were no statistically significant differences (p > 0.05) in water loss rates between WT and fbn11 mutants at any time point (one-way ANOVA with Tukey’s multiple comparisons test). (C) Root length phenotype and (D) measurement of root growth under stress. CK, control media; ABA, supplemented with 20 μM ABA; NaCl, supplemented with 200 mM NaCl; mannitol, supplemented with 300 mM mannitol. There were no statistically significant differences (p > 0.05) in root length between the stress treatment groups at any time point (one-way ANOVA with Tukey’ s multiple comparisons test).
Biology 10 00368 g007
Figure 8. Seed germination and cotyledon formation of wild type and fbn11 homozygous mutants exposed to ABA, NaCl, and mannitol. (A) Seed germination under normal conditions. or (B) supplemented with 1 μM ABA, (C) 200 mM NaCl, or (D), 300 mM mannitol. (E,F) represent percentages of seed germination and green cotyledon development in ABA, NaCl, or mannitol stressed conditions. Approximately 50 seeds of each genotype were sown on each plate and scored for germination and early growth 7 d later. Each value corresponds to mean ± standard deviation (SD). Statistical analysis is by one-way ANOVA with Tukey’s multiple comparisons tests (* p < 0.05, ** p < 0.01, *** p < 0.001). Normal; control media, ABA; supplemented with 1 μM ABA, NaCl; supplemented with 200 mM NaCl, mannitol; supplemented with 300 mM mannitol.
Biology 10 00368 g008
Figure 9. Expression of key transcription factors mediating ABA-dependent/independent pathway genes during seed germination in wild type and fbn11 homozygous mutants. (A) Transcription factors in the ABA-dependent pathway (B) Transcription factors in the ABA-independent pathway. Total RNA was extracted from seeds undergoing germination after 116 h treatment with 0 or 300 mM mannitol. To determine the internal control for qRT-PCR analysis, the unaffected expression pattern of the AtelF4 gene was checked in wild-type and fbn11 mutant seed germination under mannitol treatment conditions (Figure S7). Statistical analysis is by one-way ANOVA with Tukey’s multiple comparisons tests (* p < 0.05, ** p < 0.01, *** p < 0.001).
Biology 10 00368 g009
Figure 10. Proposed model for FBN11 function within the osmotic stress response.
Biology 10 00368 g010
Publisher’s Note: MDPI stays neutral with regard to jurisdictional claims in published maps and institutional affiliations.

