Simple Summary
Glaucoma is a leading cause of blindness worldwide, and increased age and intraocular pressure (IOP) are the major risk factors. Glaucoma is characterized by the death of nerve cells and the loss of optic nerve fibers. Recently, evidence has accumulated indicating that proteins in the environment of nerve cells, called the extracellular matrix (ECM), play an important role in glaucomatous neurodegeneration. Depending on its constitution, the ECM can influence either the survival or the death of nerve cells. Thus, the aim of our study was to comparatively explore alterations of various ECM molecules in the retina and optic nerve of aged control and glaucomatous mice with chronic IOP elevation. Interestingly, we observed elevated levels of blood vessel and glial cell-associated ECM components in the glaucomatous retina and optic nerve, which could be responsible for various pathological processes. A better understanding of the underlying signaling mechanisms may help to develop new diagnostic and therapeutic strategies for glaucoma patients.
Abstract
Glaucoma is a neurodegenerative disease that is characterized by the loss of retinal ganglion cells (RGC) and optic nerve fibers. Increased age and intraocular pressure (IOP) elevation are the main risk factors for developing glaucoma. Mice that are heterozygous (HET) for the mega-karyocyte protein tyrosine phosphatase 2 (PTP-Meg2) show chronic and progressive IOP elevation, severe RGCs loss, and optic nerve damage, and represent a valuable model for IOP-dependent primary open-angle glaucoma (POAG). Previously, evidence accumulated suggesting that glaucomatous neurodegeneration is associated with the extensive remodeling of extracellular matrix (ECM) molecules. Unfortunately, little is known about the exact ECM changes in the glaucomatous retina and optic nerve. Hence, the goal of the present study was to comparatively explore ECM alterations in glaucomatous PTP-Meg2 HET and control wild type (WT) mice. Due to their potential relevance in glaucomatous neurodegeneration, we specifically analyzed the expression pattern of the ECM glycoproteins fibronectin, laminin, tenascin-C, and tenascin-R as well as the proteoglycans aggrecan, brevican, and members of the receptor protein tyrosine phosphatase beta/zeta (RPTPβ/ζ) family. The analyses were carried out in the retina and optic nerve of glaucomatous PTP-Meg2 HET and WT mice using quantitative real-time PCR (RT-qPCR), immunohistochemistry, and Western blot. Interestingly, we observed increased fibronectin and laminin levels in the glaucomatous HET retina and optic nerve compared to the WT group. RT-qPCR analyses of the laminins α4, β2 and γ3 showed an altered isoform-specific regulation in the HET retina and optic nerve. In addition, an upregulation of tenascin-C and its interaction partner RPTPβ/ζ/phosphacan was found in glaucomatous tissue. However, comparable protein and mRNA levels for tenascin-R as well as aggrecan and brevican were observed in both groups. Overall, our study showed a remodeling of various ECM components in the glaucomatous retina and optic nerve of PTP-Meg2 HET mice. This dysregulation could be responsible for pathological processes such as neovascularization, inflammation, and reactive gliosis in glaucomatous neurodegeneration.
1. Introduction
Globally, glaucoma is the second leading cause of severe visual impairment and irreversible blindness []. Its prevalence is steadily increasing, and it is expected that the number of people affected will rise from around 76 million in 2020 to around 112 million in 2040 []. Glaucoma comprises a group of chronic, progressive opticus neuropathies characterized by changes in the optic nerve head, degeneration of retinal ganglion cells (RGCs) and optic nerve fibers, and visual field loss []. Although glaucoma is a complex and multifactorial disease, the most important risk factors are an increased age and a high intraocular pressure (IOP).
Mice that are heterozygous (HET) for the megakaryocyte protein tyrosine phosphatase 2 (PTP-Meg2) represent an excellent model to investigate the underlying pathomechanism of IOP-induced primary open-angle glaucoma (POAG) []. PTP-Meg2 HET mice show a progressive IOP increase upon 10 weeks of age, which reaches its peak at 28 weeks of age. The glaucomatous phenotype of HET mice is characterized by the degeneration of RGCs and optic nerve fibers. In addition, neurodegenerative processes in this glaucoma mouse model are accompanied with deficits of retinal function and reactive micro- and macrogliosis.
In recent years, evidence has accumulated suggesting that glaucomatous damage is associated with an extensive remodeling of various extracellular matrix (ECM) molecules. Little is known, however, about the exact ECM changes in the glaucomatous retina and optic nerve. The ECM is a complex network of different macromolecules in the intercellular space that provide structural and mechanical support and can be divided into glycoproteins and proteoglycans. Components of the ECM are involved in various cellular events by binding to cell surface receptors, thereby regulating proliferation, migration, differentiation, and survival [,,,,]. Furthermore, they are the main components of glial scars and provide an inhibitory environment for the regeneration and migration of neurons [].
A characteristic of glaucoma is a morphological change in the optic nerve head [,]. In POAG, the increased IOP leads to a deformation of the optic nerve head, which is rich in ECM molecules. Previous studies suggest that changes in the composition of ECM components, including collagen, elastin, and tenascin-C, promote axonal damage [,,,]. In addition, a remodeling of various ECM molecules is associated with neurodegeneration of the retina and optic nerve after ischemia [].
In the present study, we analyzed ECM remodeling in the retina and optic nerve of the transgenic IOP-dependent PTP-Meg2 glaucoma mouse model. We have specifically characterized the expression pattern of the glycoproteins fibronectin, laminin, tenascin-C, and tenascin-R as well as the chondroitin sulfate proteoglycans (CSPGs) aggrecan, brevican, and receptor protein tyrosine phosphatase beta/zeta (RPTPβ/ζ)/phosphacan.
Fibronectin is a structural basement membrane component of retinal vessels and the retinal pigment epithelium []. An increased fibronectin staining in the retinal vasculature and inner limiting membrane (ILM) was described in a diabetic retinopathy animal model []. In glaucoma, the accumulation of fibronectin leads to a dysfunction of the trabecular meshwork and IOP elevation [,]. It was recently reported that the extra domain A of fibronectin and the Toll-like receptor 4 (TLR4) contribute to transforming growth factor beta 2 induced ocular hypertension [].
Members of the laminin family are major components of the retinal vascular basement membrane and play a functional role in differentiation and maintenance [,]. The laminin isoform α4 is expressed by endothelial cells of basement membranes and is involved in the growth of microvessels [,]. Immunoreactivity of the laminin α4 chain was observed in the ganglion cell layer (GCL) and in close association with Müller glia endfeet []. The β2 and γ3 laminin chains are crucial for the formation and stability of the ILM and influence the differentiation and migration of retinal astrocytes [,].
In the retina, the glycoprotein tenascin-C is expressed by horizontal and amacrine cells, and mainly associates with the plexiform layers. Astrocytes express huge amounts of tenascin-C in the optic nerve [,,]. Tenascin-C is upregulated under pathological conditions and involved in neuroinflammatory and glial reactions [,,]. Upregulation of tenascin-C has been described in various eye diseases, such as diabetic retinopathy and glaucoma []. Additionally, an accumulation of tenascin-C was observed in an IOP-dependent and IOP-independent autoimmune glaucoma animal model [,].
Tenascin-R can influence neurite outgrowth as well as neural and glial adhesion [,,]. In the retina, tenascin-R is released by horizontal cells and accumulates in the plexiform layers. Oligodendrocytes express huge amounts of tenascin-R in the optic nerve. Here, tenascin-R is closely associated with myelinated optic nerve fibers and nodes of Ranvier [,]. Both tenascin-C and -R can interact with various ECM molecules, for example with fibronectin, lecticans and members of the RPTPβ/ζ family [].
CSPGs are highly concentrated in the glial scar and limit the ability for axonal regeneration [,,]. The lecticans aggrecan and brevican are released by reactive astrocytes. Both lecticans are located in the plexiform layers of the retina, while a widespread extracellular staining pattern can be observed in the optic nerve [,].
Different splice variants of RPTPβ/ζ have been described to interact with several adhesion molecules and tenascins. The receptor isoforms RPTPβ/ζlong and RPTPβ/ζshort are expressed by glial cells and the expression of the secreted isoform RPTPβ/ζ/phosphacan is restricted to Müller glia in the adult retina [,]. An increased RPTPβ/ζ/phosphacan expression in the retina and optic nerve of an IOP-independent autoimmune glaucoma rat model was previously shown [,].
The aim of our study was to investigate the remodeling of the ECM glycoproteins fibronectin, laminin, tenascin-C, and tenascin-R as well as the CSPGs aggrecan, brevican, and RPTPβ/ζ/phosphacan in the retina and optic nerve after chronic IOP elevation. Therefore, we comparatively explore the expression pattern of these ECM components in aged wild type (WT) and PTP-Meg2 HET glaucoma mice by quantitative real-time PCR (RT-qPCR), immunohistochemistry, and Western blot analyses.
2. Materials and Methods
2.1. Animals
Male and female WT and glaucomatous PTP-Meg2 HET mouse littermates were used at the age of 28 weeks []. Mice were held in the animal facility of the Ruhr-University Bochum and kept in a 12 h–12 h light–dark cycle with free access to food and water.
2.2. RNA Isolation, cDNA Synthesis, and RT-qPCR
Retinae and optic nerves were dissected and stored at −80 °C until purification (n = 5/group). The isolation of the total RNA was performed according to the manufacturer‘s protocol using the Gene Elute Mammalian Total RNA Miniprep Kit (Sigma–Aldrich, St. Louis, MO, USA). The RNA concentration was measured photometrically using the BioSpectrometer® (Eppendorf, Hamburg, Germany). For cDNA synthesis, 1 μg RNA was reverse-transcribed with random hexamer primers using a cDNA synthesis kit (Thermo Fisher Scientific, Waltham, MA, USA).
The Light Cycler 96® System and SYBR Green I (Roche Applied Science, Mannheim, Germany) was used for RT-qPCR analyses as previously described []. Primer pairs were designed using the ProbeFinder Assay Design Software (Roche Diagnostics, Mannheim, Germany; Table 1). Primer efficiencies were calculated by a dilution series of 5, 25, and 125 ng cDNA. ECM expression in the retina and optic nerve was normalized by using primer pairs for the housekeeping genes β-actin (Actb) and cyclophilin D (Ppid), respectively.

Table 1.
List of primer pairs that were used for mRNA analyses in WT and HET retinae and optic nerves via RT-qPCR. To normalize the ECM expression data, the expression of the housekeeping genes β-actin (Actb) and cyclophilin D (Ppid) was assessed. The table shows the primer names, gene names, primer sequences, GenBank accession numbers, and product sizes. Abbreviations: bp—base pairs, for—forward, rev—reverse.
2.3. Immunohistochemistry and Confocal Laser Scanning Microscopy
For immunohistochemistry, eyes and optic nerves were fixed in 4% paraformaldehyde and dehydrated in 30% sucrose in 1× phosphate-buffered saline (1× PBS) and embedded in Tissue-Tek freezing medium (Thermo Fisher Scientific, Cheshire, UK). Retinal cross-sections and longitudinal optic nerve sections were cut with a thickness of 16 μm at a cryostat (CM3050 S, Leica, Nussloch, Germany). Sections were incubated in blocking solution (1% bovine serum albumin, Sigma-Aldrich, 3% goat serum, Dianova, Hamburg, Germany, and 0.5% TritonTM-X-100, Sigma-Aldrich in 1× PBS) for 1 h at room temperature (RT). The sections were then incubated with primary antibodies (Table 2) in blocking solution overnight. After washing with 1× PBS, the sections were incubated for 2 h with secondary antibody (Table 2) in blocking solution without TritonTM-X-100. All stainings included a secondary, antibody only, negative control. Cell nuclei were stained with TO-PRO-3 (1:400; Thermo Fisher Scientific). Two sections from each animal (n = 5/group) were analyzed at a 400× magnification with a confocal laser scanning microscope (LSM 510 META, Zeiss, Göttingen, Germany). Two peripheral and two central images per retinal section and three images from the proximal to the distal part of the myelinated optic nerve (200× magnification) were taken. Laser lines and emission filters were set using the Zeiss ZEN black software (Zeiss). A fixed cutting window was defined with Coral Paint Shop Pro X8 (Coral Corporation, CA, USA). Measurements of the stained signal area [%]/image were done using ImageJ (ImageJ 1.51 w, National Institutes of Health; Bethesda, MD, USA) as previously described [,]. For analyses, we determined the background subtraction, the lower threshold and the upper threshold (Table 3).
Table 2.
Primary and secondary antibodies for immunohistochemistry.
Table 3.
Adjustments for the ImageJ macro. Background subtraction data and the upper and lower threshold values for determining the stained signal area [%]/image.
2.4. Western Blotting
WT and HET retinal tissue (n = 4–6/group) was homogenized in 100 µL lysis buffer (60 mM n-octyl-β-D-glucopyranoside, 50 mM sodium acetate, 50 mM Tris chloride, pH 8.0), which contains a protease inhibitor cocktail (Sigma–Aldrich) on ice for 1 h. Afterwards, the samples were centrifuged at 4 °C for 30 min and the supernatant was used to determine the protein concentration using the BCA Protein Assay Kit (Pierce, Thermo Fisher Scientific, Rockford, IL, USA). 4× sodium dodecyl sulfate (SDS) buffer was given to the samples (20–40 µg), which were then denaturized at 94 °C for 5 min and separated by electrophoresis using 4–10% polyacrylamide gradient gels. By Western blotting (1.5 h and 75 mA) proteins were transferred to a polyvinylidene difluoride membrane (Roth, Karlsruhe, Germany). Subsequently, membranes were blocked in blocking solution (5% w/v milk powder in Tris-buffered saline (TBS) with 0.05% Tween 20, TBST) for 1 h at RT. Then membranes were incubated with primary antibodies (Table 4) diluted in blocking solution at 4 °C overnight. After washing in TBST, horseradish peroxidase (HRP)-coupled secondary antibodies (Table 4) diluted in blocking solution were applied and incubated at RT for 1 h. The membranes were then washed in TBST and TBS for 10–15 min each and incubated for 5 min in Enhanced Chemiluminescence Substrate solution (1:1 mixed; Bio-Rad Laboratories GmbH, München, Germany). Protein bands were detected with a MicroChemi Chemiluminescence Reader (Biostep, Burkhardtsdorf, Germany). Band intensities were measured using ImageJ software and normalized to the reference protein α-Tubulin. The normalized Western blot values are shown as arbitrary units (a.u.).
Table 4.
Primary and secondary antibodies for Western blotting.
2.5. Statistics
The stained signal area [%]/image in retinal and optic nerve sections as well as normalized protein band intensity of both genotypes were analyzed with the Student‘s t-test (V12; StatSoft Europe, Hamburg, Germany). The mean ± standard deviation (SD) is given in the result section. Data are presented as box plots showing mean ± standard error mean (SEM) ± SD. Cq-values of RT-qPCR analyses were evaluated with the Light Cycler 96® Software (V1.1; Roche Applied Science) and analyzed with the software REST© (Relative expression software tool 2009; QIAGEN GmbH, Hilden, Germany) using a pairwise fixed reallocation and randomization test []. Data are presented as box plots showing median ± quartile ± minimum/maximum. p-values below 0.05 were considered statistically significant.
3. Results
3.1. Remodeling of Glycoproteins in the Glaucomatous Retina of PTP-Meg2 HET Mice
First, we examined the mRNA expression of various ECM glycoproteins in the retina of WT and glaucomatous HET mice. The expression of fibronectin (Fn1), the laminin isoforms α4 (Lama4), β2 (Lamb2), and γ3 (Lamc3) as well as tenascin-C (Tnc) and tenascin-R (Tnr) were analyzed via RT-qPCR (Figure 1). Fn1 (1.44-fold; p = 0.03) and Tnc (1.27-fold; p = 0.04) were significantly upregulated in the HET compared to the WT retina. The Tnr mRNA level was comparable in both groups (1.18-fold; p = 0.20). Lamc3 (1.48-fold; p = 0.002) was significantly upregulated in the HET group, while Lama4 (1.34-fold; p = 0.08) and Lamb2 (0.99-fold; p = 0.94) expression levels were comparable in the WT and HET group.
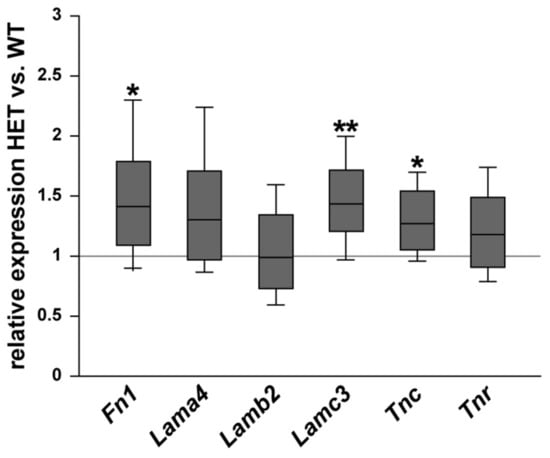
Figure 1.
Increased Fn1, Lamc3, and Tnc mRNA expression levels in the glaucomatous retina of HET mice. Relative expression of ECM glycoproteins in WT and HET retinae was determined by RT-qPCR. Our results showed a significantly increased Fn1, Lamc3 and Tnc expression in the HET retina. Both groups showed a comparable Lama4, Lamb2, and Tnr expression. Groups were compared using a pairwise fixed reallocation and randomization test. Data are shown as median ± quartile ± minimum/maximum. * p < 0.05, ** p < 0.01. n = 5/group.
Next, retinal cross-sections were immunohistochemically stained for the glycoproteins. The fibronectin staining pattern was clearly associated with blood vessels (Figure 2A,B). Compared to WT retinae, HET retinae showed a significantly increased fibronectin immunoreactivity (HET: 1.58 ± 0.32 area [%]/image vs. WT: 0.99 ± 0.23 area [%]/image; p = 0.01; Figure 2C). In line with these findings, quantitative Western blot analysis also revealed a significantly increased intensity of fibronectin protein levels in the HET condition (HET: 0.71 ± 0.10 a.u. vs. WT: 0.57 ± 0.04 a.u.; p = 0.02; Figure 3A,B). The signal of laminin was mainly localized to the ILM and retinal blood vessels. In addition, laminin-immunoreactive cells were seen in the inner nuclear layer (INL; Figure 2D,E). A significantly increased laminin+ area was detected in the HET retina (11.45 ± 0.97 area [%]/image) compared to the WT retina (9.00 ± 1.28 area [%]/image; p = 0.01; Figure 2F). Western blot analyses revealed that the laminin protein level tended to be increased in the HET group, but this was not significant (HET: 0.52 ± 0.21 a.u. vs. WT: 0.36 ± 0.13 a.u.; p = 0.13; Figure 3C,D).
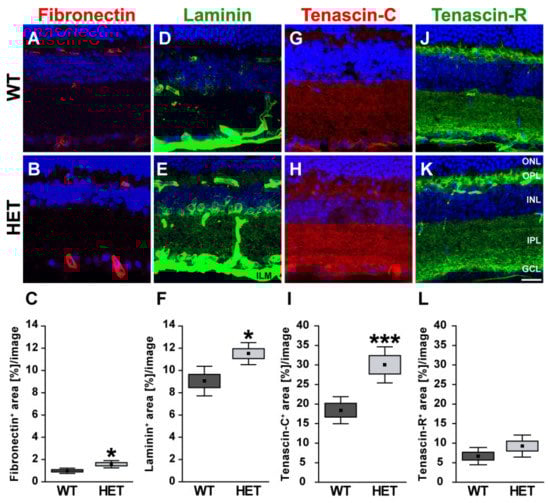
Figure 2.
Enhanced immunoreactivity of ECM glycoproteins in the glaucomatous HET retina. Most representative immunohistochemical ECM stainings are shown. Fibronectin (red; (A,B)) and laminin (green; (D,E)) signals were found in blood vessels. A prominent laminin immunoreactivity was also found in the INL, GCL, and ILM. Staining of tenascin-C (red; (G,H)) and tenascin-R (green; (J,K)) was localized to the plexiform layers. The immunoreactivity of the glycoproteins fibro-nectin, laminin and tenascin-C was significantly upregulated in HET retinae (C,F,I). A comparable tenascin-R signal could be detected in HET and WT retinae (L). Cell nuclei were labeled with TO-PRO-3 (blue). Groups were analyzed by Student‘s t-test. Data are shown as mean ± SEM ± SD. * p < 0.05, *** p < 0.001. n = 5/group. Scale bar = 20 μm. Abbreviations: ONL—outer nuclear layer, OPL—outer plexiform layer, INL—inner nuclear layer, IPL—inner plexiform layer, GCL—ganglion cell layer, ILM—inner limiting membrane.
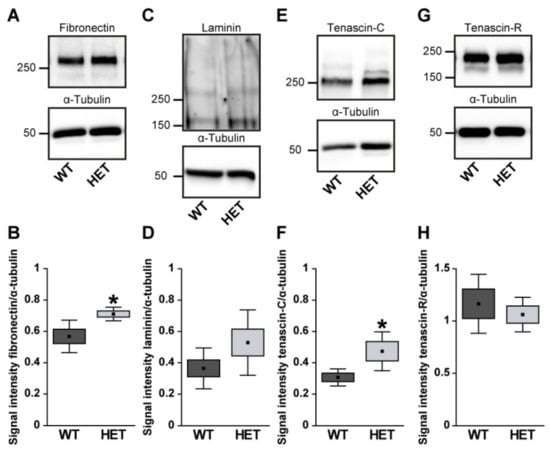
Figure 3.
Western blot analyses of glycoproteins of WT and HET retinal tissue. A significantly increased protein band intensity was observed for fibronectin (A,B) and tenascin-C (E,F) in glaucomatous HET mice. Relative protein quantification revealed a slightly enhanced band intensity of laminin (C,D) in the HET group. Comparable protein levels of tenascin-R were found in both genotypes (G,H). Groups were analyzed by Student‘s t-test. Data are shown as mean ± SEM ± SD. * p < 0.05. n = 4–6/group.
In the retina, displaced amacrine, amacrine and horizontal cells are the cellular source of Tnc expression []. Tenascin-C immunoreactivity of retinal cross-sections was mainly observed in the plexiform layers and in the GCL (Figure 2G,H). The quantification revealed a significant upregulation of the tenascin-C+ area in the HET (29.97 ± 12.87 area [%]/image) compared to WT retinae (18.40 ± 9.31 area [%]/image; p < 0.001; Figure 2I). Western blots also showed enhanced tenascin-C protein levels in the glaucomatous HET retina (HET: 0.48 ± 0.12 a.u. vs. WT: 0.30 ± 0.07 a.u.; p = 0.04; Figure 3E,F).
Tenascin-R+ staining was found in the outer and inner plexiform layer (OPL and IPL), and GCL. However, no differences in the retinal staining area could be detected in both genotypes (HET: 9.26 ± 2.82 area [%]/image vs. WT: 6.69 ± 2.22 area [%]/image; p = 0.15; Figure 2J–L). Western blot analyses verified comparable protein levels of tenascin-R in the retina of both genotypes (WT: 1.16 ± 0.28 a.u. vs. HET: 1.06 ± 0.16 a.u.; p = 0.55; Figure 3G,H).
3.2. Remodeling of Glycoproteins in the Glaucomatous Optic Nerve of PTP-Meg2 HET Mice
Then, the relative mRNA expression of the glycoproteins was determined in the optic nerve of WT and HET mice (Figure 4). A significant increase in Fn1 (1.83-fold; p = 0.014) and Tnc (1.49-fold; p = 0.029) expression was observed in the HET group. No changes were found for Lamc3 (0.77-fold; p = 0.22) and Tnr (0.80-fold; p = 0.23). Interestingly, the expression level of the laminin isoforms Lama4 (0.62-fold; p = 0.026) and Lamb2 (0.54-fold; p = 0.001) was significantly lower in the glaucomatous optic nerve.
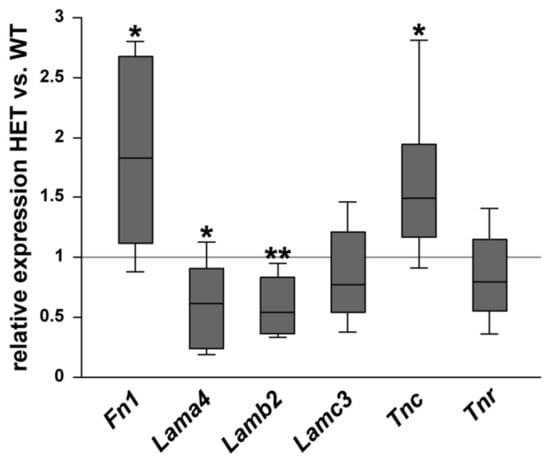
Figure 4.
Diminished glycoprotein expression in the glaucomatous optic nerve of HET animals. Comparison of ECM glycoprotein expression in optic nerves of WT and HET mice was revealed by RT-qPCR analyses. Significantly higher Fn1 and Tnc expression levels were observed in the optic nerves of HET compared to WT mice. Comparable mRNA levels were found for Tnr and Lamc3. In contrast, the expression of Lama4 and Lamb2 was significantly downregulated in the optic nerves of HET compared to WT mice. Groups were compared using a pairwise fixed reallocation and randomization test. Data are shown as median ± quartile ± minimum/maximum. * p < 0.05, ** p < 0.01. n = 5/group.
In the optic nerve, the immunoreactivity of the glycoproteins fibronectin and laminin was restricted to blood vessels (Figure 5A,B,D,E). HET mice (4.22 ± 0.88 area [%]/image) showed a significant increase in the fibronectin+ area compared to the WT (2.17 ± 0.76 area [%]/image; p = 0.004; Figure 5C). The statistical analysis also revealed a higher laminin+ area in the HET group (HET: 10.00 ± 1.57 area [%]/image vs. WT: 6.79 ± 0.28 area [%]/image; p = 0.002; Figure 5F). For tenascin-C, a thread-like staining pattern could be observed in optic nerve sections. In the optic nerve, astrocytes are the cellular source of tenascin-C [,,]. The evaluation of the tenascin-C+ area showed a slightly enhanced immunopositive area in HET mice (WT: 8.21 ± 1.55 area [%]/image vs. HET: 11.04 ± 2.49 area [%]/image; p = 0.10; Figure 5G–I). Tenascin-R displayed a widely extracellular staining pattern in the optic nerve. Here, a comparable tenascin-R+ area was found in the WT (WT: 13.96 ± 3.73 area [%]/image) and HET (HET: 12.32 ± 8.04 area [%]/image; p = 0.69; Figure 5J–L) group.
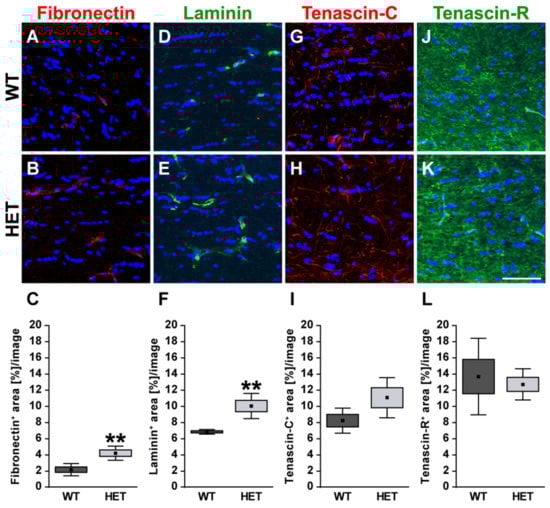
Figure 5.
Enhanced staining signals of blood vessel-associated fibronectin and laminin in the glaucomatous optic nerve of HET mice. Most representative immunohistochemical ECM stainings are shown. Staining of the glycoproteins fibronectin (red; (A–C)) and laminin (green; (D–F)) was significantly increased in the HET optic nerves. Signals were limited to blood vessels. A thread-like-staining pattern was found for tenascin-C (red; (G,H)), while a widely extracellular staining pattern was observed for tenascin-R (green; (J,K)). Both tenascins showed a comparable staining area in the WT and HET group (I,L). Groups were analyzed by Student‘s t-test. Data are shown as mean ± SEM ± SD. ** p < 0.01. n = 5/group. Scale bar = 50 μm.
3.3. Remodeling of Proteoglycans in the Glaucomatous Retina of PTP-Meg2 HET Mice
In addition, the expression pattern of the proteoglycans aggrecan, brevican, and different RPTPβ/ζ isoforms was investigated in WT and HET retinae (Figure 6). The expression of aggrecan (Acan) was comparable in both genotypes (1.16-fold; p = 0.103). Comparable mRNA levels were also observed for brevican (Bcan; 1.05-fold; p = 0.61). The expression of all three RPTPβ/ζ isoforms, namely RPTPβ/ζlong, RPTPβ/ζshort, and phosphacan, was analyzed by the primer pairs RPTPβ/ζ CA, which were directed against the carbonic anhydrase-like (CA) domain. An increased expression level was found in the retinae of HET compared to the WT (1.4-fold; p = 0.013). For the receptor-type isoforms RPTPβ/ζlong and RPTPβ/ζshort, which both have the PTP1 (protein tyrosine phosphatase domain 1), detected by the primer pairs RPTPβ/ζ PTP1, comparable levels were found in the HET condition (1.3-fold; p = 0.10). Based on both RPTPβ/ζ primer analyses, our results suggest that phosphacan is specifically upregulated in the HET retina, while the receptor-type isoforms appear to be constantly expressed in both groups.
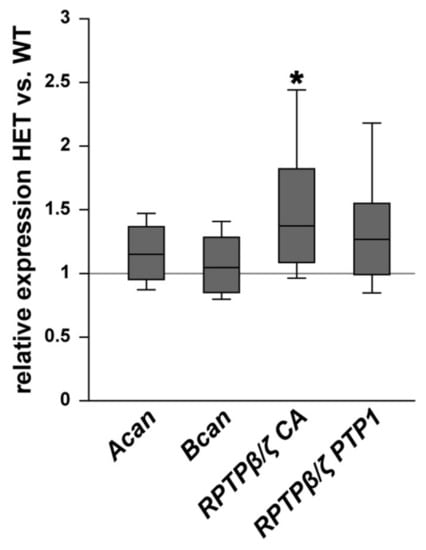
Figure 6.
Upregulation of phosphacan expression in the glaucomatous HET retina. Analyses of Acan, Bcan, and RPTPβ/ζ/phosphacan mRNA expression in the retina of WT and HET mice by RT-qPCR. We observed a significant upregulation of RPTPβ/ζ/phosphacan detected by the primer pairs RPTPβ/ζ CA (all isoforms). However, no changes in the expression of the RPTPβ/ζ receptor variants, namely RPTPβ/ζlong and RPTPβ/ζshort, detected by the primer RPTPβ/ζ PTP1 (receptor isoforms RPTPβ/ζlong and RPTPβ/ζshort) were found. Collectively, these findings indicate that phosphacan is upregulated in the HET retina. A comparable mRNA expression level was detected for Acan and Bcan. Groups were compared using a pairwise fixed reallocation and randomization test. Data are shown as median ± quartile ± minimum/maximum. * p < 0.05. n = 5/group.
The different proteoglycans were also examined immunohistochemically in retinal cross-sections (Figure 7). Immunoreactivity of aggrecan was found within the plexiform layers of the retina, although an association with blood vessels was occasionally detectable.
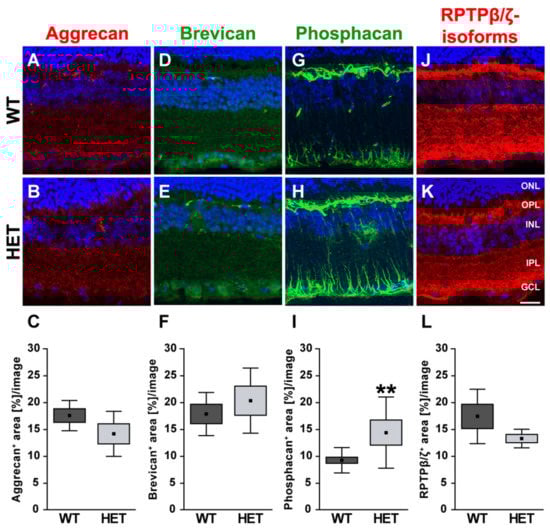
Figure 7.
Enhanced phosphacan immunoreactivity in the glaucomatous retina of HET mice. Most representative immunohistochemical ECM stainings are shown. Stainings revealed a prominent signal for aggrecan (red; (A,B)), brevican (green; (D,E)) and all three RPTPβ/ζ isoforms (red; (J,K)) in the plexiform layers and the GCL. The phosphacan signal was restricted to Müller glia fibers (green; (G,H)). Quantification showed a significant upregulation of phosphacan in the HET retina (I). No changes were noted for aggrecan, brevican and all RPTPβ/ζ isoforms (C,F,L). TO-PRO-3 (blue) was used to detect the cell nuclei. Groups were analyzed by Student‘s t-test. Data are shown as mean ± SEM ± SD. ** p < 0.01. n = 5/group. Scale bar = 20 μm. Abbreviations: ONL—outer nuclear layer, OPL—outer plexiform layer, INL—inner nuclear layer, IPL—inner plexiform layer, GCL—ganglion cell layer.
Quantification revealed a comparable immunopositive area for aggrecan in both groups (WT: 17.58 ± 2.82 area [%]/image vs. HET: 14.18 ± 4.19 area [%]/image; p = 0.17; Figure 7A–C). Western blot analyses also showed comparable aggrecan protein levels in the WT and HET retina (WT: 0.92 ± 0.13 a.u. vs. HET: 0.95 ± 0.14 a.u.; p = 0.76; Figure 8A, B). Brevican staining was found in the GCL and plexiform layers. Our analyses showed a comparable brevican+ area in WT (17.82 ± 4.02 area [%]/image) and HET (20.30 ± 6.06 area [%]/image) retinae (p = 0.47; Figure 7D–F). Western blotting also demonstrated comparable brevican protein levels in the WT and HET retina (WT: 0.42 ± 0.14 a.u. vs. HET: 0.29 ± 0.08 a.u.; p = 0.21; Figure 8C,D).
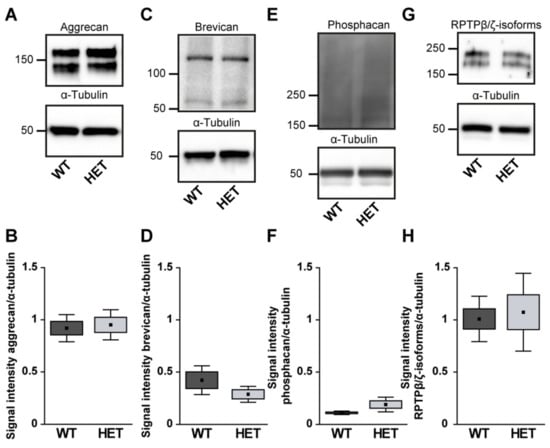
Figure 8.
Western blot analyses of relative aggrecan (A,B), brevican (C,D), phosphacan (E,F) and RPTPβ/ζ isoforms (G,H) in WT and HET retinae. Comparable total protein levels were seen for aggrecan, brevican and all RPTPβ/ζ isoforms. A slightly enhanced signal intensity was detected for phosphacan in the HET condition. Values are indicated as mean ± SEM ± SD. n = 4–5/group.
Phosphacan, which carries the 473HD epitope, represents the secreted splice variant of RPTPβ/ζ (Figure 7G,H). As previously shown, phosphacan staining was restricted to Müller glia and the ILM of the adult retina [,]. Interestingly, phosphacan immunoreactivity was significantly higher in the HET (14.30 ± 6.64 area [%]/image) compared to the WT retina (9.15 ± 2.37 area [%]/image; p = 0.008; Figure 7I). However, our Western blot analyses showed that protein levels of phosphacan were only in tendency increased in the HET retina (HET: 0.19 ± 0.07 a.u. vs. WT: 0.11 ± 0.02 a.u.; p = 0.07; Figure 8E,F). Additionally, comparable levels of all RPTPβ/ζ isoforms were noted in both groups (WT: 17.37 ± 5.06 area [%]/image vs. HET: 13.26 ± 1.73 area [%]/image; p = 0.12; Figure 7J–L). RPTPβ/ζ protein bands were detected between 150 and 250 kDa. Here, relative quantification showed comparable protein levels in WT (1.01 ± 0.22 a.u.) and HET (1.07 ± 0.37 a.u.; p = 0.75; Figure 8G,H).
3.4. Remodeling of Proteoglycans in the Glaucomatous Optic Nerve of PTP-Meg2 HET Mice
Finally, the staining pattern of the proteoglycans was also characterized in the optic nerve of glaucomatous HET and WT animals. On mRNA level no changes could be found for the analyzed proteoglycans (Figure 9). Here, expression of Acan (0.91-fold; p = 0.71) and Bcan (0.73-fold; p = 0.41) was comparable in HET and WT tissue. Additionally, RPTPβ/ζ CA (0.77-fold; p = 0.34) as well as the RPTPβ/ζ PTP1 (0.92-fold; p = 0.67) expression levels were comparable in both groups. A regular, evenly distributed staining pattern of proteoglycans was seen in the optic nerve (Figure 10). The aggrecan+ area was statistically comparable in WT (21.54 ± 10.09 area [%]/image) and HET mice (27.30 ± 7.13 area [%]/image; p = 0.33; Figure 10A–C). Investigation of brevican immunoreactivity also demonstrated unchanged protein level in WT (25.99 ± 8.57 area [%]/image) and HET (30.56 ± 8.33 area [%]/image; p = 0.42; Figure 10D–F). In the WT condition a dot-like immunostaining was evident, while a diffuse distribution of phosphacan was noted in the HET group (Figure 10G,H). A doubling of the staining area was observed for the 473HD epitope in HET (19.78 ± 6.29 area [%]/image) compared to the WT (10.27 ± 3.68 area [%]/image; p = 0.02; Figure 10I). Interestingly, the assessment of all RPTPβ/ζ isoforms revealed no changes of the immunoreactivity between both genotypes (WT: 20.44 ± 6.78 area [%]/image vs. HET: 26.71 ± 8.89 area [%]/image; p = 0.25; Figure 10J–L).
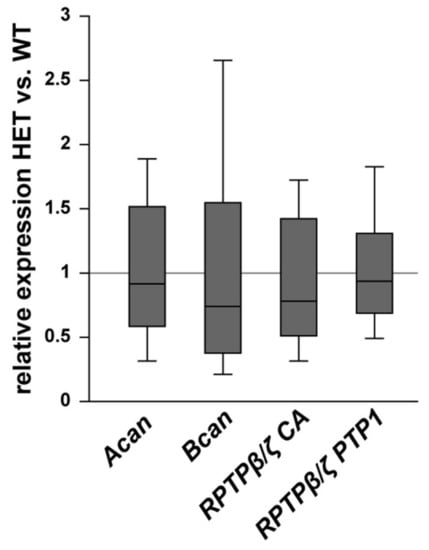
Figure 9.
Expression of Acan, Bcan, and RPTPβ/ζ splice variants was comparable in WT and glaucomatous HET optic nerves. On mRNA level, no differences were observed for Acan, Bcan, and the RPTPβ/ζ splice variants detected by the primers RPTPβ/ζ CA (all isoforms) and RPTPβ/ζ PTP1 (receptor isoforms RPTPβ/ζlong and RPTPβ/ζshort). Groups were compared using a pairwise fixed reallocation and randomization test. Data are shown as median ± quartile ± minimum/maximum. n = 5/group.
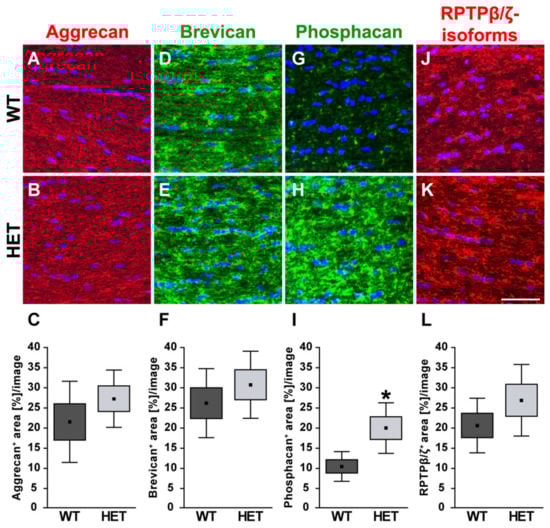
Figure 10.
Increased signal area of the 473HD epitope/phosphacan in the glaucomatous optic nerve. Most representative immunohistochemical ECM stainings are shown. Aggrecan (green; (A,B)), brevican (green; (D,E)), phosphacan (green; (G,H)) as well as all RPTPβ/ζ isoforms (red; (J,K)) showed an immunostaining throughout the optic nerve tissue. Detection of cell nuclei by TO-PRO-3 (blue). Quantification revealed a significant increase in the phosphacan+ area in the glaucomatous HET optic nerve (I). Comparable signals for all RPTPβ/ζ isoforms (L), aggrecan (C) and brevican (F) were found in both genotypes. Groups were analyzed by Student‘s t-test. Data are shown as mean ± SEM ± SD. * p < 0.05. n = 5/group. Scale bar = 50 μm.
4. Discussion
In the present study, we investigated the expression pattern of various ECM molecules in the retina and optic nerve of WT and glaucomatous PTP-Meg2 HET mice via RT-qPCR, immunohistochemistry, and Western blot analyses. PTP-Meg2 HET mice exhibit age-related IOP elevation, which peaks at 28 weeks of age []. Therefore, we performed our experiments at 28 weeks of age in WT and HET littermates, when IOP was chronically increased in the glaucoma model.
4.1. Increased Levels of the ECM Glycoprotein Fibronectin in the Glaucomatous Retina and Optic Nerve
First, investigations of the glycoproteins fibronectin, laminin, tenascin-C, and tenascin-R were performed in retina and optic nerve tissue. Our results demonstrated significantly enhanced levels of fibronectin in the retina and optic nerve of PTP-Meg2 HET mice. The immunohistochemical analyses revealed that fibronectin was closely associated with blood vessels. Indeed, fibronectin is a key component of the vascular basement membrane of retinal vessels and facilitates cell attachment via integrins [,]. Vecino et al. proposed that expression of the receptor α5β1 integrin by RGCs is associated with fibronectin in vitro []. Additionally, as a key adhesion protein, fibronectin can interact with various growth factors [,,]. Martino and colleagues demonstrated that the fibronectin binding domain III12-14 has a high binding affinity to the vascular endothelial growth factor (VEGF)-A, an important modulator of neovascularization []. Neovascular glaucoma causes the development of abnormal new blood vessels that prevent aqueous humor outflow, which ultimately leads to an increased IOP. Regression of neovascularization by treatment with anti-VEGF agents reduced IOP and led to a better outcome for neovascular glaucoma [,]. In this regard, our findings might point to neovascularization in glaucomatous PTP-Meg2 HET mice. Furthermore, enhanced fibronectin levels seem to be associated with chronic IOP elevation, which may be induced by an increased Vegf expression.
4.2. Altered Isoform-Specific Regulation of Laminin in Glaucomatous Tissue
Laminins are heterotrimers that consist of three disulfide-linked polypeptides, namely α, β, and γ subunits. There are numerous isoforms of each subunit, thus many laminin trimers can be generated [,]. For total laminin, we found a significantly increased immunoreactivity in retinal and optic nerve sections of glaucomatous HET mice. In the retina, we observed laminin signals in the ILM and retinal blood vessels. In this regard, Libby et al. described a distinct staining for the laminin α4 chain in close association with Müller glia endfeet as well as in the GCL []. In the present study, we also found laminin+ cells in the INL. Based on this finding, Li and colleagues verified that amacrine cells express γ3 laminin []. We specifically analyzed the mRNA expression level of the laminin isoforms α4 (Lama4), β2 (Lamb2), and γ3 (Lamc3) via RT-qPCR. In retinal tissue, we showed an upregulation of Lamc3, while the other isoforms were unchanged in PTP-Meg2 deficient compared to WT mice. Taken together, these findings suggest that Lamc3 is upregulated by amacrine cells after glaucomatous damage. However, future analyses should confirm this upregulation on protein level with an antibody directed against laminin γ3.
In contrast to the immunohistochemical analyses, which showed an upregulation of laminin in the HET retina, our Western blot experiments revealed comparable protein levels. Overall, such discrepancies can probably be explained by the different experimental conditions and evaluation strategies. Consequently, variances in the antibody sensitivity, or the analyses of fixed retinal sections and whole denatured retinal tissue, can lead to different results. Moreover, due to the fact that ECM proteins are heavily glycosylated, it is possible that the experimental conditions cause changes in the glycosylation pattern and an altered signal detection.
A reduced expression of Lama4 and Lamb2 was found in HET optic nerve tissue, while an unchanged Lamc3 expression was observed. The laminin α4 chain regulates vascular branching by activating the Delta-like4/Notch signaling cascade in vivo []. Laminins that contain the β2 and γ3 chains are essential for migration of astrocytes and blood vessel formation in the retina []. Moreover, laminin is important for axonal growth and survival of RGCs in vitro [,]. Indeed, a decreased laminin expression is associated with RGC apoptosis in an IOP-dependent model of glaucoma and after optic nerve ligation [,]. In our study, glaucomatous PTP-Meg2 HET mice showed a significant reduction in the laminin isoforms α4 and β2 in the optic nerve, suggesting that the laminin isoform-specific degradation negatively affect the survival of RGC axons. In summary, our study demonstrated a regulation of specific laminin isoforms in HET mice, indicating that laminin isoforms have distinct functions during glaucomatous degeneration.
4.3. Upregulation of Tenascin-C in the Glaucomatous Retina and Optic Nerve
In the adult, the glycoprotein tenascin-C reappears during neurodegenerative processes and is highly associated with glial reactivity and glial scar formation [,,]. During progressive age-related IOP elevation, PTP-Meg2 HET mice show astrogliosis, which is characterized by an increased immunoreactivity of the glial fibrillary acidic protein (GFAP) []. We found a significant upregulation of tenascin-C in the retina and optic nerve of glaucomatous PTP-Meg2 HET mice. Studies have shown that tenascin-C immunoreactivity in the optic nerve is limited to astrocytes [,,]. In an experimental rat model, it could be shown that an IOP-induced deformation of the optic nerve head led to an upregulation of various ECM molecules, such as tenascin-C and fibronectin []. Furthermore, reactive astrocytes, which express increased tenascin-C levels were found in the optic nerve head of POAG patients []. In agreement with the studies described, we show an IOP-dependent change of tenascin-C in the retina and optic nerve in our glaucoma mouse model.
Neuroinflammation plays a key role in glaucomatous degeneration []. Tenascin-C plays an immunomodulatory role in neuroinflammatory as well as autoimmune diseases [,]. Midwood et al. showed that tenascin-C supports pro-inflammatory processes via TLR4 signaling []. In addition, a recent study on primary microglia has shown that tenascin-C stimulates the release of pro-inflammatory tumor necrosis factor alpha and induces the expression of the inducible nitric oxide synthetase by the TLR4 pathway []. Accordingly, alterations in ECM components affect the activation, differentiation, and migration of microglia. In a previous study, we confirmed an increased microglia reactivity upon IOP elevation in glaucomatous PTP-Meg2 HET retina and optic nerve []. It is therefore tempting to speculate that tenascin-C-mediated signaling plays an important role in the activation and migration of astrocytes and microglia, which has a harmful effect on RGC survival in our glaucoma mouse model. Consistent with this assumption, we recently demonstrated that Tnc knock-out mice exhibit less severe IOP-independent glaucomatous damage of RGCs and optic nerve fibers, decreased micro- and macroglial reactivity, and increased anti-inflammatory cytokine expression [].
4.4. Unchanged levels of Tenascin-R
The glycoprotein tenascin-R is predominantly expressed by optic nerve oligodendrocytes and horizontal cells of the retina [,,]. Tenascin-R can influence neurite outgrowth as well as neural and glial adhesion [,,]. A domain-specific neuroprotective effect of tenascin-R has been described, presumably by regulation of microglia behavior []. It has also been speculated that an isoform-specific regulation of tenascin-R occurs under ischemic conditions []. However, our experiments showed no alteration in tenascin-R protein level or mRNA expression in PTP-Meg2 HET mice. An unchanged protein level of tenascin-R was also reported in an optic nerve crush model []. Based on the unaltered tenascin-R levels upon IOP-elevation, tenascin-R expressing cells in our glaucoma model do not seem to respond to damage.
4.5. Increased Expression of the RPTPβ/ζ isoform Phosphacan in the Glaucomatous Retina
Investigations of PTP-Meg2 deficient mice showed astrogliosis and glial scar formation as a reaction to glaucomatous RGC damage after IOP increase. An accumulation of CSPGs in the glial scar limits the regeneration of neuronal tissue [,]. Here, we analyzed the expression pattern of the CSPGs aggrecan, brevican, and phosphacan as well as the RPTPβ/ζ receptor isoforms RPTPβ/ζlong and RPTPβ/ζshort.
An increased accumulation of aggrecan and brevican near the lesion core was recognizable after optic nerve crush in rats []. An upregulation of both proteoglycans has also been described under ischemic conditions []. In hereditary retinal dystrophies, however, aggrecan is not involved in degenerative processes []. Remarkably, we found comparable protein and mRNA levels of these proteoglycans, which indicates a damage-independent expression of aggrecan and brevican in our glaucoma model.
Tenascin-C is a high-affinity ECM ligand of RPTPβ/ζ/phosphacan [,]. Our RTq-PCR and immunohistochemical results demonstrated a significant upregulation of the secreted RPTPβ/ζ isoform phosphacan. Additionally, our Western blot analyses showed a trend towards higher phosphacan protein levels. Statistical analyses, however, did not reveal significant differences (p = 0.07), which could possibly be explained by the sensitivity of the different evaluation strategies as well as the existing experimental conditions. In the retina, phosphacan was continuously and exclusively expressed by Müller glia in WT and HET mice. A Müller glia specific expression of phosphacan has been described in vitro and in vivo [,].
Analyses of the RPTPβ/ζ receptor variants showed no differences in both genotypes. An enhanced phosphacan staining signal restricted to Müller glia as well as to optic nerve astrocytes, has also been described in an IOP-independent autoimmune glaucoma rat model []. Macrogliosis was shown not only by an increased number of GFAP-positive astrocytes, but also by an increased vimentin staining of Müller glia in HET mice []. As shown for tenascin-C, the phosphacan signal area in the optic nerve was associated with glial cells. Due to the specific phosphacan immunoreactivity in Müller glia and astrocytes, we assume that accumulation of RPTPβ/ζ/phosphacan and its interaction partner tenascin-C is directly related to reactive gliosis in glaucomatous HET mice.
4.6. Impact of ECM Changes on Glaucomatous RGC Death
Our study provides evidence of ECM remodeling in the optic nerve and retina after IOP-induced glaucomatous damage. We speculate that alterations of the ECM may have a direct impact on RGC death and optic nerve degeneration by influencing survival and apoptotic signaling pathways. Previous studies suggest that abnormal ECM remodeling in the glaucomatous retina is related to the death of RGC [,,]. The ECM also affects integrin expression of RGCs, thus influencing their survival and axonal growth []. It has also been shown that the ECM is capable to bind, sequester and locally release various growth factors []. In this regard, it could be possible that ECM stiffness has an influence on the accessibility of specific growth factor receptors and therefore affects the survival of RGCs. However, the ECM is a multitasking player, which can also have an influence on RGCs through the orchestration of micro- and macroglial cells. Nevertheless, further studies are necessary to identify the molecular signaling pathways underlying the ECM changes in glaucomatous RGC death. This knowledge could also be useful in advancing the development of matrisome technology and potent pharmacotherapies for the treatment of retinal and optic nerve injury [,].
5. Conclusions
In this study, we demonstrated ECM remodeling in the IOP-dependent PTP-Meg2 HET glaucoma model. The upregulation of the blood vessel-associated ECM component fibronectin indicates neovascularization during glaucomatous damage. The expression pattern of different laminin subunits suggests an isoform-specific regulation. The expression pattern and increased levels of tenascin-C and phosphacan might point to their functional involvement in glaucomatous gliosis. Furthermore, dysregulation of ECM molecules seems to be rather harmful than neuroprotective. Future studies should focus on ECM signaling pathways for a better understanding of the underlying molecular mechanisms of RGC death and gliotic activity in IOP-dependent glaucomatous damage. This overall knowledge could be important for the development of new and improved diag-nostic and therapeutic approaches for patients with glaucoma.
Author Contributions
Conceptualization, J.R.; Formal Analysis, J.R., S.W., S.H.; Funding Acquisition, A.F.; Methodology, J.R., S.W., and S.H.; Writing—Original Draft, J.R. and S.W.; Writing—Review and Editing, A.F. All authors have read and agreed to the published version of the manuscript.
Funding
This research was supported by the German Research Foundation (DFG: SFB 509 TPA10; FA 159/14-1). J.R. was supported by the Research School, Ruhr-University Bochum (DFG: GSC 98/1). S.W. was supported by the Konrad-Adenauer-Foundation (200520593).
Institutional Review Board Statement
All experiments were carried out in accordance with the declaration of the “Association for Research and Vision and Ophthalmology (ARVO)” for the use of animals in ophthalmic and vision research and were approved (approval number: 81-02.04.2018.A071; permission date: 6 August 2018) by the animal care committee of the “Landesamt für Natur, Umwelt und Verbraucherschutz (LANUV)”, 45659 Recklinghausen, North Rhine-Westphalia, Germany.
Informed Consent Statement
Not applicable.
Data Availability Statement
The data presented in this study are available on request from the corresponding author.
Acknowledgments
We thank Stephanie Chun, Anja Coenen, Sabine Kindermann, and Marion Voelzkow for excellent technical support.
Conflicts of Interest
The authors declare no conflict of interest.
Abbreviations
| Bp | base pairs |
| CA | carbonic anhydrase-like domain |
| CSPG | chondroitin sulfate proteoglycan |
| ECM | extracellular matrix |
| For | forward |
| GCL | ganglion cell layer |
| GFAP | glial fibrillary acidic protein |
| HET | heterozygous |
| ILM | inner limiting membrane |
| INL | inner nuclear layer |
| IOP | intraocular pressure |
| IPL | inner plexiform layer |
| ONL | outer nuclear layer |
| OPL | outer plexiform layer |
| PBS | phosphate-buffered saline |
| POAG | primary open-angle glaucoma |
| PTP1 | protein tyrosine phosphatase domain 1 |
| PTP-Meg2 | protein tyrosine phosphatase megakaryocyte 2 |
| Rev | reverse |
| RGC | retinal ganglion cell |
| RPTPβ/ζ | receptor protein tyrosine phosphatase beta/zeta |
| RT-qPCR | quantitative real-time polymerase chain reaction |
| SD | standard deviation |
| SEM | standard error of the mean |
| TLR4 | toll-like receptor 4 |
| WT | wild type |
References
- European Glaucoma Society Terminology and Guidelines for Glaucoma, 4th Edition—Chapter 2: Classification and terminology Supported by the EGS Foundation: Part 1: Foreword; Introduction; Glossary; Chapter 2 Classification and Terminology. Br. J. Ophthalmol. 2017, 101, 73–127. [CrossRef]
- Tham, Y.C.; Li, X.; Wong, T.Y.; Quigley, H.A.; Aung, T.; Cheng, C.Y. Global prevalence of glaucoma and projections of glaucoma burden through 2040: A systematic review and meta-analysis. Ophthalmology 2014, 121, 2081–2090. [Google Scholar] [CrossRef] [PubMed]
- Reinhard, J.; Wiemann, S.; Joachim, S.C.; Palmhof, M.; Woestmann, J.; Denecke, B.; Wang, Y.; Downey, G.P.; Faissner, A. Heterozygous Meg2 Ablation Causes Intraocular Pressure Elevation and Progressive Glaucomatous Neurodegeneration. Mol. Neurobiol. 2019, 56, 4322–4345. [Google Scholar] [CrossRef] [PubMed]
- Mecham, R.P. Overview of extracellular matrix. Curr. Protoc. Cell Biol. 2012, 57, 10.1.1–10.1.16. [Google Scholar] [CrossRef] [PubMed]
- Hynes, R.O.; Naba, A. Overview of the matrisome—An inventory of extracellular matrix constituents and functions. Cold Spring Harb. Perspect. Biol. 2012, 4, a004903. [Google Scholar] [CrossRef]
- Faissner, A.; Reinhard, J. The extracellular matrix compartment of neural stem and glial progenitor cells. Glia 2015, 63, 1330–1349. [Google Scholar] [CrossRef]
- Krishnaswamy, V.R.; Benbenishty, A.; Blinder, P.; Sagi, I. Demystifying the extracellular matrix and its proteolytic remodeling in the brain: Structural and functional insights. Cell. Mol. Life Sci. 2019, 76, 3229–3248. [Google Scholar] [CrossRef] [PubMed]
- Theocharis, A.D.; Manou, D.; Karamanos, N.K. The extracellular matrix as a multitasking player in disease. FEBS J. 2019, 286, 2830–2869. [Google Scholar] [CrossRef] [PubMed]
- Reinhard, J.; Joachim, S.C.; Faissner, A. Extracellular matrix remodeling during retinal development. Exp. Eye Res. 2015, 133, 132–140. [Google Scholar] [CrossRef]
- Gandhi, M.; Dubey, S. Evaluation of the Optic Nerve Head in Glaucoma. J. Curr. Glaucoma Pr. 2013, 7, 106–114. [Google Scholar]
- Quigley, H.A. Neuronal death in glaucoma. Prog. Retin. Eye Res. 1999, 18, 39–57. [Google Scholar] [CrossRef]
- Hernandez, M.R. Ultrastructural immunocytochemical analysis of elastin in the human lamina cribrosa. Changes in elastic fibers in primary open-angle glaucoma. Invest. Ophthalmol. Vis. Sci. 1992, 33, 2891–2903. [Google Scholar]
- Hernandez, M.R.; Andrzejewska, W.M.; Neufeld, A.H. Changes in the extracellular matrix of the human optic nerve head in primary open-angle glaucoma. Am. J. Ophthalmol. 1990, 109, 180–188. [Google Scholar] [CrossRef]
- Morrison, J.C.; Dorman-Pease, M.E.; Dunkelberger, G.R.; Quigley, H.A. Optic nerve head extracellular matrix in primary optic atrophy and experimental glaucoma. Arch. Ophthalmol. 1990, 108, 1020–1024. [Google Scholar] [CrossRef]
- Pena, J.D.; Agapova, O.; Gabelt, B.T.; Levin, L.A.; Lucarelli, M.J.; Kaufman, P.L.; Hernandez, M.R. Increased elastin expression in astrocytes of the lamina cribrosa in response to elevated intraocular pressure. Invest. Ophthalmol. Vis. Sci. 2001, 42, 2303–2314. [Google Scholar]
- Reinhard, J.; Renner, M.; Wiemann, S.; Shakoor, D.A.; Stute, G.; Dick, H.B.; Faissner, A.; Joachim, S.C. Ischemic injury leads to extracellular matrix alterations in retina and optic nerve. Sci. Rep. 2017, 7, 43470. [Google Scholar] [CrossRef]
- Miller, C.G.; Budoff, G.; Prenner, J.L.; Schwarzbauer, J.E. Minireview: Fibronectin in retinal disease. Exp. Biol. Med. (Maywood) 2017, 242, 1–7. [Google Scholar] [CrossRef]
- Roy, S.; Sato, T.; Paryani, G.; Kao, R. Downregulation of fibronectin overexpression reduces basement membrane thickening and vascular lesions in retinas of galactose-fed rats. Diabetes 2003, 52, 1229–1234. [Google Scholar] [CrossRef] [PubMed]
- Kasetti, R.B.; Maddineni, P.; Millar, J.C.; Clark, A.F.; Zode, G.S. Increased synthesis and deposition of extracellular matrix proteins leads to endoplasmic reticulum stress in the trabecular meshwork. Sci. Rep. 2017, 7, 14951. [Google Scholar] [CrossRef]
- Faralli, J.A.; Filla, M.S.; Peters, D.M. Role of Fibronectin in Primary Open Angle Glaucoma. Cells 2019, 8. [Google Scholar] [CrossRef]
- Roberts, A.L.; Mavlyutov, T.A.; Perlmutter, T.E.; Curry, S.M.; Harris, S.L.; Chauhan, A.K.; McDowell, C.M. Fibronectin extra domain A (FN-EDA) elevates intraocular pressure through Toll-like receptor 4 signaling. Sci. Rep. 2020, 10, 9815. [Google Scholar] [CrossRef] [PubMed]
- Libby, R.T.; Champliaud, M.F.; Claudepierre, T.; Xu, Y.; Gibbons, E.P.; Koch, M.; Burgeson, R.E.; Hunter, D.D.; Brunken, W.J. Laminin expression in adult and developing retinae: Evidence of two novel CNS laminins. J. Neurosci. 2000, 20, 6517–6528. [Google Scholar] [CrossRef]
- Edwards, M.M.; Lefebvre, O. Laminins and retinal vascular development. Cell Adhes. Migr. 2013, 7, 82–89. [Google Scholar] [CrossRef]
- Thyboll, J.; Kortesmaa, J.; Cao, R.; Soininen, R.; Wang, L.; Iivanainen, A.; Sorokin, L.; Risling, M.; Cao, Y.; Tryggvason, K. Deletion of the laminin alpha4 chain leads to impaired microvessel maturation. Mol. Cell. Biol. 2002, 22, 1194–1202. [Google Scholar] [CrossRef]
- Yousif, L.F.; Di Russo, J.; Sorokin, L. Laminin isoforms in endothelial and perivascular basement membranes. Cell Adhes. Migr. 2013, 7, 101–110. [Google Scholar] [CrossRef]
- Pinzon-Duarte, G.; Daly, G.; Li, Y.N.; Koch, M.; Brunken, W.J. Defective formation of the inner limiting membrane in laminin beta2- and gamma3-null mice produces retinal dysplasia. Investig. Ophthalmol. Vis. Sci. 2010, 51, 1773–1782. [Google Scholar] [CrossRef] [PubMed]
- Gnanaguru, G.; Bachay, G.; Biswas, S.; Pinzon-Duarte, G.; Hunter, D.D.; Brunken, W.J. Laminins containing the beta2 and gamma3 chains regulate astrocyte migration and angiogenesis in the retina. Development 2013, 140, 2050–2060. [Google Scholar] [CrossRef] [PubMed]
- Reinhard, J.; Roll, L.; Faissner, A. Tenascins in Retinal and Optic Nerve Neurodegeneration. Front. Integr. Neurosci. 2017, 11, 30. [Google Scholar] [CrossRef]
- D’Alessandri, L.; Ranscht, B.; Winterhalter, K.H.; Vaughan, L. Contactin/F11 and tenascin-C co-expression in the chick retina correlates with formation of the synaptic plexiform layers. Curr. Eye Res. 1995, 14, 911–926. [Google Scholar] [CrossRef] [PubMed]
- Wiemann, S.; Reinhard, J.; Faissner, A. Immunomodulatory role of the extracellular matrix protein tenascin-C in neuroinflammation. Biochem. Soc. Trans. 2019, 47, 1651–1660. [Google Scholar] [CrossRef]
- Jakovcevski, I.; Miljkovic, D.; Schachner, M.; Andjus, P.R. Tenascins and inflammation in disorders of the nervous system. Amino Acids 2013, 44, 1115–1127. [Google Scholar] [CrossRef] [PubMed]
- Dzyubenko, E.; Manrique-Castano, D.; Kleinschnitz, C.; Faissner, A.; Hermann, D.M. Role of immune responses for extracellular matrix remodeling in the ischemic brain. Adv. Neurol. Disord. 2018, 11. [Google Scholar] [CrossRef] [PubMed]
- Reinehr, S.; Reinhard, J.; Wiemann, S.; Stute, G.; Kuehn, S.; Woestmann, J.; Dick, H.B.; Faissner, A.; Joachim, S.C. Early remodelling of the extracellular matrix proteins tenascin-C and phosphacan in retina and optic nerve of an experimental autoimmune glaucoma model. J. Cell. Mol. Med. 2016, 20, 2122–2137. [Google Scholar] [CrossRef] [PubMed]
- Johnson, E.C.; Jia, L.; Cepurna, W.O.; Doser, T.A.; Morrison, J.C. Global changes in optic nerve head gene expression after exposure to elevated intraocular pressure in a rat glaucoma model. Investig. Ophthalmol. Vis. Sci. 2007, 48, 3161–3177. [Google Scholar] [CrossRef] [PubMed]
- Pesheva, P.; Gloor, S.; Schachner, M.; Probstmeier, R. Tenascin-R is an intrinsic autocrine factor for oligodendrocyte differentiation and promotes cell adhesion by a sulfatide-mediated mechanism. J. Neurosci. 1997, 17, 4642–4651. [Google Scholar] [CrossRef]
- Pesheva, P.; Probstmeier, R.; Skubitz, A.P.; McCarthy, J.B.; Furcht, L.T.; Schachner, M. Tenascin-R (J1 160/180 inhibits fibronectin-mediated cell adhesion--functional relatedness to tenascin-C. J. Cell Sci. 1994, 107, 2323–2333. [Google Scholar]
- Eskici, N.F.; Erdem-Ozdamar, S.; Dayangac-Erden, D. The altered expression of perineuronal net elements during neural differentiation. Cell. Mol. Biol. Lett. 2018, 23, 5. [Google Scholar] [CrossRef] [PubMed]
- Bartsch, U.; Pesheva, P.; Raff, M.; Schachner, M. Expression of janusin (J1-160/180) in the retina and optic nerve of the developing and adult mouse. Glia 1993, 9, 57–69. [Google Scholar] [CrossRef] [PubMed]
- Wintergerst, E.S.; Fuss, B.; Bartsch, U. Localization of janusin mRNA in the central nervous system of the developing and adult mouse. Eur. J. Neurosci. 1993, 5, 299–310. [Google Scholar] [CrossRef]
- Roll, L.; Faissner, A. Tenascins in CNS lesions. Semin. Cell Dev. Biol. 2019, 89, 118–124. [Google Scholar] [CrossRef]
- Silver, J.; Miller, J.H. Regeneration beyond the glial scar. Nat. Rev. Neurosci. 2004, 5, 146–156. [Google Scholar] [CrossRef]
- Sofroniew, M.V. Dissecting spinal cord regeneration. Nature 2018, 557, 343–350. [Google Scholar] [CrossRef]
- Wang, H.; Song, G.; Chuang, H.; Chiu, C.; Abdelmaksoud, A.; Ye, Y.; Zhao, L. Portrait of glial scar in neurological diseases. Int. J. Immunopathol. Pharm. 2018, 31. [Google Scholar] [CrossRef]
- Pearson, C.S.; Solano, A.G.; Tilve, S.M.; Mencio, C.P.; Martin, K.R.; Geller, H.M. Spatiotemporal distribution of chondroitin sulfate proteoglycans after optic nerve injury in rodents. Exp. Eye Res. 2020, 190, 107859. [Google Scholar] [CrossRef]
- Klausmeyer, A.; Garwood, J.; Faissner, A. Differential expression of phosphacan/RPTPbeta isoforms in the developing mouse visual system. J. Comp. Neurol. 2007, 504, 659–679. [Google Scholar] [CrossRef]
- Seidenbecher, C.I.; Richter, K.; Rauch, U.; Fassler, R.; Garner, C.C.; Gundelfinger, E.D. Brevican, a chondroitin sulfate proteoglycan of rat brain, occurs as secreted and cell surface glycosylphosphatidylinositol-anchored isoforms. J. Biol. Chem. 1995, 270, 27206–27212. [Google Scholar] [CrossRef] [PubMed]
- Czopka, T.; Von Holst, A.; Schmidt, G.; Ffrench-Constant, C.; Faissner, A. Tenascin C and tenascin R similarly prevent the formation of myelin membranes in a RhoA-dependent manner, but antagonistically regulate the expression of myelin basic protein via a separate pathway. Glia 2009, 57, 1790–1801. [Google Scholar] [CrossRef] [PubMed]
- Faissner, A.; Kruse, J. J1/tenascin is a repulsive substrate for central nervous system neurons. Neuron 1990, 5, 627–637. [Google Scholar] [CrossRef]
- Rathjen, F.G.; Wolff, J.M.; Chiquet-Ehrismann, R. Restrictin: A chick neural extracellular matrix protein involved in cell attachment co-purifies with the cell recognition molecule F11. Development 1991, 113, 151–164. [Google Scholar]
- Faissner, A.; Clement, A.; Lochter, A.; Streit, A.; Mandl, C.; Schachner, M. Isolation of a neural chondroitin sulfate proteoglycan with neurite outgrowth promoting properties. J. Cell Biol. 1994, 126, 783–799. [Google Scholar] [CrossRef] [PubMed]
- Pfaffl, M.W.; Horgan, G.W.; Dempfle, L. Relative expression software tool (REST) for group-wise comparison and statistical analysis of relative expression results in real-time PCR. Nucleic Acids Res. 2002, 30, e36. [Google Scholar] [CrossRef] [PubMed]
- Stenzel, D.; Franco, C.A.; Estrach, S.; Mettouchi, A.; Sauvaget, D.; Rosewell, I.; Schertel, A.; Armer, H.; Domogatskaya, A.; Rodin, S.; et al. Endothelial basement membrane limits tip cell formation by inducing Dll4/Notch signalling in vivo. EMBO Rep. 2011, 12, 1135–1143. [Google Scholar] [CrossRef] [PubMed]
- Vecino, E.; Heller, J.P.; Veiga-Crespo, P.; Martin, K.R.; Fawcett, J.W. Influence of extracellular matrix components on the expression of integrins and regeneration of adult retinal ganglion cells. PLoS ONE 2015, 10, e0125250. [Google Scholar] [CrossRef]
- Mooradian, D.L.; Lucas, R.C.; Weatherbee, J.A.; Furcht, L.T. Transforming growth factor-beta 1 binds to immobilized fibronectin. J. Cell. Biochem. 1989, 41, 189–200. [Google Scholar] [CrossRef]
- Hoshijima, M.; Hattori, T.; Inoue, M.; Araki, D.; Hanagata, H.; Miyauchi, A.; Takigawa, M. CT domain of CCN2/CTGF directly interacts with fibronectin and enhances cell adhesion of chondrocytes through integrin alpha5beta1. FEBS Lett. 2006, 580, 1376–1382. [Google Scholar] [CrossRef]
- Smith, E.M.; Mitsi, M.; Nugent, M.A.; Symes, K. PDGF-A interactions with fibronectin reveal a critical role for heparan sulfate in directed cell migration during Xenopus gastrulation. Proc. Natl. Acad. Sci. USA 2009, 106, 21683–21688. [Google Scholar] [CrossRef] [PubMed]
- Martino, M.M.; Hubbell, J.A. The 12th-14th type III repeats of fibronectin function as a highly promiscuous growth factor-binding domain. FASEB J. 2010, 24, 4711–4721. [Google Scholar]
- Simha, A.; Braganza, A.; Abraham, L.; Samuel, P.; Lindsley, K. Anti-vascular endothelial growth factor for neovascular glaucoma. Cochrane Database Syst. Rev. 2013, CD007920. [Google Scholar] [CrossRef]
- SooHoo, J.R.; Seibold, L.K.; Kahook, M.Y. Recent advances in the management of neovascular glaucoma. Semin. Ophthalmol. 2013, 28, 165–172. [Google Scholar] [CrossRef]
- Hohenester, E.; Yurchenco, P.D. Laminins in basement membrane assembly. Cell Adhes. Migr. 2013, 7, 56–63. [Google Scholar] [CrossRef] [PubMed]
- Li, Y.N.; Radner, S.; French, M.M.; Pinzon-Duarte, G.; Daly, G.H.; Burgeson, R.E.; Koch, M.; Brunken, W.J. The gamma3 chain of laminin is widely but differentially expressed in murine basement membranes: Expression and functional studies. Matrix Biol. 2012, 31, 120–134. [Google Scholar] [CrossRef] [PubMed][Green Version]
- Cohen, J.; Johnson, A.R. Differential effects of laminin and merosin on neurite outgrowth by developing retinal ganglion cells. J. Cell Sci. Suppl. 1991, 15, 1–7. [Google Scholar] [CrossRef] [PubMed]
- Chintala, S.K.; Zhang, X.; Austin, J.S.; Fini, M.E. Deficiency in matrix metalloproteinase gelatinase B (MMP-9) protects against retinal ganglion cell death after optic nerve ligation. J. Biol. Chem. 2002, 277, 47461–47468. [Google Scholar] [CrossRef]
- Guo, L.; Moss, S.E.; Alexander, R.A.; Ali, R.R.; Fitzke, F.W.; Cordeiro, M.F. Retinal ganglion cell apoptosis in glaucoma is related to intraocular pressure and IOP-induced effects on extracellular matrix. Investig. Ophthalmol. Vis. Sci. 2005, 46, 175–182. [Google Scholar] [CrossRef] [PubMed]
- Pena, J.D.; Varela, H.J.; Ricard, C.S.; Hernandez, M.R. Enhanced tenascin expression associated with reactive astrocytes in human optic nerve heads with primary open angle glaucoma. Exp. Eye Res. 1999, 68, 29–40. [Google Scholar] [CrossRef] [PubMed]
- Soto, I.; Howell, G.R. The complex role of neuroinflammation in glaucoma. Cold Spring Harb. Perspect. Med. 2014, 4. [Google Scholar] [CrossRef]
- Goh, F.G.; Piccinini, A.M.; Krausgruber, T.; Udalova, I.A.; Midwood, K.S. Transcriptional regulation of the endogenous danger signal tenascin-C: A novel autocrine loop in inflammation. J. Immunol. 2010, 184, 2655–2662. [Google Scholar] [CrossRef]
- Midwood, K.; Sacre, S.; Piccinini, A.M.; Inglis, J.; Trebaul, A.; Chan, E.; Drexler, S.; Sofat, N.; Kashiwagi, M.; Orend, G.; et al. Tenascin-C is an endogenous activator of Toll-like receptor 4 that is essential for maintaining inflammation in arthritic joint disease. Nat. Med. 2009, 15, 774–780. [Google Scholar] [CrossRef] [PubMed]
- Haage, V.; Elmadany, N.; Roll, L.; Faissner, A.; Gutmann, D.H.; Semtner, M.; Kettenmann, H. Tenascin C regulates multiple microglial functions involving TLR4 signaling and HDAC1. Brain Behav. Immun. 2019, 81, 470–483. [Google Scholar] [CrossRef]
- Wiemann, S.; Reinhard, J.; Reinehr, S.; Cibir, Z.; Joachim, S.C.; Faissner, A. Loss of the extracellular matrix molecule tenascin-C leads to absence of reactive gliosis and promotes anti-inflammatory cytokine expression in an autoimmune glaucoma mouse model. Front. Immun. 2020, 11. [Google Scholar] [CrossRef] [PubMed]
- Liao, H.; Bu, W.Y.; Wang, T.H.; Ahmed, S.; Xiao, Z.C. Tenascin-R plays a role in neuroprotection via its distinct domains that coordinate to modulate the microglia function. J. Biol. Chem. 2005, 280, 8316–8323. [Google Scholar] [CrossRef]
- Becker, T.; Anliker, B.; Becker, C.G.; Taylor, J.; Schachner, M.; Meyer, R.L.; Bartsch, U. Tenascin-R inhibits regrowth of optic fibers in vitro and persists in the optic nerve of mice after injury. Glia 2000, 29, 330–346. [Google Scholar] [CrossRef]
- Susarla, B.T.; Laing, E.D.; Yu, P.; Katagiri, Y.; Geller, H.M.; Symes, A.J. Smad proteins differentially regulate transforming growth factor-beta-mediated induction of chondroitin sulfate proteoglycans. J. Neurochem. 2011, 119, 868–878. [Google Scholar] [CrossRef]
- Galtrey, C.M.; Fawcett, J.W. The role of chondroitin sulfate proteoglycans in regeneration and plasticity in the central nervous system. Brain Res. Rev. 2007, 54, 1–18. [Google Scholar] [CrossRef]
- Chen, L.F.; FitzGibbon, T.; He, J.R.; Yin, Z.Q. Localization and developmental expression patterns of CSPG-cs56 (aggrecan) in normal and dystrophic retinas in two rat strains. Exp. Neurol. 2012, 234, 488–498. [Google Scholar] [CrossRef] [PubMed]
- Milev, P.; Fischer, D.; Haring, M.; Schulthess, T.; Margolis, R.K.; Chiquet-Ehrismann, R.; Margolis, R.U. The fibrinogen-like globe of tenascin-C mediates its interactions with neurocan and phosphacan/protein-tyrosine phosphatase-zeta/beta. J. Biol. Chem. 1997, 272, 15501–15509. [Google Scholar] [CrossRef] [PubMed]
- Barnea, G.; Grumet, M.; Milev, P.; Silvennoinen, O.; Levy, J.B.; Sap, J.; Schlessinger, J. Receptor tyrosine phosphatase beta is expressed in the form of proteoglycan and binds to the extracellular matrix protein tenascin. J. Biol. Chem. 1994, 269, 14349–14352. [Google Scholar] [CrossRef]
- Zhang, X.; Cheng, M.; Chintala, S.K. Kainic acid-mediated upregulation of matrix metalloproteinase-9 promotes retinal degeneration. Investig. Ophthalmol. Vis. Sci. 2004, 45, 2374–2383. [Google Scholar] [CrossRef]
- Bonnans, C.; Chou, J.; Werb, Z. Remodelling the extracellular matrix in development and disease. Nat. Rev. Mol. Cell Biol. 2014, 15, 786–801. [Google Scholar] [CrossRef] [PubMed]
- Sainio, A.; Jarvelainen, H. Extracellular matrix-cell interactions: Focus on therapeutic applications. Cell. Signal. 2020, 66, 109487. [Google Scholar] [CrossRef]
- Ren, T.; van der Merwe, Y.; Steketee, M.B. Developing Extracellular Matrix Technology to Treat Retinal or Optic Nerve Injury (1,2,3). eNeuro 2015, 2. [Google Scholar] [CrossRef]
Publisher’s Note: MDPI stays neutral with regard to jurisdictional claims in published maps and institutional affiliations. |
© 2021 by the authors. Licensee MDPI, Basel, Switzerland. This article is an open access article distributed under the terms and conditions of the Creative Commons Attribution (CC BY) license (http://creativecommons.org/licenses/by/4.0/).