Simple Summary
Genetic alterations, such as RET/PTC and AGK-BRAF fusions, are frequent events in pediatric papillary thyroid carcinoma (PTC). However, their role as prognostic markers in pediatric PTC is still under investigation. In this study, we present a patient harboring three tumor foci with distinct genetic alterations (AGK-BRAF, RET/PTC3 and an absence of canonical alterations) that were investigated for DNA structure and telomere-related genomic instability. These preliminary results highlight that AGK-BRAF fusion likely affects nuclear architecture, which might explain a more aggressive disease outcome observed in pediatric PTC cases with AGK-BRAF fusion.
Abstract
The spectrum and incidence of gene fusions in papillary thyroid carcinoma (PTC) can differ significantly depending on the age of onset, histological subtype or radiation exposure history. In sporadic pediatric PTC, RET/PTC1-3 and AGK-BRAF fusions are common genetic alterations. The role of RET/PTC as a prognostic marker in pediatric PTC is still under investigation. We recently showed that AGK-BRAF fusion is prevalent in young patients (mean 10 years) and associated with specific and aggressive pathological features such as multifocality and lung metastasis. In this pilot study, we report a unique patient harboring three different foci: the first was positive for AGK-BRAF fusion, the second was positive for just RET/PTC3 fusion and the third was negative for both rearrangements. To investigate whether AGK-BRAF and RET/PTC3 are associated with genomic instability and chromatin modifications, we performed quantitative fluorescence in situ hybridization (Q-FISH) of telomere repeats followed by 3D imaging analysis and 3D super-resolution Structured Illumination Microscopy (3D-SIM) to analyze the DNA structure from the foci. We demonstrated in this preliminary study that AGK-BRAF is likely associated with higher levels of telomere-related genomic instability and chromatin remodeling in comparison with RET/PTC3 foci. Our results suggest a progressive disruption in chromatin structure in AGK-BRAF-positive cells, which might explain a more aggressive disease outcome in patients harboring this rearrangement.
1. Introduction
Thyroid carcinoma is the most frequent malignancy of the endocrine system in pediatric patients (≤18 years), where papillary thyroid carcinoma (PTC) is the most common subtype (80–90%) [1,2]. The most prevalent genetic alterations found in pediatric PTC are RET/PTC fusions (~41% in sporadic cases, ~58% in radiation-induced cases), where RET/PTC1 and RET/PTC3 are the most recurrent rearrangements [1,3]. These rearrangements have been associated with aggressive disease (extrathyroidal extension, lymph node and pulmonary metastasis) [4]. Since they have already been described in benign thyroid tumors, mainly in radiation-induced cases [4], the role of RET/PTC as prognostic marker in sporadic pediatric PTC is still unclear.
AGK-BRAF [inv (7) (q34)] fusion was originally identified in radiation-exposed PTC cases [5]. Our previous studies have shown that AGK-BRAF fusion is a recurrent event in sporadic pediatric PTC cases (19%), and is associated with younger age and pulmonary metastasis of sporadic pediatric PTC [6,7]. Although AGK-BRAF has already been associated with the pathogenesis and progression of sporadic PTC cases, its role in genomic instability has not yet been investigated.
Changes in the telomere nuclear architecture and DNA structure remodeling are important features of genomic instability, malignant transformation and aggressiveness [8]. Telomere-related genomic instability plays an important role in cancer and can be used to unmask disease heterogeneity [8]. Moreover, super-resolution microscopy has made it possible to visualize subcellular organization, e.g., the nuclear DNA [9]. In this pilot study, we compared telomere signatures and changes in the chromatin structure of three individual tumor foci that harbored different genetic events (AGK-BRAF or RET/PTC3) to better understand their role in genomic instability in pediatric PTC.
2. Results
2.1. Patient Description
A 13-year-old girl with a follicular variant of PTC underwent total thyroidectomy at the hospital of Santa Casa de São Paulo, SP, Brazil. The surgery was followed by four doses of radioiodine (cumulative dose 1150 mCi) treatment. A histological examination showed a bilateral and multifocal tumor with the largest focus measuring 5 × 4 × 2 cm, capsular and angiolymphatic invasion, extrathyroidal extension and lymph node involvement. The patient had five tumor foci, but only three were available for the analysis. Additional findings included lung metastasis at diagnosis and persistent disease during follow-up. There was no family history of thyroid cancer or exposure to radiation. In a previous molecular analysis from a pediatric PTC cohort [10], the patient exhibited the presence of AGK-BRAF and RET/PTC3 rearrangements in two independent foci of the primary PTC, shown in Table 1. A third focus of the primary PTC was also available for analysis, but no genetic alterations were found. Lymph node and lung metastases samples were not available for the analysis.

Table 1.
Genetic alterations observed in each focus of the pediatric PTC assessed in this study.
2.2. 3D Analysis of Nuclear Telomere Organization Indicates Increased Telomere-Related Genomic Instability in the AGK-BRAF Positive Focus
Critically short telomeres are hotspots resulting from incorrect recombination, leading to chromosomal instability and malignant transformation [11]. We used 3D quantitative fluorescence in situ hybridization (Q-FISH) to analyze the telomere organization within different foci, as shown in Figure 1. We named as focus 1 the AGK-BRAF-positive, as focus 2 the negative for AGK-BRAF and RET/PTC3 fusions (and other investigated alterations [10]), and as focus 3 the RET/PTC3-positive, shown in Table 1.
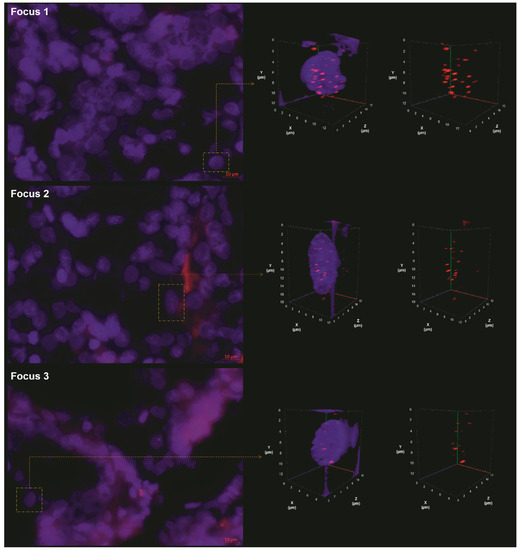
Figure 1.
Images from the quantitative fluorescence in situ hybridization (Q-FISH) of the three foci, showing the 2D raw image (left panel) and the 3D deconvolved nuclei (right panel). The right panel shows the representative 3D nuclear telomere distribution (red signals) with and without the counterstained nucleus (blue). In this figure, we can observe the progressive change of 3D telomere nuclear architecture from focus 1 to focus 3.
Telomere parameters comparisons among foci 1, 2 and 3 are shown in Figure 2. Focus 1 showed higher number of telomere signals (p = 0.0009) and telomeric aggregates (TA) (p = 0.0089) and higher total intensity of signals (p = 0.0005) and a/c ratio (p < 0.0001) in comparison with focus 3, as seen in Figure 2a–d,f. The comparison between foci 1 and 2 showed that focus 2 had higher nuclear volume (p < 0.0001), found in Figure 2e. Between foci 2 and 3, focus 2 had higher nuclear volume (p = 0.0024) and higher a/c ratio (p = 0.0016) than 3. Figure 2g shows that no difference was observed in other parameters assessed.
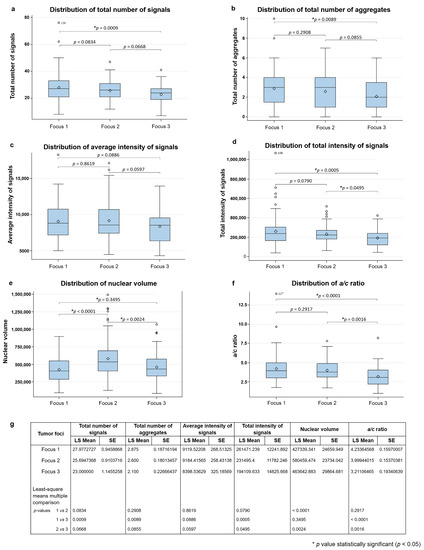
Figure 2.
Histogram of the distribution of total number of telomere signals (a); total number of telomeric aggregates (TA) (b); av-erage intensity of signals (c); total intensity of signals (d); nuclear volume (e) and a/c ratio (f). In (g), we show the p-values for each comparison made in pairs. LS Mean: least square means. SE: standard error. * p < 0.05.
2.3. Three-Dimensional Structured Illumination Microscopy (3D-SIM) Measurements Show Significant Changes in DNA Structure in the AGK-BRAF-Positive Focus
To investigate changes in the DNA structure and the presence of DNA-poor spaces, we used super-resolution imaging and granulometry-based measurements [12]. Granulometry quantified the size distribution of DNA structure and DNA-poor spaces on interphase nuclei. SIM-reconstructed images are presented in Figure 3 (left panel), and the DNA organization, which can be interpreted from the granulometry curves that demonstrate cumulative distributions of granule sizes, is shown in Figure 3 (right panel). Focus 1 showed larger DNA structures and less homogeneous DNA distribution than foci 2 and 3 (p < 0.001 for both) (right panel). Moreover, focus 1 presented more DNA-poor spaces than foci 2 and 3 (p = 0.00832 and p = 0.00579) (right panel), which was illustrated in the nuclei from SIM images (left panel). No difference was observed between foci 2 and 3 (p = 0.115, DNA structure; p = 0.511, DNA-poor space).
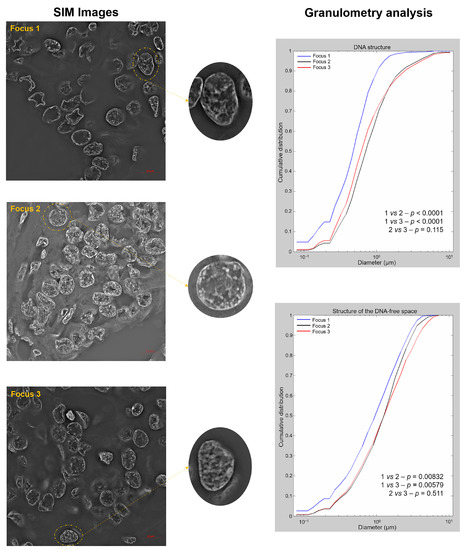
Figure 3.
Representative Structured Illumination Microscopy (SIM) images for foci 1, 2 and 3 (left panel) and the granulometry comparisons between the foci for DNA structure (right top panel) and DNA-poor spaces (right bottom panel).
3. Discussion
AGK-BRAF fusion is a recurrent event in pediatric PTC [6]. However, the mechanism by which AGK-BRAF promotes an aggressive phenotype is still unclear. Telomere-mediated genomic instability and chromatin reorganization have been described in tumor cells and correlate with tumor stage and malignant transformation [13]. In this study, we macrodissected three foci of the PTC that were likely to represent the tumor, and examined, for the first time, the effect of different genetic alterations on the telomere organization and chromatin structure. One important conclusion from this study is that representative regions of multifocal PTC may not be entirely informative about overall tumor histology and biology.
Our telomere analysis revealed that focus 1, which harbors AGK-BRAF, contained higher numbers of telomeres, total intensity of signals and a/c ratio, and more TA when compared to focus 3 with RET/PTC3 fusion. The presence of more telomeres and telomere fusions in the AGK-BRAF focus illustrates genetic aberrations characteristic of cancers, including aneuploidy and gene loss by the breakage-fusion-bridge events initiated by telomere dysfunction. BRAF plays an important role in mitosis, mediating proper spindle formation and activation of the spindle assembly checkpoint. Interesting, the BRAF V600E mutation, which leads to constitutive activation of the BRAF kinase, also induces chromosome mis-segregation resulting in aneuploidy [14]. Importantly, BRAF V600E highly activates MAPK pathway in comparison with RET fusion oncoproteins [15]. This is due to unresponsiveness to the negative feedback of activated ERK [15].
Although we did not observe significant differences in the average intensity of telomere signals, total intensity was higher in the focus 1 compared to focus 3. The increased total intensity (a sum value of all intensities in a cell) could have been the result of higher numbers of telomere signals and TA, rather than increased telomere length. Interestingly, focus 2 presented with higher nuclear volume than foci 1 and 3. High nuclear volume or nuclear size or shape are correlated with poor prognosis and progression of some malignancies [16,17]. Cancer cells with high nuclear volumes are often classified as tumors in advanced stages, but the mechanisms behind nuclear volume regulation are still unclear. The a/c ratio represents the cell cycle distribution and is correlated with proliferation rates [18]. Increased a/c ratio found on focus 1 (AGK-BRAF) indicated high proliferation levels. The higher rates in focus 1 could also have been related to the activation of the MAPK pathway induced by the BRAF fusion. Although we did not perform Ki-67 staining to compare the a/c ratio, it has been shown that the proliferation index measured by Ki-67 staining is extremely similar to the a/c ratio measured with TeloView®, presenting 98% of concordance between the analysis [19].
Super-resolution imaging can reveal features of carcinogenesis [20]. Our 3D-SIM results showed important changes in the nuclear structure in the focus 1 compared to foci 2 and 3, with more DNA structure and DNA-poor spaces (spaces void of DNA structure). These data suggested that AGK-BRAF cells present an increased packaging of the DNA and have more DNA than the other foci. This result aligned with our telomere data, which showed more telomere signals and probably more chromosomes. Previous studies have shown that the number of DNA-poor spaces increases in tumor cells [12,20,21,22], suggesting chromatin remodeling. However, these DNA-free interchromatin areas could be nucleoli, which display the same morphology as DNA-poor spaces and could also be associated with the absence of DNA. We did not perform any staining with antinucleolin antibody or upstream-binding factor (UBF) to differentiate the DNA-poor spaces from nucleoli, a limitation to our study. The granulometry program measures DNA content and absence of DNA signals, not differentiation between DNA-poor spaces and nucleoli. Therefore, the increased number of DNA-poor spaces in the nuclei from focus 1 compared to foci 2 and 3 could be also a consequence of a hypertrophy of nucleoli, which has been correlated with cell proliferation and growth in malignant tumors [23].
Additionally, none of the previously investigated molecular alterations [10] were identified in focus 2. Interestingly, telomere analysis showed no differences between foci 1 and 2 in four telomere parameters (except for nuclear volume). On the other hand, in the 3D-SIM analysis, focus 2 showed a similar structure as focus 3. Further analysis of this focus is necessary to better understand the nature of its genetic background and how it influences nuclear organization and DNA structure.
To conclude, SIM data combined with the 3D telomeric signatures provided a clear discrimination between AGK-BRAF and RET/PTC3 fusions, suggesting distinct levels of genomic instability and nuclear organization. Although additional data is needed to support our results, AGK-BRAF fusion is likely associated with a more unstable genetic profile, corroborating with our previously reported data associating this rearrangement with poor prognosis [6].
4. Materials and Methods
4.1. Patient Samples
Tissue sections (5-µm thickness) from each focus, shown in Table 1, were obtained from formalin-fixed, paraffin-embedded (FFPE) blocks. The selection of the areas from the different tumor foci was performed from Hematoxylin & Eosin (H&E) slides by a pathologist of the Department of Pathology, UNIFESP, as previously described [10]. The Research Ethical Committees from the Universidade Federal de São Paulo and Santa Casa de Misericórdia de São Paulo approved the study (CEP/UNIFESP: 0466/2019).
4.2. 3D Telomere Q-FISH, Image Acquisition and Analysis using TeloView® Software Platform
Three-Dimensional Q-FISH was performed following a previously published protocol [24]. In summary, the FFPE tissue sections were deparaffinized by xylene (3 × 10 min), followed by two, 10-min incubations in 100% ethanol. After being air dried, the slides were incubated in 0.2 N HCl (37 °C—30 min) and washed while shaking in ddH2O and 2x saline-sodium citrate (SSC) buffer (5 min each) at room temperature (RT). Then the tissues were pre-treated in 1M NaSCN (80 °C—30 min) and washed twice while shaking in 2x SSC (RT—5 min each). The samples were digested using 1 mg/mL pepsin in 0.2 N HCl (37 °C—10 min) and washed twice in 2X SSC (RT—5 min each), while shaking. Then the slides were dehydrated in a series of ethanol (70%, 90% and 100%—5 min each) and air dried. Eight microliters of a telomeric TTAGGG peptide-nucleic acid (PNA) probe conjugated to a Cyanine 3 (Cy3) fluorophore (DAKO, Glostrup, Denmark) were applied onto the tumor areas. Co-denaturation of the DNA and the probe was performed by incubating the slides at 80 °C for 3 min, followed by hybridization, at 37 °C for 2 h, using a HYBrite Denaturation and Hybridization System (Vysis; Abbott Diagnostics, Des Plains, IL, USA). In order to remove the excess nonhybridized probe, the slides were washed twice while shaking in 70% formamide/10 mM Tris-HCl (pH 7.4) (RT—15 min each). Then they were washed while shaking once in 0.1X SSC at 55 °C and twice in 2X SSC/0.05% Tween-20 (RT—5 min each. Lastly, the slides were counterstained using 50 µL of 4′,6-diamidino-2-phenylindole (DAPI) (1 μg/mL) and incubated in the dark for 3 min. Excess DAPI was rinsed with ddH2O, and slides were mounted with 22 × 22 mm coverslips using Vectashield mounting medium (Vector Laboratories, Burlington, Ontario, Canada).
One hundred cells from each focus were imaged using a Zeiss AxioImager Z2 microscope equipped with a Zeiss AxioCam MRmm Rev 3 camera (Carl Zeiss Canada Ltd.). The Cy3 filter was used at a constant exposure time (241 ms), while exposure time for the DAPI filter varied. Images were captured in 60 z-stacks at 200-nm intervals to create the 3D images of the cell nuclei. The program AxioVision Release 4.8.2 (Carl Zeiss, Germany) was used for imaging and further imaging processing, using a constrained iterative deconvolution algorithm.
TeloView® v1.03 software program [18] (Telo Genomics Corp., Toronto, ON, Canada) was used to analyze the deconvolved images. TeloView® measures six parameters [18]: number of telomere signals; total intensity of signals; average intensity of signals (telomere length); number of aggregates (cluster of telomeres found in close proximity to each other that, at 200 nm optical resolution, cannot be further resolved as separate entities); a/c ratio (cell cycle distribution as being G0/G1, S or G2, according to the position of the telomeres in the cell nuclei; the higher the a/c ratio, the greater the proportion of cells in proliferations); and nuclear volume (measured by nuclear DAPI staining in the x, y and z dimensions). The parameters were compared among the three foci using a nested factorial analysis of variance followed by a least-square means multiple comparison. The p-value for the overall test of differences between the three foci was indicated by graphical presentations. Chi-square analysis was used to compare the percent of interphase telomere signal intensity as defined quartile cut-offs. A p < 0.05 was defined as statistically significant.
4.3. 3D-SIM Slide Preparation, Image Acquisition and Analysis
For 3D-SIM, the FFPE samples were deparaffinized using xylene and washed in 1x PBS. Slides were incubated overnight with 10 µg/mL DAPI, in a 37 °C humid chamber and then washed in 1X PBS, air dried and mounted with 18 × 18 mm high performance coverslips (thickness 1 1/2, 0.170 +/− 0.005 mm) (Carl Zeiss Canada Ltd.) using Vectashield mounting medium (Vector Laboratories). We used a Zeiss Elyra PS1 SIM equipped with a Plan-Apochromat 63x/1.40 oil immersion objective, an Andor EM-CCD iXon 885 camera and a 1.6X tube lens (all from Carl Zeiss, Canada) to image 50 cells from each focus. DAPI-stained images were captured using 405 nm laser excitation, a 23-µm diffraction grating and a SR Cube 07 filter cube. Images were acquired at 91-nm intervals between the z-stacks to create the 3D images from the nuclei. Images were reconstructed by ZEN 2012 black edition (Carl Zeiss, Jena, Germany) using the standard settings. Image processing was performed using MATLAB software (MathWorks, Natick, MA, USA). A central z-plane was manually selected and exported as a TIFF file. We used the granulometry program to measure changes in the DNA structure and the presence of DNA-poor spaces with a morphological sieve applied to the error-function clipped images [12]. DNA-poor spaces are DNA-free interchromatin areas that are observed in increased amounts in malignant cells [12]. A statistical analysis was performed by comparing the distributions using two-sided, two-sample Kolmogorov–Smirnov (KS) tests to determine any differences. A p < 0.05 was defined as statistically significant.
Author Contributions
Conceptualization, L.S., A.R.-P., S.M. and J.M.C., Methodology, L.S. A.R.-P., S.M. and J.M.C.; Imaging, L.S.; Data analysis, L.S.; Interpretation of the data, L.S., M.O.F. and A.R.-P., Clinical data, M.I.V.C., F.V., O.M., C.A.L. and A.N.C.; Writing—Original draft preparation, L.S.; Writing—Review & Editing, A.R.-P., M.I.V.C., F.V., A.N.C., O.M., C.A.L., M.O.F., S.M., J.M.C.; Supervision; S.M., and J.M.C.; Funding acquisition, S.M. and J.M.C. All authors have read and agreed to the published version of the manuscript.
Funding
The study was supported by research grants from The São Paulo State Research Foundation (FAPESP, 2014/06570-6). L.S. is recipient of fellowship grants from FAPESP (2018/09911-0 and 2018/26395-5). J.M.C. is a recipient of a scholarship of Research Productivity from CNPq (304534/2018-8).
Institutional Review Board Statement
The study was conducted according to the guidelines of the Declaration of Helsinki, and approved by the Ethics Committee of Universidade Federal de São Paulo and Santa Casa de Misericórdia de São Paulo (CEP/UNIFESP: 0466/2019-6 June 2019)
Informed Consent Statement
Informed consent was obtained from all subjects involved in the study.
Data Availability Statement
The data presented in this study are available in the present article.
Acknowledgments
We thank Coordenação de Aperfeiçoamento de Pessoal de Nível Superior (CAPES) and FAPESP for their financial support; Telo Genomics Corp. for the use of TeloView®; Mary Cheang for statistical analysis; the Manitoba Tumour Bank and Andrea Fristensky for the use of the laboratory to cut the FFPE samples; and John Gartner for a careful and critical English language editing. The authors also thank the Genomic Centre for Cancer Research and Diagnosis (GCCRD) for imaging. The GCCRD is funded by the Canada Foundation for Innovation and supported by CancerCare Manitoba Foundation, the University of Manitoba and the Canada Research Chair Tier 1 (SM). The GCCRD is a member of the Canadian National Scientific Platforms (CNSP) and of Canada BioImaging. The study in Canada was supported by SM’s Canada Research Chair (CIHR).
Conflicts of Interest
S.M. is a co-founder, shareholder, and the chair of the clinical and scientific advisory committee of Telo Genomics Corp. (Toronto ON, Canada). The other authors declare that they have no conflict of interest.
Abbreviations
| 3D-SIM | 3D super-resolution structured Illumination Microscopy |
| Q-FISH | Quantitative fluorescet in situ hybridization |
| PTC | Papillary thyroid carcinoma |
| SIM | Structured illumination microscopy |
| TA | Telomeric aggregates |
References
- Paulson, V.A.; Rudzinski, E.R.; Hawkins, D.S. Thyroid cancer in the pediatric population. Genes 2019, 10, 723. [Google Scholar] [CrossRef]
- Howlader, N.; Noone, A.; Krapcho, M.; Miller, D.; Brest, A.; Yu, M.; Ruhl, J.; Tatalovich, Z.; Mariotto, A.; Lewis, D.; et al. Cancer Statistics Review, 1975–2017—SEER Statistics. Available online: https://seer.cancer.gov/csr/1975_2017/ (accessed on 13 July 2020).
- Cordioli, M.I.; Moraes, L.; Cury, A.N.; Cerutti, J.M. Are we really at the dawn of understanding sporadic pediatric thyroid carcinoma? Endocr. Relat. Cancer 2015, 22, R311–R324. [Google Scholar] [CrossRef] [PubMed]
- Prescott, J.D.; Zeiger, M.A. The RET oncogene in papillary thyroid carcinoma. Cancer 2015. [Google Scholar] [CrossRef]
- Ricarte-Filho, J.C.; Li, S.; Garcia-Rendueles, M.E.R.; Montero-Conde, C.; Voza, F.; Knauf, J.A.; Heguy, A.; Viale, A.; Bogdanova, T.; Thomas, G.A.; et al. Identification of kinase fusion oncogenes in post-Chernobyl radiation-induced thyroid cancers. J. Clin. Investig. 2013, 123, 4935–4944. [Google Scholar] [CrossRef]
- Sisdelli, L.; Cordioli, M.I.C.V.; Vaisman, F.; Moraes, L.; Colozza-Gama, G.A.; Alves, P.A.G.; Araújo, M.L.; Alves, M.T.S.; Monte, O.; Longui, C.A.; et al. AGK-BRAF is associated with distant metastasis and younger age in pediatric papillary thyroid carcinoma. Pediatric Blood Cancer 2019, 66, 1–7. [Google Scholar] [CrossRef]
- Cordioli, M.I.; Moraes, L.; Carvalheira, G.; Sisdelli, L.; Alves, M.T.S.; Delcelo, R.; Monte, O.; Longui, C.A.; Cury, A.N.; Cerutti, J.M. AGK-BRAF gene fusion is a recurrent event in sporadic pediatric thyroid carcinoma. Cancer Med. 2016, 5, 1535–1541. [Google Scholar] [CrossRef]
- Mai, S. The three-dimensional cancer nucleus. Genes Chromosom. Cancer 2019, 58, 462–473. [Google Scholar] [CrossRef] [PubMed]
- Schermelleh, L.; Ferrand, A.; Huser, T.; Eggeling, C.; Sauer, M.; Biehlmaier, O.; Drummen, G.P.C. Super-resolution microscopy demystified. Nat. Cell Biol. 2019, 21, 72–84. [Google Scholar] [CrossRef]
- Cordioli, M.I.; Moraes, L.; Bastos, A.U.; Besson, P.; de Alves, M.T.S.; Delcelo, R.; Monte, O.; Longui, C.; Cury, A.N.; Cerutti, J.M. Fusion Oncogenes Are the Main Genetic Events Found in Sporadic Papillary Thyroid Carcinomas from Children. Thyroid 2017, 27, 182–188. [Google Scholar] [CrossRef] [PubMed]
- Galati, A.; Micheli, E.; Cacchione, S. Chromatin structure in telomere dynamics. Front. Oncol. 2013, 3, 46. [Google Scholar] [CrossRef]
- Righolt, C.H.; Guffei, A.; Knecht, H.; Young, I.T.; Stallinga, S.; Van Vliet, L.J.; Mai, S. Differences in nuclear DNA organization between lymphocytes, hodgkin and reed-sternberg cells revealed by structured illumination microscopy. J. Cell. Biochem. 2014, 115, 1441–1448. [Google Scholar] [CrossRef]
- Chow, K.H.; Factor, R.E.; Ullman, K.S. The nuclear envelope environment and its cancer connections. Nat. Rev. Cancer 2012, 12, 196–209. [Google Scholar] [CrossRef]
- Cui, Y.; Borysova, M.K.; Johnson, J.O.; Guadagno, T.M. Oncogenic B-RafV600E induces spindle abnormalities, supernumerary centrosomes, and aneuploidy in human melanocytic cells. Cancer Res. 2010, 70, 675–684. [Google Scholar] [CrossRef]
- Fagin, J.A.; Wells, S.A. Biologic and clinical perspectives on thyroid cancer. N. Engl. J. Med. 2016, 375, 1054–1067. [Google Scholar] [CrossRef] [PubMed]
- Rizzotto, A.; Tollis, S.; Pham, N.; Wildenhain, J.; Zuleger, N.; Keys, J.; Batrakou, D.; Culley, J.; Zheng, S.; Lammerding, J.; et al. Chemical-Genetic Interrogation of Nuclear Size Control Reveals Cancer-Specific Effects on Cell Migration and Invasion. bioRxiv 2020. [Google Scholar] [CrossRef]
- Zink, D.; Fischer, A.H.; Nickerson, J.A. Nuclear structure in cancer cells. Nat. Rev. Cancer 2004, 4, 677–687. [Google Scholar] [CrossRef]
- Vermolen, B.J.; Garini, Y.; Mai, S.; Mougey, V.; Fest, T.; Chuang, T.C.-Y.; Chuang, A.Y.-C.; Wark, L.; Young, I.T. Characterizing the three-dimensional organization of telomeres. Cytom. Part A 2005, 67A, 144–150. [Google Scholar] [CrossRef]
- Gadji, M.; Fortin, D.; Tsanaclis, A.M.; Garini, Y.; Katzir, N.; Wienburg, Y.; Yan, J.; Klewes, L.; Klonisch, T.; Drouin, R.; et al. Three-dimensional nuclear telomere architecture is associated with differential time to progression and overall survival in glioblastoma patients. Neoplasia 2010, 12, 183–191. [Google Scholar] [CrossRef]
- Righolt, C.H.; Knecht, H.; Mai, S. DNA Superresolution Structure of Reed-Sternberg Cells Differs between Long-Lasting Remission Versus Relapsing Hodgkin’s Lymphoma Patients. J. Cell. Biochem. 2016, 117, 1633–1637. [Google Scholar] [CrossRef] [PubMed]
- Sathitruangsak, C.; Righolt, C.H.; Klewes, L.; Tammur, P.; Ilus, T.; Tamm, A.; Punab, M.; Olujohungbe, A.; Mai, S. Quantitative superresolution microscopy reveals differences in nuclear dna organization of multiple myeloma and monoclonal gammopathy of undetermined significance. J. Cell. Biochem. 2015, 116, 704–710. [Google Scholar] [CrossRef] [PubMed]
- Rangel-Pozzo, A.; Kuzyk, A.; Gartner, J.; Mai, S. MYCN overexpression is linked to significant differences in nuclear DNA organization in neuroblastoma. SPG BioMed 2019. [Google Scholar] [CrossRef]
- Dolde, C.E.; Mukherjee, M.; Cho, C.; Resar, L.M.S. HMG-I/Y in human breast cancer cell lines. Breast Cancer Res. Treat. 2002, 71, 181–191. [Google Scholar] [CrossRef] [PubMed]
- Chin, S.; Daigo, Y.; Huang, H.; Iyer, N.G.; Callagy, G.; Kranjac, T.; Gonzalez, M.; Sangan, T.; Earl, H.; Caldas, C. A simple and reliable pretreatment protocol facilitates fluorescent in situ hybridisation on tissue microarrays of paraffin wax embedded tumour samples. J. Clin. Pathol. Mol. Pathol. 2003, 56, 275–279. [Google Scholar] [CrossRef] [PubMed]


Publisher’s Note: MDPI stays neutral with regard to jurisdictional claims in published maps and institutional affiliations. |
© 2021 by the authors. Licensee MDPI, Basel, Switzerland. This article is an open access article distributed under the terms and conditions of the Creative Commons Attribution (CC BY) license (http://creativecommons.org/licenses/by/4.0/).