Article

Relationship between Plasma Concentrations of Afatinib and the Onset of Diarrhea in Patients with Non-Small Cell Lung Cancer

1
Department of Pharmacy, Akita University Hospital, Akita 010-8543, Japan
2
Department of Internal Medicine, Division of Respiratory Medicine, Akita University School of Medicine, Akita 010-8543, Japan
*
Author to whom correspondence should be addressed.
Biology 2021, 10(10), 1054; https://doi.org/10.3390/biology10101054
Submission received: 24 September 2021 / Accepted: 11 October 2021 / Published: 17 October 2021
(This article belongs to the Section Cancer Biology)

Abstract

:

Simple Summary

Higher afatinib plasma concentrations have been reported to be associated with the severity of diarrhea; however, the specific target plasma concentration of afatinib required to avoid severe diarrhea onset is unclear. We found that an afatinib AUC0–24 of greater than or equal to 823.5 ng·h/mL and C0 of greater than or equal to 28.5 ng/mL may be used as cut-off values for the incidence of afatinib-induced grade 2 diarrhea. A significant correlation between the AUC0–24 and C0 of afatinib was observed (r2 = 0.761; p < 0.001). Therefore, we could use C0 as a marker of therapeutic drug monitoring. In the current study, the median time to the incidence of grade 2 diarrhea in patients with a C0 of more than 28.5 ng/mL was 16 days. Therefore, we recommend monitoring the C0 of afatinib on day 8 after the beginning of afatinib therapy.

Abstract

We evaluated the area under the plasma concentration–time curve (AUC) of afatinib required to avoid the onset of grade 2 or higher diarrhea. The C0 and AUC0–24 of afatinib were significant higher in patients with grade 2 diarrhea than in those with grade 0–1 diarrhea. The areas under the receiver operator curves were 0.795 with the highest sensitivity (89%) and specificity (74%) at an AUC0–24 threshold of 823.5 ng·h/mL, and 0.754 with the highest sensitivity (89%) and specificity (74%) at a C0 threshold of 28.5 ng/mL. In Kaplan–Meier analysis based on these cut-off AUC0–24 and C0 values, the median time to the incidence of grade 2 diarrhea was 16 days. The predicted AUC0–24 of afatinib from the single point of C6 showed the highest correlation with the measured AUC0–24 (r2 = 0.840); however, a significant correlation between the AUC0–24 and C0 was also observed (r2 = 0.761). C0 could be used as a marker of therapeutic drug monitoring because afatinib C0 was related to AUC0–24. Therefore, afatinib C0 should be monitored on day 8 after beginning therapy, and the daily dose of afatinib should be adjusted as an index with a cut-off value of 28.5 ng/mL.

1. Introduction

Afatinib is a second-generation tyrosine kinase inhibitor and irreversible ErbB-family blocker that is used for the first-line treatment of patients with epidermal growth factor receptor (EGFR) mutation-positive non-small cell lung cancer (NSCLC) [1]. Diarrhea is a common side effect associated with afatinib treatment [2,3,4,5,6,7,8], and in clinical practice, the onset of diarrhea following afatinib treatment results in temporary withdrawal or discontinuation of therapy. Among EGFR-tyrosine kinase inhibitor (TKI) treatments, afatinib causes a significantly higher rate of diarrhea than erlotinib or gefitinib [9,10,11].
In the Japanese analysis of the LUX-Lung3 clinical trial, 75.9% of patients administered afatinib therapy required a dose reduction owing to severe side effects, 22% of which were diarrhea of Common Terminology Criteria for Adverse Events (CTCAE) grade 3 [12]. Afatinib-induced diarrhea has been reported to occur in 50–62% of patients within the first 7 days of treatment and in 71% of patients within 14 days [13]. However, the mechanisms of afatinib-induced diarrhea remain poorly understood.
To date, higher afatinib plasma concentrations have been reported to be associated with the severity of diarrhea [14,15,16,17,18]. Therefore, the analysis of plasma concentrations of afatinib may enable the avoidance of diarrhea onset. However, the specific target plasma concentration of afatinib required to avoid severe diarrhea onset is not clear. The area under the plasma concentration–time curve (AUC) is generally the best parameter to indicate drug exposure, and the calculation of AUC is important for assessing the relationships between drug exposure and side effects. However, the calculation of AUC is rarely used in clinical practice because it requires multiple blood sample points, which is painful and time-consuming for patients. Therefore, the plasma trough concentration (C0) at pre-dose is usually used to predict efficacy or toxicity, although one point of C0 may not accurately indicate afatinib exposure. Limited sampling strategies (LSSs) have been proposed to overcome these difficulties. However, the LSS for predicting the AUC of afatinib has not yet been reported.
Accordingly, in this study, we calculated the target AUC0–24 of afatinib to avoid the onset of CTCAE grade 2 or higher diarrhea. In addition, we developed a model to predict the AUC0–24 of afatinib using an LSS. Subsequently, we investigated whether the predicted AUC0–24 of afatinib from C0 alone could provide an accurate approximation of the actual AUC0–24.

2. Materials and Methods

2.1. Patients and Protocols

Thirty-one Japanese patients with EGFR mutation-positive NSCLC (15 women and 16 men) who were hospitalized from October 2014 through December 2020 were consecutively enrolled in this study. The grade for diarrhea was determined based on CTCAE version 4.0. Three patients (2 women and 1 man) were excluded because of withdrawal due to CTCAE grade 3 diarrhea just after beginning and before blood sampling for afatinib pharmacokinetics. Patient characteristics at the start of afatinib therapy are listed in Table 1. The study protocol was approved by the Ethics Committee of Akita University School of Medicine (approval no. 790), and all patients gave written informed consent. This study was performed in accordance with the guidelines of the Declaration of Helsinki.
An initial dose of 30 or 40 mg afatinib (Giotrif; Boehringer Ingelheim, Tokyo, Japan) was orally administered once daily at a designated time (11:00 a.m.). On day 15 after beginning afatinib therapy, whole blood samples were collected just prior to (C0, 24 h after the 14th administration) and at 1, 2, 4, 6, 8, 12, and 24 h after the 15th administration of afatinib. Plasma was isolated by centrifugation at 1900× g for 15 min and was stored at −80 °C until analysis. For the 15 days prior to plasma sampling, nurses managed the administration of afatinib for hospitalized patients.

2.2. Analytical Methods

Plasma concentrations of afatinib were measured by high-performance liquid chromatography (HPLC) and ultraviolet methods, as previously described [19,20,21]. Following the addition of gefitinib (5 ng/10 µL methanol) as an internal standard to a 200-µL plasma sample, the plasma sample was diluted with 800 µL water and vortexed for 30 s. This mixture was applied to an Oasis hydrophilic lipophilic balance extraction cartridge (1 mL, 30 mg) that had been activated previously with methanol and water (1.0 mL each). The cartridge was then washed with 1.0 mL water and 1.0 mL of 60% methanol in water and eluted with 1.0 mL of 100% methanol. Eluates were dried by vortex-vacuum evaporation at 70 °C using a rotary evaporator (AS-ONE CVE-2AS; Osaka, Japan). The resulting residue was then dissolved in 20 µL methanol and vortexed for 30 s; 20 µL of the mobile phase was added to the sample, and the sample was vortexed for another 30 s. A 20-µL aliquot of the sample was then processed by HPLC. The calibration curve of afatinib in plasma was linear over the concentration range of 5 to 250 ng/mL. The limit of quantification of afatinib for this assay was 5 ng/mL. The coefficients of variation and accuracies for intra- and interday assays at the concentration range of 5 to 250 ng/mL were less than 12.4% and within 11.3%, respectively.

2.3. Pharmacokinetic Analysis

Pharmacokinetic analysis of afatinib was carried out using the standard noncompartmental method with WinNonlin (Pharsight Co., Mountain View, CA, USA; version 5.2). The total area under the observed plasma concentration–time curve (AUC) and the partial AUC from 6 to 12 h (AUC6–12), which are estimates of enterohepatic circulation, were calculated using the linear trapezoidal rule. The maximum plasma concentration (Cmax) and minimum plasma concentration (Cmin) of afatinib were obtained directly from the profile.

2.4. Statistical Analyses

The estimated glomerular filtration rate (eGFR) was calculated for each patient according to the following formula: eGFR = 194 × serum creatinine (mg/dL)−1.094 × age−0.287 × body surface area (m2)/1.73 (× 0.739 for women). Shapiro–Wilk tests were used to assess distributions. The clinical characteristics of patients at baseline before afatinib therapy were expressed as the number or mean value ± standard deviation (SD) (range). The Spearman’s rank correlation coefficient test was applied to assess correlations between the AUC0–24 of afatinib and clinical characteristics of the patient. Pharmacokinetic parameters of afatinib and the clinical characteristics of patients at the onset of diarrhea were expressed as median values (quartile 1–quartile 3). Pharmacokinetic parameters of afatinib or the clinical characteristics of patients between the two grade groups of afatinib-induced diarrhea classified by CTCAE were compared using the Mann–Whitney test. Receiver operating characteristic (ROC) curves were used to determine the best cut-off values for predictive factors, which had a minimum distance from the upper left corner to the point on the ROC curve. The Kaplan–Meier method and log-rank test were adopted to estimate and compare the cumulative incidence of grade 2 diarrhea. Multiple linear regression analysis of the AUC0–24 best estimates against afatinib concentrations at various time points (independent variables) was performed to develop the prediction formula for estimating individual AUC0–24 values. This analysis produced the following prediction formula: AUC0–24 = A0 + A1 × C1 + A2 × C2 + … + An × Cn, where An is the coefficient and the number of samples is variable. The predictive performance of the LSS was determined by the bootstrap method [22]. We generated 1000 bootstrap samples only once to reduce the variability of results for all regression analysis methods. The distribution of the misclassification rate obtained during all bootstrap runs was used to estimate the 95% confidence interval (CI).
Results with p-values less than 0.05 were considered statistically significant. Statistical analyses were performed with IBM SPSS Statistics 27.0 for Windows (SPSS IBM Japan Inc., Tokyo, Japan).

3. Results

3.1. Patient Characteristics

The characteristics of patients before afatinib therapy are listed in Table 1. The mean (± SD) age of patients was 67.4 ± 7.7 years, and the means (±SDs) of body weight, body surface area, and body mass index were 57.3 ± 9.4 kg, 1.59 ± 0.16 m2, and 22.7 ± 1.5 kg/m2, respectively. There were no patients with serious renal or hepatic dysfunction before afatinib therapy. The numbers of patients with stage IV, IIIb, and IIb adenocarcinoma were 26, 1, and 1, respectively. The types of EGFR mutations were as follows: exon 19 deletions in 16 patients, exon 21 L858R in 7 patients, and other in 5 patients.

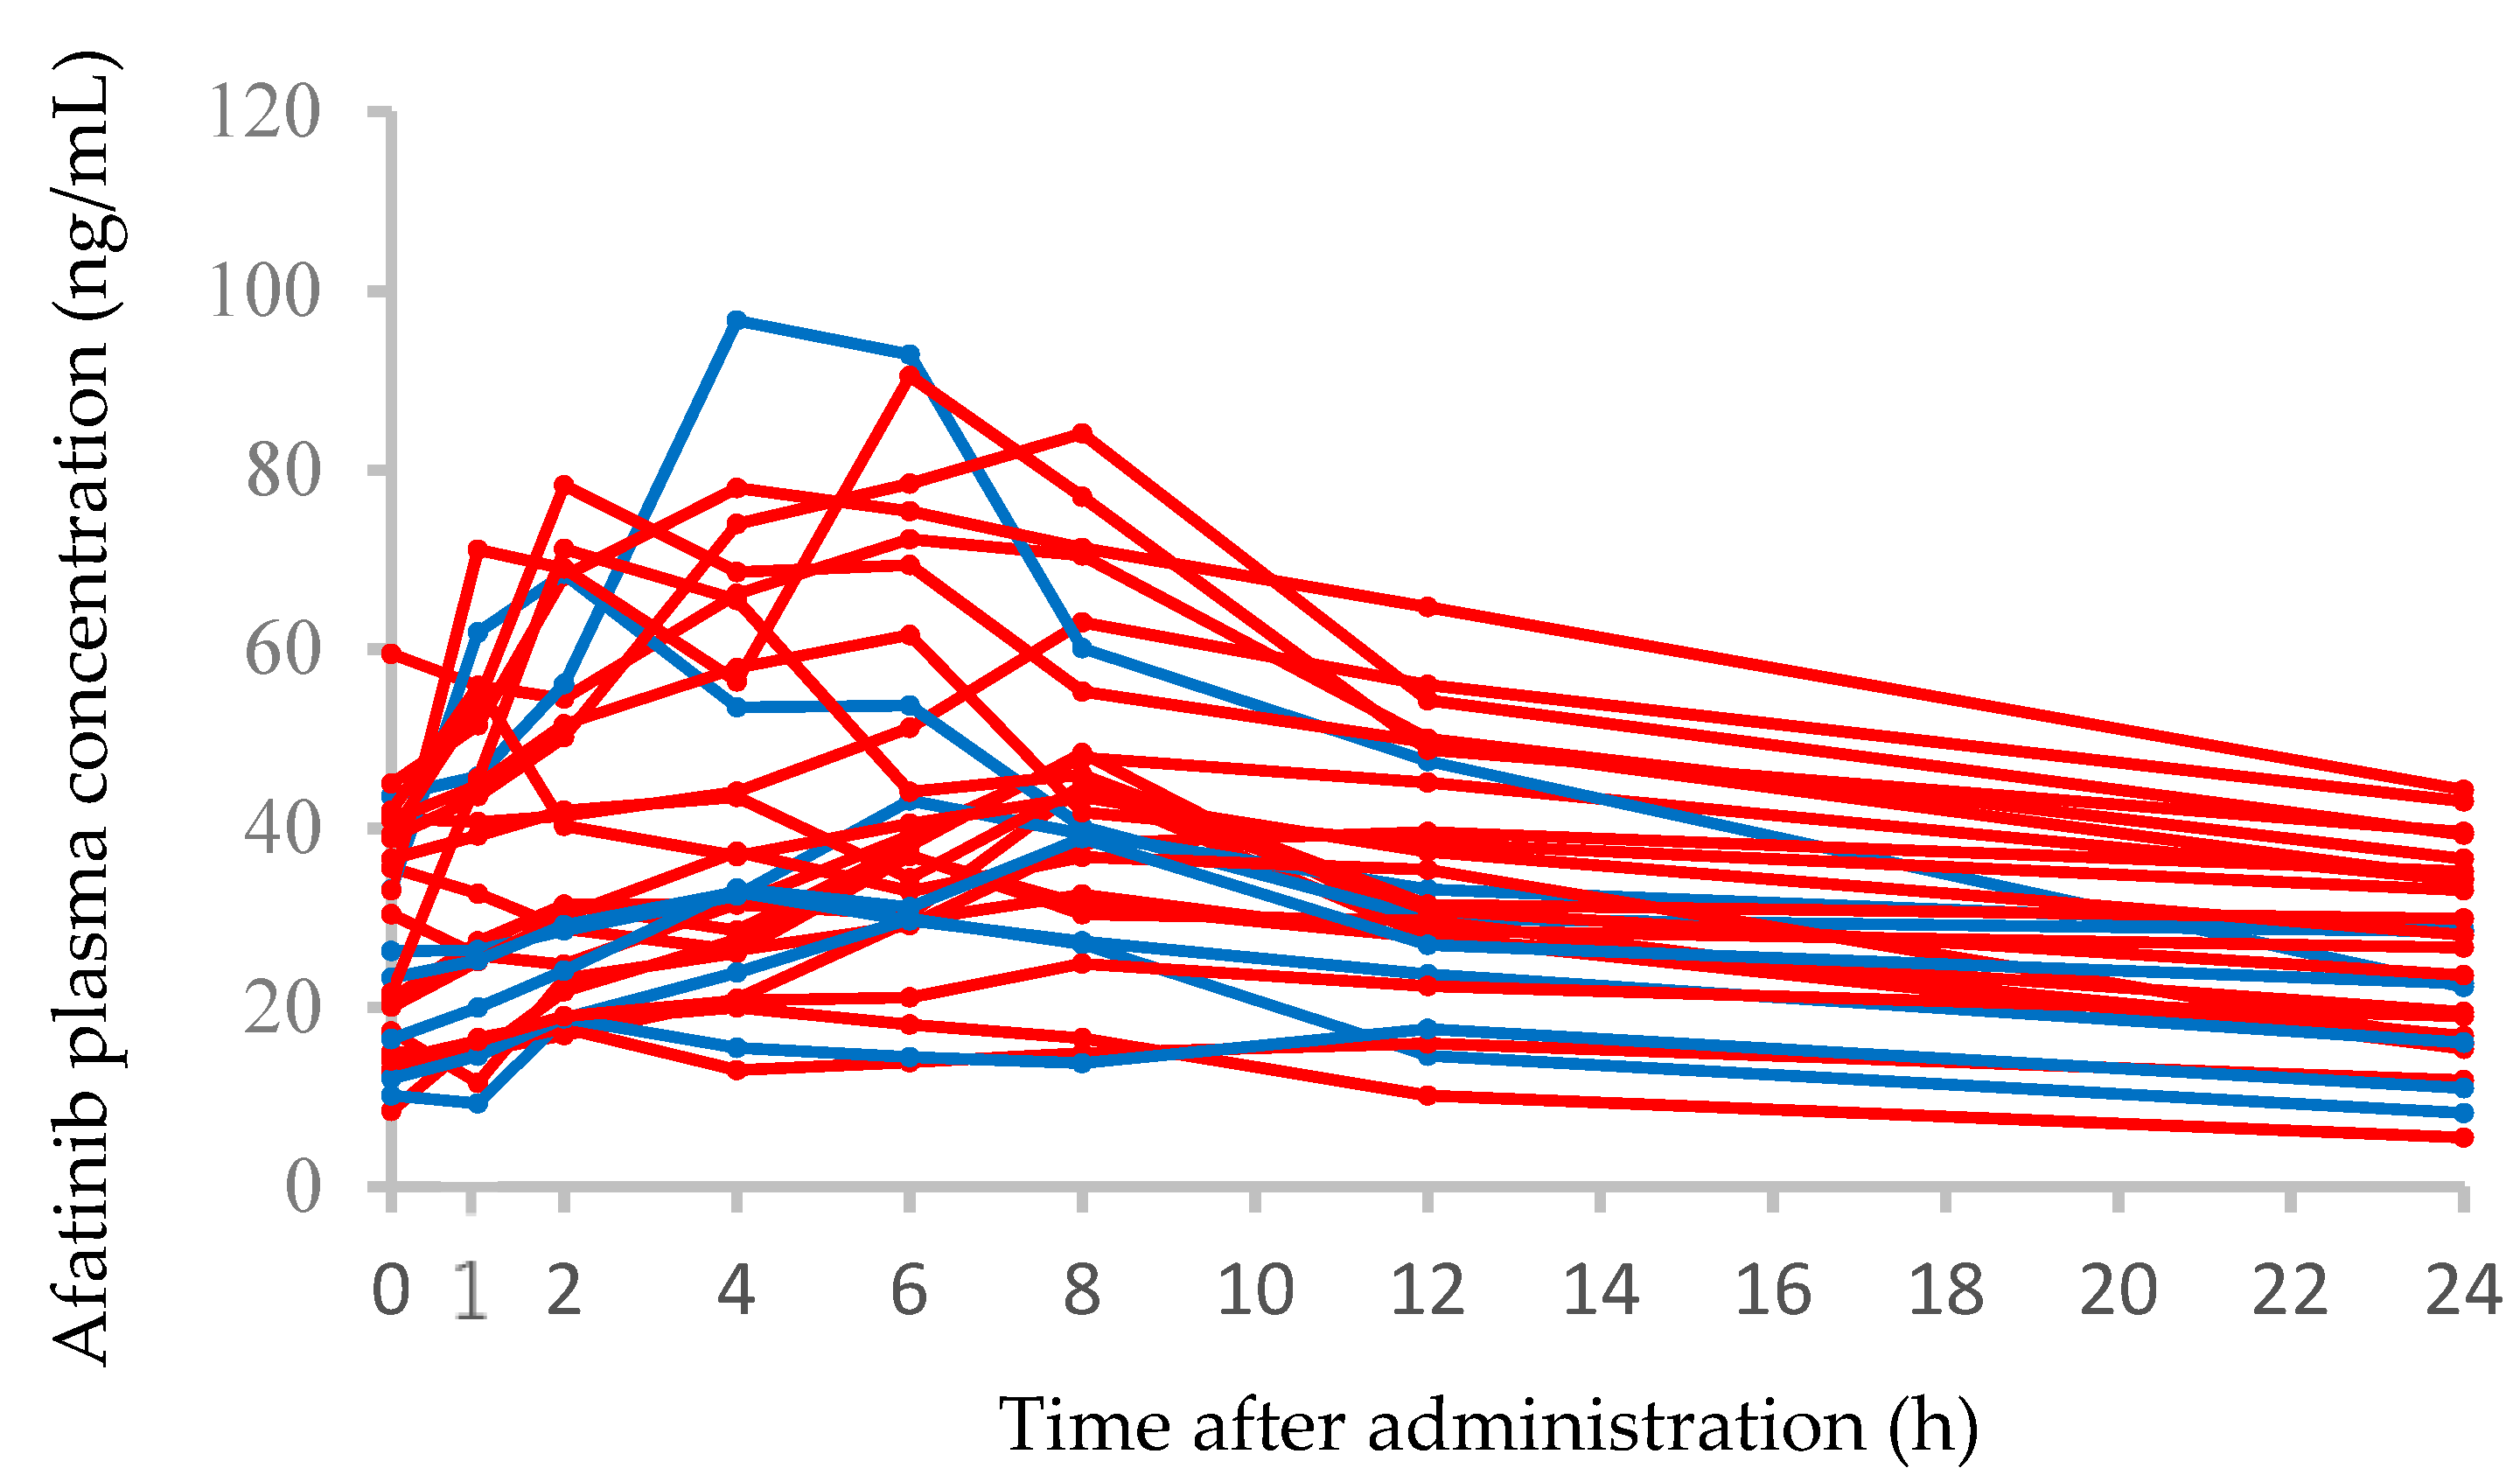
3.2. Afatinib Plasma Concentration–Time Profiles and Correlations between the AUC0–24 and Clinical Characteristics

Plasma concentration–time profiles from 0 to 24 h after the administration of afatinib on day 15 after the beginning of therapy in 28 patients are shown in Figure 1. The median (range) C0, Cmax, and AUC0–24 of afatinib at the steady state on day 15 in seven patients receiving 30 mg/day afatinib therapy were 23.3 (10.2–43.6) ng/mL, 38.9 (18.8–96.7) ng/mL, and 662 (357–1225) ng·h/mL, respectively. In 21 patients receiving 40 mg/day afatinib therapy, the steady-state median (range) C0, Cmax, and AUC0–24 of afatinib were 30.4 (8.5–59.5) ng/mL, 47.9 (17.7–90.5) ng/mL, and 848 (289–1480) ng·h/mL, respectively. There were no significant differences in the C0, Cmax, and AUC0–24 of afatinib between patients receiving 30 and 40 mg/day doses. The interpatient variabilities (coefficients of variation) in afatinib C0 at 30 and 40 mg/day doses were 50.8% and 46.6%, respectively. The correlations between the AUC0–24 of afatinib and clinical characteristics of patients are shown in Table 2; however, there were no significant correlations.

3.3. Comparisons of Afatinib Pharmacokinetic Parameters or Clinical Characteristics between Patients with Grade 2 or Grade 0–1 Diarrhea

Comparisons of the pharmacokinetic parameters of afatinib or clinical characteristics of patients according to diarrhea grade (2 versus 0–1) are shown in Table 3. There were no patients with grade 3 diarrhea. The Cmax, C0, Cmin, AUC0–24, and AUC6–24 of afatinib in patients with grade 2 diarrhea were significantly higher than those in patients with grade 0–1 diarrhea; however, there were no significant differences in the clinical characteristics of patients between the two groups. In addition, there were no significant differences in the Cmax/Cmin ratio and AUC6–24/AUC0–24 ratio, which is the enterohepatic circulation rate, of afatinib between the two groups (Table 3).

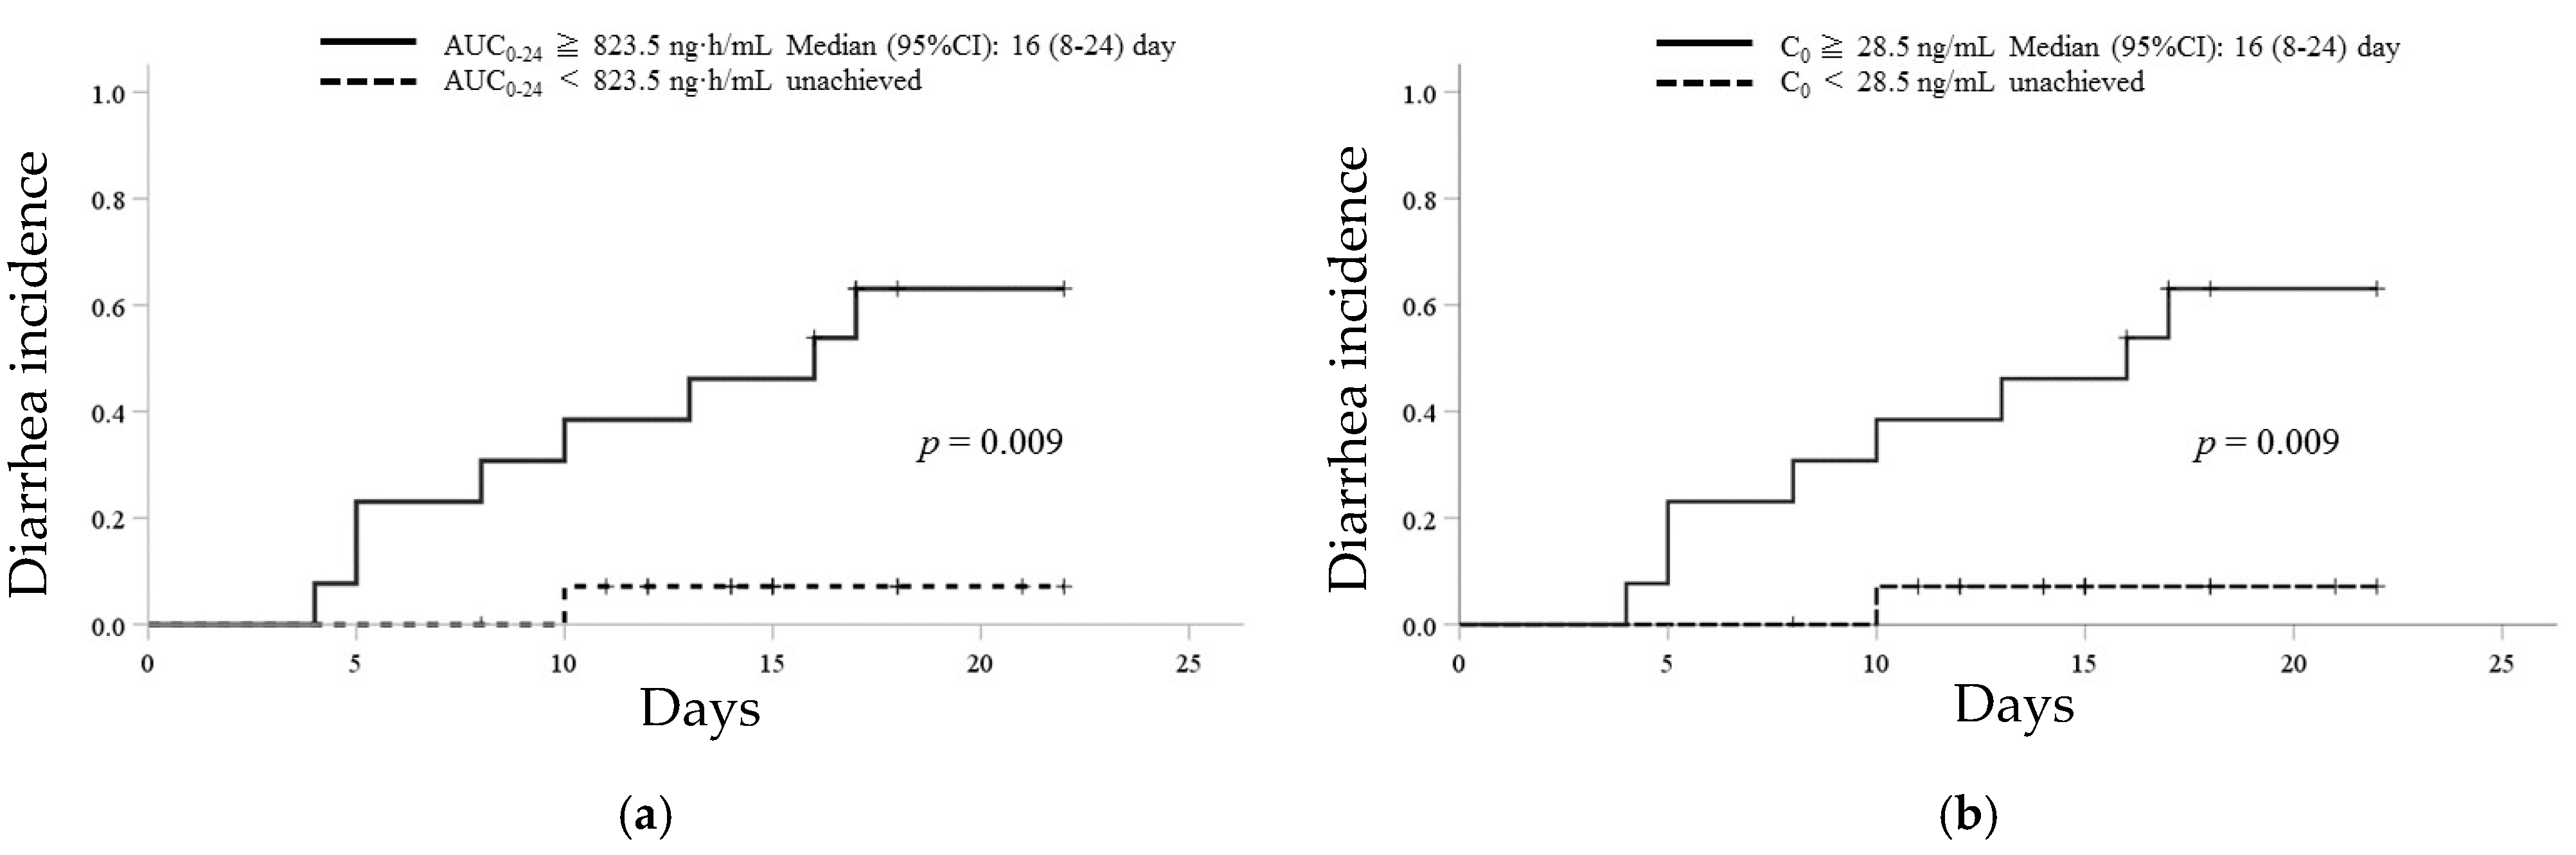
3.4. ROC Analysis and Kaplan–Meier Curves of Afatinib for the Incidence of Grade 2 Diarrhea

ROC analysis showed the discrimination potential of the AUC0–24 or C0 of afatinib for the incidence of grade 2 diarrhea (Figure 2). The areas under the ROC curves were 0.795 with the highest sensitivity (89%) and specificity (74%) at an AUC0–24 threshold of 823.5 ng·h/mL and 0.754 with the highest sensitivity (89%) and specificity (74%) at a C0 threshold of 28.5 ng/mL. Kaplan–Meier analyses for times to the incidence of grade 2 diarrhea based on these cut-off values of AUC0–24 (823.5 ng·h/mL) and C0 (28.5 ng/mL) of afatinib are shown in Figure 3. In patients with an AUC0–24 of greater than or equal to 823.5 ng·h/mL and a C0 of greater than or equal to 28.5 ng/mL, the median (95% CI) time to the incidence of grade 2 diarrhea was 16 (8–24) days. There was a statistically significant difference in the median time to the incidence of grade 2 diarrhea between patients with an AUC0–24 of greater than or equal to 823.5 ng·h/mL and less than 823.5 ng·h/mL or a C0 of greater than or equal to 28.5 ng/mL and less than 28.5 ng/mL (each p = 0.009, Figure 3).

3.5. Prediction Formulae to Estimate the Afatinib AUC0–24

The derived prediction formulae and r2 values for the estimation of the AUC0–24 of afatinib with a single point and with the best two-point combinations are shown in Table 4. Although a significant correlation between the AUC0–24 and C0 of afatinib was observed (r2 = 0.761; p < 0.001), the predicted AUC0–24 of afatinib from the single point of C6 showed the highest correlation with the measured AUC0–24 (predicted AUC0–24 = 14.0 × C6 + 214.6, r2 = 0.840; p < 0.001). In addition, the predicted AUC0–24 of afatinib from the two points of C0 and C6 showed the highest correlation with the measured AUC0–24 (predicted AUC0–24 = 10.6 × C0 + 9.1 × C6 + 135.4, r2 = 0.911; p < 0.001).

4. Discussion

In the current study, the AUC0–24 and C0 of afatinib in patients with grade 2 diarrhea were significantly higher than those in patients with grade 0–1 diarrhea. We found that an afatinib AUC0–24 of greater than or equal to 823.5 ng·h/mL and a C0 of greater than or equal to 28.5 ng/mL may be used as cut-off values for the incidence of afatinib-induced grade 2 diarrhea. In addition, because afatinib C0 is related to AUC0–24, we could use C0 as a marker of therapeutic drug monitoring. Therefore, we monitored afatinib C0 on day 8 after the beginning of therapy to arrive at a steady state [14], and the daily dose of afatinib should be adjusted as an index with a cut-off value of 28.5 ng/mL. In the current study, the median time to the incidence of grade 2 diarrhea in the patients with a C0 of more than 28.5 ng/mL was 16 days. Therefore, we recommend monitoring the C0 of afatinib on day 8 after the beginning of afatinib therapy.
A higher afatinib C0 has been reported to be related to the severity of diarrhea [15]. In a previous study (the LUX-Lung trials) [15], the median C0 values of afatinib in patients with grade 2 or 1 diarrhea following the administration of 40 mg/day afatinib were reported to be 31.6 and 25.2 ng/mL, respectively. In addition, the median AUC0–24 values of afatinib in patients with grade 2 diarrhea in the LUX-Lung trials [14] and our current study were 1320 and 1225 ng·h/mL, respectively. Thus, the results obtained from the current clinical study were similar to the results of the LUX-Lung trials. To date, studies have suggested that female sex, low body weight, and reduced renal function are associated with higher afatinib exposure [23]. However, in an analysis using data pooled from seven clinical studies, the risk factors of afatinib-induced diarrhea were found to be older age, female sex, and low body weight (less than 45 kg) [24]. Therefore, patients with low body weight seem to be at risk of afatinib exposure-dependent diarrhea. Similar to the results of these previous studies [23,24], our current findings also showed that patients with lower body weight tended to have higher afatinib AUC0–24 (p = 0.070) and to develop grade 2 diarrhea (p = 0.085); however, the results were not significant. Therefore, afatinib therapy with a dose escalation strategy by therapeutic drug monitoring based on the target concentration of 28.5 ng/mL from a low dose of 20–30 mg/day for patients with a low body weight may be recommended to enable the administration of continuous treatment without interruption due to diarrhea.
Approximately 85% of afatinib is excreted into the bile as unchanged drug [15]. The biliary secretion of afatinib into the gut may directly induce diarrhea. Therefore, we evaluated the biliary secretion of afatinib using the AUC6–24/AUC0–24 ratio, which is the enterohepatic circulation rate. The results showed that there were no significant differences in the AUC6–24/AUC0–24 ratios of afatinib between patients with grade 2 or grade 0–1 diarrhea. Therefore, afatinib-induced diarrhea does not seem to be caused by the stimulation of the gut via the biliary excretion of afatinib. In addition, there were no significant differences in the Cmax/Cmin ratio, which indicated the rate of absorption of afatinib, between patients with grade 2 and grade 0–1 diarrhea. Non-absorbed afatinib from the gut did not appear to contribute to diarrhea directly. By contrast, afatinib-induced diarrhea has been reported to be caused by the activation of apical membrane chloride (Cl) channels in the intestinal epithelia rather than direct damage to the epithelium [25,26]. Therefore, further studies are necessary to determine the mechanisms mediating the onset of afatinib-induced diarrhea.
Overall, our current findings showed that afatinib exposure, including AUC0–24 and C0, was important for the prediction of grade 2 diarrhea onset.
To the best of our knowledge, no reports have validated an LSS for the prediction of the AUC0–24 of afatinib. Our results showed that C6 was the best single predictor of the AUC0–24 of afatinib, and an equation using samples measured at two specific points (C0 and C6) could best be used to approximate the AUC0–24 of afatinib. However, in outpatients, blood sampling for C6 after the administration of afatinib is difficult. Although the coefficient of determination (r2) between the predicted AUC0–24 of afatinib at the single point of C0 and the measured AUC0–24 was lower than that at the single point of C6 (r2 = 0.761 and 0.840, respectively), the 95% CI of the slopes and intercepts of the formulae obtained by bootstrap analysis also indicated acceptable accuracy and robustness for the prediction of AUC0–24 using the single point of C0. Therefore, the predicted AUC0–24 of afatinib with C0 alone was able to approximate the real AUC0–24. Consequently, the assessment of outpatients using an index of afatinib C0 with a cut-off value of 28.5 ng/mL is also possible. In the LUX-Lung 3 and 6 trials, median progression-free survival was similar between patients who received a reduced dose of afatinib and those who did not [27]. Similarly, in the real-world setting, time to treatment failure and time to progression did not change with the daily afatinib dose [28,29]. Furthermore, in a phase I study of afatinib plus bevacizumab, the recommended dose was set at 30 mg/day [30]. Therefore, it is important to adjust the dose of afatinib without hesitation because such adjustments are unlikely to affect efficacy. Our results can be used as an indicator for dose reduction owing to adverse effects.
Our results should be interpreted within the context of the study limitations. Unfortunately, in the current study, treatment with afatinib for patients with grade 3 diarrhea was halted before blood sampling for afatinib pharmacokinetics on day 15. Therefore, further studies are needed to determine the relationships between afatinib-induced grade 3 diarrhea and afatinib plasma concentrations. After beginning afatinib therapy, we may need to confirm the afatinib C0 at an early time on day 8 after the beginning of therapy to reach a steady state.

5. Conclusions

Afatinib AUC0–24 of greater than or equal to 823.5 ng·h/mL and C0 of greater than or equal to 28.5 ng/mL could be used as cut-off values for the incidence of afatinib-induced grade 2 diarrhea. In addition, because the afatinib C0 was related to AUC0–24, we could use C0 as a marker of therapeutic drug monitoring. Accordingly, we suggest monitoring the afatinib C0 on day 8 after the beginning of therapy to reach a steady state and adjusting the daily dose of afatinib as an index with a cut-off value of 28.5 ng/mL.

Author Contributions

Conceptualization, H.Y., K.S., K.N. and M.M.; methodology, M.M.; investigation, H.Y.; resources, K.S., S.S., Y.O., M.A., M.T. and K.N.; formal analysis, H.Y. and M.M.; writing—original draft preparation, H.Y. and M.M.; writing—review and editing, H.Y. and M.M.; funding acquisition, H.Y. and M.M. All authors have read and agreed to the published version of the manuscript.

Funding

This research was funded by a grant (no. 20K07150 and 21H04217) from the Japan Society for the Promotion of Science, Tokyo, Japan.

Institutional Review Board Statement

This study was conducted according to the guidelines of the Declaration of Helsinki and approved by the Ethics Committee of Akita University School of Medicine (approval no. 790, 16 May 2011).

Informed Consent Statement

Informed consent was obtained from all patients involved in the study.

Data Availability Statement

The data presented in this study are available on reasonable request.

Acknowledgments

This work was supported by a grant (no. 20K07150 and 21H04217) from the Japan Society for the Promotion of Science, Tokyo, Japan.

Conflicts of Interest

The authors declare no conflict of interest.

References

  1. Solca, F.; Dahl, G.; Zoephel, A.; Bader, G.; Sanderson, M.; Klein, C.; Kraemer, O.; Himmelsbach, F.; Haaksma, E.; Adolf, G.R. Target binding properties and cellular activity of afatinib (BIBW 2992), an irreversible ErbB family blocker. J. Pharmacol. Exp. Ther. 2012, 343, 342–350. [Google Scholar] [CrossRef]
  2. Machiels, J.-P.H.; Haddad, R.I.; Fayette, J.; Licitra, L.F.; Tahara, M.; Vermorken, J.B.; Clement, P.M.; Gauler, T.; Cupissol, D.; Grau, J.J.; et al. Afatinib versus methotrexate as second-line treatment in patients with recurrent or metastatic squamous cell carcinoma of the head and neck progressing on or after platinum-based therapy (LUX-Head & Neck 1): An open-label, randomised phase 3 trial. Lancet Oncol. 2015, 16, 583–594. [Google Scholar] [CrossRef]
  3. Yang, J.C.-H.; Shih, J.-Y.; Su, W.-C.; Hsia, T.-C.; Tsai, C.-M.; Ou, S.-H.I.; Yu, C.-J.; Chang, G.-C.; Ho, C.-L.; Sequist, L.V.; et al. Afatinib for patients with lung adenocarcinoma and epidermal growth factor receptor mutations (LUX-Lung 2): A phase 2 trial. Lancet Oncol. 2012, 13, 539–548. [Google Scholar] [CrossRef]
  4. Sequist, L.V.; Yang, J.C.-H.; Yamamoto, N.; O’Byrne, K.; Hirsh, V.; Mok, T.; Geater, S.L.; Orlov, S.; Tsai, C.-M.; Boyer, M.; et al. Phase III study of afatinib or cisplatin plus pemetrexed in patients with metastatic lung adenocarcinoma with EGFR mutations. JCO 2013, 31, 3327–3334. [Google Scholar] [CrossRef] [PubMed] [Green Version]
  5. Katakami, N.; Atagi, S.; Goto, K.; Hida, T.; Horai, T.; Inoue, A.; Ichinose, Y.; Koboyashi, K.; Takeda, K.; Kiura, K.; et al. LUX-Lung 4: A phase II trial of afatinib in patients with advanced non–small-cell lung cancer who progressed during prior treatment with erlotinib, gefitinib, or both. JCO 2013, 31, 3335–3341. [Google Scholar] [CrossRef] [PubMed]
  6. Wu, Y.-L.; Zhou, C.; Hu, C.-P.; Feng, J.; Lu, S.; Huang, Y.; Li, W.; Hou, M.; Shi, J.H.; Lee, K.Y.; et al. Afatinib versus cisplatin plus gemcitabine for first-line treatment of Asian patients with advanced non-small-cell lung cancer harbouring EGFR mutations (LUX-Lung 6): An open-label, randomised phase 3 trial. Lancet Oncol. 2014, 15, 213–222. [Google Scholar] [CrossRef]
  7. Park, K.; Tan, E.-H.; O’Byrne, K.; Zhang, L.; Boyer, M.; Mok, T.; Hirsh, V.; Yang, J.C.-H.; Lee, K.H.; Lu, S.; et al. Afatinib versus gefitinib as first-line treatment of patients with EGFR mutation-positive non-small-cell lung cancer (LUX-Lung 7): A phase 2B, open-label, randomised controlled trial. Lancet Oncol. 2016, 17, 577–589. [Google Scholar] [CrossRef]
  8. Tamura, K.; Nukiwa, T.; Gemma, A.; Yamamoto, N.; Mizushima, M.; Ochai, K.; Ikeda, R.; Azuma, H.; Nakanishi, Y. Real-world treatment of over 1600 Japanese patients with EGFR mutation-positive non-small cell lung cancer with daily afatinib. Int. J. Clin. Oncol. 2019, 24, 917–926. [Google Scholar] [CrossRef] [PubMed] [Green Version]
  9. Kim, Y.; Lee, S.-H.; Ahn, J.S.; Ahn, M.-J.; Park, K.; Sun, J.-M. Efficacy and safety of afatinib for EGFR-mutant non-small cell lung cancer, compared with gefitinib or erlotinib. Cancer Res. Treat. 2018, 51, 502–509. [Google Scholar] [CrossRef]
  10. Takeda, M.; Okamoto, I.; Nakagawa, K. Pooled safety analysis of EGFR-TKI treatment for EGFR mutation-positive non-small cell lung cancer. Lung Cancer 2015, 88, 74–79. [Google Scholar] [CrossRef]
  11. Ding, P.N.; Lord, S.J.; Gebski, V.; Links, M.; Bray, V.; Gralla, R.J.; Yang, J.C.-H.; Lee, C.K. Risk of treatment-related toxicities from EGFR tyrosine kinase inhibitors: A meta-analysis of clinical trials of gefitinib, erlotinib, and afatinib in advanced EGFR-mutated non–small cell lung cancer. J. Thoracic Oncol. 2017, 12, 633–643. [Google Scholar] [CrossRef] [Green Version]
  12. Kato, T.; Yoshioka, H.; Okamoto, I.; Yokoyama, A.; Hida, T.; Seto, T.; Kiura, K.; Massey, D.; Seki, Y.; Yamamoto, N. Afatinib versus cisplatin plus pemetrexed in Japanese patients with advanced non-small cell lung cancer harboring activating EGFR mutations: Subgroup analysis of LUX-Lung 3. Cancer Sci. 2015, 106, 1202–1211. [Google Scholar] [CrossRef] [Green Version]
  13. Yang, J.C.-H.; Reguart, N.; Barinoff, J.; Köhler, J.; Uttenreuther-Fischer, M.; Stammberger, U.; O’Brien, D.; Wolf, J.; Cohen, E.E. Diarrhea associated with afatinib: An oral ErbB family blocker. Expert Rev. Anticancer Ther. 2013, 13, 729–736. [Google Scholar] [CrossRef]
  14. Wind, S.; Schmid, M.; Erhardt, J.; Goeldner, R.-G.; Stopfer, P. Pharmacokinetics of afatinib, a selective irreversible ErbB family blocker, in patients with advanced solid tumours. Clin. Pharmacokinet. 2013, 52, 1101–1109. [Google Scholar] [CrossRef]
  15. Wind, S.; Schnell, D.; Ebner, T.; Freiwald, M.; Stopfer, P. Clinical pharmacokinetics and pharmacodynamics of afatinib. Clin. Pharmacokinet. 2017, 56, 235–250. [Google Scholar] [CrossRef] [Green Version]
  16. Sato, J.; Morikawa, N.; Chiba, R.; Nihei, S.; Moriguchi, S.; Saito, H.; Yamauchi, K.; Kudo, K. Case series on the association between blood levels and side effects of afatinib maleate. Cancer Chemother. Pharmacol. 2017, 80, 545–553. [Google Scholar] [CrossRef] [PubMed]
  17. Hayashi, H.; Iihara, H.; Hirose, C.; Fukuda, Y.; Kitahora, M.; Kaito, D.; Yanase, K.; Endo, J.; Ohno, Y.; Suzuki, A.; et al. Effects of pharmacokinetics-related genetic polymorphisms on the side effect profile of afatinib in patients with non-small cell lung cancer. Lung Cancer 2019, 134, 1–6. [Google Scholar] [CrossRef] [PubMed]
  18. Nakao, K.; Kobuchi, S.; Marutani, S.; Iwazaki, A.; Tamiya, A.; Isa, S.; Okishio, K.; Kanazu, M.; Tamiya, M.; Hirashima, T.; et al. Population pharmacokinetics of afatinib and exposure-safety relationships in Japanese patients with EGFR mutation-positive non-small cell lung cancer. Sci. Rep. 2019, 9, 18202. [Google Scholar] [CrossRef] [PubMed]
  19. Miura, M.; Sato, K.; Miura, H.; Niioka, T.; Kobayashi, H.; Narita, C.; Ito, H. A limited sampling strategy for estimation of the area under the plasma concentration–time curve of gefitinib. Ther. Drug Monitor. 2014, 36, 24–29. [Google Scholar] [CrossRef]
  20. Yokota, H.; Sato, K.; Okuda, Y.; Kobayashi, H.; Takeda, M.; Asano, M.; Ito, H.; Miura, M. Effects of histamine 2-receptor antagonists and proton pump inhibitors on the pharmacokinetics of gefitinib in patients with non-small-cell lung cancer. Clin. Lung Cancer 2017, 18, e433–e439. [Google Scholar] [CrossRef]
  21. Nagahama, M.; Ozeki, T.; Suzuki, A.; Sugino, K.; Niioka, T.; Ito, K.; Miura, M. Association of lenvatinib trough plasma concentrations with lenvatinib-induced toxicities in Japanese patients with thyroid cancer. Med. Oncol. 2019, 36, 39. [Google Scholar] [CrossRef]
  22. Efron, B.; Tibshirani, R.J. An introduction to the bootstrap. Monographs on Statistics and Applied Probability, No. 57. Chapman and Hall, London, 436 p. Monogr. Stat. Appl. Probab. 1993, 57, 436. [Google Scholar]
  23. Freiwald, M.; Schmid, U.; Fleury, A.; Wind, S.; Stopfer, P.; Staab, A. Population pharmacokinetics of afatinib, an irreversible ErbB family blocker, in patients with various solid tumors. Cancer Chemother. Pharmacol. 2014, 73, 759–770. [Google Scholar] [CrossRef] [PubMed]
  24. Hopkins, A.M.; Nguyen, A.-M.; Karapetis, C.S.; Rowland, A.; Sorich, M.J. Risk factors for severe diarrhea with an afatinib treatment of non-small cell lung cancer: A pooled analysis of clinical trials. Cancers 2018, 10, 384. [Google Scholar] [CrossRef] [PubMed] [Green Version]
  25. Duan, T.; Cil, O.; Thiagarajah, J.R.; Verkman, A.S. Intestinal epithelial potassium channels and CFTR chloride channels activated in ErbB tyrosine kinase inhibitor diarrhea. JCI Insight 2019, 4, e126444. [Google Scholar] [CrossRef]
  26. Kim, Y.; Quach, A.; Das, S.; Barrett, K.E. Potentiation of calcium-activated chloride secretion and barrier dysfunction may underlie EGF receptor tyrosine kinase inhibitor-induced diarrhea. Physiol. Rep. 2020, 8, e14490. [Google Scholar] [CrossRef] [PubMed]
  27. Yang, J.C.-H.; Sequist, L.V.; Zhou, C.; Schuler, M.; Geater, S.L.; Mok, T.; Hu, C.-P.; Yamamoto, N.; Feng, J.; O’Byrne, K.; et al. Effect of dose adjustment on the safety and efficacy of afatinib for EGFR mutation-positive lung adenocarcinoma: Post hoc analyses of the randomized LUX-Lung 3 and 6 trials. Ann. Oncol. 2016, 27, 2103–2110. [Google Scholar] [CrossRef] [PubMed]
  28. Halmos, B.; Tan, E.-H.; Soo, R.A.; Cadranel, J.; Lee, M.K.; Foucher, P.; Hsia, T.-C.; Hochmair, M.; Griesinger, F.; Hida, T.; et al. Impact of afatinib dose modification on safety and effectiveness in patients with EGFR mutation-positive advanced NSCLC: Results from a global real-world study (RealGiDo). Lung Cancer 2019, 127, 103–111. [Google Scholar] [CrossRef] [Green Version]
  29. Liu, C.-Y.; Wang, C.-L.; Li, S.-H.; Hsu, P.-C.; Chen, C.-H.; Lin, T.-Y.; Kuo, C.-H.; Fang, Y.-F.; Ko, H.-W.; Yu, C.-T.; et al. The efficacy of 40 mg versus dose de-escalation to less than 40 mg of afatinib (Giotrif) as the first-line therapy for patients with primary lung adenocarcinoma harboring favorable epidermal growth factor mutations. Oncotarget 2017, 8, 97602–97612. [Google Scholar] [CrossRef] [PubMed] [Green Version]
  30. Ko, R.; Shukuya, T.; Imamura, C.K.; Tokito, T.; Shimada, N.; Koyama, R.; Yamada, K.; Ishii, H.; Azuma, K.; Takahashi, K. Phase I study of afatinib plus bevacizumab in patients with advanced non-squamous non-small cell lung cancer harboring EGFR mutations. Transl. Lung Cancer Res. 2021, 10, 183–192. [Google Scholar] [CrossRef] [PubMed]
Figure 1. Plasma concentration–time profiles of afatinib in 28 patients administered afatinib at 30 mg/day (blue solid line) or 40 mg/day (red solid line).
Biology 10 01054 g001
Figure 2. Receiver operator curve (ROC) analysis of the discrimination potential of AUC0–24 (solid line) and C0 (dashed line) of afatinib for the incidence of grade 2 diarrhea.
Biology 10 01054 g002
Figure 3. Kaplan–Meier analysis for time to the incidence of grade 2 diarrhea based on the cut-off values of AUC0–24 (823.5 ng·h/mL) and C0 (28.5 ng/mL) of afatinib. Kaplan–Meier curves for the incidence of grade 2 diarrhea in patients with (a) AUC0–24 of greater than or equal to 823.5 ng·h/mL (solid line) and less than 823.5 ng·h/mL (dotted line) and with (b) C0 of greater than or equal to 28.5 ng/mL (solid line) and less than 28.5 ng/mL (dotted line).
Biology 10 01054 g003
Table 1. Demographic and clinical characteristics of patients prior to afatinib therapy.
CharacteristicsNumber or Values
Total number28
Female:Male13:15
Age, years67.4 ± 7.7(51–86)
Body weight, kg57.3 ± 9.4(35.3–78.3)
Body surface area, m21.59 ± 0.16(1.23–1.93)
Body mass index, kg/m222.7 ± 1.5(19.8–25.8)
Laboratory test values      
   White blood cell, ×103/mm35.7 ± 1.4(3.7–10.4)
   Red blood cell, ×104/mm3422 ± 43(342–498)
   Hemoglobin, g/dL12.6 ± 1.7(8–15)
   Platelets, ×104/mm3238 ± 59(122–366)
   Aspartate aminotransferase, IU/L22.4 ± 5.4(12–39)
   Alanine aminotransferase, IU/L16.9 ± 5.6(8–30)
   Alkaline phosphatase, IU/L314 ± 218(115–1336)
   Lactate dehydrogenase, IU/L219 ± 92(135–601)
   Serum albumin, g/dL3.8 ± 0.4(2.8–4.6)
   Total bilirubin, mg/dL0.5 ± 0.2(0.3–1.1)
   Serum creatinine, mg/dL0.69 ± 0.21(0.43–1.30)
   eGFR, mL/min/1.73 m282.4 ± 21.4(43.6–125.5)
Stage IV:IIIb:IIb26:1:1
Tumor history, adenocarcinoma:other28:0
EGFR mutation, exon 19 deletions:exon 21 L858R:other16:7:5
Initial dose, 30 mg:40 mg7:21
Diarrhea (grade 1:2): no diarrhea23 (14:9):5
Data are presented as number or mean ± standard deviation (range).
Table 2. Comparison and correlations of afatinib AUC0–24 with clinical characteristics of patients.
CharacteristicsMedian AUC024 (Range), ng·h/mLp-Value
   Female848 (574–1480)0.205
   Male753 (289–1366)
Correlation Coefficient (r)p-Value
Age0.0370.850
Body weight−3.4800.070
Body surface area−2.5400.192
BMI−0.0500.799
Laboratory test values      
   White blood cell0.1150.561
   Red blood cell−0.2930.130
   Hemoglobin−0.2890.136
   Platelets−0.1510.444
   Aspartate aminotransferase0.2870.138
   Alanine aminotransferase−0.1710.386
   Alkaline phosphatase−0.3650.056
   Lactate dehydrogenase0.2410.217
   Serum albumin−0.0020.991
   Total bilirubin0.1190.546
   Serum creatinine−0.0700.724
   eGFR−0.1070.587
AUC0–24, area under the plasma concentration–time curve from 0 to 24; eGFR, estimated glomerular filtration rate.
Table 3. Comparison of pharmacokinetics of afatinib and characteristics between patients with grades 2 and 0–1 diarrhea.
Parameters/CharacteristicsGrade 2 DiarrheaGrade 0–1 Diarrheap-Value
Median (Quartile 1–Quartile 3)Median (Quartile 1–Quartile 3)
Cmax (ng/mL)78.0 (47.9–84.1)38.9 (32.8–55.0)0.017
C0 (ng/mL)38.9 (33.1–42.0)21.0 (15.0–29.8)0.032
Cmin (ng/mL)28.1 (24.8–34.4)16.5(14.5–25.0)0.046
Cmax/Cmin ratio2.20 (1.90–2.70)2.20 (1.75–2.45)0.657
AUC024 (ng·h/mL)1225 (891–1344)666 (580–863)0.013
AUC624 (ng·h/mL)787 (672–950)500 (424–592)0.007
AUC624/AUC024 × 100 (%)71.7 (67.8–73.3)73.6 (69.7–75.8)0.389
Daily dose, 30 mg:40 mg1:86:130.249
Female:male6:37:120.142
Age, years65.0 (62.0–71.0)67.0 (63.5–73.5)0.693
Body weight, kg50.5 (46.7–56.0)56.2 (53.2–64.3)0.085
Body surface area, m21.54 (1.41–1.57)1.60 (1.54–1.73)0.109
BMI, kg/m222.9 (22.8–23.3)23.0 (21.3–23.4)0.694
Laboratory test values          
   White blood cell, ×103/mm35.3 (4.0–6.9)5.4 (4.1–6.0)0.825
   Red blood cell, ×104/mm3405 (384–430)413 (372–455)0.640
   Hemoglobin, g/dL12.1 (11.5–12.4)12.5 (11.5–13.6)0.403
   Platelets, ×104/mm321.4 (16.6–23.1)23.7 (20.6–27.2)0.210
   Aspartate aminotransferase, IU/L21 (18–22)19 (18–28)0.730
   Alanine aminotransferase, IU/L15 (11–28)18 (14–25)0.362
   Alkaline phosphatase, IU/L241 (211–419)261 (226–290)0.825
   Lactate dehydrogenase, IU/L174 (156–191)176 (160–217)0.980
   Serum albumin, g/dL3.4 (3.3–3.6)3.7 (3.4–3.9)0.311
   Total bilirubin, mg/dL0.5 (0.4–0.7)0.5 (0.4–0.6)0.439
   Serum creatinine, mg/dL0.67 (0.56–0.70)0.74 (0.66–0.85)0.110
   eGFR, mL/min/1.73 m278.5 (62.3–97.3)74.1 (65.9–82.6)0.539
Data are presented as number or median (quartile 1–quartile 3). Cmax, maximum plasma concentration; C0, pre-dose concentration; Cmin, minimum plasma concentration; AUC0–24 and 6–24, area under the plasma concentration–time curve from 0 to 24 h and 6 to 24 h, respectively; eGFR, estimated glomerular filtration rate.
Table 4. The prediction formulae derived using the multiple linear regression approach to estimate the AUC0–24 of afatinib.
Sampling NumbersSampling Time (h)Prediction Formula for AUC0–24Predicted versus Observed AUC0–24SlopeIntercept 95% CI *p *
r2p95% CI *p *
One-point022.3× C0 + 215.90.761<0.00117.7 to 28.60.00185.5 to 331.20.005
   116.4 × C1 + 286.10.712<0.00112.2 to 21.80.001143.7 to 411.00.001
   214.5 × C2 + 276.90.691<0.00110.6 to 19.70.001110.3 to 433.10.012
   413.7 × C4 + 263.40.762<0.00110.5 to 18.00.001112.1 to 410.00.007
   614.0 × C6 + 214.60.840<0.00111.4 to 17.30.00181.7 to 334.60.004
   817.5 × C8 + 75.90.899<0.00115.6 to 20.10.001−25.0 to 159.60.108
   1223.8 × C12 + 11.90.916<0.00121.6 to 26.70.001−75.2 to 84.70.770
Two-points †010.6 × C0 + 9.1 × C6 + 135.40.911<0.0016.1 to 16.50.00338.8 to 228.50.022
6 5.6 to 12.30.001
AUC0–24, area under the plasma concentration–time curve from 0 to 24 h; Cn, plasma concentration at n h after afatinib administration. * Calculated using the bootstrap method. † Best sampling point.
Publisher’s Note: MDPI stays neutral with regard to jurisdictional claims in published maps and institutional affiliations.

