Article

A Systematic Survey and Characterization of Enhancers that Regulate Sox3 in Neuro-Sensory Development in Comparison with Sox2 Enhancers

Graduate School of Frontier Biosciences, Osaka University, 1-3 Yamadaoka, Suita, Osaka 565-0871, Japan
*
Authors to whom correspondence should be addressed.
Biology 2012, 1(3), 714-735; https://doi.org/10.3390/biology1030714
Submission received: 17 October 2012 / Revised: 6 November 2012 / Accepted: 9 November 2012 / Published: 22 November 2012
(This article belongs to the Special Issue Gene Expression and Regulation)

Abstract

:
Development of neural and sensory primordia at the early stages of embryogenesis depends on the activity of two B1 Sox transcription factors, Sox2 and Sox3. The embryonic expression patterns of the Sox2 and Sox3 genes are similar, yet they show gene-unique features. We screened for enhancers of the 231-kb genomic region encompassing Sox3 of chicken, and identified 13 new enhancers that showed activity in different domains of the neuro-sensory primordia. Combined with the three Sox3-proximal enhancers determined previously, at least 16 enhancers were involved in Sox3 regulation. Starting from the NP1 enhancer, more enhancers with different specificities are activated in sequence, resulting in complex overlapping patterns of enhancer activities. NP1 was activated in the caudal lateral epiblast adjacent to the posterior growing end of neural plate, and by the combined action of Wnt and Fgf signaling, similar to the Sox2 N1 enhancer involved in neural/mesodermal dichotomous cell lineage segregation. The Sox3 D5 enhancer and Sox2 N3 enhancer were also activated similarly in the diencephalon, optic vesicle and lens placode, suggesting analogies in their regulation. In general, however, the specificities of the enhancers were not identical between Sox3 and Sox2, including the cases of the NP1 and D5 enhancers.

1. Introduction

Group B1 Sox genes, Sox1, Sox2 and Sox3, encode HMG-domain transcription factors that show almost identical activity in the activation of target genes in transactivation assays [1,2,3], which is consistent with the model of their derivation from the same ancestral gene as a consequence of genome duplications [4]. In embryos, these B1 Sox factors regulate neuro-sensory development [5] in a functionally redundant manner when their expression overlaps in tissue. In most vertebrate species, the expression of Sox2 and Sox3, which are activated in the early stages of embryogenesis, occurs prominently in the epiblast and neuro-sensory primordia [5,6,7,8,9,10,11,12,13]. In contrast, Sox1 is activated at much later stages than Sox2 and Sox3 [5,6,7,14,15].
The most compelling evidence for the redundant functions and resulting functional compensation among B1 Sox genes has been provided by a study using zebrafish, where the developmental defects became evident only when activities of all B1 Sox genes expressed at early stages were downregulated [16]. In mouse embryos, the functional compensation between Sox2 and Sox3 has been indicated by the occurrence of embryonic lethality from Sox2+/-; Sox3-/- compound mutations, despite the viability of the Sox2+/- and Sox3-/- animals [17]. In addition, Sox3 activity compensates for the loss of Sox2 expression in the epiblast of post-gastrulation embryos [18].
The consequence of sharing of functions among the B1 Sox genes is that the targeted disruption of Sox1, Sox2 or Sox3 resulted in defective phenotypes only in the specific organs uniquely expressing these transcription factors. Sox1-mutant mice show abnormal lenses [19] and ventral striatum [20]. Sox2-mutant embryos die around the implantation stage, because Sox2 is the only B1 Sox expressed at that stage [21]. Sox3-deficient embryos specifically develop abnormalities in the pituitary gland [22], gonad [23], and pharyngeal arch morphogenesis [17].
Functional dominance between Sox2 and Sox3 depends on the animal species. In amniotes, e.g., human, mouse and chicken, Sox2 expression covers the entire neural primordia, and it is considered the lead transcription factor gene in primordial neural cells [24,25]. However, in lower vertebrates, Sox3 expression is more prevalent in the neural primordia than Sox2 expression [8,9,12,26], suggesting an evolutionary shift in the major regulatory processes in early neurogenesis from Sox3-centered regulation to Sox2-centered regulation in order to fulfill the equivalent B1 Sox functions [4]. Although the expression domains of Sox2 and Sox3 overlap extensively, their expression patterns are not identical, indicating differences in the regulation of these two B1 Sox genes. However, the regulation of Sox2 and Sox3 must be coordinated in the developmental processes that depend on the overall B1 Sox activity level.
Therefore, the regulation of the Sox2 and Sox3 genes is essential for the proper development of neural and sensory tissues. We previously identified more than 20 enhancers that are distributed in a 200-kb genomic region encompassing the Sox2 gene [27,28]. Each of these Sox2 enhancers was regulated in a unique manner, reflecting particular mechanisms that operate in specific tissues and/or at specific stages of neuro-sensory development [3,18,29,30]. Many of these enhancers are conserved in DNA sequences across vertebrate species [4,18,27,28], indicating strong conservation of the mechanisms of tissue regulation involving Sox2 function. The N2 enhancer, which is responsible for Sox2 activation in the epiblast and early anterior neural plate, is regulated by Zic, Pou and Otx factors [18,31]. In contrast, the Sox2 N1 enhancer of Sox2 is activated in the caudal lateral epiblast adjacent to the primitive streak. Axial stem cells, which are bipotential precursors for the neural plate and the paraxial mesoderm, reside in the caudal lateral epiblast [32], and produce neural and mesodermal cells, depending on whether Sox2 or Tbx6 is activated [33]. In addition, it has been shown that both axial stem cell maintenance and N1 enhancer activation depend on Wnt and Fgf signals [29,32,33,34].
In this study, we report a systematic survey and characterization of the enhancers that regulate the Sox3 gene in neuro-sensory development. Many enhancers were found in the 231-kb span of the Sox3-encompassing chicken genomic region, as was the case for Sox2 enhancers. In some cases, the enhancers were similarly regulated between the Sox3 and Sox2 genes. However, the varieties of enhancer specificities in spatial and temporal terms were substantially different between these genes. The Sox3 NP1 enhancer that was activated in the caudal lateral epiblast was analyzed in detail because of its similarity to the Sox2 N1 enhancer. The Sox3 NP1 enhancer was found to be regulated by Wnt and Fgf signals, similar to the Sox2 N1 enhancer, which is consistent with the essential involvement of Wnt and Fgf signaling in axial stem cell regulation [32].
A previous study using transgenic mouse embryos identified three putative enhancers within the genomic span, 3 kb upstream and downstream of the Sox3 gene, which directs gene expression in distinct domains of the neural primordia [35]. In addition, an analogous Sox3-proximal DNA sequence of Xenopus laevis can reproduce a part of the Sox3 expression patterns in transgenic frogs [12]. Our present study screened a wider genomic region and found more varieties of enhancers that regulate the Sox3 gene in neuro-sensory development.

2. Results

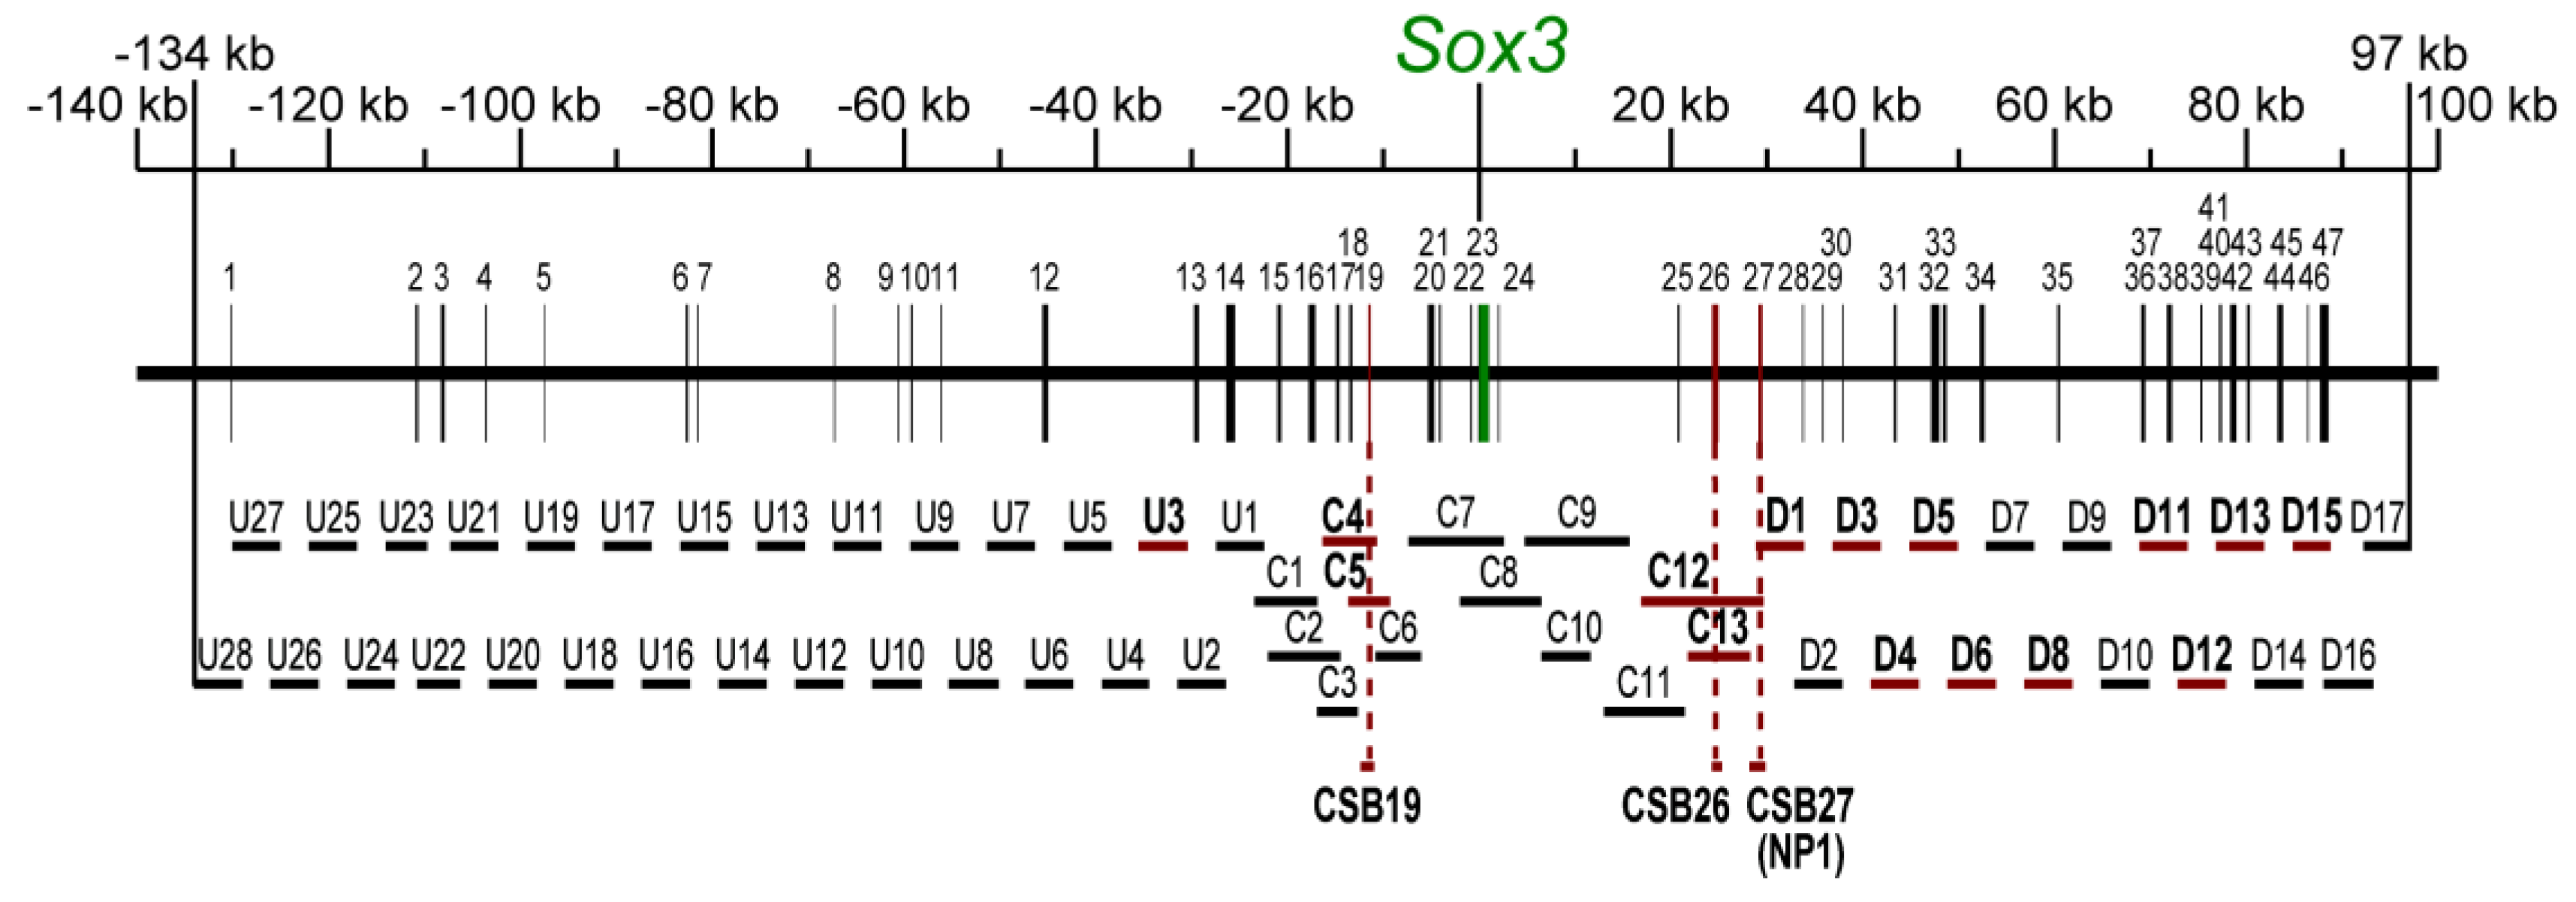
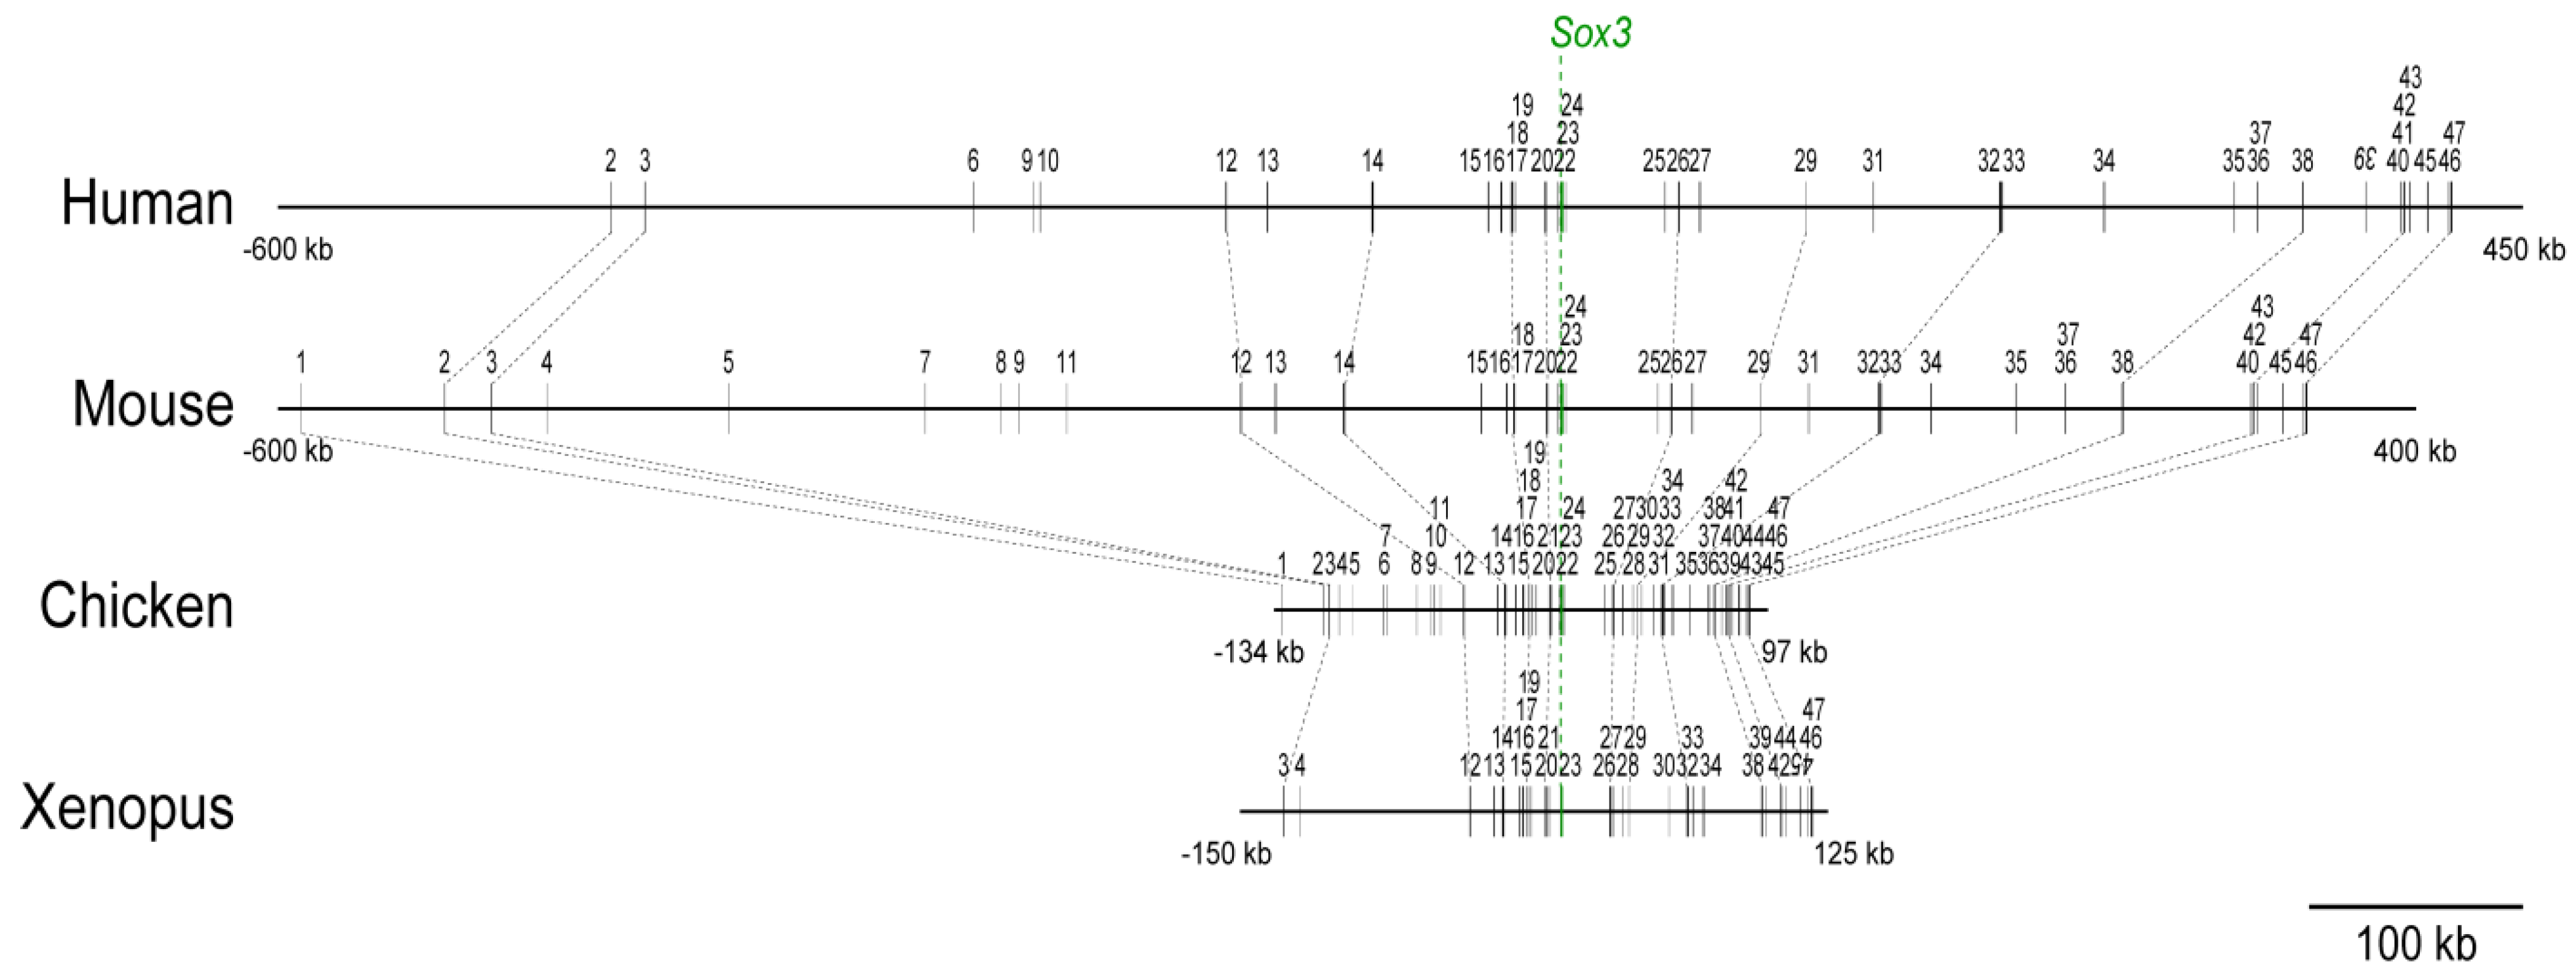
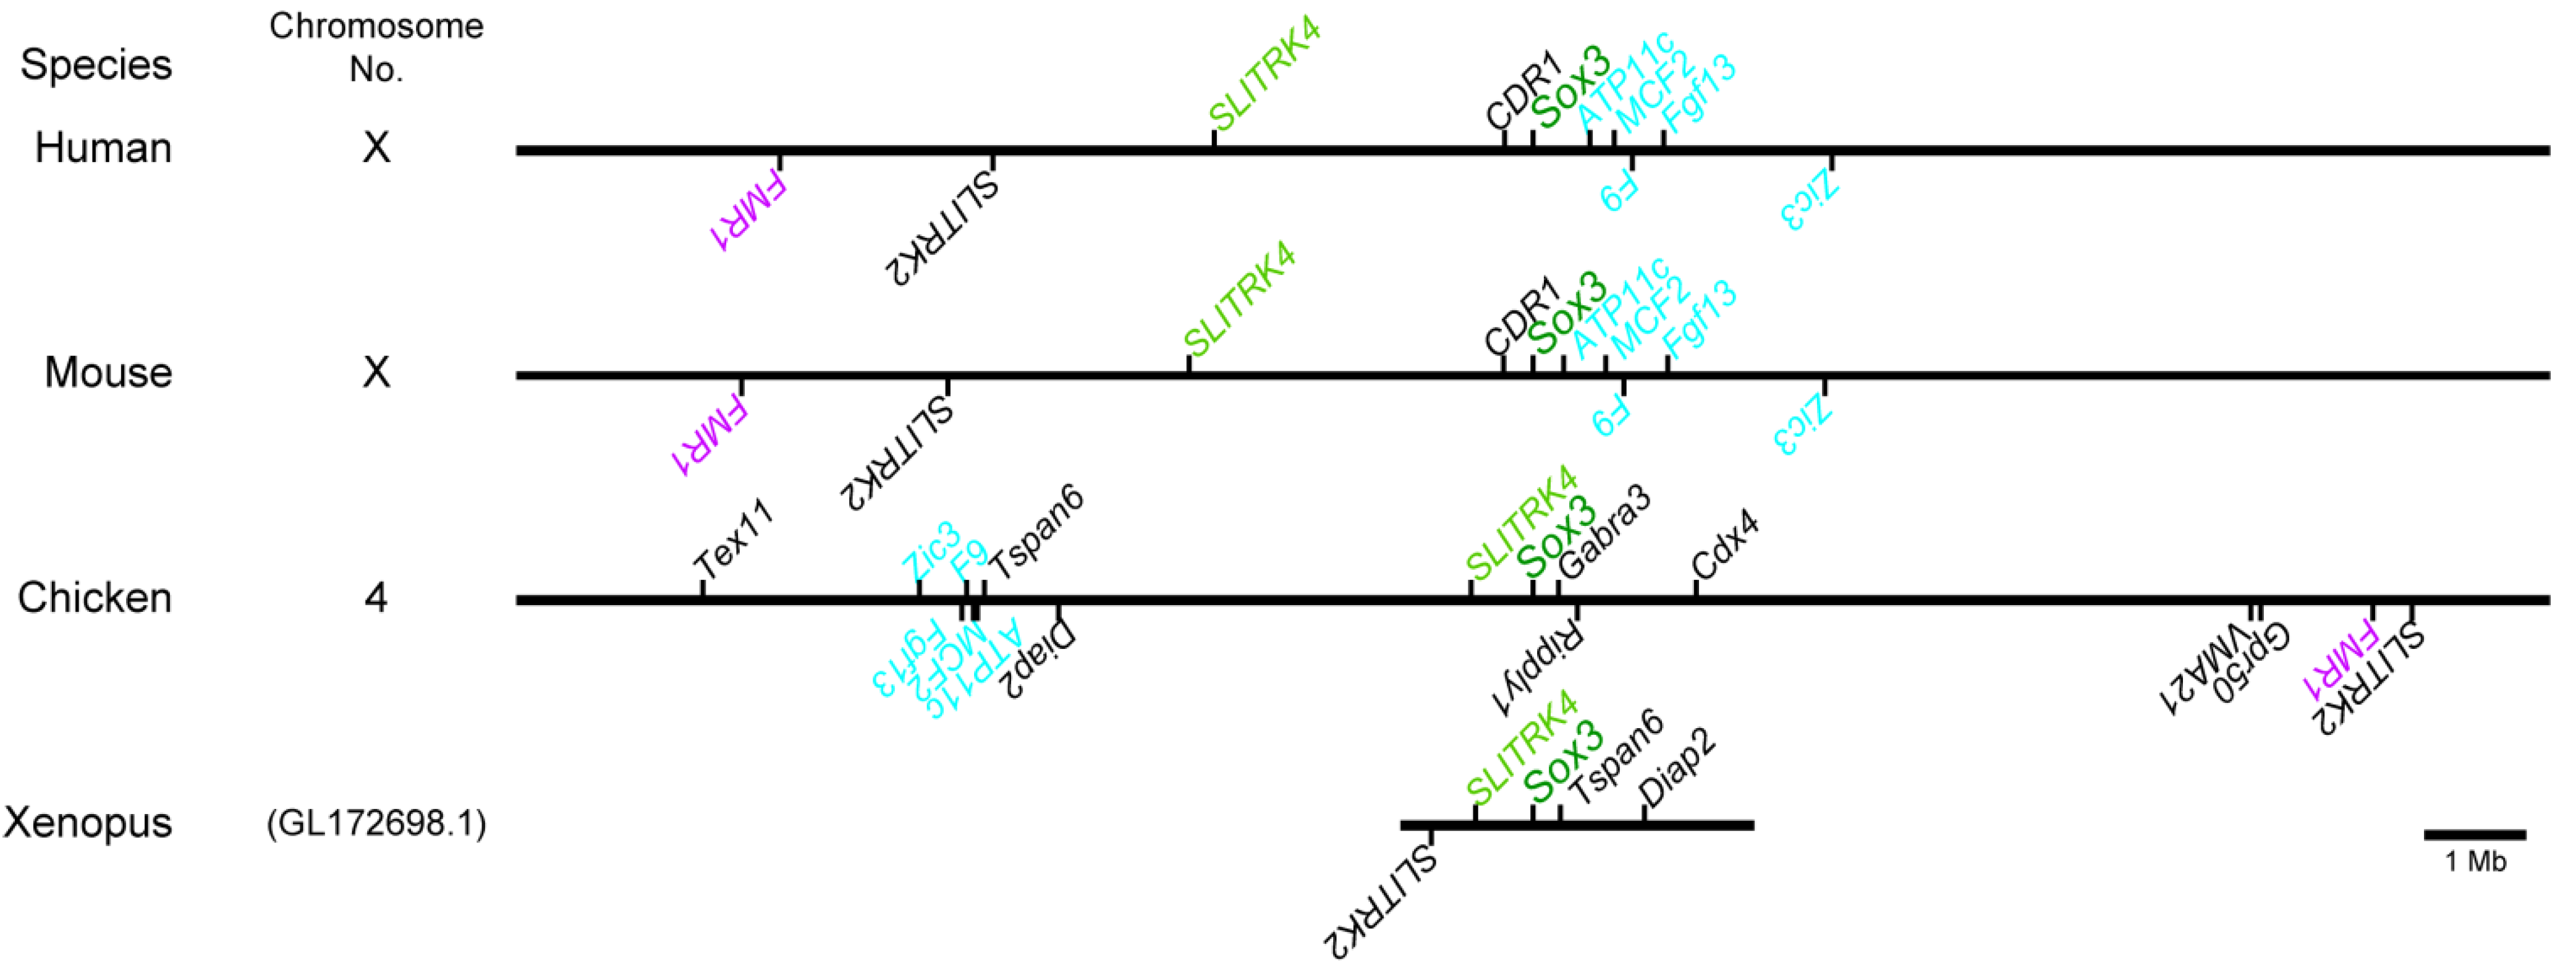
2.1. Distribution of the Conserved Sequence Blocks (CSBs) in the Region Surrounding the Sox3 Gene Locus in Various Vertebrate Species

The Sox3 gene is located on the X-chromosome in mammals, but it is autosomal in other vertebrate species. It is located on chromosome 4 in chicken, on scaffold GL172698.1 (without chromosomal assignment) in Xenopus tropicalis, on chromosome 14 in zebrafish, and on chromosome 10 in medaka (Figure S1). As the majority of enhancer sequences are included in the sequence blocks that are strongly conserved across the species (>60% DNA sequence identity over a length of 100 bp) [27], we compared the distribution of CSBs. As shown in Figure 1 and Table S1, many sequence blocks conserved between chicken and mammals and/or between chicken and Xenopus were identified both upstream and downstream of the Sox3 gene. In fish genomes, a fraction of the blocks were identified, but the degrees of sequence conservation were generally low (data not shown). CSBs present in the chicken genome were numbered from 1 to 47. These blocks were located in the region that was between 134 kb upstream and 97 kb downstream relative to the Sox3 open reading frame (ORF) start site (231 kb total), whereas in mammalian genomes the same conserved sequences were distributed in wider regions (940 kb in the mouse and 1.4 Mb in the human). Upstream CSBs from block 1 to 11 tend to be shorter (average 163 bp) compared to the entire CSBs (average 309 bp, excluding ~1 kb block 23 that included Sox3 ORF). However, downstream of block 47, no CSBs were found between chicken and other animal species. From these observations, the 231-kb span of the chicken genome encompassing the Sox3 gene was subjected to an enhancer survey.
Figure 1. Comparison of the genome sequence organization of the Sox3-encompassing regions of human, mouse, chicken and Xenopus. The arrangement of the conserved sequence blocks (CSBs) that were numbered 1 to 47 in the region, between 134 kb upstream and 97 kb downstream, of the chicken Sox3 gene. A CSB is defined as a sequence that shows >60% base identity compared with the chicken genome of more than a 100 bp sequence. The corresponding CSBs in different genomes bear the same numbers as in the chicken. The spacing between CSBs are similar for chicken and Xenopus genomes, but are widened in mammalian genomes. Human CSB1 positioned at -970 kb is not included in this Figure. Downstream, the correspondence between the mammalian and chicken sequences is lost beyond CSB47. The genomic coordinates of the CSBs in each genome are given in Table S1.
Biology 01 00714 g001

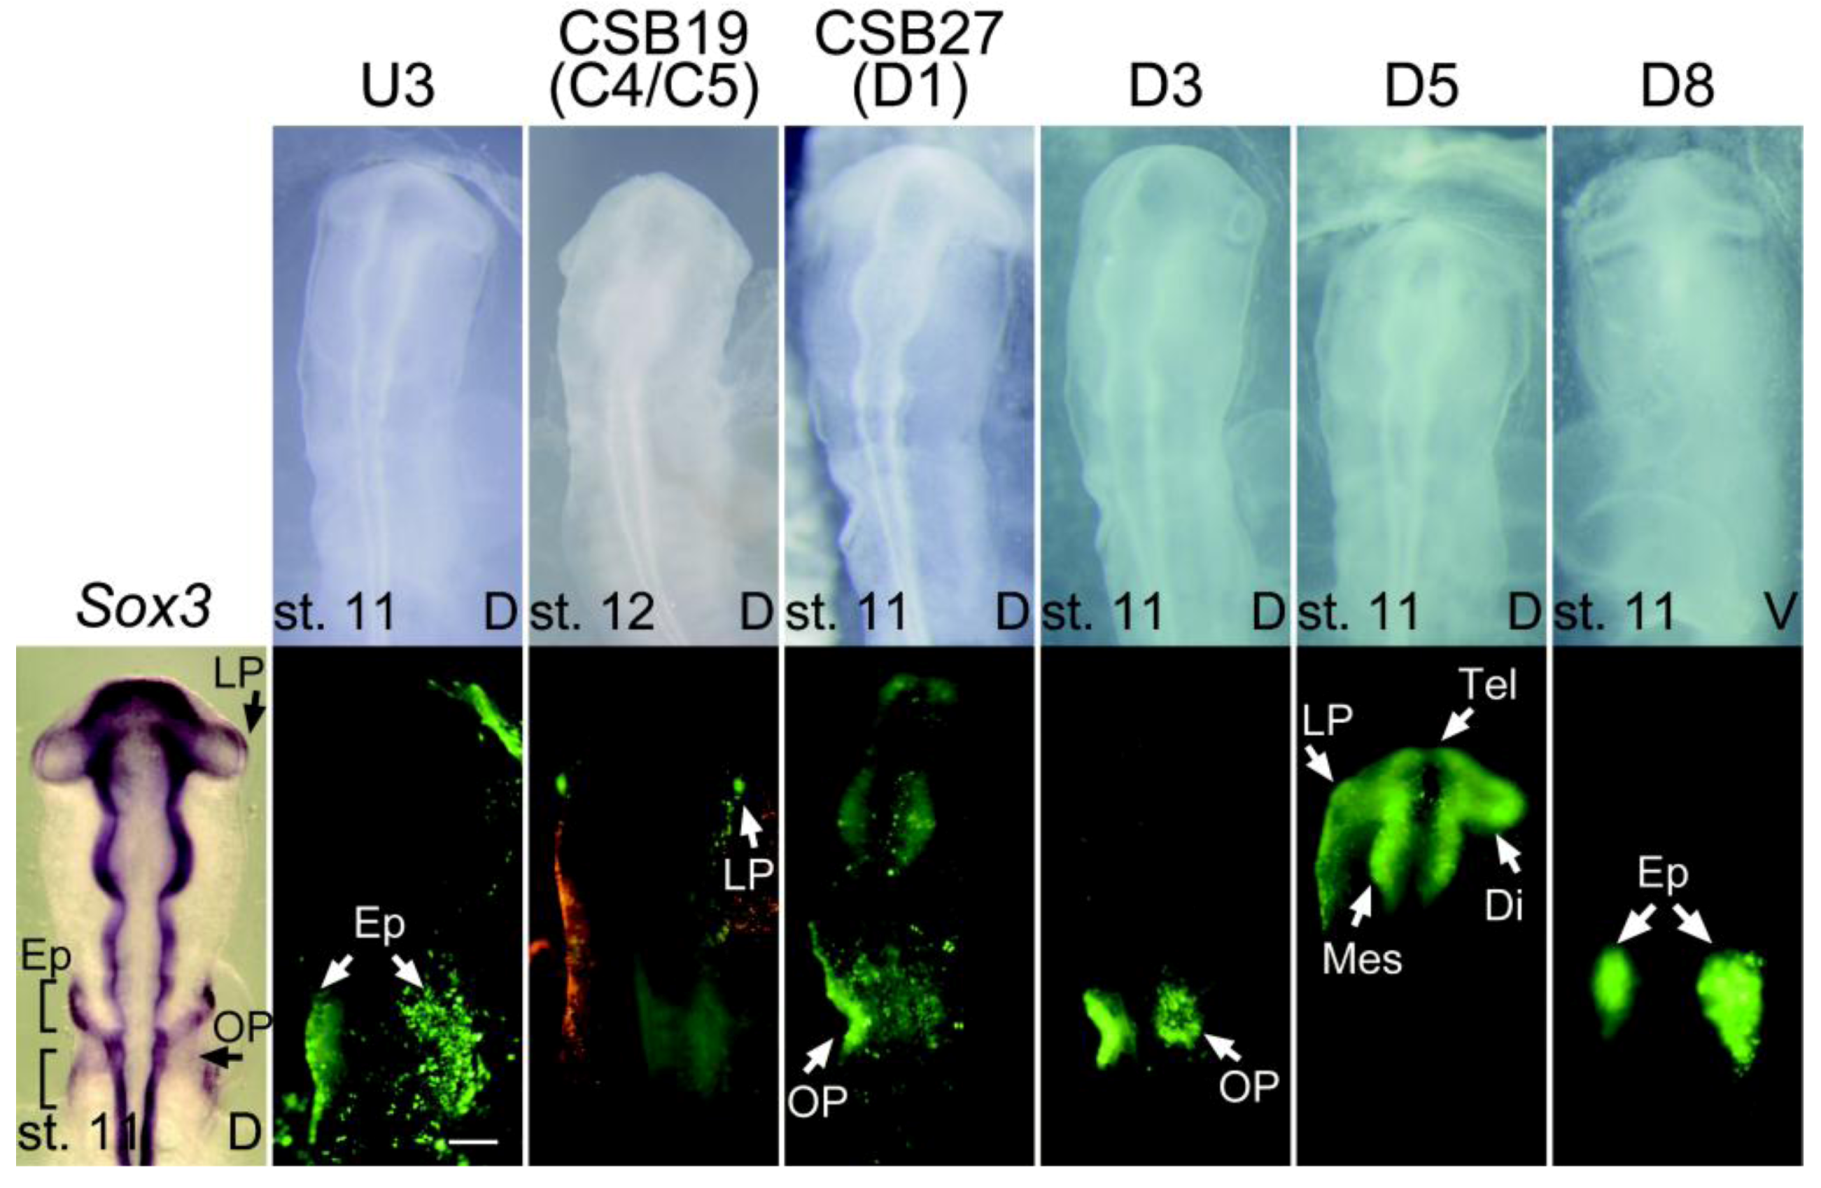
2.2. Screening for Enhancer Sequences and Their Characterization

We utilized the tkEGFP vector which by itself does not express EGFP upon electroporation in chicken embryos but expresses EGFP in a tissue-specific manner when an enhancer-bearing genomic fragment is inserted [27,36]. We initially analyzed the Sox3-proximal 50 kb region using bacteriophage clones derived from a chicken genome library. The overlapping DNA fragments C1 to C13 were prepared (Figure 2), inserted into the tkEGFP vector, and assessed for enhancer activities. Two regions of the genomic sequence exhibited enhancer activities: C4/5 in the st. 11 lens, and C12/13 in st. 11 diencephalon and spinal cord (Figure 3 and Figure 4, Table S2). The C12 sequence and the C13 sequence included in C12 exhibited identical enhancer activity. The C4/5 sequence included three CSBs (17, 18 and 19). The cloning of individual CSBs indicated that the CSB19 sequence was responsible for the lens enhancer activity of C4/5. The CSB26 sequence included in the C12 sequence exhibited enhancer activity in the diencephalon and spinal cord, which was identical to the activity of the C12 sequence.
Figure 2. DNA sequences derived from the Sox3-encompassing genome region of the chicken and their analysis for enhancer activities. Distribution of CSBs 1-47 (black bars) upstream and downstream of the Sox3 gene. CSB23 includes the Sox3 open reading frame (ORF). The sequences of the central region, C1-C13, were derived from bacteriophage clones. The ~5 kb sequences that were upstream (U1 to U28) and downstream (D1 to D 17) with 1-kb terminal overlaps were derived from BAC clones. The DNA sequences indicated by red horizontal bars exhibited enhancer activity. CSBs 19, 26 and 27 that showed the same activity as the original DNA sequences are marked by red vertical bars. The nucleotide positions of these sequences and the statistics of the enhancer analysis are presented in Table S2.
Biology 01 00714 g002
Figure 3. Enhancer activities in placode derivatives of the Sox3-flanking sequences or CSBs in electroporated chicken embryos at st. 11-12, as indicated by the EGFP expression, in comparison with Sox3 in situ hybridization (left). Top: Bright-field images with indication of developmental stages. V, ventral view; D, dorsal view. Bottom: EGFP fluorescence images of the same field. The bars indicate 200 μm. Di, diencephalon; Ep, epibranchial placode; LP, lens placode; Mes, mesencephalon; OP, otic placode; Rho, rhombencephalon; Tel, telencephalon.
Biology 01 00714 g003
These enhancers accounted for only subdomains of Sox3 expression in embryos. Therefore, we extended the region of the enhancer survey to a 231-kb genomic span. We identified two BAC clones that covered the upstream and downstream regions of the central 50-kb region. We prepared a series of ~5 kb DNA sequences that spanned the upstream and downstream regions with 1 kb terminal overlaps, resulting in 28 upstream sequences (U1–U28) and 17 downstream sequences (D1–D17) that were external to the central 50-kb sequence (Figure 2), and examined their enhancer activities. The number of electroporated specimens for each DNA sequence is indicated in Table S2, where the same specificity of an enhancer was reproducibly demonstrated.
Figure 4. Sequential activation of Sox3 enhancers that show distinct tissue specificities in the neural primordia. The D1 activity was represented by the NP1 enhancer sequence (see also Figure 5C). The top row: Sox3 in situ hybridization patterns in chicken embryos at respective developmental stages. Other rows, EGFP expression reflecting the specificity of the enhancers in comparison with the bright-field image of the same embryo. The data of an enhancer at different developmental stages was taken from the same embryo. V, ventral view; D, dorsal view. The white triangles indicate the positions of Hensen’s node. All photographs are shown on the same scale. The bar indicates 500 μm. Di, diencephalon; Mes, mesencephalon; Rho, rhombencephalon; SC, spinal cord; Tel, telencephalon.
Biology 01 00714 g004
In the upstream region, we identified only one sequence, U3, which showed enhancer activity in the epibranchial placode region at st. 11. However, in the downstream 97 kb region, ten sequences showed enhancer activities of various tissue specificities (Figure 3 and Figure 4, Table S2). The U3, D1, D3, D5 and D8 sequences showed enhancer activities in placode derivatives (Figure 3). The D3 sequence showed an otic placode-specific enhancer activity, while the D8 sequence displayed an epibranchial placode-specific activity that was similar to the aforementioned U3 enhancer. Other placodal enhancers also showed enhancer activity in the CNS as well.The D1, D4, D5, D6, D11, D12, D13 and D15 sequences showed enhancer activities in various portions of the developing CNS (Figure 4). The enhancer activity of the D1 sequence was of particular interest because of its strong activity in the caudal lateral epiblast, which is similar to the Sox2 N1 enhancer [27,29]. The D1 enhancer had additional activity in the posterior neural plate that forms the rhombencephalon and spinal cord. The D1 sequence included CSB27, and the isolated CSB27 sequence alone displayed the same activity (see Figure 5C, below). This CSB enhancer was renamed NP1 and analyzed further. The sequence D5 enhancer showed activity in the CNS anterior to the rhombencephalon and in the lens placode, indicating a resemblance to the N3 enhancer of Sox2.

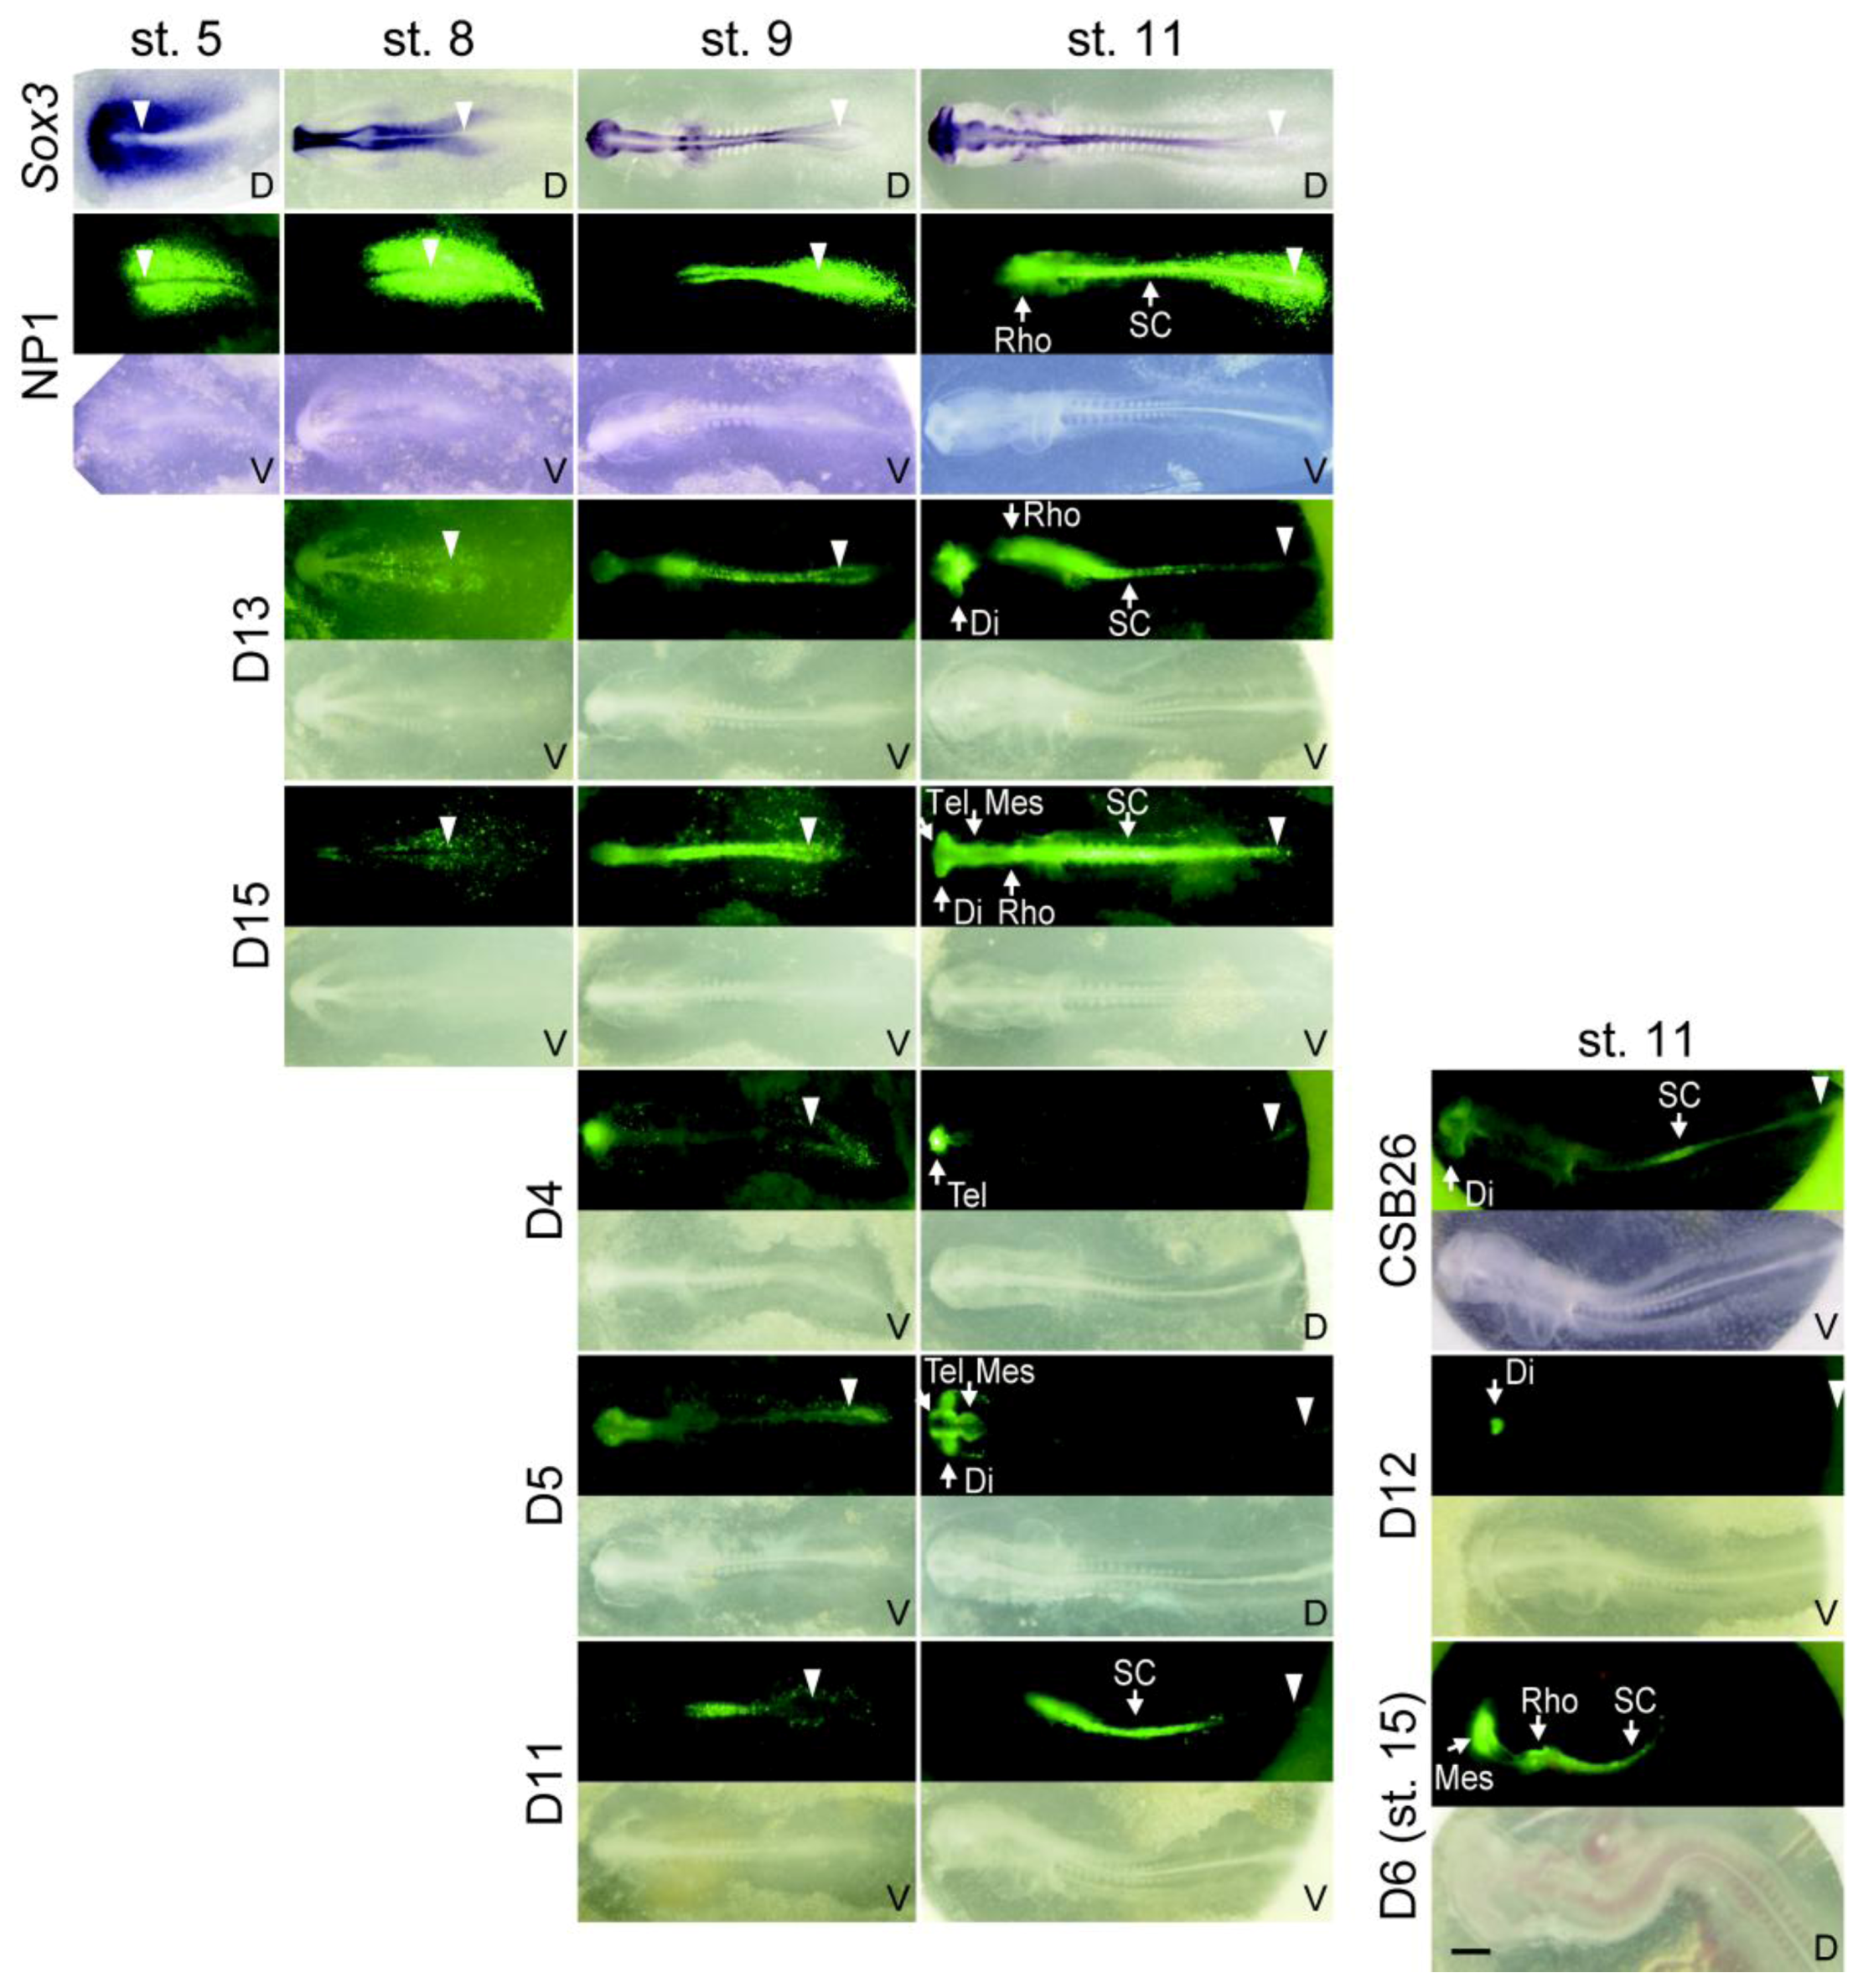
2.3. The Time Course of the Activation of Neural Enhancers

The tissue territories of activation of the Sox3 neural enhancers are compared in Figure 4 following the time course. Shortly after the electroporation of the tkEGFP reporter vector, the NP1 (CSB27) enhancer was activated at st.5 in the region abutting the anterior primitive streak, which is similar to the Sox2 N1 enhancer [27,29]. Synchronous with primitive streak regression and the posterior migration of Hensen’s node, the peak position of the NP1 enhancer activity moved posteriorly. A moderate level of enhancer activity remained in the region where the enhancer was once activated, namely, in the rhombencephalon and spinal cord. Following the activation of NP1, the D13 and D15 enhancers were activated at st. 8, in the prospective diencephalon, rhombencephalon and anterior spinal cord (D13/15), and in the prospective telencephalon (D15). Later at st. 9, enhancers D4, D5 and D11 were activated in the prospective telencephalon (D4), the prospective di/mesencephalon (D5) and the spinal cord (D11). At st. 11, the CSB26 enhancer was activated in the prospective diencephalon and the medial axial levels of the spinal cord, and the D12 enhancer was activated in the ventral diencephalon. Next, at st. 15, the D6 enhancer was activated in the mes/rhombencephalon and spinal cord. These enhancers produced various overlapping patterns of their activities in the CNS primordium.

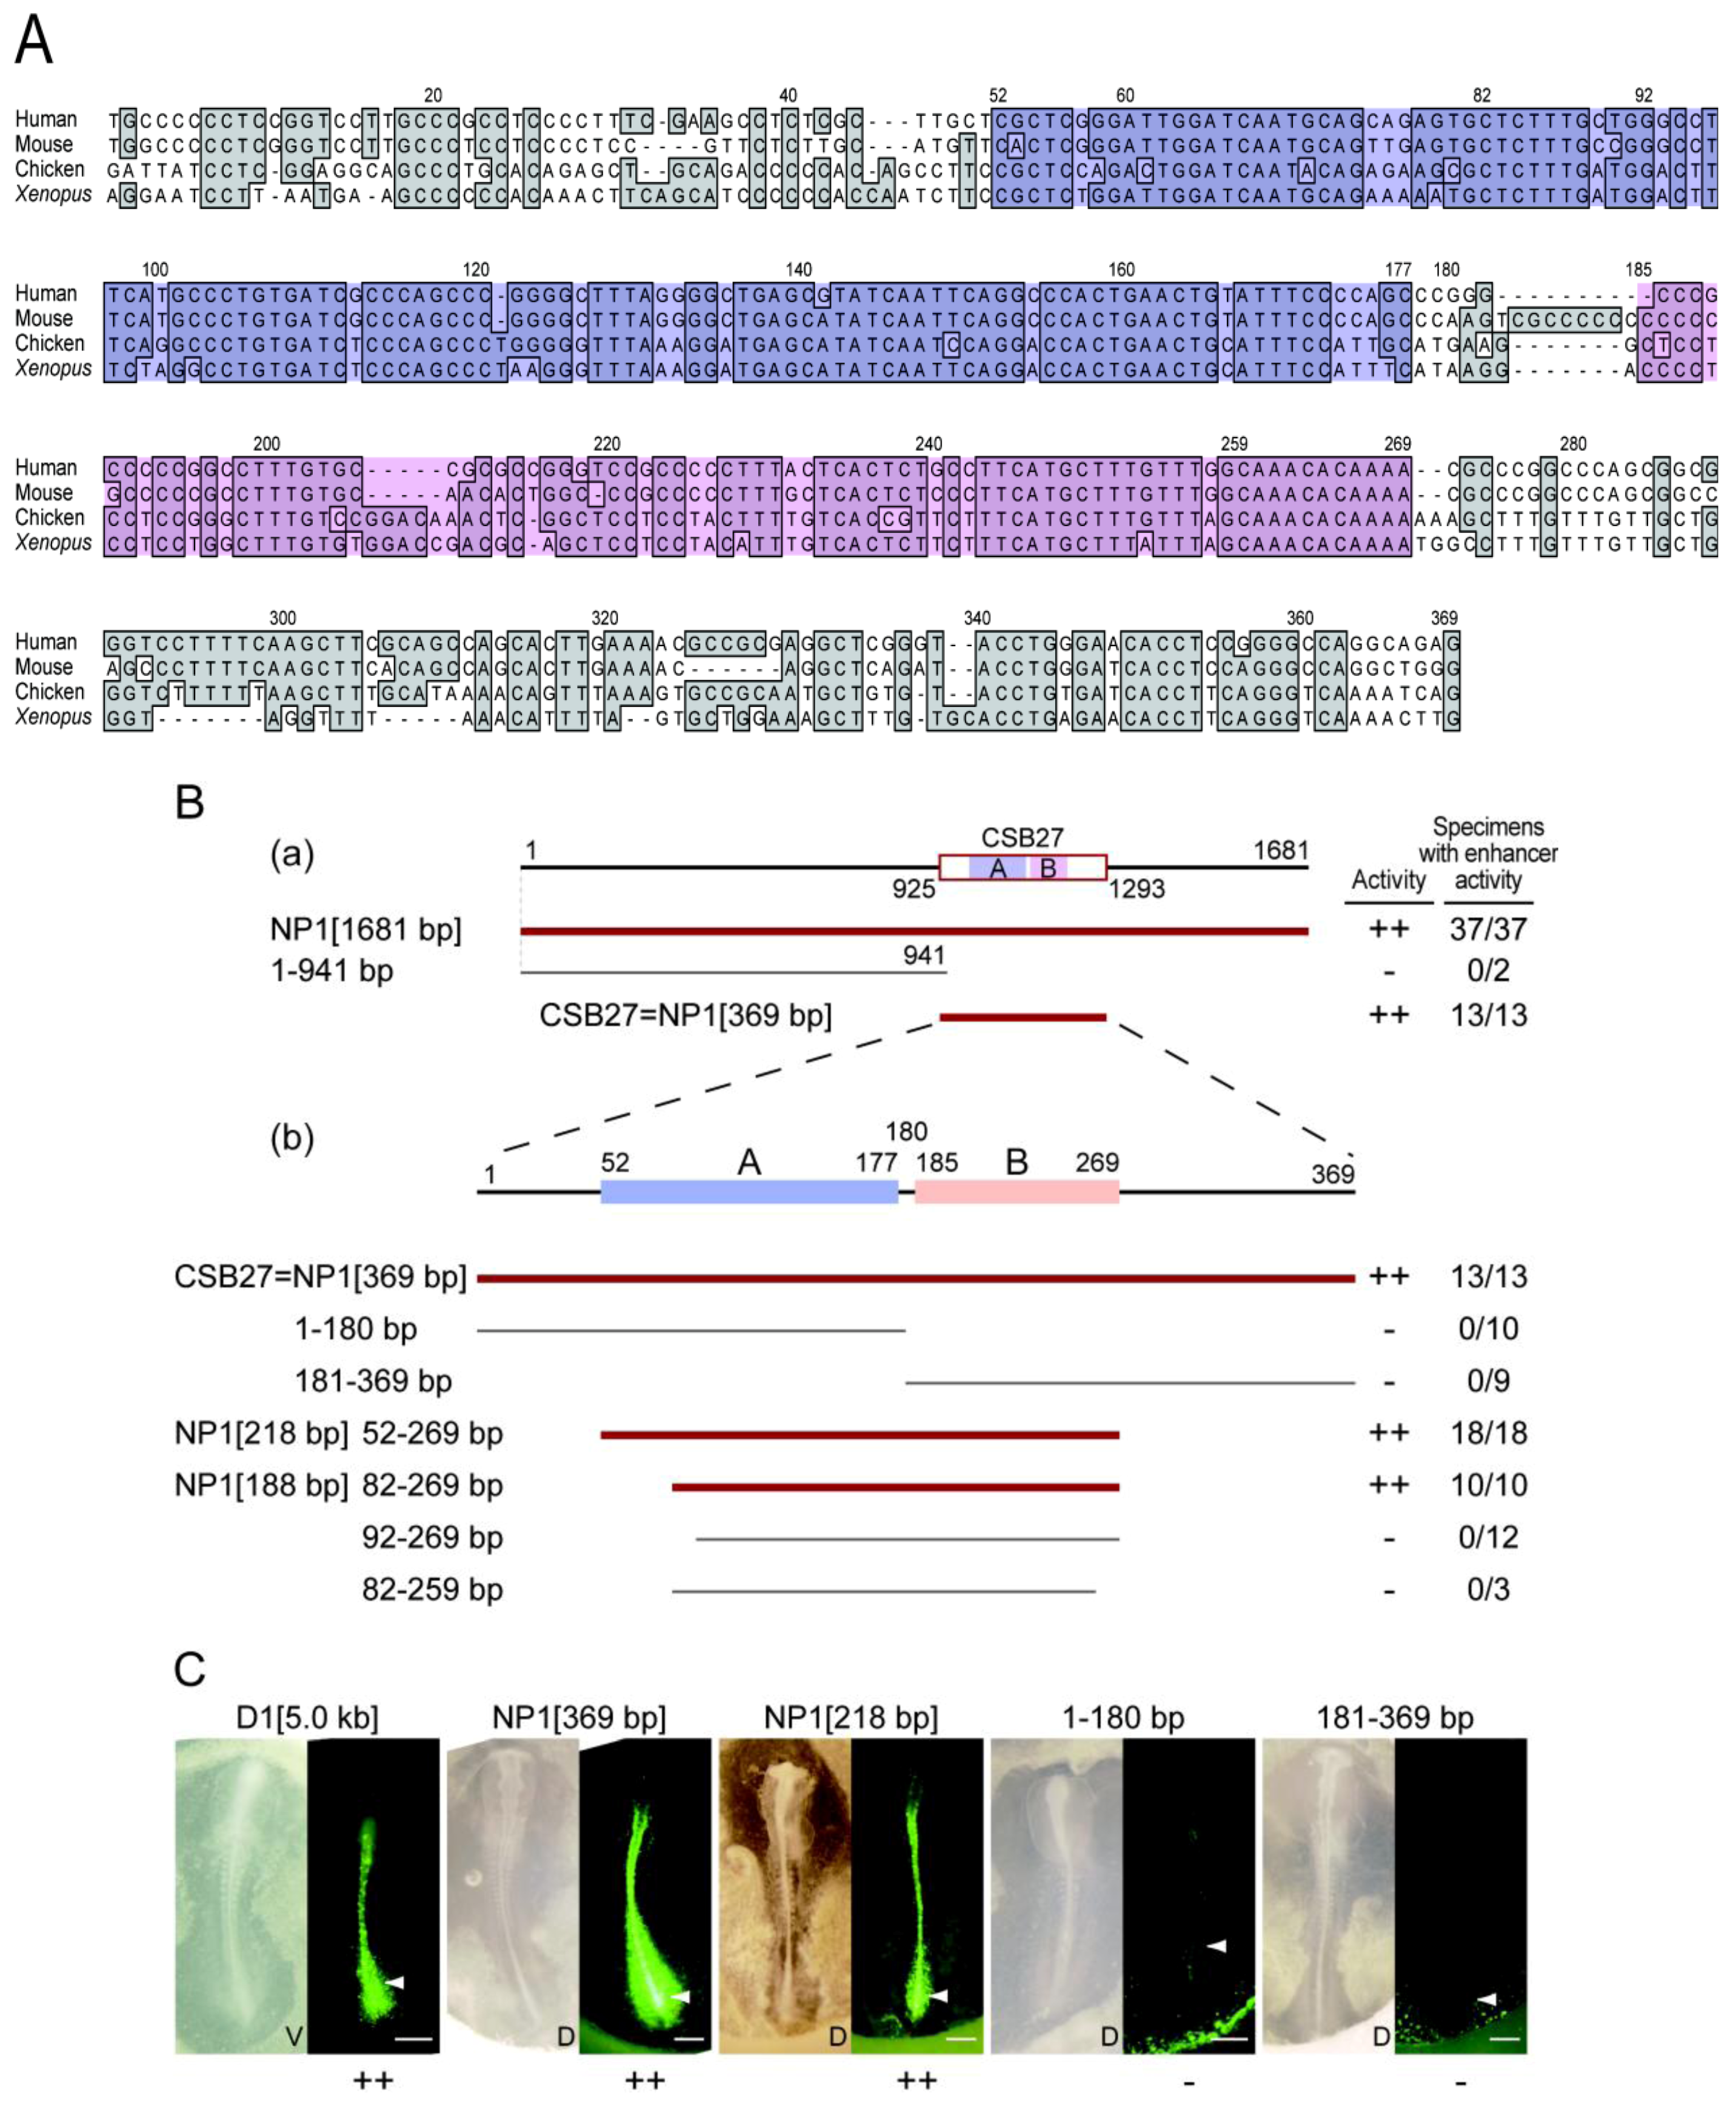
2.4. Functional Dissection of the NP1 Enhancer Region

In order to examine the NP1 enhancer regulation that was analogous to the Sox2 N1 enhancer activation in axial stem cells, the DNA sequence of the NP1 enhancer was investigated in detail. A comparison of the CSB27 sequence (369 bp in the chicken) in the four vertebrate species indicated the existence of two conspicuous blocks of high sequence conservation, which were positions 52–177 (Block A) and 185–269 (Block B) (Figure 5A).
Starting from a 1681-bp sequence, which included the 369-bp CSB27 sequence, the specific region that accounted for the enhancer sequence was narrowed down in the following steps (Figure 5B). The CSB27 sequence showed activity that was identical to the 1681-bp sequence, whereas the immediate upstream 941-bp sequence showed no activity (Figure 5B(a)). The deletion analysis shown in Figure 5B(b) indicated that the 52 to 269-bp region of the CSB27 sequence was sufficient for full enhancer activity, whereas the sequences bearing only one of the two high-conservation blocks (1–180 bp or 181–369 bp) did not show enhancer activity (Figure 5C). The 5’ step-wise deletions indicated that the 1 to 81-bp region was dispensable, but further deletion to the 92-bp position inactivated the enhancer. The 10-bp 3’ deletion from the 82 to 269-bp sequence inactivated the enhancer. Taken together, these results indicated that the 82 to 269-bp sequence was required for NP1 enhancer activity.
Figure 5. The sequence requirements for NP1 enhancer activity. A. Alignment of the CSB27 sequence of human, mouse, chicken and Xenopus. Two strongly conserved blocks, A and B, are highlighted in blue and pink, respectively. Other conserved bases are shaded in gray. The nucleotide positions in the chicken sequence are given at the top. B. Deletion analysis of the NP1 enhancer. The thick dark red lines indicate the DNA sequences showing full NP1 enhancer activity, while the thin gray lines indicate the sequences without enhancer activity. (a) A 1,681-bp DNA sequence (NP1[1681 bp]) that included the CSB27 sequence showed enhancer activity that was identical to the CSB27 (NP1[369 bp]) sequence. (b) The 5’ and 3’ halves of the CSB27 sequence, 1-180 bp and 181-369 bp, which included only one of the strongly conserved blocks, A and B, respectively, did not show NP1 enhancer activity. NP1[218 bp], consisting of the strongly conserved blocks A and B, displayed full NP1 activity. While a 30-bp deletion from the 5’ end (NP1[188 bp]) did not affect the enhancer activity, a 40-bp deletion (92–269 bp) inactivated the enhancer. The sequence of 82-259 bp with a 3’ 10-bp deletion from NP1[188 bp] lost enhancer activity. Thus, NP1[188 bp] was determined as the minimal DNA sequence that elicited NP1 enhancer activity that was definable from external deletions. C. Representative examples used to assess NP1 enhancer activity using chicken embryo electroporation. Both bright field and EGFP fluorescence images are shown for each sequence tested. D1 [5.0 kb], NP1[369 bp] and NP1[218 bp] sequences showed strong activity (++), while the 1-180 bp (including Block A) and 181-369 bp (including Block B) sequences were inactive (-). The bar indicates 500 μm.
Biology 01 00714 g005

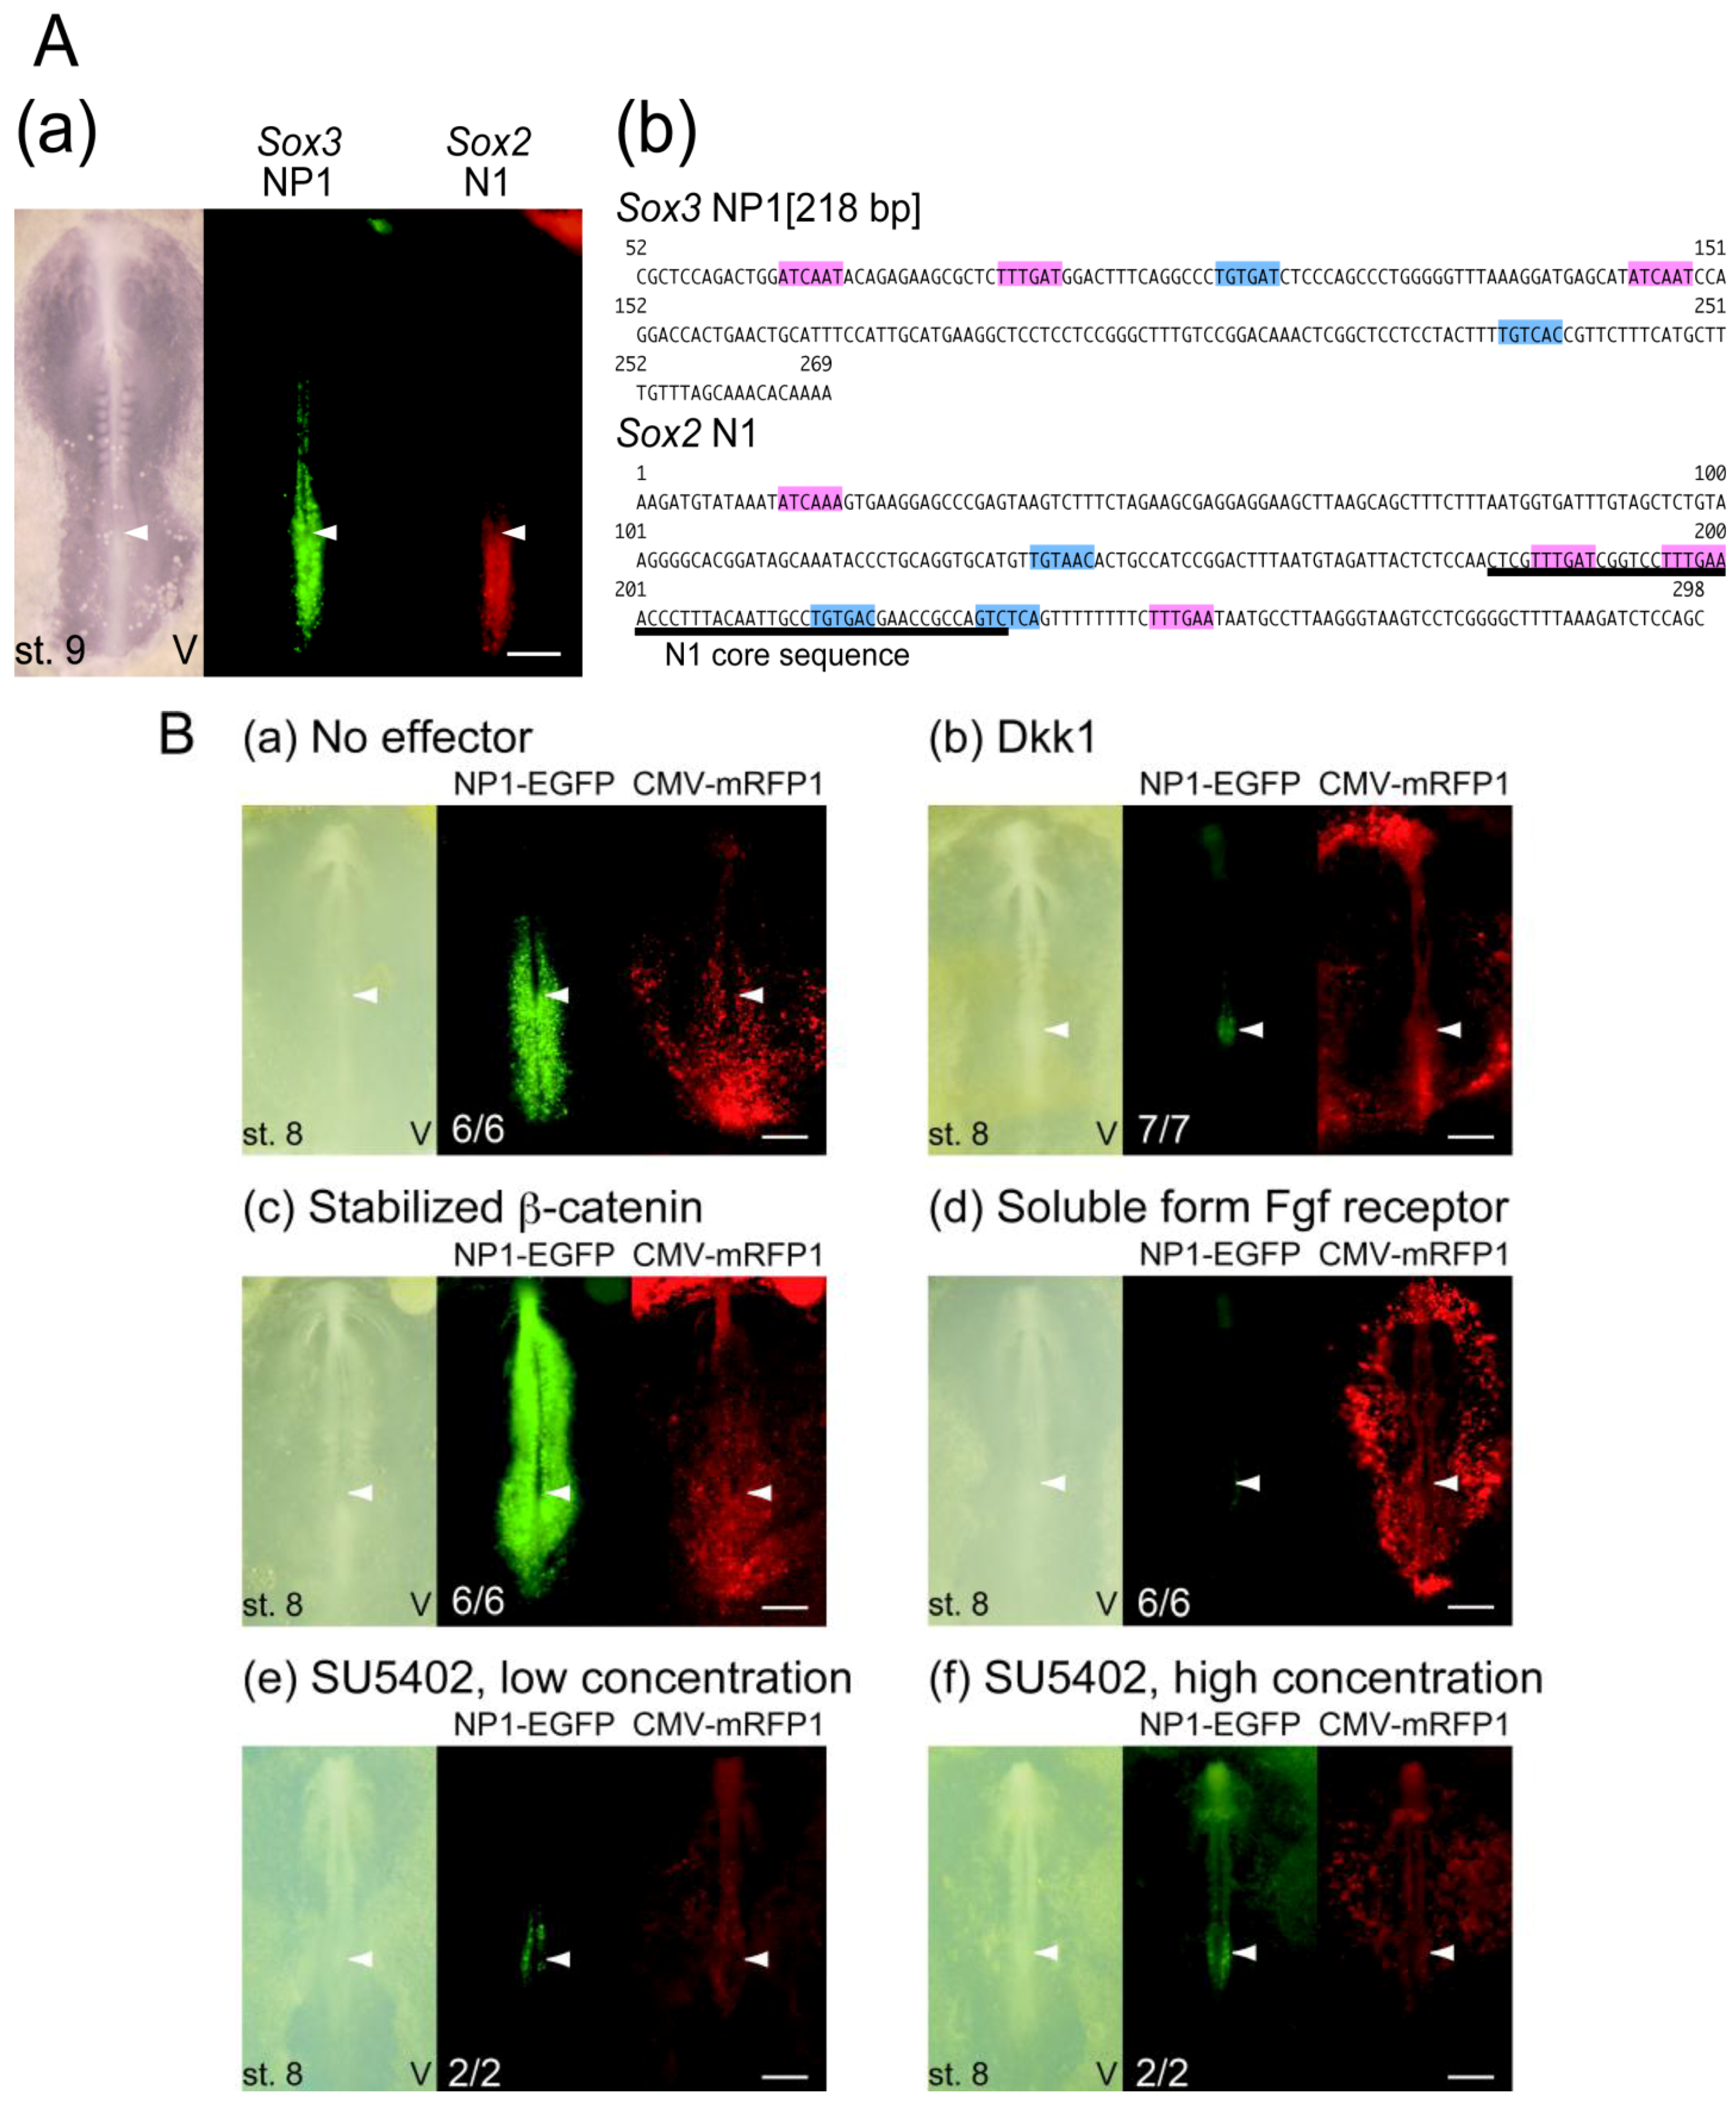
2.5. Regulation of the NP1 Enhancer by Wnt and Fgf Signals

The tissue domain that first activated the Sox3 NP1 enhancer, namely the caudal lateral epiblast abutting the primitive streak, overlapped with that of the Sox2 N1 enhancer as indicated in Figure 6A(a). The N1 enhancer is activated by the combined action of Wnt and Fgf signals [29,33], which is consistent with the requirement of both signals in the maintenance of the axial stem cells that activate the N1 enhancer [32,34]. Thus, whether the NP1 enhancer is also regulated by Wnt and Fgf signals was investigated. The 52-269 sequence of CSB27 contained several potential Lef1 binding sequences and putative Fgf-responsive elements (Figure 6A(b)).
When the expression vector for Dkk1, which is an antagonist of canonical Wnt signaling, was co-electroporated with NP1-tkEGFP, the NP1 enhancer was inactivated (Figure 6B(b)). In contrast, when the expression vector for stabilized β-catenin, which constitutively activates the canonical Wnt signal pathway, was co-electroporated, the NP1 enhancer was activated in the entire embryo (Figure 6B(c)). These results demonstrated the canonical Wnt signal-dependent activation of the NP1 enhancer. Analogously, co-electroporation of a vector to express a soluble form of the Fgf receptor 1 [FGFR1c(ECD)-Fc(IgG2a)] that titrates Fgf molecules, or addition to the culture medium of SU5402, a specific inhibitor of Fgf receptor tyrosine kinase, inactivated the enhancer (Figure 6B(d)-(f)), indicating that NP1 enhancer activation also depended on Fgf signaling. These findings indicated that the Sox3 NP1 enhancer was regulated by Wnt and Fgf signals in a manner similar to that of the Sox2 N1 enhancer, which suggests that both Sox2 and Sox3 genes are regulated in an analogous manner in neural/mesodermal-bipotential axial stem cells. This would allow the regulation of these B1 Sox genes to be coordinated with the maintenance and differentiation of axial stem cells, which are also regulated by Wnt and Fgf signaling.
Figure 6. Regulation of the Sox3 NP1 enhancer. A. Comparison of the Sox3 NP1 enhancer and Sox2 N1 enhancer. (a) Activities of the NP1 enhancer (NP1-tkEGFP) and N1 enhancer (N1-tkmRFP1) in the same electroporated chicken embryo at st. 9. The NP1 activity was recorded using a shorter exposure compared to other panels, in order to show the distribution of strong enhancer activity posterior to Hensen’s node. The node position is indicated by an arrowhead. (b) Comparison of the DNA sequences of Sox3 NP1[218 bp] and the 298-bp Sox2 N1 sequence [27,29]. The Lef-1 binding motifs are highlighted in pink. The Fgf-responsive element TGTGAC of N1 [29], as well as the related sequences in N1 and NP1 which are candidate elements for an Fgf response, are highlighted in blue. B. The dependence of NP1 enhancer activity on Wnt and Fgf signaling. Embryos were electroporated with the NP1[218 bp]-tkEGFP, pCMV/SV2-mRFP1 (electroporation control), and expression vectors for effectors modulating Wnt/Fgf signaling or treated with SU5402. After 8 hours when the embryos reached ~st. 8, the effects of the effectors on NP1 enhancer activities were assessed. The number of cases showing the same response as shown in the representative panel among the treated embryos is indicated in the NP1-EGFP panels. (a) A control embryo with no effectors. (b) Dkk1 expression that blocked canonical Wnt signaling inactivated the NP1 enhancer. (c) Expression of stabilized β-catenin that constitutively activated canonical Wnt signaling resulted in the strong activation of the NP1 enhancer in the entire embryonic tissue. (d) Expression of a soluble form of Fgf receptor that titrates out Fgf ligands inactivated the NP1 enhancer. (e) and (f) Addition of SU5402 to the culture also inactivated the NP1 enhancer. SU5402 was added at 25 μM (e) or 125 μM (f) in 50 μl yolk solution that overlaid an embryo [36], but not in the supporting agar medium. The bars indicate 500 μm.
Biology 01 00714 g006

3. Discussion

3.1. Regulation of the Sox3 Gene

The basal promoter of the human Sox3 gene has been characterized as having binding sites for several tissue-nonspecific transcription factors [37,38,39], suggesting a limited contribution of the promoter in the tissue-specific regulation of the Sox3 gene. A survey of the mouse genomic sequences within 3 kb of the Sox3 gene with transgenic mouse embryos identified three regulatory regions that dictate transgene expression: the FB sequence of approximately 200 bp long that was located at approximately -1.2 kb in the coordinates given in Figure 1 for expression in the forebrain/midbrain /hindbrain; the V2 sequence that was located between -1.1 and 0.3 kb for expression in the V2 interneuron domain of the spinal cord; and the PNT-R sequence located between 2.8 and 4.1 kb, relative to the Sox3 translational start site for expression in the posterior neural tube, rhombencephalon and otic vesicle [35]. Both the FB and V2 sequences were included in the C7 sequence, and PNT-R was included in the C8 sequence (Figure 1). Generation of the partial expression pattern of Sox3 using a X. laevis Sox3-proximal sequence has also been reported [12].
In our present study, a region of a total of 231 kb in the chicken genome encompassing the Sox3 locus was systematically surveyed for enhancers with the region-scanning ~5-kb DNA sequences with terminal overlaps, and 13 new enhancers that direct gene expression in specific regions of the neural and/or sensory primordia were identified. A combination of these with the mouse-determined enhancer-like elements, account for various features of Sox3 regulation in early neuro-sensory development. However, it should be noted that our survey using chicken embryo electroporation did not detect the aforementioned Sox3-proximal elements that were determined using transgenic mouse embryos. One possible cause of this discrepancy was differences in the assay method. However, it probably reflected that a negatively acting element that was located around -5 kb of the Sox3 gene masked the enhancer activities. In transgenic mouse experiments [35], it has been reported that inclusion of this region inhibited forebrain activity of the FB element. Presence of an analogous enhancer-inhibitory element has also been reported for the X. laevis Sox3 upstream sequence [12]. The chicken DNA sequences (C7 and C8) covering the Sox3-proximal region were assessed as negative and included this -5 kb element, which could have masked the enhancer activities (Figure 2).
The Sox3 expression pattern in the chicken embryos and the activities of the newly identified enhancers are compared in Figure 3 and Figure 4. Sox3 expression at st. 5 covered both the anterior and posterior neural plates, whereas the NP1 enhancer was active in the posterior neural plate and especially in the posterior axial stem cell region. It is likely that the FB element that was determined with the mouse system [35] regulates Sox3 expression in the anterior neural plate. After st. 8, various enhancers that have activities in the subdomains of the forebrain-midbrain region, i.e., D13, D15, D4, D5, D11, CSB26, D12 and D6, were activated in sequence. This resulted in various overlapping patterns of enhancer activities. In addition, at the rhombencephalon level, plural sequences showed enhancer activity, namely NP1, D13, D15, D6 (Figure 4) and PNT-R [35]. In the spinal cord, many enhancers showed non-uniform activity along the antero-posterior axis, with exception of the D15 enhancer. The D13 and D6 enhancers showed strong activity in the anterior half of the spinal cord at st. 11, whereas the D11 and CSB26 enhancers showed activity in the medial portion of the spinal cord (Figure 4). In the posterior region of the spinal cord, the NP1 and PNT-R enhancers exhibited activities. These observations suggested modular regulation of Sox3 expression along the antero-posterior axis of the spinal cord that depended on the differential activities of the enhancers.
In sensory tissue development, the D5 enhancer was activated in the lens placode area at st. 11, and the CSB19 enhancer was activated at st. 12 and continued to be active until the later stages of lens development (Figure 3). Three enhancers exhibiting activity in the otic placode/vesicle have been identified: the otic placode-specific D3 enhancer, NP1 and PNT-R [35]. NP1 and PNT-R showed activity in the posterior neural plate, and the activation of these enhancers in both the otic placode/vesicle and the posterior spinal cord suggested a common signaling input in the development of the two different tissues. The U3 and D8 enhancers showed activities in the epibranchial placode regions.

3.2. Comparison of the Regulation of Sox3 and Sox2

We have previously shown that during the early stages of neural plate development, Sox2 regulation is divided into non-overlapping anterior and posterior territories that are regulated by the N2 and N1 enhancers, respectively [5,27,32]. This reflects the fact that the anterior and posterior neural plates develop from the epiblast through distinct cellular mechanisms [18,32,33]. Participation of the two enhancers FB and NP1 in Sox3 regulation in the anterior and posterior neural plate development, respectively, indicated that Sox2 and Sox3 are regulated on the basis of the same antero-posterior spatial division of the neural plate.
In a detailed analysis, an important similarity was found in the regulation of the Sox3 NP1 and Sox2 N1 enhancers. Both of these enhancers were activated in the epiblastic tissue abutting the anterior primitive streak in which the axial stem cells reside. Both were activated by the combined action of Wnt and Fgf signals, as inhibition of either of these signals attenuated their enhancer activities (Figure 6B) [29,33]. Multiple Lef1-binding sites are found in the NP1 sequence (Figure 6A(b)), and a pair of functional Lef1-binding sites have been determined in the N1 sequence [29,33]. Putative Fgf-responsive elements were also indicated in both sequences (Figure 6A(b)). These shared features of NP1 and N1 allow for the coordinated regulation of Sox3 and Sox2 when the axial stem cells give rise to the neural plate and paraxial mesoderm. However, their regulation was not identical. The arrangements of the Lef1 sites and putative Fgf responsive elements were very different between NP1 and N1. In contrast to the case of the N1 enhancer, which was strongly downregulated when the neural plate was formed, the NP1 enhancer maintained its activity in the spinal cord and was also activated in the otic vesicle.
Another analogous case had similar enhancer specificities of the Sox3 D5 enhancer and Sox2 N3 enhancer. These enhancers were activated in the forebrain, including the optic vesicle, and in the lens placode in st. 11 chicken embryos. It has been shown that the Sox2 N3 enhancer is activated by the cooperative action of Sox2 and Pax6 in the diencephalon, optic vesicle and lens placode [3]. Considering the similarities in the tissue specificity of the enhancer activity, it is possible that an analogous regulation is involved in the activation of the D5 enhancer. However, their regulation was not identical, while the D5 enhancer was active in the telencephalon at st. 11, the N3 enhancer lacked activity therein. Thus, the case of the D5 enhancer represented an additional example of the analogy between the Sox3 and Sox2 regulatory mechanisms, yet with an appreciable difference.
Regulation of the Sox3 gene in the neural plate progressively became more complex (Figure 4). Following the creation of the antero-posterior subdivisions by the FB and NP1 enhancers in the enhancer territories of the forming neural plate, more Sox3 enhancers with various regional specificities were activated in sequence. The same scenario holds true for Sox2-regulating enhancers [27,28]. However, the activities of individual enhancers differed between Sox3 and Sox2 with respect to their aforementioned specificities.
The genomic arrangements of the enhancers also differed between the Sox3 and Sox2 genes. For instance, the D5 enhancer that was activated in the ocular primordia was located ~50 kb downstream of the Sox3 gene, while the N3 enhancer was positioned ~15 kb upstream of the Sox2 gene. Whereas the major Sox3 enhancers were distributed in the region between -20 kb and 80 kb relative to the Sox3 gene [35] (Figure 2), the Sox2 enhancers were more widely distributed on both sides of the gene over the range of 200 kb [28]. Thus, with respect to their individual activities and genome organizations, the enhancers substantially differed between the Sox3 and Sox2 genes.

3.3. Phylogenetic Conservation of Sox3 Regulation

The wide expression of Sox3 in the neuro-sensory primordia is common to most vertebrate species, whereas the wide expression of Sox2 is limited to amniote animals [4]. Reflecting this fact, the individual CSBs (potential enhancers) of the Sox3 locus were strongly conserved among the genomes of Xenopus, chicken and mammals (Figure 1), which is in contrast to the high degree of conservation of Sox2-associated CSBs that are confined to amniotes [4].
Along with these general features, species-dependent episodic changes in the enhancers were also observed. The sequence of lens-specific CSB19 enhancer of Sox3 is conserved poorly in the mouse genome, and this may account for the absence of Sox3 expression during mouse lens development [6]. However, the Sox3 D3 sequence, which showed purely otic placode-specific enhancer activity (Figure 3), did not contain CSBs (Figure 2), suggesting that this enhancer was unique to avian genomes.
Conservation of genomic sequences downstream of Sox3, as indicated by the occurrence of CSBs common to chicken, Xenopus and mammals, ends beyond CSB47, which is located at approximately 90 kb in the chicken genome, whereas the conservation among mammalian sequences is extended a further 3’. Both upstream and downstream genomic regions of the Sox3 gene appeared to be expanded in the mammalian genomes compared to the chicken and Xenopus genomes. An interesting issue is whether this genomic expansion is correlated with the location of Sox3 on the X-chromosome in mammalian species. The arrangements of landmark genes in syntenic chromosomal regions indicated extensive rearrangements of the genomic domains around the Sox3 gene in various species (Figure S1), suggesting that the genomic region investigated in this study included the major components of the Sox3 regulatory sequences. Alternatively, the Sox3 gene may be regulated by distant-acting regulatory sequences that withstand extensive genomic rearrangements.

4. Materials and methods

4.1. Genome Sequences of the Sox3 Locus

To analyze the enhancers and conserved sequence blocks (CSBs) in the 231-kb region spanning the Sox3 locus in the chicken genome, we used sequence data from Gallus gallus-4.0 assembly (GCA_000002315.2) chromosome 4 genomic scaffold sequence (NW_003763735 GPS_000848988) as a reference. The central region sequence, from -23456 to 29859, covered by our bacteriophage library [27] was determined by us (DDBJ Accession number AB753847). The translational start site of Sox3 was taken as +1 to indicate the genomic location relative to Sox3. This position corresponded to Gallus gallus chromosome 4 NW_003763735 sequence position 10474038, Homo sapiens chromosome X GRCh37 partial sequence position 139587000 (Sox3 is in reverse orientation), Mus musculus chromosome X GRCm38 partial sequence position 60893205 (Sox3 is in reverse orientation), Xenopus tropicalis genome scaffold GL172698.1 position 1000090. The CSBs were screened using VISTA Browser (http://genome.lbl.gov/vista/) using a threshold of >60% identity over a 100-bp length.

4.2. Enhancer Screening of the 233-kb Genomic Region and Characterization

The bacteriophage clones that carry the Sox3-proximal region sequences, approximately 50 kb, were used to produce the Sox3-proximal sequence segments C1-C13, and the two BAC clones CH261-112C13 and CH261-98D21 (ENSEMBL) were used to produce a series of ~5 kb DNA sequences with 1-kb terminal overlaps, U1 to U28 (upstream) and D1 to D17 (downstream), by PCR. These isolated sequences were individually inserted into a ptkEGFP vector [27], and electroporated at 2 μg/μL into the dorsal side of st. 4 chicken embryos. The pCMV-mRFP1 vector was also included in order to monitor the region of successful electroporation. The activation of EGFP expression at various developmental stages in New’s culture was scored as enhancer activity.

4.3. Effector-Dependent Regulation of the NP1 Enhancer

pNP1[218 bp]-tkEGFP at 2 μg/μL, pCMV/SV2-mRFP1 at 0.6 μg/μL and pCAGGS-based expression vectors [40] at 2 μg/μL for the expression of Dkk1, stabilized β-catenin [29] or rFGFR1(ECD)-rFc(IgG2a) (gift of Claudio Stern) were electroporated in st. 4 embryos in New’s culture. The impact of the expression of these effectors was assessed 8 hours after electroporation.

Acknowledgements

We thank members of the Kondoh Laboratory for stimulating discussions. This study was supported by Grants-in-Aid for Scientific Research, 24116707 and 24687029 to TT, 17107005 and 22247035 to HK, and 23770248 to MU, from MEXT, Japan and also by the Takeda Science Foundation.

References

  1. Kamachi, Y.; Uchikawa, M.; Collignon, J.; Lovell-Badge, R.; Kondoh, H. Involvement of Sox1, 2 and 3 in the early and subsequent molecular events of lens induction. Development 1998, 125, 2521–2532. [Google Scholar]
  2. Tanaka, S.; Kamachi, Y.; Tanouchi, A.; Hamada, H.; Jing, N.; Kondoh, H. Interplay of SOX and POU factors in regulation of the Nestin gene in neural primordial cells. Mol. Cell Biol. 2004, 24, 8834–8846. [Google Scholar]
  3. Inoue, M.; Kamachi, Y.; Matsunami, H.; Imada, K.; Uchikawa, M.; Kondoh, H. PAX6 and SOX2-dependent regulation of the Sox2 enhancer N-3 involved in embryonic visual system development. Genes Cells 2007, 12, 1049–1061. [Google Scholar] [CrossRef]
  4. Kamachi, Y.; Iwafuchi, M.; Okuda, Y.; Takemoto, T.; Uchikawa, M.; Kondoh, H. Evolution of non-coding regulatory sequences involved in the developmental process: reflection of differential employment of paralogous genes as highlighted by Sox2 and group B1 Sox genes. Proc. Jpn. Acad. Ser. B Phys. Biol. Sci. 2009, 85, 55–68. [Google Scholar] [CrossRef]
  5. Uchikawa, M.; Yoshida, M.; Iwafuchi-Doi, M.; Matsuda, K.; Ishida, Y.; Takemoto, T.; Kondoh, H. B1 and B2 Sox gene expression during neural plate development in chicken and mouse embryos: Universal versus species-dependent features. Dev. Growth Differ. 2011, 53, 761–771. [Google Scholar] [CrossRef]
  6. Collignon, J.; Sockanathan, S.; Hacker, A.; Cohen-Tannoudji, M.; Norris, D.; Rastan, S.; Stevanovic, M.; Goodfellow, P.N.; Lovell-Badge, R. A comparison of the properties of Sox-3 with Sry and two related genes, Sox-1 and Sox-2. Development 1996, 122, 509–520. [Google Scholar]
  7. Wood, H.B.; Episkopou, V. Comparative expression of the mouse Sox1, Sox2 and Sox3 genes from pre-gastrulation to early somite stages. Mech. Dev. 1999, 86, 197–201. [Google Scholar]
  8. Okuda, Y.; Yoda, H.; Uchikawa, M.; Furutani-Seiki, M.; Takeda, H.; Kondoh, H.; Kamachi, Y. Comparative genomic and expression analysis of group B1 sox genes in zebrafish indicates their diversification during vertebrate evolution. Dev. Dyn. 2006, 235, 811–825. [Google Scholar] [CrossRef]
  9. Penzel, R.; Oschwald, R.; Chen, Y.; Tacke, L.; Grunz, H. Characterization and early embryonic expression of a neural specific transcription factor xSOX3 in Xenopus laevis. Int. J. Dev. Biol. 1997, 41, 667–477. [Google Scholar]
  10. Rex, M.; Orme, A.; Uwanogho, D.; Tointon, K.; Wigmore, P.M.; Sharpe, P.T.; Scotting, P.J. Dynamic expression of chicken Sox2 and Sox3 genes in ectoderm induced to form neural tissue. Dev. Dyn. 1997, 209, 323–232. [Google Scholar] [CrossRef]
  11. Uwanogho, D.; Rex, M.; Cartwright, E.J.; Pearl, G.; Healy, C.; Scotting, P.J.; Sharpe, P.T. Embryonic expression of the chicken Sox2, Sox3 and Sox11 genes suggests an interactive role in neuronal development. Mech. Dev. 1995, 49, 23–36. [Google Scholar] [CrossRef]
  12. Rogers, C.D.; Archer, T.C.; Cunningham, D.D.; Grammer, T.C.; Casey, E.M. Sox3 expression is maintained by FGF signaling and restricted to the neural plate by Vent proteins in the Xenopus embryo. Dev. Biol. 2008, 313, 307–319. [Google Scholar] [CrossRef]
  13. Schlosser, G.; Ahrens, K. Molecular anatomy of placode development in Xenopus laevis. Dev. Biol. 2004, 271, 439–466. [Google Scholar] [CrossRef]
  14. Uchikawa, M.; Kamachi, Y.; Kondoh, H. Two distinct subgroups of Group B Sox genes for transcriptional activators and repressors: Their expression during embryonic organogenesis of the chicken. Mech. Dev. 1999, 84, 103–120. [Google Scholar]
  15. Nitta, K.R.; Takahashi, S.; Haramoto, Y.; Fukuda, M.; Onuma, Y.; Asashima, M. Expression of Sox1 during Xenopus early embryogenesis. Biochem. Biophys. Res. Commun. 2006, 351, 287–293. [Google Scholar] [CrossRef]
  16. Okuda, Y.; Ogura, E.; Kondoh, H.; Kamachi, Y. B1 SOX coordinate cell specification with patterning and morphogenesis in the early zebrafish embryo. PLoS Genet. 2010, 6. [Google Scholar] [CrossRef]
  17. Rizzoti, K.; Lovell-Badge, R. SOX3 activity during pharyngeal segmentation is required for craniofacial morphogenesis. Development 2007, 134, 3437–3448. [Google Scholar]
  18. Iwafuchi-Doi, M.; Yoshida, Y.; Onichtchouk, D.; Leichsenring, M.; Driever, W.; Takemoto, T.; Uchikawa, M.; Kamachi, Y.; Kondoh, H. The Pou5f1/Pou3f-dependent but SoxB-independent regulation of conserved enhancer N2 initiates Sox2 expression during epiblast to neural plate stages in vertebrates. Dev. Biol. 2011, 352, 354–366. [Google Scholar] [CrossRef]
  19. Nishiguchi, S.; Wood, H.; Kondoh, H.; Lovell-Badge, R.; Episkopou, V. Sox1 directly regulates the gamma-crystallin genes and is essential for lens development in mice. Genes Dev. 1998, 12, 776–781. [Google Scholar]
  20. Ekonomou, A.; Kazanis, I.; Malas, S.; Wood, H.; Alifragis, P.; Denaxa, M.; Karagogeos, D.; Constanti, A.; Lovell-Badge, R.; Episkopou, V. Neuronal migration and ventral subtype identity in the telencephalon depend on SOX1. PLoS Biol. 2005, 3. [Google Scholar] [CrossRef] [Green Version]
  21. Avilion, A.A.; Nicolis, S.K.; Pevny, L.H.; Perez, L.; Vivian, N.; Lovell-Badge, R. Multipotent cell lineages in early mouse development depend on SOX2 function. Genes Dev. 2003, 17, 126–140. [Google Scholar] [CrossRef]
  22. Rizzoti, K.; Brunelli, S.; Carmignac, D.; Thomas, P.Q.; Robinson, I.C.; Lovell-Badge, R. SOX3 is required during the formation of the hypothalamo-pituitary axis. Nat. Genet. 2004, 36, 247–255. [Google Scholar] [CrossRef]
  23. Weiss, J.; Meeks, J.J.; Hurley, L.; Raverot, G.; Frassetto, A.; Jameson, J.L. Sox3 is required for gonadal function, but not sex determination, in males and females. Mol. Cell Biol. 2003, 23, 8084–8891. [Google Scholar] [CrossRef]
  24. Graham, V.; Khudyakov, J.; Ellis, P.; Pevny, L. SOX2 functions to maintain neural progenitor identity. Neuron 2003, 39, 749–765. [Google Scholar]
  25. Pevny, L.H.; Nicolis, S.K. Sox2 roles in neural stem cells. Int. J. Biochem. Cell Biol. 2010, 42, 421–424. [Google Scholar] [CrossRef]
  26. Dee, C.T.; Hirst, C.S.; Shih, Y.H.; Tripathi, V.B.; Patient, R.K.; Scotting, P.J. Sox3 regulates both neural fate and differentiation in the zebrafish ectoderm. Dev. Biol. 2008, 320, 289–301. [Google Scholar] [CrossRef]
  27. Uchikawa, M.; Ishida, Y.; Takemoto, T.; Kamachi, Y.; Kondoh, H. Functional analysis of chicken Sox2 enhancers highlights an array of diverse regulatory elements that are conserved in mammals. Dev. Cell 2003, 4, 509–519. [Google Scholar] [CrossRef]
  28. Okamoto, R.; Uchikawa, M.; Kondoh, H. Twenty-seven enhancers and additional enhancer candidates for Sox2 regulation are distributed within a 200 kb region of the chicken genome. Nucleic Acids Res. 2012. [Google Scholar]
  29. Takemoto, T.; Uchikawa, M.; Kamachi, Y.; Kondoh, H. Convergence of Wnt and FGF signals in the genesis of posterior neural plate through activation of the Sox2 enhancer N-1. Development 2006, 133, 297–306. [Google Scholar]
  30. Saigou, Y.; Kamimura, Y.; Inoue, M.; Kondoh, H.; Uchikawa, M. Regulation of Sox2 in the pre-placodal cephalic ectoderm and central nervous system by enhancer N-4. Dev. Growth Differ. 2010, 52, 397–408. [Google Scholar]
  31. Iwafuchi-Doi, M.; Matsuda, K.; Murakami, K.; Niwa, H.; Tesar, P.; Aruga, J.; Matsuo, I.; Kondoh, H. Transcriptional regulatory networks in epiblast cells and during anterior neural plate development as modeled in epiblast stem cells. Development 2012, 139, 3926–3937. [Google Scholar] [CrossRef]
  32. Kondoh, H.; Takemoto, T. Axial stem cells deriving both posterior neural and mesodermal tissues during gastrulation. Curr. Opin. Genet. Dev. 2012, 22, 374–380. [Google Scholar] [CrossRef]
  33. Takemoto, T.; Uchikawa, M.; Yoshida, M.; Bell, D.M.; Lovell-Badge, R.; Papaioannou, V.E.; Kondoh, H. Tbx6-dependent Sox2 regulation determines neural or mesodermal fate in axial stem cells. Nature 2011, 470, 394–398. [Google Scholar] [CrossRef]
  34. van Rooijen, C.; Simmini, S.; Bialecka, M.; Neijts, R.; van de Ven, C.; Beck, F.; Deschamps, J. Evolutionarily conserved requirement of Cdx for post-occipital tissue emergence. Development 2012, 139, 2576–2583. [Google Scholar] [CrossRef]
  35. Brunelli, S.; Silva Casey, E.; Bell, D.; Harland, R.; Lovell-Badge, R. Expression of Sox3 throughout the developing central nervous system is dependent on the combined action of discrete, evolutionarily conserved regulatory elements. Genesis 2003, 36, 12–24. [Google Scholar] [CrossRef]
  36. Kondoh, H.; Uchikawa, M. Dissection of chick genomic regulatory regions. Meth. Cell Biol. 2008, 87, 313–336. [Google Scholar]
  37. Kovacevic Grujicic, N.; Mojsin, M.; Krstic, A.; Stevanovic, M. Functional characterization of the human SOX3 promoter: identification of transcription factors implicated in basal promoter activity. Gene 2005, 344, 287–297. [Google Scholar] [CrossRef]
  38. Krstic, A.; Mojsin, M.; Stevanovic, M. Regulation of SOX3 gene expression is driven by multiple NF-Y binding elements. Arch. Biochem. Biophys. 2007, 467, 163–173. [Google Scholar] [CrossRef]
  39. Mojsin, M.; Stevanovic, M. PBX1 and MEIS1 up-regulate SOX3 gene expression by direct interaction with a consensus binding site within the basal promoter region. Biochem. J. 2009, 425, 107–116. [Google Scholar]
  40. Sawicki, J.A.; Morris, R.J.; Monks, B.; Sakai, K.; Miyazaki, J. A composite CMV-IE enhancer/beta-actin promoter is ubiquitously expressed in mouse cutaneous epithelium. Exp. Cell Res. 1998, 244, 367–369. [Google Scholar] [CrossRef]

Supplementary Materials

Figure S1. The arrangement of genes surrounding the Sox3 locus in human, mouse, chicken and Xenopus tropicalis. The landmark genes are highlighted in different colors, indicating the occurrence of extensive rearrangements of the chromosomal segments among the animal species examined.
Biology 01 00714 g007
Table S1. Positioning of the conserved sequence blocks (CSBs) in the human, mouse, chicken and Xenopus genomes.
Chicken Sox3 locusHuman Sox3 locusMouse Sox3 locusXenopus Sox3 locus
CSBPositionsaLength (bp)PositionsaLength (bp)Human vs. chicken Identity (%)PositionsaLength (bp)Mouse vs. chicken Identity (%)PositionsaLength (bp)Xenopus vs. chicken Identity (%)
1-130257 ~ -130129129-970154 ~ -97002612984c-589181 ~ -58905312982Absent
2-110940 ~ -110700241-444400 ~ -44416124073-522083 ~ -52183724774Absent
3-108306 ~ -107937370-428513 ~ -42815336171-500213 ~ -49984137369-129767 ~ -12939337562
4-103688 ~ -103557132Absent -474215 ~ -47409112560-121856 ~ -12172313464
5-97501 ~ -97400102Absent -388001 ~ -38790010262Absent
6-82740 ~ -82535206-274707 ~ -27450220666-286133 ~ -28593020453dAbsent
7-81558 ~ -81458101Absent -297179 ~ -29706511560Absent
8-67333 ~ -67221113-252300 ~ -25219310857d-261781 ~ -26166911363Absent
9-60650 ~ -60531120-246870 ~ -24675012164-253372 ~ -25324712664Absent
10-59303 ~ -59126178-243592 ~ -24341018363Absent Absent
11-56180 ~ -56079102Absent -230997 ~ -23089710161Absent
12-45556 ~ -44996561-156675 ~ -15616551175-149792 ~ -14928351075-42634 ~ -4214549062
13-29736 ~ -29259478-137259 ~ -13677548579-133617 ~ -13315146780-31421 ~ -3096445860
14-26388 ~ -25483906-88401 ~ -8752188178-101763 ~ -10087489079-27373 ~ -2647989567
15-21081 ~ -20662420-34050 ~ -3363741477-37248 ~ -3684240777-19657 ~ -1923642265
16-17784 ~ -17128657-28051 ~ -2738966382-25441 ~ -2478066281-18039 ~ -1739664461
17-14950 ~ -14611340-23177 ~ -2284333576-22166 ~ -2184032769-15729 ~ -1538934160
18-13560 ~ -13273288-22619 ~ -2233728365-21624 ~ -2134028563Absent
19-11574 ~ -11339236-21444 ~ -2121922663-20545 ~ -2031623051d-13988 ~ -1375723271
20-5363 ~ -4690674-7397 ~ -673965977-6672 ~ -601465976-7241 ~ -657167160
21-4176 ~ -4004173Absent Absent -5417 ~ -524617264
22-944 ~ -792153-1258 ~ -109916065-1253 ~ -109715765Absent
23-88 ~ 9971086-87 ~ 1166125467-87 ~ 1177126567-88 ~ 969105871
Sox3 CDSb -225 ~ 11161342 -225 ~ 11281354
Sox3 CDSa1 ~ 9519511 ~ 11161116661 ~ 11281128681 ~ 92492476
241982 ~ 20981172253 ~ 2378126682247 ~ 236912364Absent
2520709 ~ 2088217448743 ~ 489141726745466 ~ 4563817367Absent
2624291 ~ 2491662654918 ~ 555416247051461 ~ 520976377022831 ~ 2347064070
2729103 ~ 2947136964927 ~ 652863606361426 ~ 617853606124237 ~ 2459535976
2833725 ~ 33839115Absent Absent 28864 ~ 2899112863
2935797 ~ 35915119114633 ~ 1147501186193771 ~ 938881186131915 ~ 3203612261
3037839 ~ 37943105Absent Absent 50701 ~ 5080110169
3143240 ~ 43490251146259 ~ 14650524760115905 ~ 11615725360Absent
3247105 ~ 47964860205211 ~ 20606585579148542 ~ 1493848437659011 ~ 5984783763
3348341 ~ 48713373206395 ~ 20676437072149726 ~ 1500953707261798 ~ 6216236560
3452194 ~ 52648455253981 ~ 25443445486173018 ~ 1734714548666646 ~ 6707543071
3560282 ~ 60540259314971 ~ 31522325367212815 ~ 2130692556982061 ~ 8232226256d
3669025 ~ 69166142325798 ~ 32593513861235698 ~ 23583313662Absent
3769205 ~ 69439235325967 ~ 32620223661235872 ~ 23611023960Absent
3871699 ~ 72240542346769 ~ 34731054282262559 ~ 2631015437393894 ~ 9443053765
3975210 ~ 75377168376498 ~ 37666416784cAbsent 95795 ~ 9596817471
4077117 ~ 77242126393019 ~ 39314612869322436 ~ 32256513060Absent
4177293 ~ 77414122393172 ~ 39329212162322599 ~ 32270911150dAbsent
a The open reading frame (ORF) start site of Sox3 is taken as 1.
b Another translational start sites are annotated and conserved only in some mammalian genomes.
c The case where the sequence was inverted relative to chicken sequence.
d The cases where the sequence showed sequence identity vs chicken below 60%.
Table S2. Positioning of the DNA sequences relative to the Sox3 ORF start site, which were tested for enhancer activity.
Sequence numberPositions relative to the Sox3 start site (bp)Sequence length (bp)Enhancer activity in the CNS (HH stagesa)Non-CNS enhancer activity (HH stagesa)Analyzed specimens
U28-134079 ~ -1290365044--3
U27-130087 ~ -1250815007--7
U26-126128 ~ -1210825047--8
U25-122088 ~ -1170835006--3
U24-118083 ~ -1131214963--4
U23-114084 ~ -1097484337--4
U22-110784 ~ -1063134472--5
U21-107300 ~ -1023424959--9
U20-103342 ~ -983245019--5
U19-99343 ~ -943445000--6
U18-95344 ~ -902895056--4
U17-91345 ~ -863465000--4
U16-87346 ~ -823095038--6
U15-83347 ~ -783325016--8
U14-79348 ~ -743495000--2
U13-75351 ~ -703455007--3
U12-71350 ~ -663115040--3
U11-67351 ~ -623525000--4
U10-63400 ~ -582585143--5
U9-59365 ~ -543125054--3
U8-55353 ~ -501465208--6
U7-51354 ~ -463535002--9
U6-47369 ~ -423565014--8
U5-43364 ~ -383575008--3
U4-39363 ~ -344544910--3
U3-35550 ~ -304425109-Epibranchial placode (st. 9)13
U2-31484 ~ -264565029--3
U1-27456 ~ -224355022--5
C1-23456 ~ -169126545--4
C2-22029 ~ -144897541--7
C3-16915 ~ -126834233--4
C4-16353 ~ -106865668-Lens placode(st. 11)4
C5-13647 ~ -93254323-Lens placode(st. 11)6
C6-10822 ~ -60964727--2
C7-7397 ~ 25489945--5
C8-2027 ~ 64628489--5
C94748 ~ 1563710890--5
C106459 ~ 115995141--4
C1113024 ~ 214418418--3
C1216899 ~ 2964212744Diencephalon, spinal cord (st.11)-8
C1321752 ~ 282446493Diencephalon, spinal cord (st.11)-8
D128860 ~ 338595000Posterior neural plate, rhombencephalon, spinal cord (st. 5)Otic placode (st. 11)15
D232859 ~ 378585000--3
D336858 ~ 418675010-Otic placode (st. 11)11
D440830 ~ 458565027Telencephalon (st. 9)-11
D544847 ~ 498555009Tel/di/mesencephalon (st. 9)Lens placode (st. 11)12
D648830 ~ 538585029Mes/rhombencephalon, spinal cord (st. 15)-8
D752798 ~ 578565059--3
D856853 ~ 618615009-Epibranchial placode (st. 9)7
D960834 ~ 658725039-Lens (st. 17)b3
D1064835 ~ 698505016Ventral diencephalon (st. 13)bOtic vesicle, nasal pit (st. 13)b3
D1168843 ~ 738495007Spinal cord (st. 9)-10
D1272849 ~ 778485000Diencephalon (st. 11)-11
D1376848 ~ 818475000Posterior neural plate, di/rhombencephalon, spinal cord (st. 8)-12
D1480847 ~ 858955049--3
D1584850 ~ 887603911CNS (st. 8)-3
D1688029 ~ 932285200--3
D1792231 ~ 972305000--5
CSB19-12377 ~ -109641414-Lens placode (st. 11)3
CSB2624264 ~ 253121049Diencephalon, spinal cord (st. 11)-5
CSB2728179 ~ 298591681Posterior neural plate, rhombencephalon, spinal cord (st. 5)Otic placode (st. 11)37
a The earliest developmental stages recorded for the EGFP expression are indicated.
b These showed the low enhancer activities, and data were not shown in this text.

