Abstract
Water hyacinth (Eichhornia crassipes) is one of the most invasive plants around the world. In the state of Hidalgo, Mexico it has invaded several water bodies. Nevertheless, its management is an ongoing challenge because of its rapid growth and the expensiveness of its removal. Therefore, alternatives to valorize its biomass are needed. One of them is the production of optical materials from it. Past reports have demonstrated the viability to obtain fluorophores from lignin and that it is present in E. crassipes biomass. Nevertheless, most works focus on its extraction using harsh process conditions and strong acids or alkalis. No reports about the use of E. crassipes in such processes exist. As the demand for more environmentally friendly processes increases, avoidance of such chemicals is needed. Therefore, in this work the extraction of fluorophores directly from biomass of E. crassipes via a hydrothermal process using water as the sole solvent and catalyzer was studied. The liquid to solid ratio (LSR) varied from 25 to 50 and time from 8 to 16 h. Biomass was almost completely dissolved. Fluorophores with different photoluminescent emissions were obtained. Their extraction was confirmed by photoluminescence spectroscopy. The emission of the obtained materials could be tuned by changing processing time and LSR.
1. Introduction
Eichhornia crassipes (also known as Pontederia crassipes) is a contrasting plant. On the one hand, it is a successful organism which has acquired several adaptations to colonize the world [1]. Among them, fast reproduction and tolerance to drought and water pollution, even by heavy metals, have allowed it to thrive in every continent [2,3,4,5]. On the other hand, these qualities allow it to quickly and almost completely colonize water bodies, which in addition to the lack of natural predators out of its original environment, make it a significant threat for every aquatic habitat in which it has been introduced. Efforts around the world are being made to eradicate it; however, it has been shown to be extremely difficult to achieve. In the state of Hidalgo, Mexico, this plant has invaded a great portion of the hydraulic infrastructure. Some dams, like that of San Antonio located in the municipality of Huasca, which is an important water source and touristic place, have been completely covered by it. To fix this, routine removal programs have been implemented; nevertheless, if they are suspended, the pest reappears. Considering that this dam alone has a surface of 78.9 ha, the task demands intense labor and financial resources. Its removal is carried out manually or physically to avoid the inherent risks of using herbicides [6], making it an expensive effort, and the amount of retired biomass is not negligible [7]. Furthermore, if this biomass is not correctly managed, its degradation may cause more environmental damage, and in more zones than those directly colonized by the plant. For instance, if heavy metal-containing biomass is finely triturated and blown away by wind or used as fertilizer, these metals spread and/or get into trophic chains. If it is just left to rot, it will indeed “disappear”, but it will produce green-house gases. Therefore, there is a need for a way to process biomass without creating more environmental damage, while at the same time making it financially viable. One strategy to help achieve this is the valorization of the biomass, for instance, by obtaining fermentable sugars from it, or using it as a substrate for edible fungi production. Nevertheless, these approaches are not always possible because of the aforementioned pollution problems. In such cases the production of optically active materials would be an attractive alternative. To the extent of our knowledge, this has not been studied for E. crassipes.
Fluorophores have been extracted from lignocellulosic materials before [8]. Nevertheless, extracting lignin from them regularly requires the use of harsh chemicals, such as strong acids or alkalis [9,10], or high temperatures [11]. Considering that a hydrothermal treatment allows the extraction of lignin from biomass [11], and that the high pressures could transform it, it was expected that they could be extracted from this invading weed. Due to the increase in pressure against polluting processes, environmentally friendly alternatives are needed to carry them on. Therefore, in this work, the obtention of fluorophores directly from untreated E. crassipes biomass by a hydrothermal process using only water as a solvent/catalyzer is studied.
2. Materials and Methods
Eichhornia crassipes biomass was collected from Presa de San Antonio, Huasca, Hidalgo, México (20.23234° N, 98.55810° O). It was washed with reverse osmosis water and then sun dried for 48 h. It was then stored and dried at 80 °C for 1 h before its use.
Fluorophores were synthesized as follows. 20 mg of dried biomass were added to up to 1 mL of deionized water in a 25 mL PTFE vessel. Next, they were subjected to ultrasonication for 30 min. Then, they were inserted into a PTFE-lined stainless steel recipient and heated to 180 °C. Once 180 °C was achieved, reaction time (8–16 h) started. After reaction time finished, they were naturally cooled and then purified. Purification was performed by first filtering the reaction medium using 220 nm membranes. Supernatant then underwent ultrasonication for 30 min; next, it was centrifuged for 10 min at 1500 rpm. Optical studies were conducted after this step.
Optical studies were carried out using a Lambda XLS UV–vis spectrometer and an LS 55 fluorometer, both from Perkin Elmer. In them, deionized water was used as solvent and 10 μL of sample was used in every analysis. For dry untreated biomass, photoluminescence was measured using a solid sample additament. FT-IR studies were conducted using a Frontier instrument from Perkin Elmer with an ATR additament. The fluorescence quantum yield (ϕ) of each sample was measured relative to anthracene diluted in methanol, using identical excitation wavelengths, for both, the standard and the samples (≈270 nm) according to the methodology reported by Wong and collaborators [12].
X-ray diffraction studies were conducted using an Empyrean instrument from Bruker using the transmission configuration with a 0.001° step size and a spinning sample holder using the wavelength.
3. Results
3.1. Reaction
Once reaction time was over, and the reaction medium cooled down, it underwent an ultrasonication and filtration process. During this last step it could be noted that only a small fraction of the starting material was left as a fibrous black solid. Everything else was dissolved.
3.2. Optical Studies
First, UV–vis absorption results will be disclosed. Spectra from all samples are shown in Figure 1. All samples exhibit a strong absorption from 200 to 250 nm and an intense peak at about 280 nm. From these spectra, excitation wavelength for emission studies was obtained; it was decided to be around 270 nm (10 nm shorter than absorption maximum). Due to the almost null differences between spectra, only one representative from each time is shown.
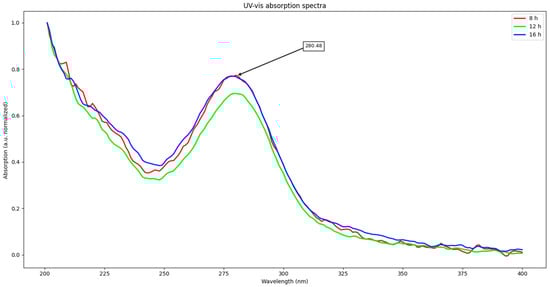
Figure 1.
UV–vis spectra from samples.
Next, photoluminescence studies are disclosed. Photoluminescence spectra from samples corresponding to 8, 12, and 16 h of hydrothermal treatment (HT) are shown through Figure 2A–C. The spectra are described next.
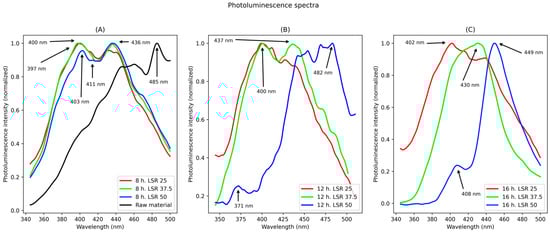
Figure 2.
Photoluminescence spectra. They correspond to samples from (A) 8 h, (B) 12 h, (C) 16 h of hydrothermal treatment.
For samples corresponding to 8 h of hydrothermal treatment, two main peaks are observed for all liquid to solid ratio (LSR): one at about 400 nm and the second one at about 430 nm. For the lowest LSR, the former is more intense than the latter. For the highest LSR, the opposite is true.
Regarding samples corresponding to 12 h of hydrothermal treatment, the spectra show differences between different LSRs. For 25 LSR, a maximum peak at 400 nm was found and a shoulder at 412 nm; for 37.5 LSR, two peaks were found, with the first centered at 400 nm and the second one at 437 nm. For 50 LSR, three peaks were detected. The lowest one centered at 371 nm, the second one centered at 454 nm with a shoulder centered at 407 nm and another one at 440 nm, and the last peak centered at 484 nm with a shoulder at 469 nm.
Lastly, for samples corresponding to 16 h of hydrothermal treatment, their spectra are disclosed next. For samples corresponding to an LSR of 25 a peak was found, with a maximum emission at 402 nm, with a shoulder at about 410 nm, and another one at 430 nm. For samples corresponding to 37.5 LSR a peak centered at 430 nm, and for an LSR of 50 there were two peaks, one centered at 408 nm and a sharp peak centered at 449 nm. Finally, for raw material, its spectrum is shown in Figure 2A. In it, a continuum from 300 nm to about 470 nm was found, and a sharp peak centered at 485 nm. The measured fluorescence quantum yields were 18.0%, 14.5%, 17.6%, 12.2%, 8.3%, 4.9%, 16.6%, 22.4%, and 10.3% for samples corresponding to 8 h LSR 25, 8 h LSR 37.5, 8 h LSR 50, 12 h LSR 25, 12 h LSR 37.5, 12 h LSR 50, 16 h LSR 25, 16 h LSR 37.5, and 16 h LSR 50, respectively. Anthracene was chosen as standard to avoid overlapping of its emission with the second harmonic of the excitation beam.
Next, FT-IR studies are treated. Spectra from all samples are shown through Figure 3, Figure 4 and Figure 5. For raw material, the following signals were observed: 3750–2450 cm−1 a wide band with two peaks at 2847 and 2918 cm−1, a peak at 1729 cm−1, another one at 1600 cm−1, several signals from about 1580–1200 cm−1, a peak at 1025 cm−1, and small signals from about 1000–511 cm−1.
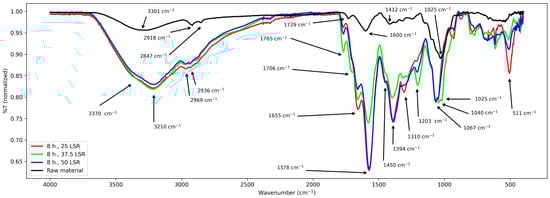
Figure 3.
FT-IR spectra from samples corresponding to 8 h of hydrothermal processing.
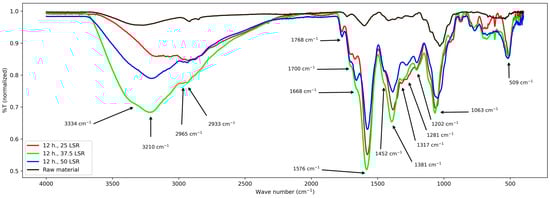
Figure 4.
FT-IR spectra from samples corresponding to 12 h of hydrothermal processing.
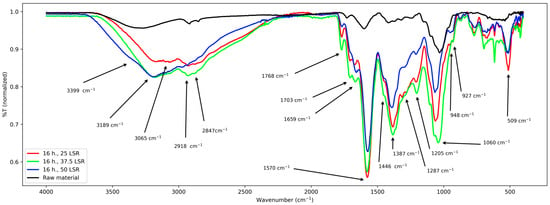
Figure 5.
FT-IR spectra from samples corresponding to 16 h of hydrothermal processing.
For samples corresponding to 8 h of hydrothermal treatment, similar bands appear. From 3700 to 2250 cm−1, a broad and intense band with a peak from 3000 to 2850 cm−1 approx., several signals from 1765 to about 1000 cm−1, seven peaks (1765, 1655, 1578, 1394, 1310, 1050 cm−1), and two shoulders (1706 and 1450 cm−1). From about 1000 cm−1 to 520 cm−1 there were multiple overlapped signals and a peak at 511 cm−1.
For those corresponding to 12 h, their bands are mentioned next; from 3680 to 2100 cm−1 a wide band with variable intensities, and from about 3000 to 2780 cm−1 a wide peak. Then, from 1768 to about 1000 cm−1 several signals. Six peaks at 1768, 1668, 1576, 1381, 1202, and 1063 cm−1, and three shoulders at about 1700, 1452, and 1000 cm−1. Such signals and those from 900 to 520 cm−1 are overlapped. The latter are difficult to interpret.
Finally, for samples corresponding to 16 h, their signals are the next ones. From about 3650–2164 cm−1 a wide band with an overlapped peak from about 3000–2800 cm−1; six peaks and several shoulders from about 1770–1046 cm−1, several overlapped signals from about 1000 to 520 cm−1 and a peak at about 520 cm−1.
Regarding the X-ray diffraction studies, results are shown in Figure 6. Several signals appear: 12°, 14.7°, 16.3°, 22.5°, 24.7°, 28.4°, 32°, 40.1°, 40.7°, 43°, 50.2°, 58.7°, 66.5°, and 73.8°. More signals could be present; nevertheless, the amorphous nature of the samples makes it difficult to interpret them.
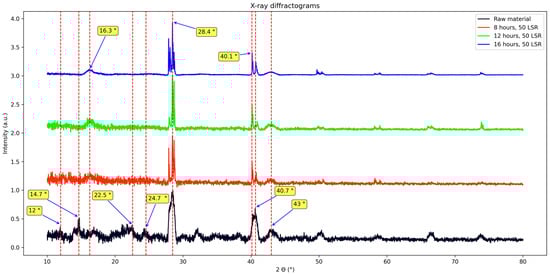
Figure 6.
XRD patterns from raw material, and samples corresponding to 8, 12, and 16 h of hydrothermal treatment.
4. Discussion
First, UV–vis absorption studies will be discussed. The strong absorption from 200 nm to approx. 250 nm is due to Π-Π* transition of the aromatic rings present in the sample [13,14]. The peak at about 280 nm is related to Π-Π* transitions from sp2 domains, and suggests the presence of oxygen bearing groups such as -OH or C=O [8,13,14,15,16,17,18,19]. It also explains its high solubility in water, and suggests that the conjugated domains of lignin were not completely disrupted, as it corresponds to what is reported for lignin obtained by mechanical milling, which is considered to be closest to its original form [8,20]. Nevertheless, to further study the evolution of the material structure, FT-IR studies were conducted. These studies showed that, indeed, their structure was related to that of the original lignin; however, it suffered important modifications. Their results are discussed next.
First, results from raw material will be treated. Its spectrum was relatively simple and confirms the presence of functional groups expected for lignocellulosic materials. It shows a band from about 3700–2400 cm−1, which was assigned to the stretching vibration of the -OH groups from its conjugated backbone and side chains; they are related to lignin, cellulose, and other polysaccharides [21,22,23]. The clear peaks from about 2900 to 2850 cm−1 correspond to stretching of the methylene groups (-CHx) from the same species [23,24]. The latter are related to the band centered at 1412 cm−1 too, which is assigned to their angular deformations [22]. The former to those from 1370 to 950 cm−1 which are assigned to the elongations of v(C-O-C) and v(C-O) and -OH bending [21,22,23]. The band at about 1240 cm−1 corresponds to polysaccharides; in this case, hemicellulose [22]. The band at 1730 cm−1 is assigned to the ketonic -CO group from polysaccharides [25], and the peak at 1600 cm−1 is assigned to C=C systems [23]; its low intensity is due to the low content of lignin in E. crassipes biomass [26,27] and is only related to lignin [23]. With these assignations, a comparison with the other series (8, 12, and 16 h) is carried out next.
First, common elements will be treated. The -OH group was confirmed in all samples by the band spanning from approx. 2450 to 3750 cm−1. Nevertheless, its broadness and intensity vary among all samples. In samples from 8 and 12 h, it is centered at 3210 cm−1, and in samples from 16 h it is centered at 3065 cm−1, whereas in raw material it is centered at 3301 cm−1. Regarding the band from about 2900–2850 cm−1, its broadening and the shifting of the peaks with respect to those of raw material indicate that -CHx groups were formed and modified during hydrothermal treatment. These changes are related to those seen at the band centered at 1412 cm−1, which became more intense and broader after hydrothermal treatment. However, every series of samples presented some particularities. They are discussed next.
First, the series of samples corresponding to 8 h (25, 37.5, and 50 LSR) is discussed. It shows a shoulder at 3370 cm−1, which is assigned to the -OH groups present in raw material, and the newly generated ones from the hydrolysis of the polysaccharides, indicating that sugars are produced during the process. New signals appear in their spectra. First, two peaks and one shoulder at 1765, 1655, and 1706 cm−1, respectively. They are assigned to C=O groups created during the hydrothermal treatment which demonstrates that an oxidative process occurred. The lack of the signal present in raw material at 1730 cm−1 shows evidence of polysaccharide transformation from 8 h onwards; this is the same in all series. Next, an intense band appears at 1570 cm−1 which is assigned to a conjugated C=C system created during the hydrothermal treatment [23]. It is close to that of the raw material (1600 cm−1). Nevertheless, its intensity and shift are different. Its shift reflects changes in its conjugation and the -OH, -CO, and -CHx groups, which also are responsible for the clear increase in the number of peaks and their intensities within the band from about 1370 to 511 cm−1. With these results, it is clear that raw material was transformed, although little difference between the members of the series was observed. All these changes are related to those seen for samples that underwent hydrothermal treatment for 12 and 16 h. For both times, there are differences between different LSRs, though. They are discussed next.
First, the band from 3700 to 2400 cm−1 will be considered. For both times, its center is shifted with respect to the raw material and shows that the abundance and types of -OH groups are higher. It partially and fully (16 h, 50 LSR) merged with that related to -CHx, Indicating that their number increased too. These changes are reflected by the bands at 1452–1063 cm−1, where multiple peaks appear. Nevertheless, contrasting with what happens with samples from 8 h, here, bands are slightly shifted between different LSRs, and the ratio between -OH and -CHx changes. All this suggests that all samples possess oxidized groups; however, their composition is different. Also, it reflects the hydrolysis of polysaccharides, which explains the appearance of the shoulder at about 3400 cm−1. For samples that underwent the hydrothermal process for 12 h, there are more -OH than -CHx; in contrast, for those from 16 h of processing, save that of 50 SLR, the higher intensity of the band at about 2800–2900 cm−1 than that at about 3000–3700 cm−1 indicates a higher amount of -CHx than -OH. This is related to the broadening of the band at about 1000 cm−1. In addition, the broadening in the band at 1200 cm−1 confirms the presence of C-O-C groups. For sample 16 h 50 SLR, the -CHx band became more of a shoulder and thus is difficult to interpret. Still, bands related to -C-O and -C-H are present and that at 1200 cm−1 became clear, showing the presence of C-O-C groups, too. When analyzing the signals from 1700 cm−1, they are present in all treated samples; nevertheless, they are shifted between them. The same is true for the band at 1572 cm−1, which means that the conjugated system in them differs.
With these results, it is proposed that the HT caused the cleavage of polysaccharides and the merging of aromatic domains from lignin into a larger conjugated system. This has been demonstrated before for pomegranate [28]. Considering that the conjugated domains of lignin were conserved to some extent, as absorption spectra showed, but that they differed according to FT-IR studies, it was expected that they presented varying photoemission [8].
Now, regarding photoluminescence studies, marked differences were observed between samples. Nevertheless, a strong correlation with FT-IR studies could also be found. First, for samples corresponding to 8 h of treatment, only slight variations could be observed; this agrees with their FT-IR spectra, in which little differences were observed (band at 1400 cm−1 for LSR of 50). This indicates that at such duration LSR does not play an important role in their transformation. In contrast, for samples corresponding to 12 and 16 h of treatment, marked differences in their emission properties were observed, showing the strong influence of LSR on their optical properties. Nevertheless, low variance may be observed between different HT times and the same LSR.
For samples corresponding to 12 h of hydrothermal treatment, there is a clear shifting of their emission maxima when going from the lowest to the highest LSR, although when going from 37.5 to 50 the shift was shorter. This agrees with FT-IR studies, in which only minor variations are found between samples corresponding to 25 and 37.5 LSR, in contrast with bigger differences between 37.5 and 50 LSR.
For samples corresponding to 16 h of hydrothermal treatment, a clear relationship between LSR and photoemission was observed. Emission peak became narrower, and its maximum was shifted to longer wavelengths alongside the increase on LSR. This agrees with the FT-IR spectra, in which important changes are evidenced and a longer conjugated system was suggested, which in turn suggests a red-shifted emission. Also, the narrower emission suggests that the species generating the emission is more structurally homogeneous.
All these emissive properties were measured using the same solvent, water; therefore, the differences may be attributed solely to those found on the molecular structure of produced compounds. Still, except for samples corresponding to 8 h of hydrothermal treatment, marked differences were found between different LSRs, even when using the same wavelength for their excitation. This has been reported before [8] and shows that the radiative relaxation follows different paths in different samples. The exact pathway for this to happen has not been fully explained, but in the present work a relationship with molecular structure is suggested. According to FT-IR studies, different oxygenated groups were found. Although an exact molecular structure could not be determined with these studies, the C-O-C group is present in all samples from HT. They can only form where C=C domains have transformed into -CHx groups. This has been confirmed by the broadening of the bands at about 1200 cm−1 seen in FT-IR spectra from samples of 12 and 16 h of HT which are related to them. Therefore, they may form over its plane, decreasing the planarity of the conjugated system, whilst -OH groups do not cause such disruption into the conjugated system as they may form in-plane in its edges, decreasing their effect on planarity. The presence in samples from 8 h of HT of -OH and less C-O-C groups, as their respective bands suggest, confirms this by showing a similar emission in all LSRs. This indicates a low variation in their molecular planarity.
This planarity alters their aggregation. According to past works [8,29] the emission of lignin derivatives is aggregation-induced. Therefore, it is proposed that the observed shift in emission is due to differences in the aggregation of conjugated domains due to differences in their planarity. This explains the double emission peaks or marked shoulders present in some samples and their lack in others. For instance, the emission of samples corresponding to 16 h of HT and LSR 50 shows two well-defined and separated peaks; its FT-IR spectrum shows the presence of C-O-C groups, suggesting a low planarity and weaker intermolecular interactions. In contrast, samples from 8 h of HT clearly present two close peaks. Due to their abundance of -OH groups, and lower C-O-C groups evidenced by FT-IR, its planarity is suggested to be higher than that of sample from 16 h and 50 LSR, allowing stronger intermolecular interactions, which in turn generate the double peaks.
All this explains why even when their emission spectra are different, their absorption spectra are extremely similar. Absorption occurs by lignin-related conjugated domains, which were conserved to some extent, while relaxation is influenced by intermolecular interactions. This explains why they are highly soluble in water, whereas lignin or polysaccharides are not. It is assumed that emission comes from lignin derivatives because it shows a behavior similar to that reported by Takada and collaborators [8]. If the emissions are compared with past reports, they are found to not completely agree in terms of emission range; nevertheless, in those works either a lignin model or fractionated lignin extracted using acids or alkalis are used, and this extraction is not expected to alter lignin radically, at least to a lesser extent than the hydrothermal process studied in the present work. In it, lignin in its native form was used and studies showed that its molecular structure was heavily modified, so results are not directly comparable. Still, a strong enough correlation was found to allow comparison of the obtained results. To further explore intermolecular interactions, XRD studies were conducted. They are discussed next.
First, results from biomass will be discussed. Its XRD pattern shows signals at 14.7°, 16.7°, 22.5°, and 34.7°. They are assigned to the polymorph of cellulose I, and those at 12°, 20.1°, and 22.5° to cellulose II [30,31]. Some other marked signals appear: two wide ones, the first from 27.7 to 29° centered at about 28.4°, and the second one from 39.8° to 41° centered at about 40°; other ones at 32°, 38.2°, 43°, 50.2°, 58.8°, 66.4°, and 73.73°. Previous studies have reported some of these signals (28.4°, 40°, 50.2°, 58.8°, 66.4°). They were considered to come from pollutants naturally absorbed by the plant [22,32,33]. Now, regarding samples that underwent the hydrothermal treatment, it was found that they shared some signals with biomass—those considered to come from pollutants—yet they all lack the signals related to cellulose or even cellulose nanocrystals (17–22.5°) [30], but they do present a clear signal at ≈ 16°.
Therefore, such a signal is assigned to the newly synthesized materials. It was concluded that it is related neither to cellulose nor to pollutants; the former because of the reasons stated in the paragraph before, and the latter because the signal shows a trend which is not followed by the other signals of the same diffractogram. We attribute this to different d-spaces in the stacking of the species generating it. This agrees with what FT-IR showed and explains the differences seen in photoluminescence studies.
So far, the present results show that the hydrothermal route is able to transform the molecular structure of lignin-derived materials and that their emission properties can be tuned. This may be carried out just by changing the liquid:solid ratio used during reactions and does not require the use of harsh chemicals, such as strong acids or alkalis. They also showed that for 8 h LSR had little impact on transformation, and that for 25 LSR, time had little effect too. In turn, using 50 LSR generated more marked changes regardless of time, suggesting that water could have been a limiting factor. Although reactions are relatively long, and the fact that preprocessing is not required, water-soluble fluorophores with tunable emissions are produced and polysaccharides are obtained during the process as a by-product, making this process interesting for further processing, for instance as a substrate for the production of edible mushrooms [34]. In addition, raw material, which is a dangerous threat to aquatic environments, was almost completely solubilized, leaving only a small percentage of its initial mass as leftover. This should allow its removal without producing unwanted residues, making it an attractive alternative to pest control.
5. Conclusions
This work showed that fluorophores can be extracted directly from E. crassipes biomass via a hydrothermal process without pretreating it. Their emission properties could be readily tuned just by varying processing time and the liquid to solid ratio employed during their production. Instrumental analysis showed that changes in their photoemission are due to different intermolecular interactions and that they are not related to cellulose crystals. Due to their hydrophilic nature, vegetable origin, and photoluminescence quantum yield, they have promising applications in fluorescence cell imaging and possibly biomarkers. The harsh conditions and chemicals regularly associated with lignin extraction or biomass liquefaction were not needed for their production, making this process environmentally friendly. A viable alternative for the disposal of E. crasippes biomass in which cellulose polymorphs I and II was found.
This work suggests that various materials with interesting optical properties could be produced as by-products from the processing of lignocellulosic matter. Unfortunately, optical properties are not something routinely evaluated during their study. With this study, it is hoped that this will change.
Author Contributions
Conceptualization, V.G.I.-G. and V.M.C.; methodology, V.G.I.-G. and R.A.V.-G.; software, V.G.I.-G.; validation, A.T.-J. and R.A.V.-G.; formal analysis, V.G.I.-G. and R.A.V.-G.; investigation, V.G.I.-G.; resources, V.G.I.-G. and V.M.C.; writing—original draft preparation V.G.I.-G.; writing—review and editing V.G.I.-G., A.T.-J., R.A.V.-G., J.A.A.-V. and V.M.C.; project administration, V.G.I.-G. All authors have read and agreed to the published version of the manuscript.
Funding
Proyecto apoyado por el Gobierno del Estado de Hidalgo a través del Consejo de Ciencia, Tecnología e Innovación de Hidalgo (CITNOVA).
Institutional Review Board Statement
Not applicable.
Informed Consent Statement
Not applicable.
Data Availability Statement
The original contributions presented in this study are included in the article. Further inquiries can be directed to the corresponding authors.
Acknowledgments
V.G.I.-G would like to thank Nayeli Ibarra Diaz for her support during the present project. Also, he would like to thank CITNOVA for the financial support to this project.
Conflicts of Interest
The authors declare no conflicts of interest.
Abbreviations
The following abbreviations are used in this manuscript:
| LSR | Liquid to solid ratio |
| HT | Hydrothermal treatment |
References
- Venter, N.; Cowie, B.W.; Witkowski, E.T.F.; Snow, G.C.; Byrne, M.J. The Amphibious Invader: Rooted Water Hyacinth’s Morphological and Physiological Strategy to Survive Stranding and Drought Events. Aquat. Bot. 2017, 143, 41–48. [Google Scholar] [CrossRef]
- Hossain, E.; Sikder, H.; Kabir, H.; Sarma, S. Nutritive Value of Water Hyacinth (Eichhornia crassipes). Online J. Anim. Feed Res. 2015, 5, 40–44. [Google Scholar]
- Hayyat, M.U.; Nawaz, R.; Irfan, A.; Al-Hussain, S.A.; Aziz, M.; Siddiq, Z.; Ahmad, S.; Zaki, M.E.A. Evaluating the Phytoremediation Potential of Eichhornia crassipes for the Removal of Cr and Li from Synthetic Polluted Water. Int. J. Environ. Res. Public Health 2023, 20, 3512. [Google Scholar] [CrossRef]
- Bock, J.H. Productivity of the Water Hyacinth Eichhornia crassipes (Mart.) Solms. Ecology 1969, 50, 460–464. [Google Scholar] [CrossRef]
- Yang, H.; Tan, T.; Ren, G.; Liu, Y.; Liu, Z.; Xia, S.; Wu, Z.; Zhang, Y. The Dual Nature of Water Hyacinth (Pontederia crassipes): Environmental Threats and Sustainable Solutions. Water Biol. Secur. 2025, 4, 100359. [Google Scholar] [CrossRef]
- Madikizela, L.M. Removal of Organic Pollutants in Water Using Water Hyacinth (Eichhornia crassipes). J. Environ. Manag. 2021, 295, 113153. [Google Scholar] [CrossRef]
- Secretaría de Medio Ambiente y Recursos Naturales. Semarnat Informa un Avance de más del 50% en el Retiro de Lirio Acuático en la Presa Endhó. Available online: https://www.gob.mx/semarnat/prensa/semarnat-informa-un-avance-del-50-en-el-retiro-de-lirio-acuatico-en-la-presa-endho (accessed on 10 June 2025).
- Takada, M.; Okazaki, Y.; Kawamoto, H.; Sagawa, T. Tunable Light Emission from Lignin: Various Photoluminescence Properties Controlled by the Lignocellulosic Species, Extraction Method, Solvent, and Polymer. ACS Omega 2022, 7, 5096–5103. [Google Scholar] [CrossRef] [PubMed]
- Wang, J.-X.; Asano, S.; Kudo, S.; Hayashi, J. Deep Delignification of Woody Biomass by Repeated Mild Alkaline Treatments with Pressurized O2. ACS Omega 2020, 5, 29168–29176. [Google Scholar] [CrossRef] [PubMed]
- Koullas, D.P.; Christakopoulos, P.F.; Kekos, D.; Koukios, E.G.; Macris, B.J. Effect of Alkali Delignification on Wheat Straw Saccharification by Fusarium oxysporum Cellulases. Biomass Bioenergy 1993, 4, 9–13. [Google Scholar] [CrossRef]
- Singh, R.; Balagurumurthy, B.; Prakash, A.; Bhaskar, T. Catalytic Hydrothermal Liquefaction of Water Hyacinth. Bioresour. Technol. 2015, 178, 157–165. [Google Scholar] [CrossRef] [PubMed]
- Wong, K.-L.; Bünzli, J.-C.G.; Tanner, P.A. Quantum Yield and Brightness. J. Lumin. 2020, 224, 117256. [Google Scholar] [CrossRef]
- Singh, A.; Yadav, K.; Kumar Sen, A. Sal (Shorea robusta) Leaves Lignin Epoxidation and Its Use in Epoxy Based Coatings. Am. J. Polym. Sci. 2012, 2, 14–18. [Google Scholar] [CrossRef]
- Hynynen, J.; Riddell, A.; Achour, A.; Takacs, Z.; Wallin, M.; Parkås, J.; Bernin, D. ‘Lignin and Extractives First’ Conversion of Lignocellulosic Residual Streams Using UV Light from LEDs. Green Chem. 2021, 23, 8251–8259. [Google Scholar] [CrossRef]
- Joshi, K.M.; Shinde, D.R.; Nikam, L.K.; Panmand, R.; Sethi, Y.A.; Kale, B.B.; Chaskar, M.G. Fragmented Lignin-Assisted Synthesis of a Hierarchical ZnO Nanostructure for Ammonia Gas Sensing. RSC Adv. 2019, 9, 2484–2492. [Google Scholar] [CrossRef]
- Chen, W.; Hu, C.; Yang, Y.; Cui, J.; Liu, Y. Rapid Synthesis of Carbon Dots by Hydrothermal Treatment of Lignin. Materials 2016, 9, 184. [Google Scholar] [CrossRef]
- Chang, T.-C.; Chang, S.-T. Photostabilization Mechanisms of the Main Wood Photostabilizers from the Heartwood Extract in Acacia Confusa: Okanin and Melanoxetin. Wood Sci. Technol. 2019, 53, 335–348. [Google Scholar] [CrossRef]
- Lu, F.; Wang, C.; Chen, M.; Yue, F.; Ralph, J. A Facile Spectroscopic Method for Measuring Lignin Content in Lignocellulosic Biomass. Green Chem. 2021, 23, 5106–5112. [Google Scholar] [CrossRef]
- Chhabra, V.A.; Kaur, R.; Kumar, N.; Deep, A.; Rajesh, C.; Kim, K.-H. Synthesis and Spectroscopic Studies of Functionalized Graphene Quantum Dots with Diverse Fluorescence Characteristics. RSC Adv. 2018, 8, 11446–11454. [Google Scholar] [CrossRef]
- Balakshin, M.; Capanema, E.A.; Zhu, X.; Sulaeva, I.; Potthast, A.; Rosenau, T.; Rojas, O.J. Spruce Milled Wood Lignin: Linear, Branched or Cross-Linked? Green Chem. 2020, 22, 3985–4001. [Google Scholar] [CrossRef]
- Agarwal, S.; Gogoi, M.; Talukdar, S.; Bora, P.; Basumatary, T.K.; Devi, N.N. Green Synthesis of Silver Nanoplates Using the Special Category of Plant Leaves Showing the Lotus Effect. RSC Adv. 2020, 10, 36686–36694. [Google Scholar] [CrossRef]
- Carneiro, M.T.; Barros, A.Z.B.; Morais, A.I.S.; Carvalho Melo, A.L.F.; Bezerra, R.D.S.; Osajima, J.A.; Silva-Filho, E.C. Application of Water Hyacinth Biomass (Eichhornia crassipes) as an Adsorbent for Methylene Blue Dye from Aqueous Medium: Kinetic and Isothermal Study. Polymers 2022, 14, 2732. [Google Scholar] [CrossRef]
- Apaydın Varol, E.; Mutlu, Ü. TGA-FTIR Analysis of Biomass Samples Based on the Thermal Decomposition Behavior of Hemicellulose, Cellulose, and Lignin. Energies 2023, 16, 3674. [Google Scholar] [CrossRef]
- Prasad, R.; Sharma, D.; Yadav, K.D.; Ibrahim, H. Eichhornia Crassipes as Biosorbent for Industrial Wastewater Treatment: Equilibrium and Kinetic Studies. Can. J. Chem. Eng. 2022, 100, 439–450. [Google Scholar] [CrossRef]
- Halder, A.; Biswas, R.; Kushwaha, P.P.; Halder, K.K.; Ahmed, I.; Singh, H.; Kumar, S.; Haldar, K.K. Green Synthesis of Bimetallic Au/Ag Nanostructures Using Aqueous Extract of Eichhornia Crassipes for Antibacterial Activity. Bionanoscience 2022, 12, 322–331. [Google Scholar] [CrossRef]
- Lara-Serrano, J.S.; Rutiaga-Quiñones, O.M.; López-Miranda, J.; Fileto-Pérez, H.A.; Pedraza-Bucio, F.E.; Rico-Cerda, J.L.; Rutiaga-Quiñones, J.G. Physicochemical Characterization of Water Hyacinth (Eichhornia crassipes (Mart.) Solms). BioResources 2016, 11, 7214–7223. [Google Scholar] [CrossRef]
- Tovar-Jiménez, X.; Favela-Torres, E.; Volke-Sepúlveda, T.L.; Escalante-Espinosa, E.; Díaz-Ramírez, I.J.; Córdova-López, J.A.; Téllez-Jurado, A. Influence of the Geographical Area and Morphological Part of the Water Hyacinth on Its Chemical Composition. Ing. Agrícola y Biosist. 2019, 11, 39–52. [Google Scholar] [CrossRef]
- Anagbonu, P.; Ghali, M.; Allam, A. Low-Temperature Green Synthesis of Few-Layered Graphene Sheets from Pomegranate Peels for Supercapacitor Applications. Sci. Rep. 2023, 13, 15627. [Google Scholar] [CrossRef]
- Xue, Y.; Qiu, X.; Wu, Y.; Qian, Y.; Zhou, M.; Deng, Y.; Li, Y. Aggregation-Induced Emission: The Origin of Lignin Fluorescence. Polym. Chem. 2016, 7, 3502–3508. [Google Scholar] [CrossRef]
- Gong, J.; Li, J.; Xu, J.; Xiang, Z.; Mo, L. Research on Cellulose Nanocrystals Produced from Cellulose Sources with Various Polymorphs. RSC Adv. 2017, 7, 33486–33493. [Google Scholar] [CrossRef]
- French, A.D. Idealized Powder Diffraction Patterns for Cellulose Polymorphs. Cellulose 2014, 21, 885–896. [Google Scholar] [CrossRef]
- Chaiwarit, T.; Chanabodeechalermrung, B.; Kantrong, N.; Chittasupho, C.; Jantrawut, P. Fabrication and Evaluation of Water Hyacinth Cellulose-Composited Hydrogel Containing Quercetin for Topical Antibacterial Applications. Gels 2022, 8, 767. [Google Scholar] [CrossRef] [PubMed]
- Jadhav, R.H.; Dey, A. Pre-Treatment and Characterization of Water Hyacinth Biomass (WHB) for Enhanced Xylose Production Using Dilute Alkali Treatment Method. Water 2025, 17, 301. [Google Scholar] [CrossRef]
- Megersa, S.; Tolessa, A. Enhancing Yields of Pleurotus Ostreatus and Lentinula Edodes Mushrooms Using Water Hyacinth (Eichhornia crassipes [Mart.] Solms) Supplemented with Locally Available Feedstock as Substrate. Heliyon 2024, 10, e39113. [Google Scholar] [CrossRef] [PubMed]


Disclaimer/Publisher’s Note: The statements, opinions and data contained in all publications are solely those of the individual author(s) and contributor(s) and not of MDPI and/or the editor(s). MDPI and/or the editor(s) disclaim responsibility for any injury to people or property resulting from any ideas, methods, instructions or products referred to in the content. |
© 2025 by the authors. Licensee MDPI, Basel, Switzerland. This article is an open access article distributed under the terms and conditions of the Creative Commons Attribution (CC BY) license (https://creativecommons.org/licenses/by/4.0/).