Article

Biosynthetic Gene Clusters and Liquid Chromatography Coupled to Mass Spectrometry Analysis of Aryl Polyene Pigments from Chryseobacterium sp. kr6 and Lysobacter sp. A03

by
Maria Elisa Pailliè-Jiménez
1,
Jamile Queiroz Pereira
1,
Eliseu Rodrigues
2 and
Adriano Brandelli
1,3,*
1
Laboratory of Nanobiotechnology and Applied Microbiology, Department of Food Science, Universidade Federal do Rio Grande do Sul, Porto Alegre 91501-970, Brazil
2
Laboratory of Phenolic Compounds, Department of Food Science, Universidade Federal do Rio Grande do Sul, Porto Alegre 91501-970, Brazil
3
Center of Nanoscience and Nanotechnology, Universidade Federal do Rio Grande do Sul, Porto Alegre 91501-970, Brazil
*
Author to whom correspondence should be addressed.
Colorants 2025, 4(1), 1; https://doi.org/10.3390/colorants4010001
Submission received: 5 October 2024 / Revised: 3 December 2024 / Accepted: 5 December 2024 / Published: 2 January 2025

Abstract

:
Aryl polyene (APE) are bacterial pigments which show great biotechnological potential because of their biological activities. In this study, the presence of gene clusters associated with APE synthesis was investigated in the genome of Chryseobacterium sp. kr6 and Lysobacter sp. A03. The pigments extracted from strains kr6 and A03 were further characterized by liquid chromatography coupled to a high-resolution mass spectrometer (LC-DAD-MS). These bacteria harbor the relevant genes for APE biosynthesis; while kr6 may produce flexirubin pigments and have a 75% similarity with the flexirubin cluster from Flavobacterium johnsoniae UW101, Lysobacter sp. A03 showed a 50% similarity with the xanthomonadin I gene cluster from Xanthomonas oryzae pv. oryzae. A comparison with the gene clusters of APE-producing bacteria revealed that kr6 and A03 harbor genes for key proteins that participate in APE biosynthesis, such as acyl carrier proteins, acyl dehydratases and acyl reductases. The LC-DAD-MS analysis revealed that kr6 produces a possible mixture of flexirubins, whereas the yellow pigment from A03 is proposed to be a xanthomonadin-like pigment. Although the fine molecular structure of these pigments are not yet fully elucidated, strains kr6 and A03 present great potential for the production of natural bioactive pigments.

Graphical Abstract

1. Introduction

Pigmented bacteria are quite common in nature, presenting great variability in color, caused by their heterogeneous chemical composition. The importance of some bacterial pigments has received increased attention because of their bioactive properties [1,2,3,4]. The aryl polyenes (APEs) are a class of bacterial pigments, which are still poorly investigated and could be applied in the food, pharmaceutical, nutraceuticals, and cosmetics industries. These compounds could act as sunscreens, protecting the skin from UV rays, and have antioxidant capacity, protecting against lipid peroxidation [5,6,7]. Additionally, other benefits to human health, especially against chronic and degenerative diseases caused by oxidative stress, namely cancer and cardiovascular diseases, have been reported [8,9,10].
Most described APEs differ mainly with regards to levels of methylations and bromine radicals or APEs esterified with dialkyl resorcinol (APE-DAR) compounds [7,9,11,12]. The elongation step in fatty acid synthesis uses a series of reactions involving specific beta-ketoacyl synthases, beta-ketoacyl reductases, beta-hydroxy dehydratases, and ACP enzymes, which have been found in the genetic clusters of APE-DAR bacterial pigment producers. Some metabolic routes have been proposed with the intention of elucidating the puzzle for the production of pigments from the APE group, such as xanthomonandins and flexirubins [12,13,14].
Moreover, there is little information in the literature about the pigment profiles of the Chryseobacterium and Lysobacter species, and the structure of their typical flexirubin or xanthomonadin APEs is still unknown. Despite all the potential, the effective utilization of these microbial pigments is hampered by a lack of knowledge on the biosynthetic gene clusters (BGCs) and chemical structure of the molecules that make up these pigments. Chryseobacterium sp. kr6 and Lysobacter sp. A03 are keratinolytic and pigmented bacteria belonging to the flavobactereacea and xhantomonadacea families, respectively. These bacteria present great biotechnological potential due to their production of bioactive pigments [15,16].
Thus, additional investigation is necessary to identify and unveil the pigmented bioactive molecules produced by bacteria, in particular, for strains Chryseobacterium kr6 and Lysobacter A03, which are the subject of the present study. Omics technologies open new possibilities to explore the vast number of secondary metabolites that may have an industrial interest as natural products, including microbial pigments [17]. Genomic analysis allows for the searching for BGCs related to the aryl polyene pathway, supporting the characterization of pigments produced under laboratory conditions. Therefore, the aim of this study was to accomplish a comparative genome search for BGCs related to APE biosynthesis in strains kr6 and A03. Moreover, pigment extraction and analysis were performed using high performance liquid chromatography coupled to a high-resolution mass spectrometer (LC-DAD-HR-MS) as an auxiliary analytical method to elucidate the chemical structures.

2. Materials and Methods

2.1. Bacterial Strains and Media

Chryseobacterium sp. kr6 and Lysobacter sp. A03 were isolated, respectively, from chicken feathers [18] and penguin feathers [19]. The strains were retrieved from the Laboratory of Biochemistry and Applied Microbiology (ICTA, UFRGS, Porto Alegre, Brazil) and conserved in BHI broth containing 20% (v/v) glycerol at −20 °C. The isolates were grown in BHI medium for 24 h at 30 °C for kr6 and 48 h at 25 °C for A03, on a rotary shaker at 125 rpm. After a while, the biomass was scraped and disposed in a small glass petri dish for oven drying at 30 °C for 24 h.

2.2. Genome Mining

Whole genomes of Lysobacter sp. A03 and Chryseobacterium sp. kr6 were sequenced using an Illumina® MiSeq System to create both 2 × 250 and 2 × 150 paired-end reads with the Illumina v2 reagent kit (Illumina, San Diego, CA, USA), followed by quality-based read trimming, as detailed elsewhere [20]. After quality checking with FastQC [21], the reads were assembled using the SPAdes [22] toolkit. The best assembly was chosen based on Quast 4.0 [23] statistics, considering the number of contigs, the mean contig length, the N50, the number of contigs greater than 1 Kb, and the maximum contig length. For automatic gene annotation, contigs obtained for the A03 and kr6 strains were submitted to the RAST server [24]. Genes of interest had their annotations refined manually. The same contigs used for RAST annotation were submitted to the antiSMASH version 7.0 [25] online pipeline for secondary metabolites biosynthetic gene clusters identification. The genome sequences and gene annotations are available at the NCBI and EMBL databases under the accession number GCA_000855665.1 for A03 and GCA_029624615.1 for kr6.

2.3. Pigment Extraction

The dried and frozen bacterial biomass was macerated with acetone (2–3 mL) until a fine dry powder was obtained; it was then placed in a glass tube, suspended in acetone (1:1, w/w biomass/acetone ratio), and subjected to ultrasound extraction (30 min, frequency 40 kHz, power 250 W) using a USC 700 apparatus (Unique, Americana, Brazil). The extraction was repeated until the biomass was colorless [15]. The samples were centrifuged at 16,000× g for 5 min at 10 °C. The supernatant containing the pigment was collected with a glass pipette in a test tube, in the dark, followed by filtration (0.22 µm PTFE membranes) to remove any debris, and finally dried with nitrogen and stored at −10 °C.

2.4. Spectrophotometry

The electromagnetic spectrum was obtained using a UV 1900i spectrophotometer (Shimadzu, Kyoto, Japan). The spectrophotometric scan was performed in the range 200–600 nm to determine the maximum absorption wavelength (λmax) of the pigments. The dried pigments were diluted in 5 mL acetone and the pure solvent was used as background.

2.5. LC-DAD-MS Analysis

A HPLC apparatus connected in series to a DAD detector (SPD-M20A model, Shimadzu, Kyoto, Japan) and a mass spectrometer (MS) with a quadrupole time-of flight (QTOF) analyzer and an electrospray ionization source (ESI) (micrOTOF-Q III model, Bruker Daltonics, Bremen, Germany) was used to characterize the chemical structure of the pigments. The extract was solubilized in acidified methanol before the analysis to help maintain the compounds in their protonated form. The compounds were separated on a 5 μm, 250 × 4.6 mm C18 column (Merck, Darmstadt, Germany) with a flow rate of 0.7 mL min−1 at 29 °C, using a water/formic acid (99.5:0.5, v/v) (solvent A) and methanol/water solution (70:30, v/v), and formic acid (99.5:0.5, v/v) (solvent B) in a linear gradient from A/B 80:20 (v/v) to 0:100 (v/v) in 30 min; then from 0:100 (v/v) to 80:20 (v/v) in 5 min. The former ratio (80:20, v/v) was maintained for an additional 5 min. After the separation of the pigments in the column, the eluate was partitioned using a T-shaped connection to allow only 0.35 mL min−1 to enter the ESI interface. The ESI source was operated under the following conditions: negative and positive modes, capillary voltage: 3000 V, scan range of m/z 50 to 1000, dry temperature and gas flow (N2): 310 °C and 8 L min−1, nebulizer gas pressure: 4 bar. MS2 spectra were acquired in Auto-MS2 mode (data-dependent acquisition). The exploration for pigments from LC-DAD-MS/MS data followed three approaches: (a) manual analysis, searching for similar pigments in the literature; (b) library-based identification, using Global Natural Products Social Molecular Network (GNPS; https://gnps.ucsd.edu/; (accessed on 26 September 2024)) to search across various MS/MS libraries; and (c) in silico analysis, utilizing Sirius 5.6.3 (Lehrstuhl Bioinformatik; https://bio.informatik.uni-jena.de/software/sirius/; (accessed on 30 September 2024)).

3. Results and Discussion

3.1. Identification of Biosynthetic Gene Clusters

The antiSMASH analysis of bacterial genomes from strains kr6 and A03 revealed the predictable existence of essential gene clusters for pigment synthesis as secondary metabolites (Figure S1). In general, the presence of genes in a genetic cluster is considered when there is more than 65% identity with the reference sequence(s), and more than 85% of coverage are observed [26]. Gene clusters from both kr6 and A03 were analyzed and compared with previously published data. Using different methodologies, some researchers have found core genes for the synthesis of aryl polyene pigments esterified with resorcinol (APE-DAR), showing a strong resemblance to fatty acid synthetases (FAS). Methodologies such as gene deletion, isotope labeling, and the comparison of crystal structures of each enzyme have been applied to know their function and to find the exact key enzyme(s) to obtain these interesting chromophores [12,13,14,27].
The pigments and genes identified so far for strains kr6 and A03 suggest that they are APE-DAR, where colonies from kr6 and its orange pigment tested positive for KOH, indicating the presence of flexirubin pigment [15], but negative for the yellow A03 pigment [16]. Despite possible sequence gaps in kr6 and A03 genomes, it was possible to find the APE-DAR genes already described for the synthesis of aryl polyenes, confirming the wide spread of gene clusters for APE biosynthesis in bacterial taxa [5,9,12,14].
Although biosynthetic gene clusters (BCG) for flexirubin-type pigments have been described for some Chryseobacterium strains [28], the association and comparison with the ape cluster for a species of the Chryseobacterium genus are described for the first time in this work. The APE-DAR cluster for flexirubin-type pigments of kr6 exhibited a high similarity (75%) to that found in Flavobacterium johnsoniae UW101 (Figure 1) but showed less than 45% similarity with two other APE clusters of Chitinophaga pinensis DSM 2588 and Escherichia coli CFT073. Similar to F. johnsoniae, the first gene of the kr6 ape cluster encodes an AMP binding enzyme belonging to the phenylacetate-CoA ligase family. One gene encodes a putative enzyme from the aromatic amino acid lyase family, histidine ammonia lyase (HAL), different from the tyrosine ammonia-lyases (TAL) from the C. pinensis gene cluster [29], as the possible initiation of flexirubin pigment synthesis. Further investigation is warranted to explore the functional implications and adaptive significance of these conserved gene clusters in different bacterial species.
As observed in the previous study [16], the cluster of Lysobacter A03 shares a 50% similarity with Xanthomonas oryzae pv. oryzae; seven non-core genes are shared between these two bacteria of different genera (Figure 1B). Specifically, 3-oxoacyl ACP synthase FabV appears to have significant alignments with the beta-ketoacyl-(aryl carrier protein) synthase family protein. It exhibited a 100% alignment with Lysobacter A03 from GenBank, and also displayed a high similarity with genes from Lysobacter species and other bacteria (Supplementary Figure S2).
The resorcinol cluster in A03 does not overlap or locate near the aryl region and includes an acyltransferase family protein and the core gene for biotin synthesis protein BioZ [16]. NCBI blastP analysis revealed a 100% identity between StlD/DarB family beta ketosynthase from A03 and 3-oxoacyl ACP synthase III C-terminal domain-containing protein sequences from L. avium and L. cicociane. In the case of α-proteobacteria, a putative gene bioZ, encoding a 3-ketoacyl ACP synthase (condensing enzyme-like), has been associated with the biotin ring-forming genes [30]. The 3-ketoacyl ACP synthase III (KAS III) proteins, which catalyze the initial elongation/condensation in the fatty acid synthesis pathway, are often annotated as FabH proteins. However, a valid fabH gene could be found elsewhere in the genomes within a cluster of fatty acid and phospholipid synthesis genes [31].

3.2. Comparative Analysis of BGCs

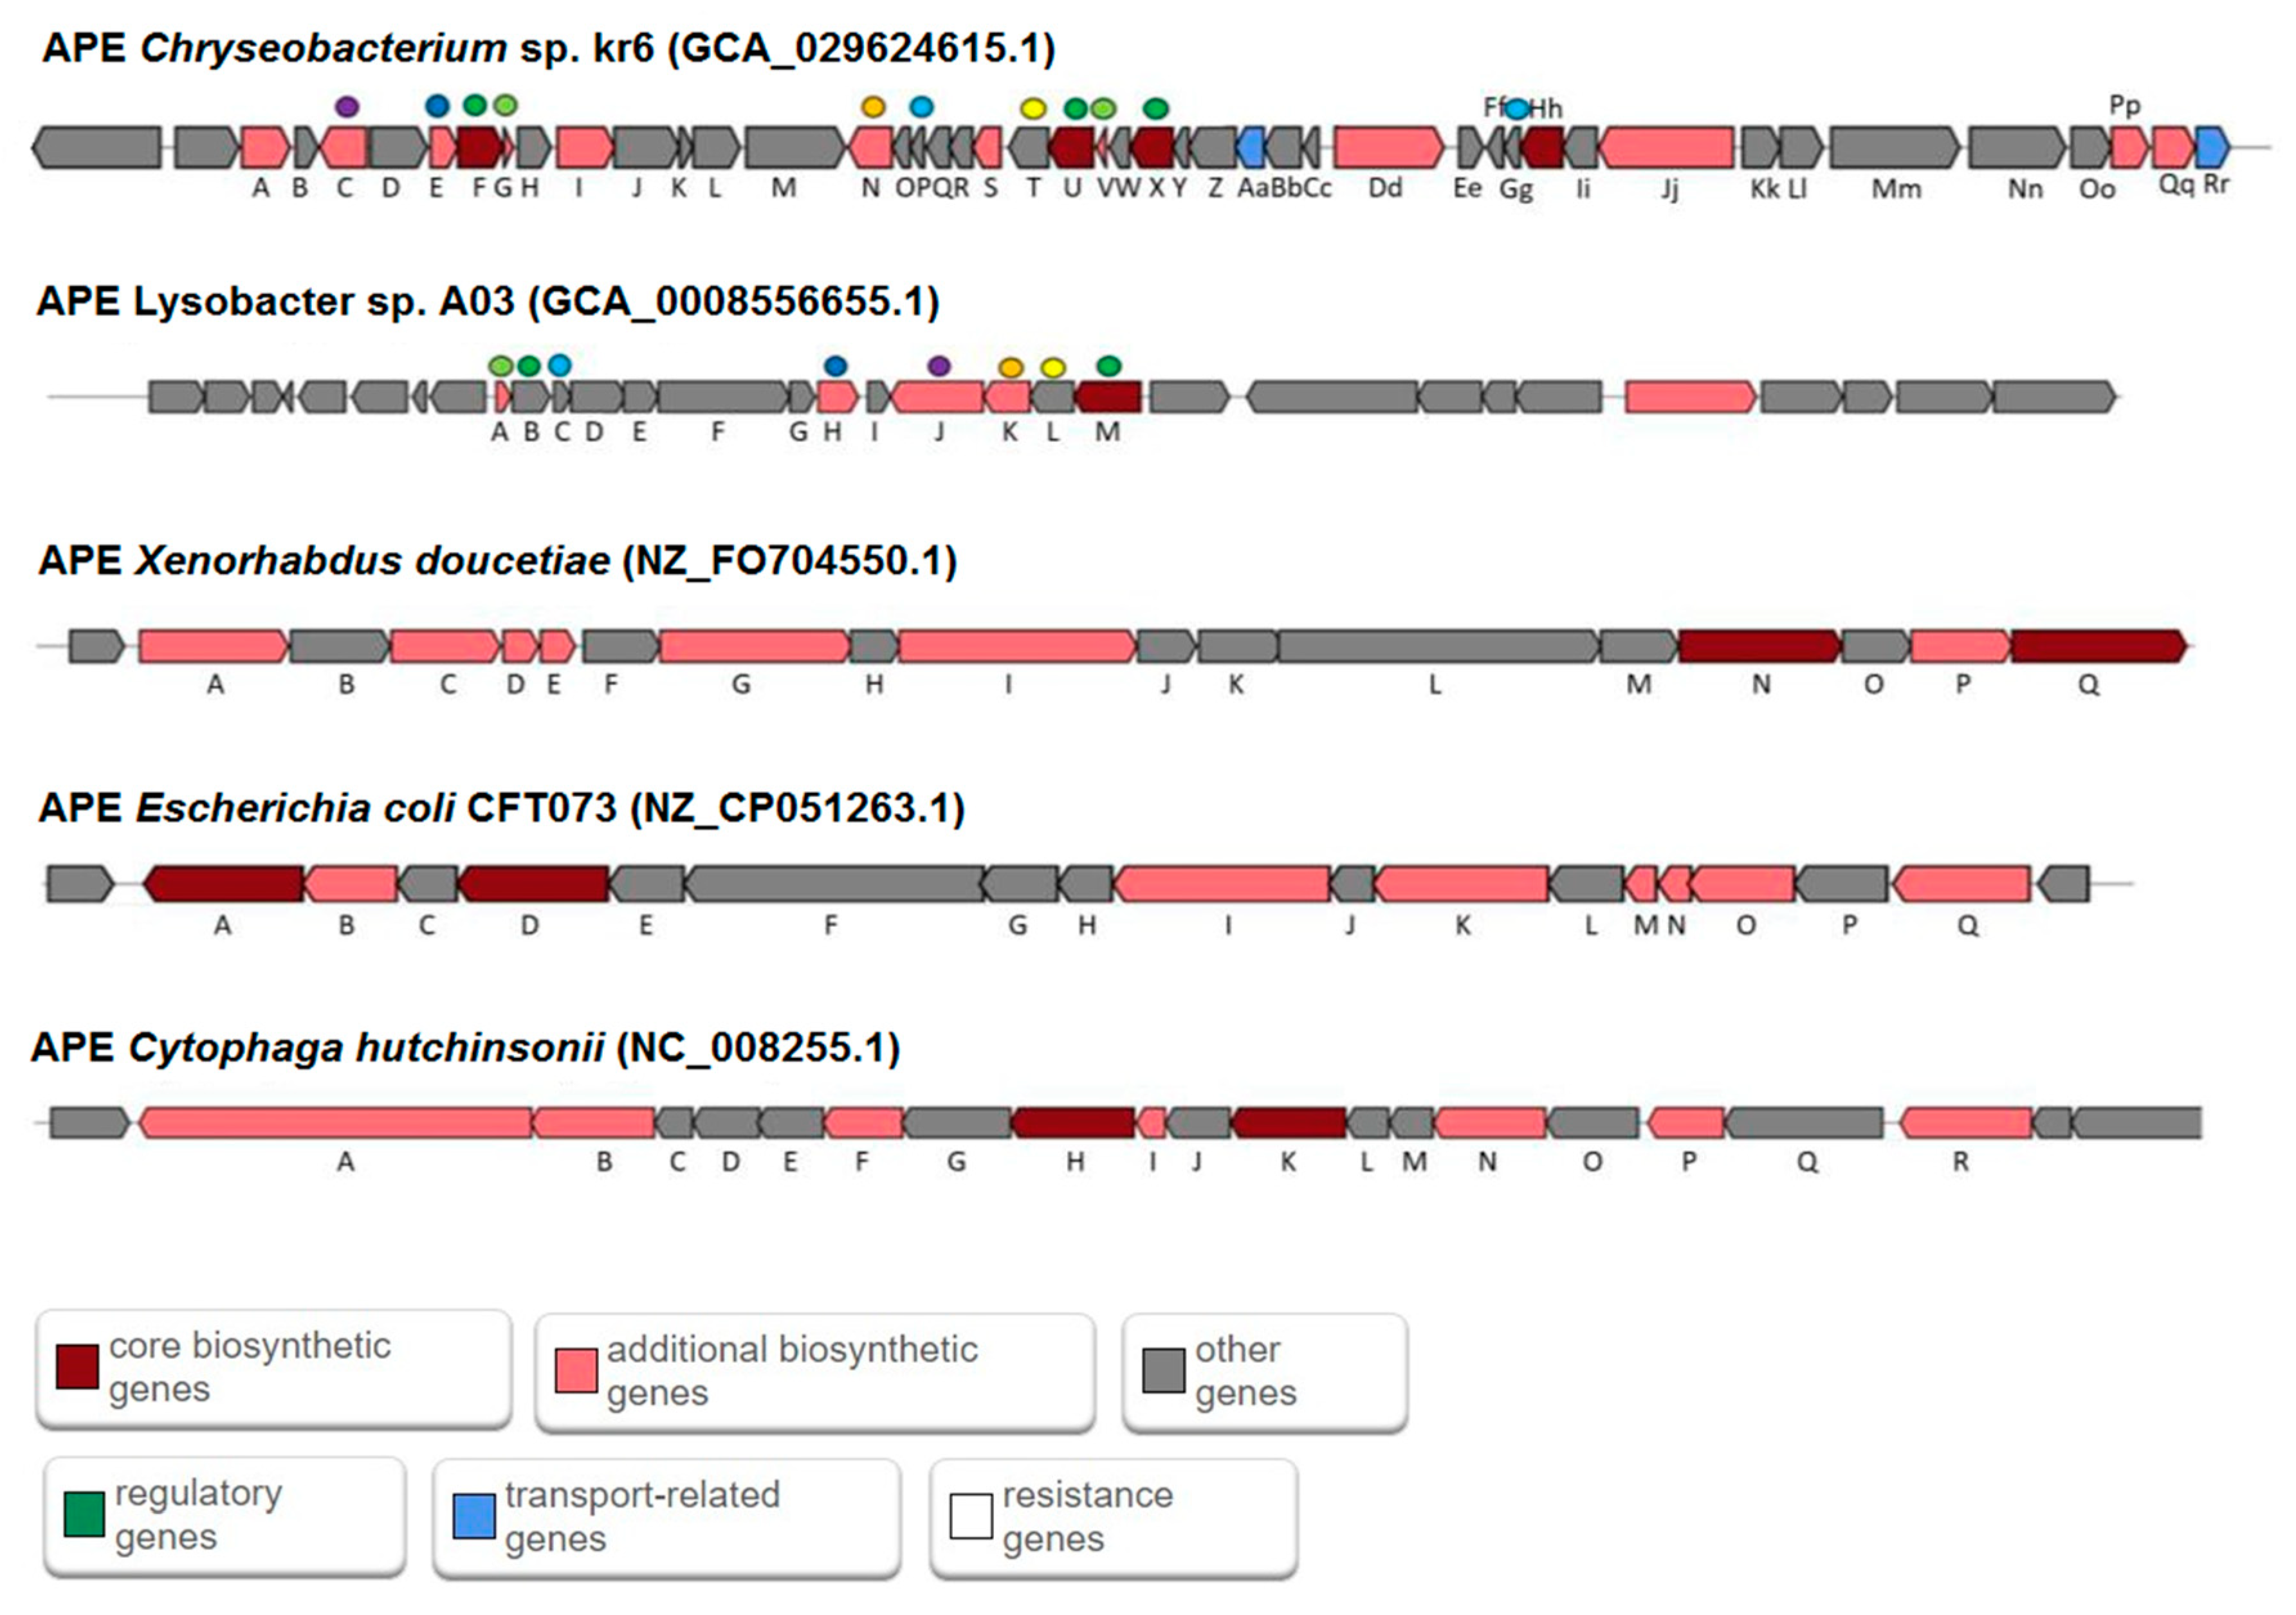
Data from Figure 2 and Table S1 permit the visualization of the different arrangements, sizes and names of the enzymes of APE-DAR clusters of the pigment-producing bacteria, Chryseobacterium sp. kr6 and Lysobacter sp. A03, from the genes responsible for biosynthesis to those related with transport to the pigmented membrane. Other APE producing bacteria were included for comparison, as the key enzymes that participate in the synthesis of APE in bacteria have been described in studies using Xenorhabdus doucetiae [14], Cytophaga hutchinsonii [7] and Escherichia coli [12]. Interestingly, the APE BCG from kr6 have more encoding genes predicted for synthesis and intracellular transport as compared with the other strains (Figure 2).
Both strains kr6 and A03 have acyl carrier proteins (ACP) genes in their respective BGCs (Figure 2 and Table S1). Lysobacter A03 has a single ACP gene, while Chryseobacterium kr6 showed two ACP genes, whose role remains unclear. These genes are not in tandem with those found in E. coli and X. doucetiae [12,13,14], which also share the same genes, but in different transcriptional orientation. The combined action of two keto-synthases, CLF-KS and an ACP, results in the formation of octaketides, which cyclize via aromatase/cyclases, to yield polyketides as actinorhodin, for example [13].
FabG, ketoreductase, and 3-oxoacyl ACP reductase were identified in the kr6 and A03 BGCs. FabG3 was an essential enzyme for growth, but not for FAS [32]. FabG is believed to play a role in the elongation step of both flexirubin and xanthomonadin pigments. Crystallography studies of the β-ketoacyl ACP reductase from the ape BGC in A. baumannii revealed distinct surface electrostatic potential profiles, making it incompatible with the FabG reductase from the FAS gene cluster. These structural differences impact the ACP binding-site [13]. The unique reductase in the ape cluster, compared to FAS, offers valuable insights into understanding host–pathogen interactions and the development of novel antimicrobial drugs [13,14].
The kr6 strain contains darA and darB genes in its BGC, as described in C. pinensis (a flexirubin producer) [29] and Azoarcus, known as a xhantomonadin-like (arcuflavin) producer [33]. The 2,5-dialkylresorcinols (DARs) are natural compounds found in various bacteria and fungi and have gained significant attention due to their diverse range of bioactivities. These bioactivities include antibiotic effects, free radical scavenging, and the stimulation of mammalian cell growth. DAR derivatives can also be part of flexirubin-type pigments, which are commonly found in proteobacteria and bacteria of the Cytophaga-Flavobacteria-Bacteroides (CFB) group [34,35]. DAR derivatives have been identified as bacterial signaling molecules involved in quorum sensing, a mechanism used by bacteria to coordinate behaviors such as biofilm formation, virulence, and antibiotic resistance [36].
The BGC from Chryseobacterium kr6 seems to be larger and more complex as compared to other previously described bacteria [28]. The overlap of APE and resorcinol BGCs have encoding genes for several proteins. Besides the synthases, dehydratase and reductase, the cluster has acyltransferases, hydrolases, permeases, metallopeptidases, deacetylases, membrane and transporter binding proteins. The 3-ketoacyl ACP synthase (also described as β-ketoacyl synthase III, 3-oxoacyl ACP synthase, 3-ketoacyl ACP synthase III), appeared as an enzyme in both A03 and kr6 BGCs. The APE BGC of kr6 showed six different genes encoding for ketosynthase, two genes encoding for the beta-ketoacyl ACP synthase family protein and two genes for beta-ketoacyl synthase N-terminal-like domain-containing proteins, 3-oxoacyl ACP synthase and beta-ketoacyl ACP synthase III.
Previous studies using E. coli [12] and X. doucetiae [14] as APE producers realized that conserved domains in the two acyltransferases meant that the molecular anchor could be a glycolipid. Moreover, the structure of the APE-containing lipid from X. doucetiae was solved [14]. The ape BGCs are extensively but discontinuously distributed among Gram-negative bacteria and harbor a core set of genes that include adenylation, ketosynthase (KAS), acyl/ glycosyltransferase, ketoreductase (FabG), dehydratase (FabA/FabZ), thiolation, and thioesterase domains, as well as an outer membrane lipoprotein carrier protein and an MMPL family transporter. The ape cluster associated with pigment production may be considered a virulence factor, depending on the nature of the bacteria, as described in Pseudomonas, Micrococcus, Acinetobacter baumannii, E. coli, among others [9,13,37], but also a mechanism of self-protection and prevention against photooxidation. In the case of Lysobacter and Chryseobacterium, the ape cluster has not been described as a virulence factor, but it seems to be associated with the biosynthesis of colored compounds that are important for the survival of these ubiquitous environmental organisms [5,28,38].

3.3. Analysis of Protein FabA/Z from Strains kr6 and A03

The fabA/Z gene, encoding a β-hydroxyacyl ACP dehydratase (3-hydroxymyristol dehydratase), has been described as essential for the synthesis of flexirubin molecules, by adding six to eight double bounds in the polyene chain of the orange pigment. Examples include bacteria like C. hutchinsonii, C. pinensis (cpin 1871) and F. johnsoniae (fjoh 1081) [7,12,14].
The dehydratase enzyme has two isoforms known as FabA (3-hydroxydecanoyl ACP dehydratase) and FabZ (3-hydroxyacyl ACP dehydratase) and some authors studied those enzymes, trying to discover their role and structural features. The cluster from strain kr6 has genes encoding for ACP dehydratases that seem to belong to FabZ isoforms’ non-forming heterodimer, as happens in E. coli CFT073 [12], X. doucetiae DSM 17909 [14] and A. baummanii [13]. In A03, genes encoding for both isoforms, namely FabA and FabZ, were detected and seem to form the described heterodimer between them.
According to the searches through antiSMASH and the automatic annotation performed by the RAST server, strain kr6 does not have genes for the FabA isoform of the enzyme, but, rather, two different forms of the FabZ type. The bacterium Lysobacter A03, on the other hand, has a gene identified as the FabA form and another as the FabZ form, a result corroborated by the verification of the automatic annotation of the RAST server and by the search for similar proteins in the Protein Data Bank (PDB) database. The FabA dehydratase of A03 showed a 71% identity with that belonging to Pseudomonas aeruginosa, with a 100% probability of homology between them. The alignment between the two sequences and the prediction of a secondary structure are presented in Figure S2. The comparison between the amino acid sequences of A03 FabA and kr6 FabZ indicates that the similarity between them is 28.6%, calculated according to the BLOSUM62 similarity matrix, implemented in the Bioedit program (Figure S3). Regarding the three-dimensional structure of FabA, the prediction was performed using as a template of the atomic coordinates of the crystal of P. aeruginosa (PDB No. C4b8uD).
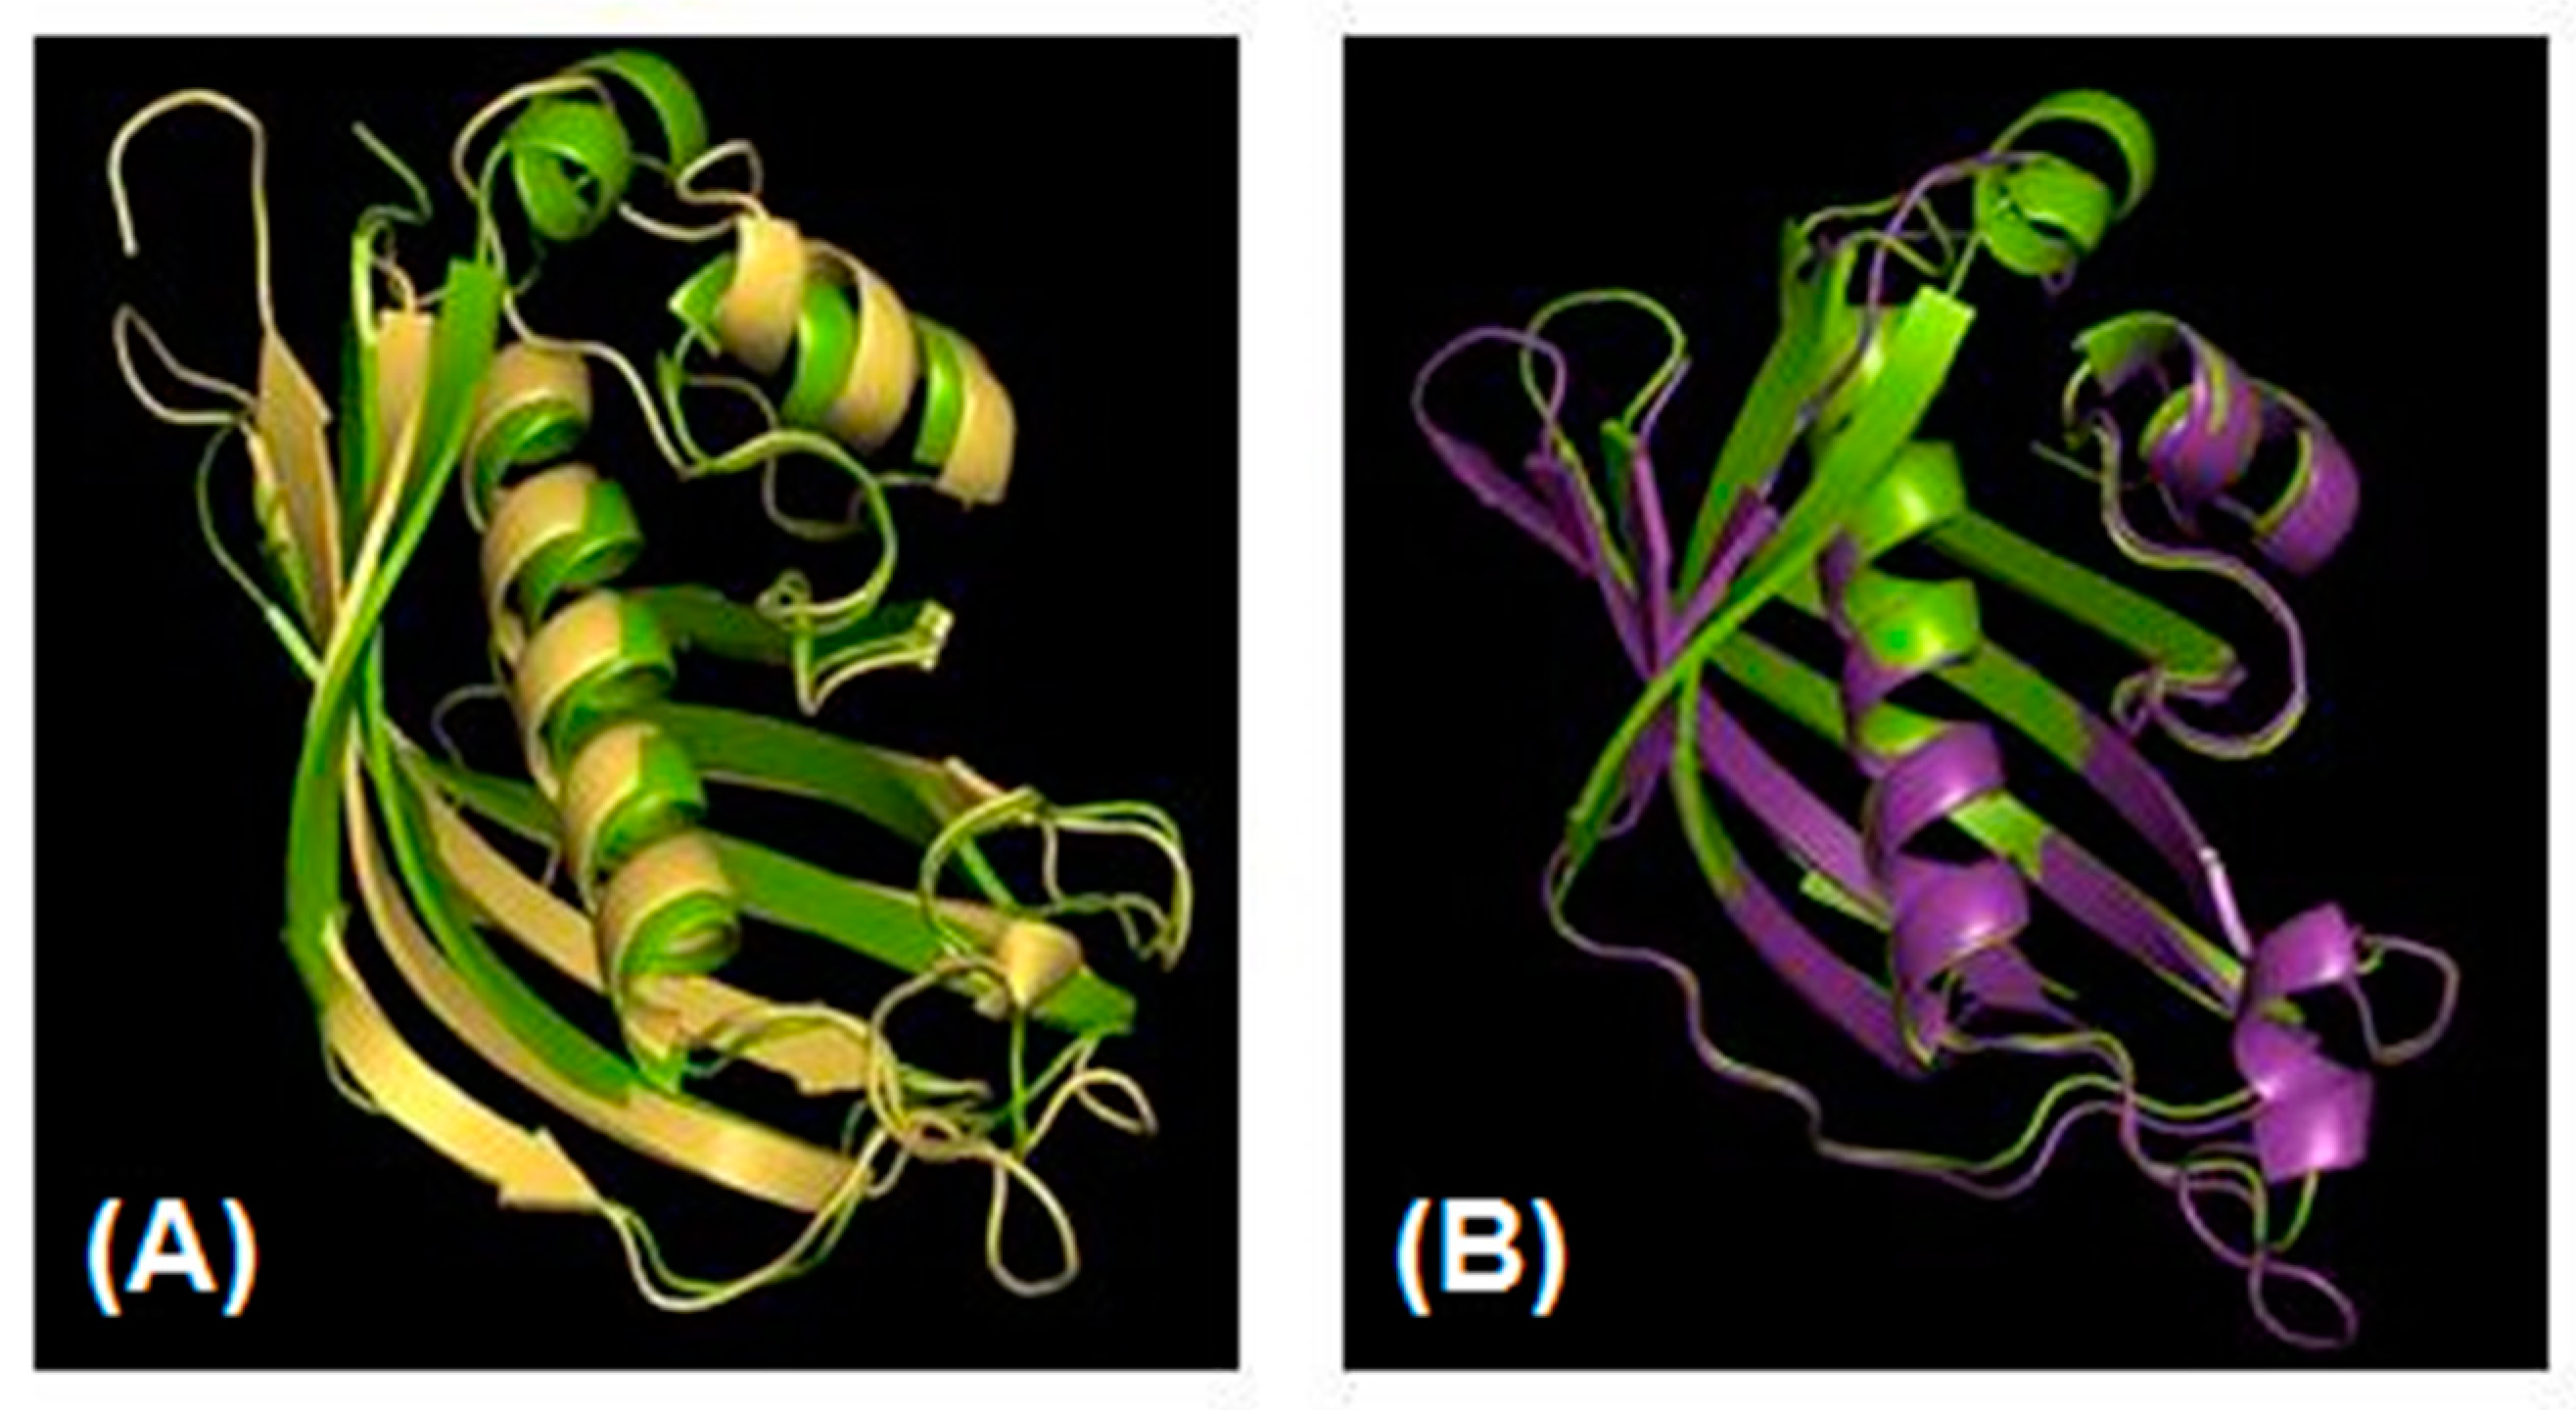
Despite the low calculated similarity between the two sequences, the alignment between the three-dimensional structures of FabA (A03) and FabZ (kr6) shows extensive spatial similarity between the two proteins (Figure 3A), both formed by five main beta-sheets and two alpha-helices, connected by loops. Likewise, the alignment between the FabZ amino acid sequences of A03 and kr6 showed low similarity, around 30% (Figure S3). However, the superposition of the three-dimensional models of the two enzymes (Figure 3B) showed a strong correspondence between the enzymes, with a very similar conformation to that seen between FabA (A03) and FabZ (kr6).
Lastly, a study using X. doucetiae as a bacterial model described the APE lipid pigment and proposed that both FAS and APE biosynthetic pathways interact with each other [14]. The APE and FAS pathways act together in one way or another, sharing substrates and products that feed both metabolic pathways. Moreover, the metabolic pathways described from E. coli, A. baumannii, and X. doucetiae depict similar steps [12,13,14] which would occur in kr6 and A03 as well. Although we observe the involvement of enzymes that are not shared among all of the strains (e.g., acyl ACP synthetase, methyltransferase), this still results in the biosynthesis of aryl polyene pigments.

3.4. UV-Vis Spectroscopy and LC-DAD-MS Analysis

The pigments extracted from strains kr6 and A03 were analyzed by scanning with UV-Vis spectroscopy, and the electromagnetic spectra showed λmax values at 448 and 414 nm, respectively (Figure 4). These results are in agreement with preliminary characterization of flexirubin-like pigments from strain kr6 [15], while a yellow xanthomonadin-like pigment seems to be produced by A03 [16]. The pigments were further analyzed by LC-DAD-MS in order to obtain additional information about their chemical structures.
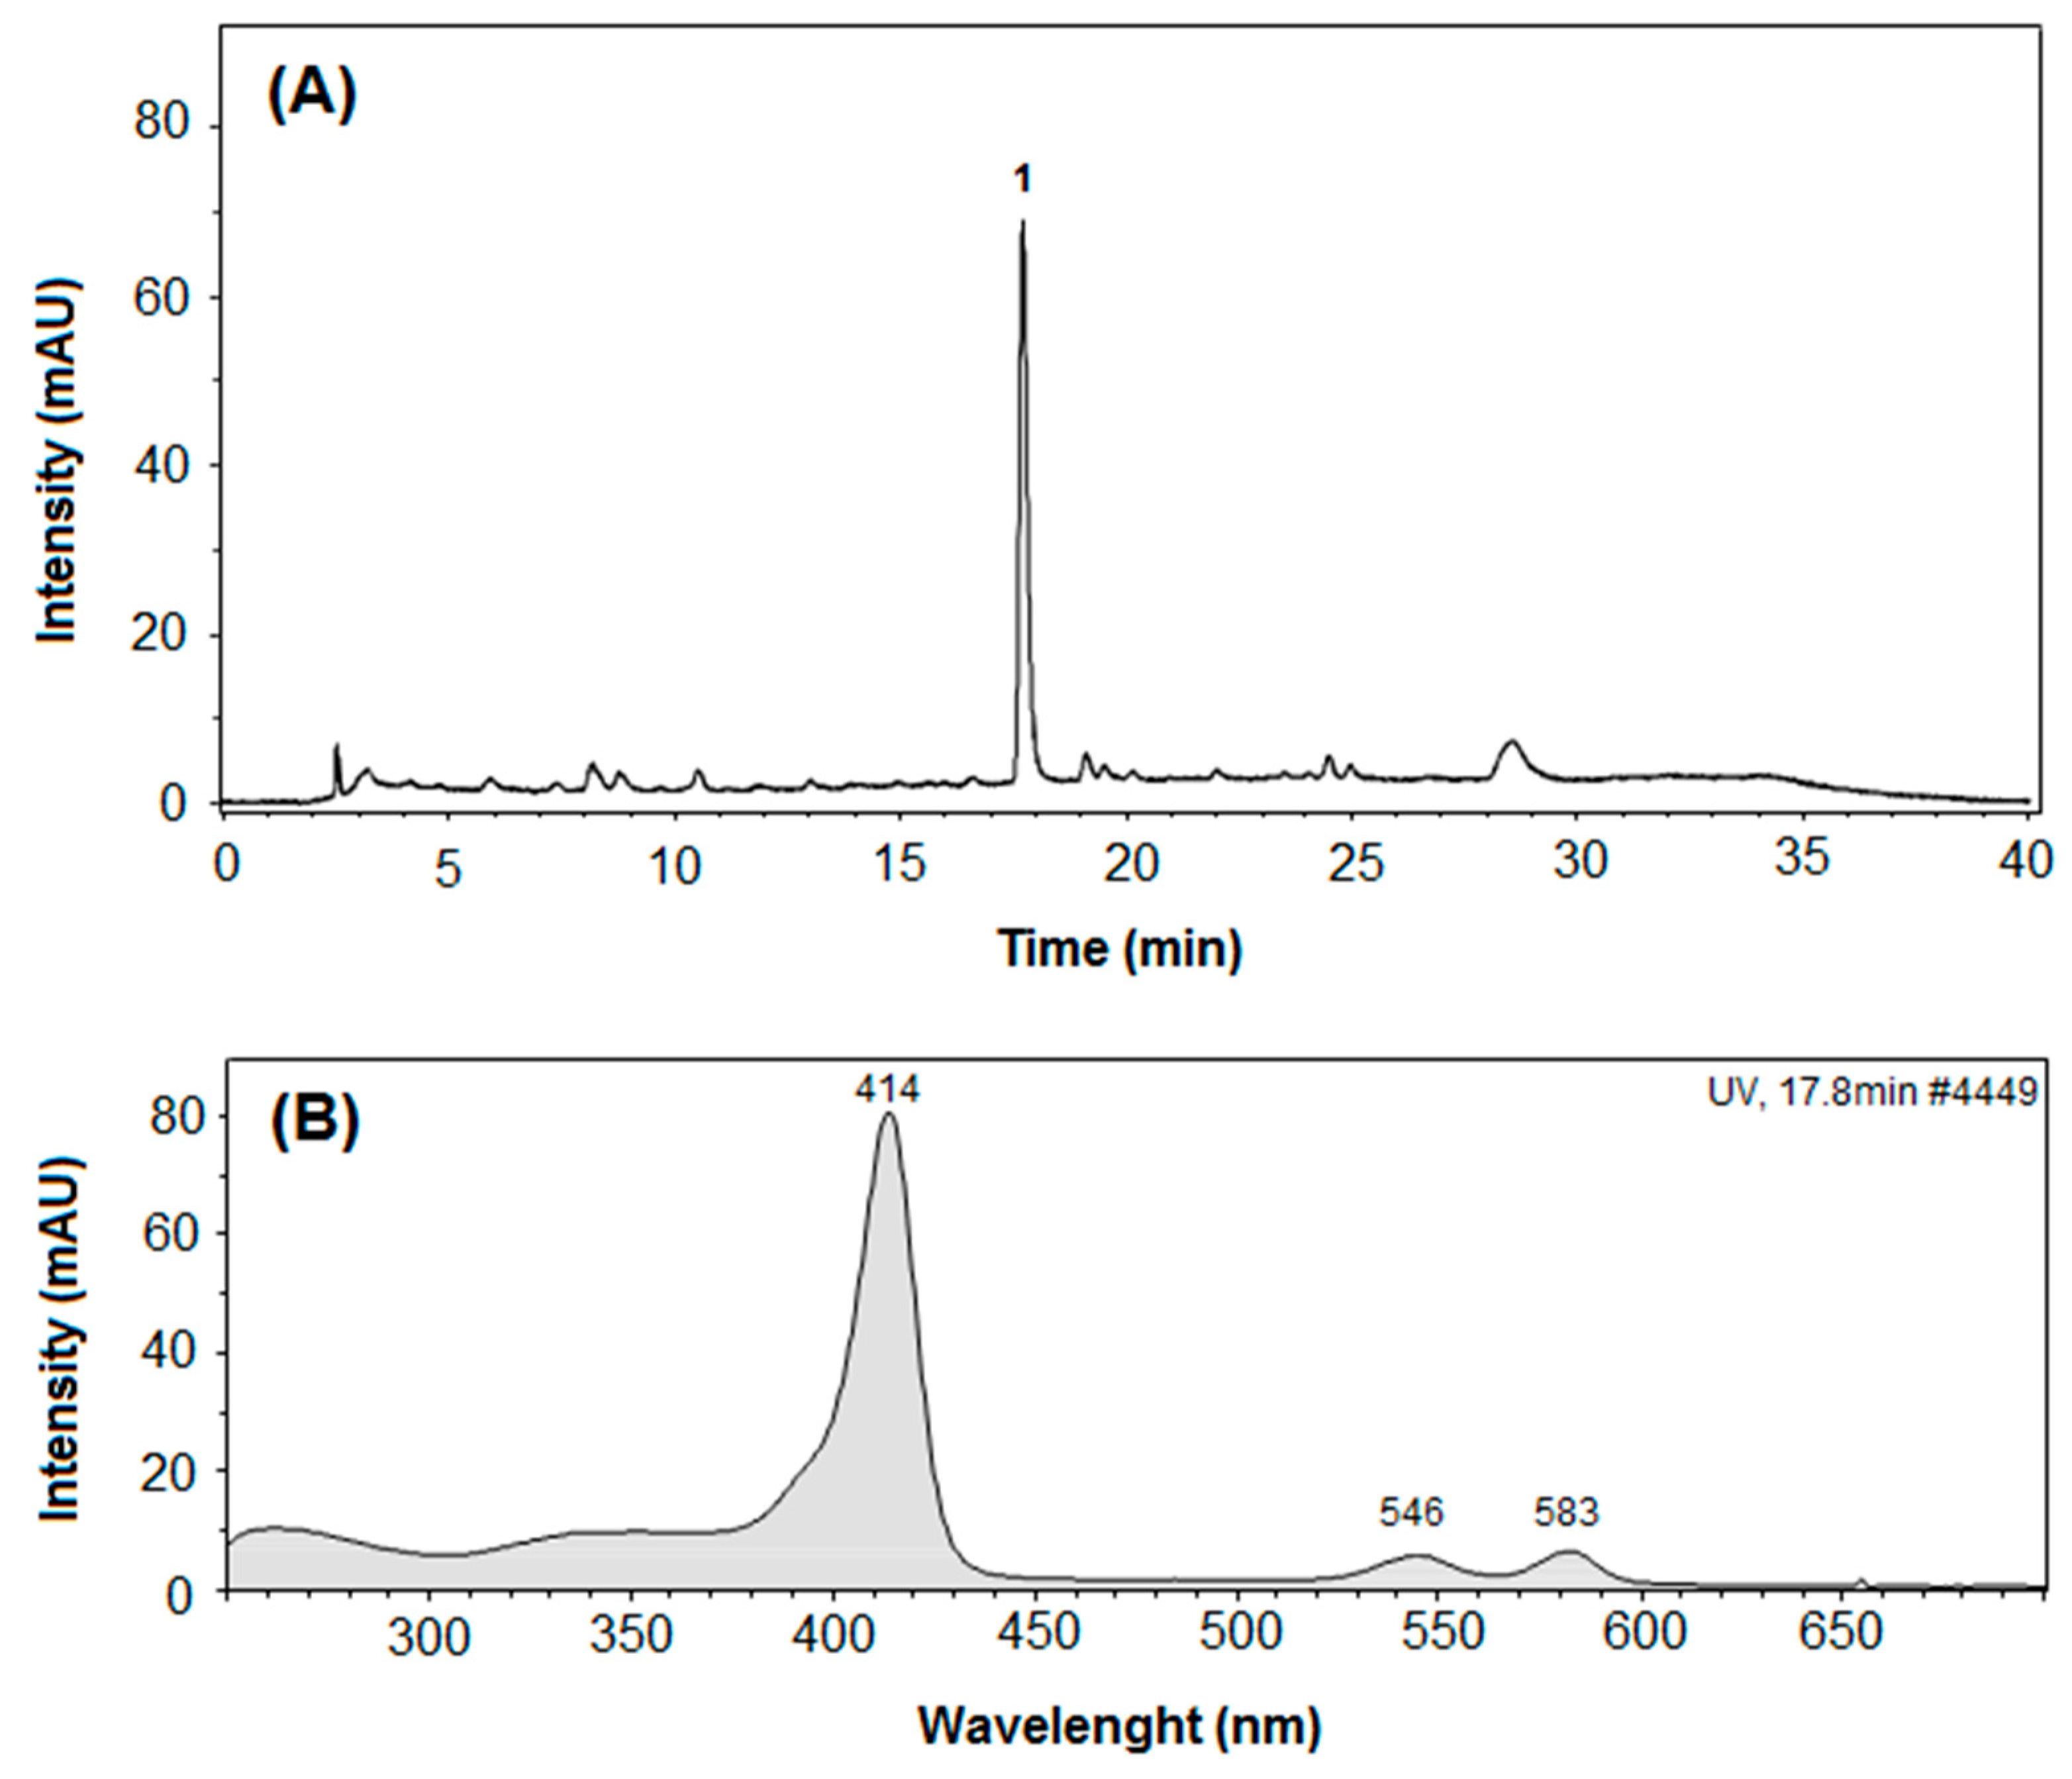
The chromatographic and mass spectrometry data of the pigment obtained from strain A03 are presented in Table 1 and Figure 5A. Peak 1, which represents over 70% of the compounds, has a λmax at 414 nm and less intense absorption peaks at 546 and 583 nm (Figure 5B). This result corroborates the UV-vis spectroscopy data (Figure 4) and the weak absorption bands above 500 nm resemble the Q bands described for porphyrins [39], which may suggest that more than one molecule formed the pigment in A03. The absorption spectrum of Figure 5B closely matches that of metal porphyrins, such as Zn(II)uroporphyrin [40]. In the negative ionization mode, the mass spectrum showed two deprotonated molecules [M-H] at m/z 721.5511 and 733.5500. MS2 spectrum from m/z 721.5511 showed two intense signals at m/z 241.2185 and 269.2484 corresponding to deprotonated pentadecanoic and heptadecanoic acids. MS2 spectrum from m/z 733.5500 showed two intense signals at m/z 267.2331 and 281.2492 corresponding to deprotonated heptadecenoic acid and octadecenoic acids. The mass spectrometry data do not match that of Zn(II)uroporphyrin, but the absorption spectrum suggests that peak 1 in the A03 pigment contains a metal porphyrin derivative [39]. A further analysis of the A03 dataset using the GNPS library revealed that the m/z 721 ion could be successfully annotated as 1-pentadecanoyl-2-heptadecanoyl-sn-glycero-3-phospho-(1′-sn-glycerol), a phospholipid. However, this molecule lacks specific chromophores in its structure that could account for the observed color of A03. Although it was not possible to define the chemical structure of the pigment A03 from mass spectrometry data, a diversity of aryl polyene pigments has been proposed for different bacteria (Supplementary Table S2).
Xanthomonadins, identified as unique brominated aryl octane pigments, have been found to be distinct from carotenoids [27]. These pigments can be isolated as methyl or isobutyl esters, and their chemical composition has been determined through high-performance liquid chromatography (HPLC) and mass spectrometry (MS) analysis, revealing a molecular formula of C24H22O3Br2 for the specific ester (17-(4-bromo-3-methoxyphenyl)-17-bromo-heptadeca-2,4,6,8,10,12,14,16-octaenoic acid) [41]. For the pigment from Xanthomonas maltophilia ATCC 13637, the m/z value obtained was 384 [M + H]+, with the molecular formula C23H25O3Cl [42].
The m/z values already described for xanthomonadin-type pigments are around 608 [M + H]+, with the molecular formula C41H52O4, for the hybrid pigment xanthomonadin-diacyl-resorcinol described for Azoarcus with a major component eluted at 15.7 min, showing two λmax at 426 and 446 nm and a shoulder at 405 nm [33]. The xanthomonadin-type pigment from Variovorax paradoxus B4 revealed two colored compounds, one minor eluted at 15.5 min and a second at 15.7 min retention time [9]. The structure of the aryl polyene/dialkylresorcinol hybrid pigments of V. paradoxus B4 was elucidated by HPLC-UV-MS, MALDI-MS and NMR methodologies. Pigment 3 (m/z 608.4 [M]) showed a fragmentation pattern with analytical fragments of m/z 317 (APE fragment) and m/z 293 (DAR fragment). This is in accordance with the fragmentation pattern reported for arcuflavin A from Azoarcus sp. BH72 [33]. Pigment 6 (m/z 582.4 [M]) showed analytical fragments of m/z 291 (APE fragment) and m/z 293 (DAR fragment). Finally, it was concluded that the difference of one double bond in arcuflavin A and B probably suggests a relaxed specificity of the chain length control and/or the unknown enzyme connecting the APE with the DAR in V. paradoxus B4 [9]. Furthermore, P. aeruginosa can perform the heterologous expression of the Xcc PIG gene cluster (currently known as APE gene cluster), leading to the production of xanthomonadin-like pigments with halogenation modifications [11]. In addition to xanthomonadins, another class of yellow pigments called aryl polyene lipids (APELs) has been discovered, exhibiting a maximum UV absorption of around 430 nm and a mass range of m/z 1220–1350 [14]. APELs are characterized by their larger molecular mass compared to other aryl polyene chromophores, featuring an all-trans C26:5 conjugated fatty acyl and a galactosamine-phosphate-glycerol moiety. Because of their protective role against reactive oxygen species, these pigments potentially contribute to the virulence or symbiotic interactions in various ecological niches [14].
Despite the fact that different tools were used for the analysis of LC-DAD-MS/MS data, none of the peaks, even those of lesser intensity, obtained through mass spectrometry for strain A03 are close to the values related above, which could indicate a new xanthomonadin-type pigment or, eventually, a molecule of a different nature. The pigments under study are possibly undescribed, for which no reference data are available, rendering annotation by MS challenging. This suggests the presence of new pigments that need to be individually isolated for further characterization.
In the case of the kr6 pigment, 10 peaks were found with close retention times, showing maximum absorption wavelengths between 411 and 448 nm, and m/z between 393 and 700 (Table 2, Figure 6). This result indicates that the pigment extract from kr6 is probably a mixture of flexirubins that are very similar to each other, with slight differences in their molecular structure. It was not possible to assign a molecular structure based on UV-vis characteristics and MS data only.
The masses obtained were not found in the literature and databases, and detailed studies on the molecular structure of flexirubins that can be synthesized by bacteria are limited. It is possible that the quantity of genes found in the APE gene cluster of kr6 can explain the existence of a flexirubin mixture, as suggested by LC-MS/MS analysis.
Finally, a preliminary 1H-NMR analysis of the pigments extracted from strains A03 and kr6 showed strong signals between 1 and 3 ppm (Supplementary Figure S4), which are typical for H bound to saturated and allylic chains. However, the presence of clear peaks at 6–8 ppm and 11 ppm that might be expected for typical aryl polyenes [14,37] were not observed. The lack of full spectroscopic data, particularly detailed NMR data, has been considered a challenge in the characterization of aryl polyene pigments [14,43]. Moreover, these pigments are frequently mixtures whose detailed structures are still unknown, requiring future development of separation methods for the rigorous validation of their molecular assemblies [27]. Thus, additional studies are necessary to elucidate the exact chemical structures of A03 and kr6 pigments.
There are several proposals for the chemical structures of APE pigments, for various species of bacteria, and the structures present variations in the substituents such as methylations in aryl chains, number of double bonds, bonds with lipids, existence of bromine or chlorine, esterification, among others (Supplementary Table S2). Among discoveries of the metabolic pathway of APEs, proteins that participate in the biosynthetic routes and chemical structures continue to be proposed and are currently of interest to several authors [7,12,27,29,44]. The synthetic pathways for these APE pigments remain not yet fully elucidated and further studies focusing on specific enzymes are still needed. It could be that each species has their own mechanism, sharing similar gene clusters, with different proteins heterodimers, active sites and amino acid composition, and even different substrates for starting the reaction. As APE-DAR BGC is widely distributed, the variability of chemical structures of these pigments only tends to increase. However, the genetic information described until now is insufficient to help us understand the differences in the production of xanthomonadin or flexirubin specifically. Chemical analyses combined with omics approaches are powerful tools for understanding biosynthetic routes, thus providing important information that can be used to stimulate the production of these pigments for possible industrial uses [17,45].

4. Conclusions

A genome analysis of Chryseobacterium kr6 and Lysobacter A03 revealed the presence of gene clusters encoding for essential proteins that participate in the biosynthetic and transport pathways of APE pigments, confirming that those genes are not restricted to xanthomonas-like bacteria and are widespread. The mass spectrometry analysis suggests that strain kr6 possibly produces a mixture of flexirubins while strain A03 produces xanthomonadin-like pigments. Although the exact chemical structures of the pigments synthesized by Chryseobacterium kr6 and Lysobacter A03 was not fully elucidated, this study provides important insights on the complex biosynthetic pathways and structural features of bacterial APE.

Supplementary Materials

The following supporting information can be downloaded at: https://www.mdpi.com/article/10.3390/colorants4010001/s1, Figure S1: Gene clusters for biosynthesis of aryl polyenes (APE) and resorcinol; Figure S2: APE gene cluster of Lysobacter sp. A03 and ClusterBlast showing the regions from the antiSMASH database that are similar to the selected region; Figure S3: (A) Alignment between the FabA/Z protein sequences; Figure S4: 1H-NMR spectra of the pigments extracted from (a) Lysobacter A03 and (b) Chryseobacterium kr6. Table S1: Putative proteins encoded in bacterial APE BGCs of strains kr6 and A03 and other relevant strains; Table S2: Proposed chemical structures of aryl polyene pigments derived from different bacteria [46,47,48,49].

Author Contributions

Conceptualization, A.B. and M.E.P.-J.; methodology, M.E.P.-J. and E.R.; software, J.Q.P. and M.E.P.-J.; formal analysis, M.E.P.-J. and J.Q.P.; writing—original draft preparation, M.E.P.-J.; writing—review and editing, A.B.; supervision, E.R. and A.B.; funding acquisition, A.B. All authors have read and agreed to the published version of the manuscript.

Funding

This research was funded by the Conselho Nacional de Desenvolvimento Científico e Tecnológico (CNPq, Brazil), grant number 308880/2021-8. The APC was funded by MDPI.

Institutional Review Board Statement

Not applicable.

Informed Consent Statement

Not applicable.

Data Availability Statement

All related data and methods are presented in this paper. Additional inquiries should be addressed to the corresponding authors.

Conflicts of Interest

The authors declare no conflicts of interest.

References

  1. Venil, C.K.; Dufossé, L.; Devi, P.R. Bacterial pigments: Sustainable compounds with market potential for pharma and food industry. Front. Sustain. Food Syst. 2020, 4, 100. [Google Scholar] [CrossRef]
  2. De Mejia, E.G.; Zhang, Q.; Penta, K.; Eroglu, A.; Lila, M.A. The colors of health: Chemistry, bioactivity, and market demand for colorful foods and natural food sources of colorants. Annu. Rev. Food Sci. Technol. 2020, 11, 145–182. [Google Scholar] [CrossRef] [PubMed]
  3. Sajjad, W.; Din, G.; Rafaq, M.; Iqbal, A.; Khan, S.; Zada., S.; Ali., B.; Kang., S. Pigment production by cold-adapted bacteria and fungi: Colorful tale of cryosphere with wide range applications. Extremophiles 2020, 24, 447–473. [Google Scholar] [CrossRef] [PubMed]
  4. Velmurugan, P.; Venil, C.K.; Ravi, A.V.; Dufossé, L. Marine bacteria is the cell factory to produce bioactive pigments: A prospective pigment source in the ocean. Front. Sustain. Food Syst. 2020, 4, 589655. [Google Scholar] [CrossRef]
  5. Wang, Y.; Qian, G.; Li, Y.; Wang, Y.; Wang, Y.; Wright, S.; Li, Y.; Hen, Y.; Liu, F.; Du, L. Biosynthetic mechanism for sunscreens of the biocontrol agent Lysobacter enzymogenes. PLoS ONE 2013, 8, e66633. [Google Scholar] [CrossRef]
  6. Kumar, S.; Kumar, V.; Ambika, A.A.A.; Nag, D.; Kumar, V.; Darnal, S.; Thakur, V.; Patial, V.; Singh, D. Microbial pigments: Learning from Himalayan perspective to industrial applications. J. Ind. Microbiol. Biotechnol. 2022, 49, kuac017. [Google Scholar] [CrossRef]
  7. Bai, X.; Zhu, S.; Wang, X.; Zhang, W.; Liu, C.; Lu, X. Identification of a fabZ gene essential for flexirubin synthesis in Cytophaga hutchinsonii. FEMS Microbiol. Lett. 2017, 364, fnx197. [Google Scholar] [CrossRef]
  8. Sánchez-Muñoz, S.; Mariano-Silva, G.; Leite, M.O.; Mura, F.B.; Verma, M.L.; Da Silva, S.S.; Chandel, A.K. Production of fungal and bacterial pigments and their applications. In Biotechnological Production of Bioactive Compounds; Verma, M.L., Chandel, A.K., Eds.; Elsevier: New York, NY, USA, 2019; pp. 327–361. [Google Scholar]
  9. Schöner, T.A.; Gassel, S.; Osawa, A.; Tobias, N.J.; Okuno, Y.; Sakakibara, Y.; Shindo, K.; Sandmann, G.; Bode, H.B. Aryl polyenes, a highly abundant class of bacterial natural products, are functionally related to antioxidative carotenoids. ChemBioChem 2016, 17, 247–253. [Google Scholar] [CrossRef]
  10. Choksi, J.; Vora, J.; Shrivastava, N. Bioactive pigments from isolated bacteria and its antibacterial, antioxidant and sun protective application useful for cosmetic products. Indian J. Microbiol. 2020, 60, 379–382. [Google Scholar] [CrossRef]
  11. Cao, X.Q.; Wang, J.Y.; Zhou, L.; Chen, B.; Jin, Y.; He, Y.W. Biosynthesis of the yellow xanthomonadin pigments involves an ATP-dependent 3-hydroxybenzoic acid: Acyl carrier protein ligase and an unusual type II polyketide synthase pathway. Mol. Microbiol. 2018, 110, 16–32. [Google Scholar] [CrossRef]
  12. Johnston, I.; Osborn, L.J.; Markley, R.L.; McManus, E.A.; Kadam, A.; Schultz, K.B.; Nagajothi, N.; Ahern, P.P.; Brown, J.M.; Claesen, J. Identification of essential genes for Escherichia coli aryl polyene biosynthesis and function in biofilm formation. NPJ Biofilms Microbiomes 2021, 7, 56. [Google Scholar] [CrossRef] [PubMed]
  13. Lee, W.C.; Choi, S.; Jang, A.; Son, K.; Kim, Y. Structural comparison of Acinetobacter baumannii β-ketoacyl-acyl carrier protein reductases in fatty acid and aryl polyene biosynthesis. Sci. Rep. 2021, 11, 7945. [Google Scholar] [CrossRef] [PubMed]
  14. Grammbitter, G.L.C.; Shi, Y.M.; Shi, Y.N.; Vemulapalli, S.P.B.; Richter, C.; Schwalbe, H.; Alanjary, M.; Schüffler, A.; Witt, M.; Griesinger, C.; et al. The chemical structures of widespread microbial aryl polyene lipids. bioRxiv 2020. [Google Scholar] [CrossRef]
  15. Jiménez, M.E.P.; Pinilla, C.M.B.; Rodrigues, E.; Brandelli, A. Extraction and partial characterisation of antioxidant pigment produced by Chryseobacterium sp. kr6. Nat. Prod. Res. 2019, 33, 1541–1549. [Google Scholar] [CrossRef]
  16. Pailliè-Jiménez, M.E.; Stincone, P.; Pereira, J.Q.; Santagapita, P.R.; Rodrigues, E.; Brandelli, A. Isolation and characterization of an antioxidant aryl polyene pigment from Antarctic bacterium Lysobacter sp. A03. Mol. Biotechnol. 2024. ahead of print. [Google Scholar] [CrossRef]
  17. Pailliè-Jiménez, M.E.; Stincone, P.; Brandelli, A. Natural pigments of microbial origin. Front. Sustain. Food Syst. 2020, 4, 590439. [Google Scholar] [CrossRef]
  18. Riffel, A.; Brandelli, A. Keratinolytic bacteria isolated from feather waste. Braz. J. Microbiol. 2006, 37, 395–399. [Google Scholar] [CrossRef]
  19. Pereira, J.Q.; Lopes, F.C.; Petry, M.V.; Medina, L.F.C.; Brandelli, A. Isolation of three novel Antarctic psychrotolerant feather-degrading bacteria and partial purification of keratinolytic enzyme from Lysobacter sp. A03. Int. Biodeterior. Biodegrad. 2014, 88, 1–7. [Google Scholar] [CrossRef]
  20. Pereira, J.Q.; Ambrosini, A.; Sant’Anna, F.H.; Tadra-Sfeir, M.; Faoro, H.; Pedrosa, F.O.; Souza, E.M.; Brandelli, A.; Passaglia, L.M. Whole-genome shotgun sequence of the keratinolytic bacterium Lysobacter sp. A03, isolated from the Antarctic environment. Genome Announc. 2015, 3, e00246-15. [Google Scholar] [CrossRef]
  21. Andrews, S. FastQC: A Quality Control Tool for High Throughput Sequence Data. 2010. Available online: http://www.bioinformatics.babraham.ac.uk/projects/fastqc (accessed on 12 August 2024).
  22. Bankevich, A.; Nurk, S.; Antipov, D.; Gurevich, A.A.; Dvorkin, M.; Kulikov, A.S.; Lesin, V.M.; Nikolenko, S.I.; Pham, S.; Prjibelski, A.D.; et al. SPAdes: A new genome assembly algorithm and its applications to single-cell sequencing. J. Comput. Biol. 2012, 19, 455–477. [Google Scholar] [CrossRef]
  23. Gurevich, A.; Saveliev, V.; Vyahhi, N.; Tesler, G. QUAST: Quality assessment tool for genome assemblies. Bioinformatics 2013, 29, 1072–1075. [Google Scholar] [CrossRef] [PubMed]
  24. Aziz, R.K.; Bartels, D.; Best, A.A.; DeJongj, M.; Disz, T.; Edwards, R.A.; Formsma, K.; Gerdes, S.; Glass, E.M.; Kubal, M.; et al. The RAST server: Rapid annotations using subsystems technology. BMC Genom. 2008, 9, 75. [Google Scholar]
  25. Blin, K.; Shaw, S.; Augustijn, H.E.; Reitz, Z.L.; Biermann, F.; Alanjary, M.; Fetter, A.; Terlouw, B.R.; Metcalf, W.W.; Helfrich, E.J.; et al. antiSMASH 7.0: New and improved predictions for detection, regulation, chemical structures, and visualization. Nucleic Acids Res. 2023, 51, W46–W50. [Google Scholar] [CrossRef] [PubMed]
  26. Blin, K.; Medema, M.H.; Kazempour, D.; Fischbach, M.A.; Breitling, R.; Takano, E.; Weber, T. antiSMASH 2.0—A versatile platform for genome mining of secondary metabolite producers. Nucleic Acids Res. 2013, 41, 204–212. [Google Scholar] [CrossRef]
  27. He, Y.W.; Cao, X.Q.; Poplawsky, A. Chemical structure, biological roles, biosynthesis and regulation of the yellow xanthomonadin pigments in the phytopathogen Xanthomonas. Mol. Plant-Microbe Interact. 2020, 33, 705–714. [Google Scholar] [CrossRef]
  28. Kang, D.; Shoaie, S.; Jacquiod, S.; Sørensen, S.J.; Ledesma-Amaro, R. Comparative genomics analysis of Chryseobacterium sp. KMC2 reveals metabolic pathways involved in keratinous utilization and natural product biosynthesis. Microorganisms 2021, 9, 1042. [Google Scholar] [CrossRef]
  29. Schöner, T.A.; Fuchs, S.W.; Schönau, C.; Bode, H.B. Initiation of the flexirubin biosynthesis in Chitinophaga pinensis. Microb. Biotechnol. 2014, 7, 232–241. [Google Scholar] [CrossRef]
  30. Sullivan, J.T.; Brown, S.D.; Yocum, R.R.; Ronson, C.W. The bio operon on the acquired symbiosis island of Mesorhizobium sp. strain R7A includes a novel gene involved in pimeloyl-CoA synthesis. Microbiology 2001, 147, 1315–1322. [Google Scholar] [CrossRef]
  31. Sirithanakorn, C.; Cronan, J.E. Biotin, a universal and essential cofactor: Synthesis, ligation and regulation. FEMS Microbiol. Rev. 2021, 45, fuab003. [Google Scholar] [CrossRef]
  32. Yu, Y.; Ma, J.; Guo, Q.; Ma, J.; Wang, H. A novel 3-oxoacyl-ACP reductase (FabG3) is involved in the xanthomonadin biosynthesis of Xanthomonas campestris pv. campestris. =Mol. Plant Pathol. 2019, 20, 1696–1709. [Google Scholar] [CrossRef]
  33. Schöner, T.A.; Fuchs, S.W.; Reinhold-Hurek, B.; Bode, H.B. Identification and biosynthesis of a novel xanthomonadin-dialkylresorcinol-hybrid from Azoarcus sp. BH72. PLoS ONE 2014, 9, e90922. [Google Scholar] [CrossRef] [PubMed]
  34. Jehlička, J.; Osterrothová, K.; Oren, A.; Edwards, H.G.M. Raman spectrometric discrimination of flexirubin pigments from two genera of Bacteroidetes. FEMS Microbiol. Lett. 2013, 348, 97–102. [Google Scholar] [CrossRef] [PubMed]
  35. McBride, M.J.; Xie, G.; Martens, E.C.; Lapidus, A.; Henrissat, B.; Rhodes, R.G.; Goltsman, E.; Wang, W.; Xu, J.; Hunnicutt, D.W.; et al. Novel features of the polysaccharide-digesting gliding bacterium Flavobacterium johnsoniae as revealed by genome sequence analysis. Appl. Environ. Microbiol. 2009, 75, 6864–6875. [Google Scholar] [CrossRef] [PubMed]
  36. Brameyer, S.; Kresovic, D.; Bode, H.B.; Heermann, R. Dialkylresorcinols as bacterial signaling molecules. Proc. Natl. Acad. Sci. USA 2015, 112, 572–577. [Google Scholar] [CrossRef]
  37. Cimermancic, P.; Medema, M.H.; Claesen, J.; Kurita, K.; Brown, L.C.W.; Mavrommatis, K.; Pati, A.; Godfrey, P.A.; Koehrsen, M.; Clardy, J.; et al. Insights into secondary metabolism from a global analysis of prokaryotic biosynthetic gene clusters. Cell 2014, 158, 412–421. [Google Scholar] [CrossRef]
  38. Turrini, P.; Artuso, I.; Tescari, M.; Lugli, G.A.; Frangipani, E.; Ventura, M.; Visca, P. Draft genome sequence and secondary metabolite biosynthetic potential of the Lysobacter niastensis type strain DSM 18481. Microbiol. Resour. Announc. 2021, 10, e01296-20. [Google Scholar] [CrossRef]
  39. Taniguchi, M.; Lindsey, J.S. Database of absorption and fluorescence spectra of >300 common compounds for use in PhotochemCAD. Photochem. Photobiol. 2018, 94, 290–327. [Google Scholar] [CrossRef]
  40. PhotochemCAD. Available online: https://www.photochemcad.com/databases/naturally-derived-porphyrins/znii-uroporphyrin-i-in-dmso (accessed on 2 December 2024).
  41. Andrewes, A.G.; Jenkins, C.L.; Starr, M.P.; Shepherd, J.; Hope, H. Structure of xanthomonadin I, a novel dibrominated aryl-polyene pigment produced by the bacterium Xanthomonas juglandis. Tetrahedron Lett. 1976, 45, 4023–4024. [Google Scholar] [CrossRef]
  42. Aririatu, L.E.; Kester, A.S. Isolation and characterization of the pigment esters of Xanthomonas juglandis (campestris). Microbiology 1985, 131, 2047–2052. [Google Scholar] [CrossRef]
  43. Madden, K.S.; Laroche, B.; David, S.; Batsanov, A.S.; Thompson, D.; Knowles, J.P.; Whiting, A. Approaches to styrenyl building blocks for the synthesis of polyene xanthomonadin and its analogues. Eur. J. Org. Chem. 2018, 2018, 5312–5322. [Google Scholar] [CrossRef]
  44. Grammbitter, G.L.C.; Schmallhofer, M.; Karimi, K.; Shi, Y.M.; Schöner, T.A.; Tobias, N.J.; Morgner, N.; Groll, M.; Bode, H.B. An uncommon type II PKS catalyzes biosynthesis of aryl polyene pigments. J. Am. Chem. Soc. 2019, 141, 16615–16623. [Google Scholar] [CrossRef] [PubMed]
  45. Palazzotto, E.; Weber, T. Omics and multi-omics approaches to study the biosynthesis of secondary metabolites in microorganisms. Curr. Opin. Microbiol. 2018, 45, 109–116. [Google Scholar] [CrossRef] [PubMed]
  46. Zhou, L.; Huang, T.W.; Wang, J.Y.; Sun, S.; Chen, G.; Poplawsky, A.; He, Y.W. The rice bacterial pathogen Xanthomonas oryzae pv. oryzae produces 3-hydroxybenzoic acid and 4-hydroxybenzoic acid via XanB2 for use in xanthomonadin, ubiquinone, and exopolysaccharide biosynthesis. Mol. Plant-Microb. Interact. 2013, 26, 1239–1248. [Google Scholar] [CrossRef] [PubMed]
  47. Starr, M.P.; Jenkins, C.L.; Bussey, L.B.; Andrewes, A.G. Chemotaxonomic significance of the xanthomonadins, novel brominated aryl-polyene pigments produced by bacteria of the genus Xanthomonas. Arch. Microbiol. 1977, 113, 1–9. [Google Scholar] [CrossRef]
  48. Oren, A. Characterization of pigments of prokaryotes and their use in taxonomy and classification. Meth. Microbiol. 2011, 38, 262–283. [Google Scholar]
  49. Venil, C.K.; Zakaria, Z.A.; Usha, R.; Ahmad, W.A. Isolation and characterization of flexirubin type pigment Chryseobacterium sp. UTM-3T. Biocatal. Agric. Biotechnol. 2014, 3, 103–107. [Google Scholar] [CrossRef]
Figure 1. APE gene clusters of Chryseobacterium sp. kr6 (A) and Lysobacter sp. A03 (B) aligned with known clusters for flexirubin and xanthomonadin, respectively, in the MIBiG 3.1 antiSMASH database. Genes with the same color are interrelated; colorless genes have no relationship.
Colorants 04 00001 g001
Figure 2. Comparison of APE BGC of Chryseobacterium sp. kr6 and Lysobacter sp. A03 with known APE clusters. The colored dots indicate the genes in common, between A03 and kr6 and the genes reported by other bacteria, considering the core, additional and transport-related genes for APE pigment biosynthesis.
Colorants 04 00001 g002
Figure 3. (A) Alignment between the three-dimensional structures of FabA from A03 (yellow) with FabZ from kr6 (green). (B) Alignment between the three-dimensional structures of FabZ belonging to A03 (purple) with the FabZ of kr6 (green) using Phyre2 as a tool to predict, compare and analyze protein structure, function and mutations.
Colorants 04 00001 g003
Figure 4. Electromagnetic spectra of the pigments extracted from the biomass of Chryseobacterium sp. kr6 and Lysobacter sp. A03.
Colorants 04 00001 g004
Figure 5. (A) Chromatogram obtained by LC-DAD-MS showing a single peak with a retention time of 17.8 min (processed at 414 nm). (B) UV–visible spectrum of peak 1. Chromatographic conditions are detailed in the Methods section. Peak characterization is given in Table 1.
Colorants 04 00001 g005
Figure 6. Chromatogram obtained by HPLC-DAD-MS of the pigments from kr6. Chromatographic conditions: see text. Peak characterization is given in Table 2.
Colorants 04 00001 g006
Table 1. Chromatographic, UV-Vis, and mass spectrometry characteristics of A03 pigment obtained by HPLC-DAD-MS.
Peak aTime (min) bλmax (nm)[M − H] (m/z)MS/MS (m/z)[M + Na]+ (m/z)MS/MS (m/z)
117.8414, 548, 583721.5511241, 269, 255745.5109195.0096
733.5500267, 255, 281, 241757.5127n.d.
a Numbered according to the chromatogram shown in Figure 6. b Retention time on the C18 column eluted with gradient of methanol/water mixture. n.d.: not detected.
Table 2. Chromatographic, UV-Vis, and mass spectrometry characteristics of kr6 pigment obtained by HPLC-DAD-MS.
Peak aTime (min) bλmax (nm)[M + H]+ (m/z)MS/MS (m/z)
18.0281, 411393.2400149.0291
29.8259, 411600.3796310.2496; 210.0609
322.2261, 429700.5809133.0926; 177.1192; 561.5103; 299.0695
423.2440338.3536n.d.
523.9436334.3175n.d.
624.1448510.4317269.2559
724.4440568.4733269.2572
824.6448516.4428355.2959
925.0448610.2026239.1033; 167.0622; 299.0724; 355.0842
1025.5448566.4946231.2205
a Numbered according to the chromatogram shown in Figure 6. b Retention time on the C18 column eluted with gradient of methanol/water mixture. n.d.: not detected.
Disclaimer/Publisher’s Note: The statements, opinions and data contained in all publications are solely those of the individual author(s) and contributor(s) and not of MDPI and/or the editor(s). MDPI and/or the editor(s) disclaim responsibility for any injury to people or property resulting from any ideas, methods, instructions or products referred to in the content.