
The First Century of Successful Applications of Pinacyanol: Some Noteworthy Results


Abstract
:1. Introduction
2. The Beginning of PIN Research
3. Further Progress on the Dye
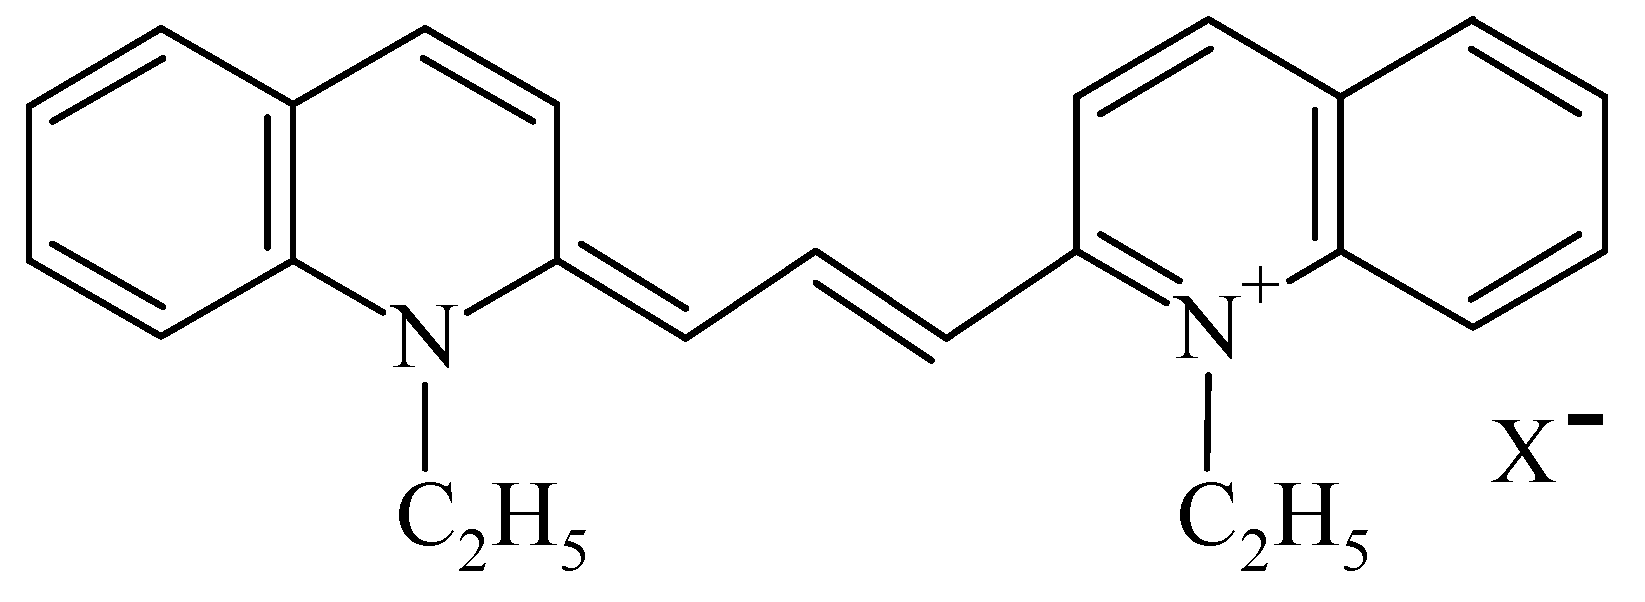
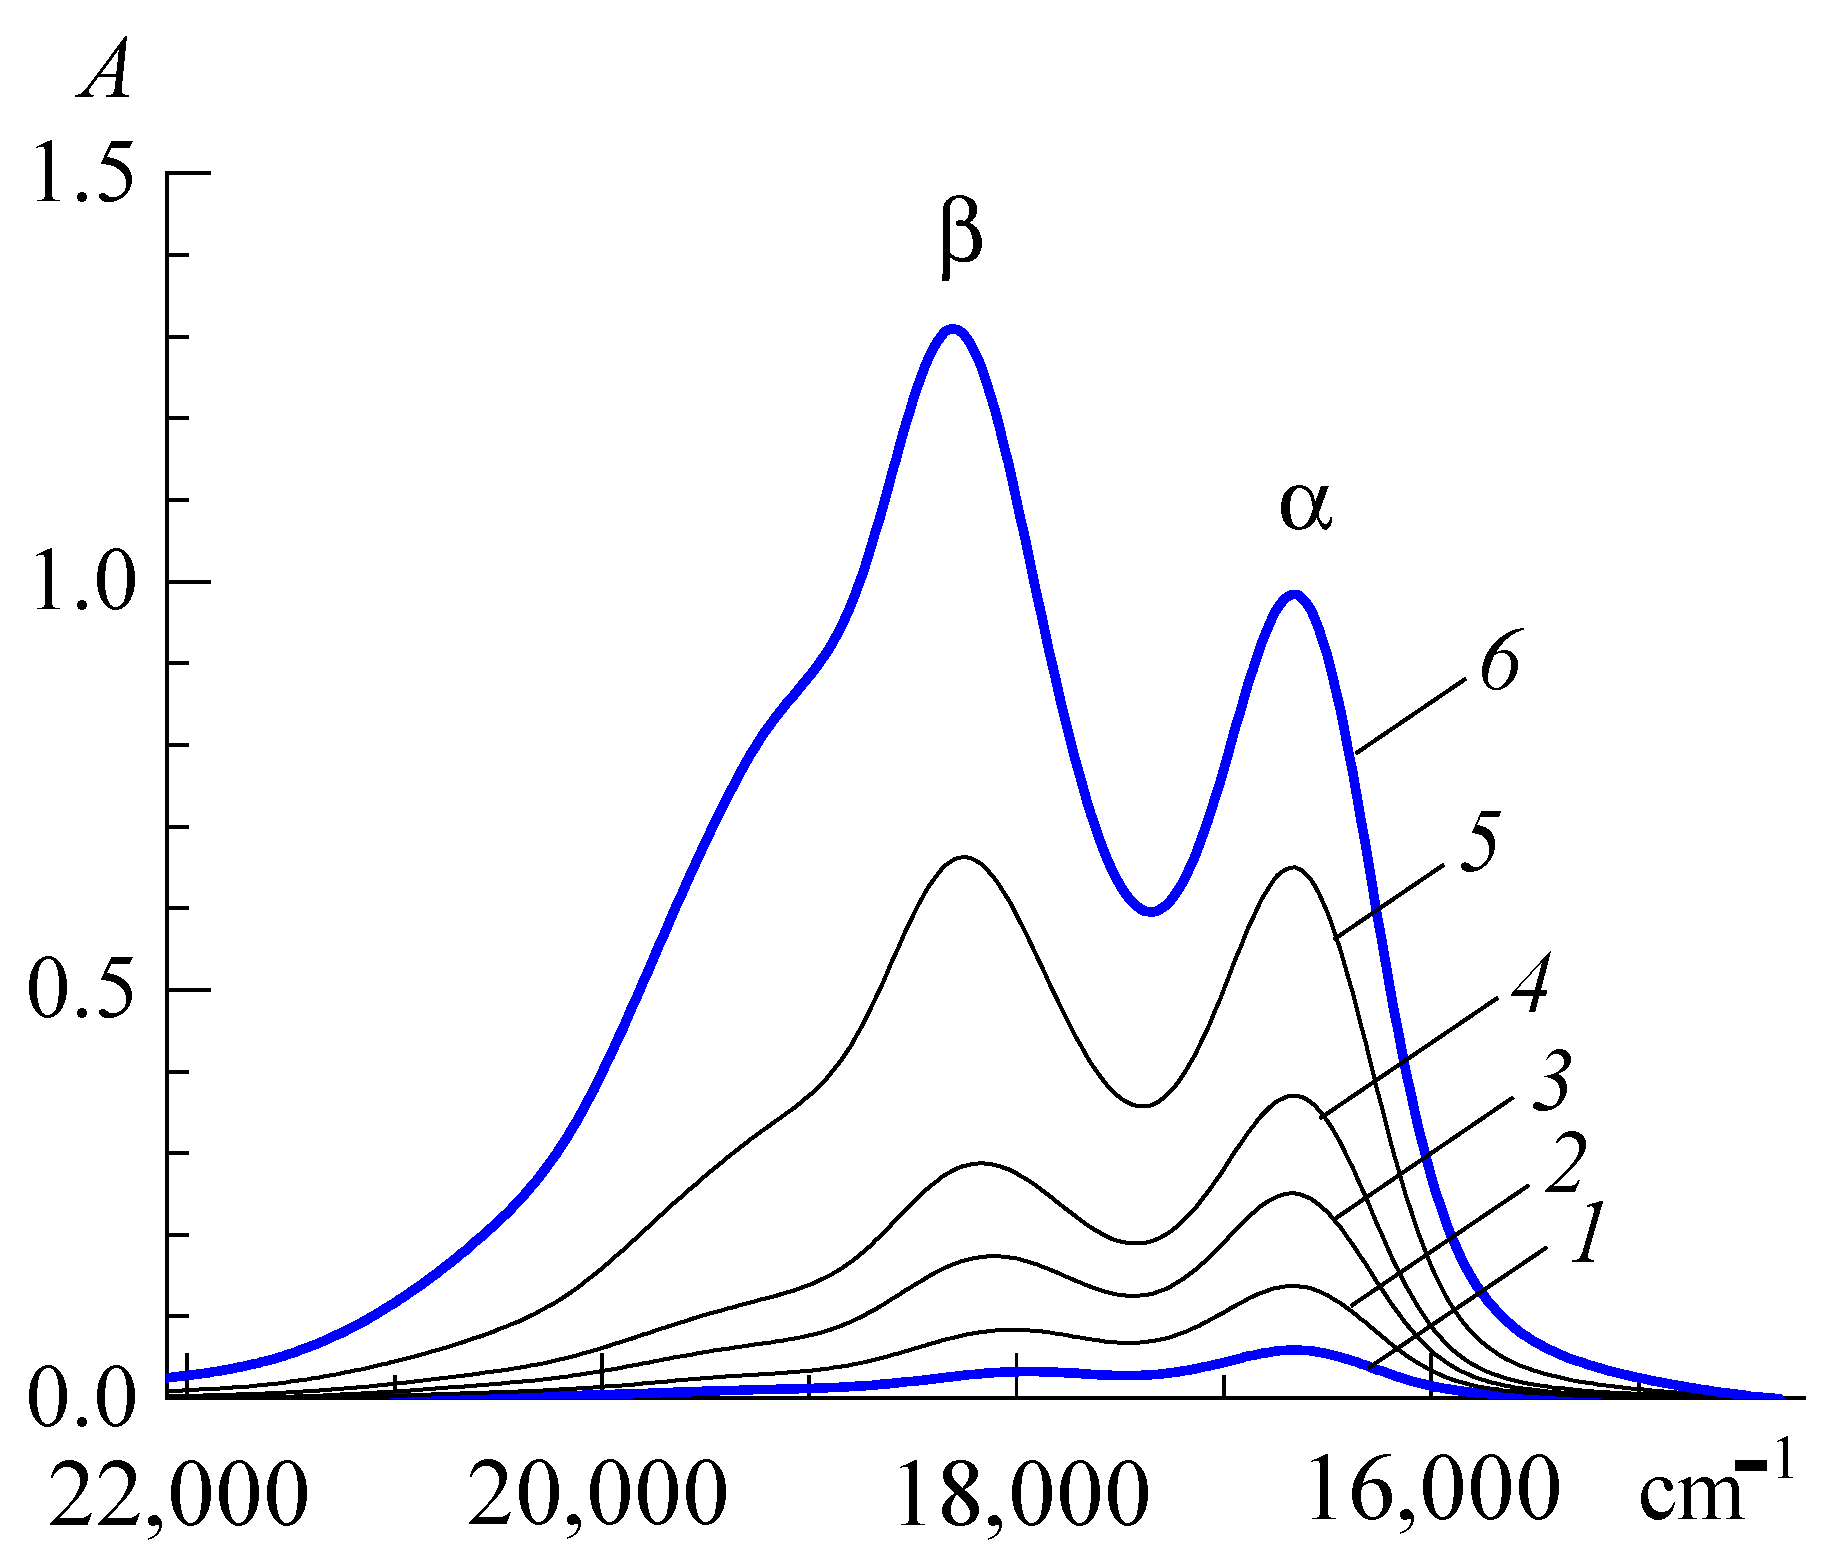
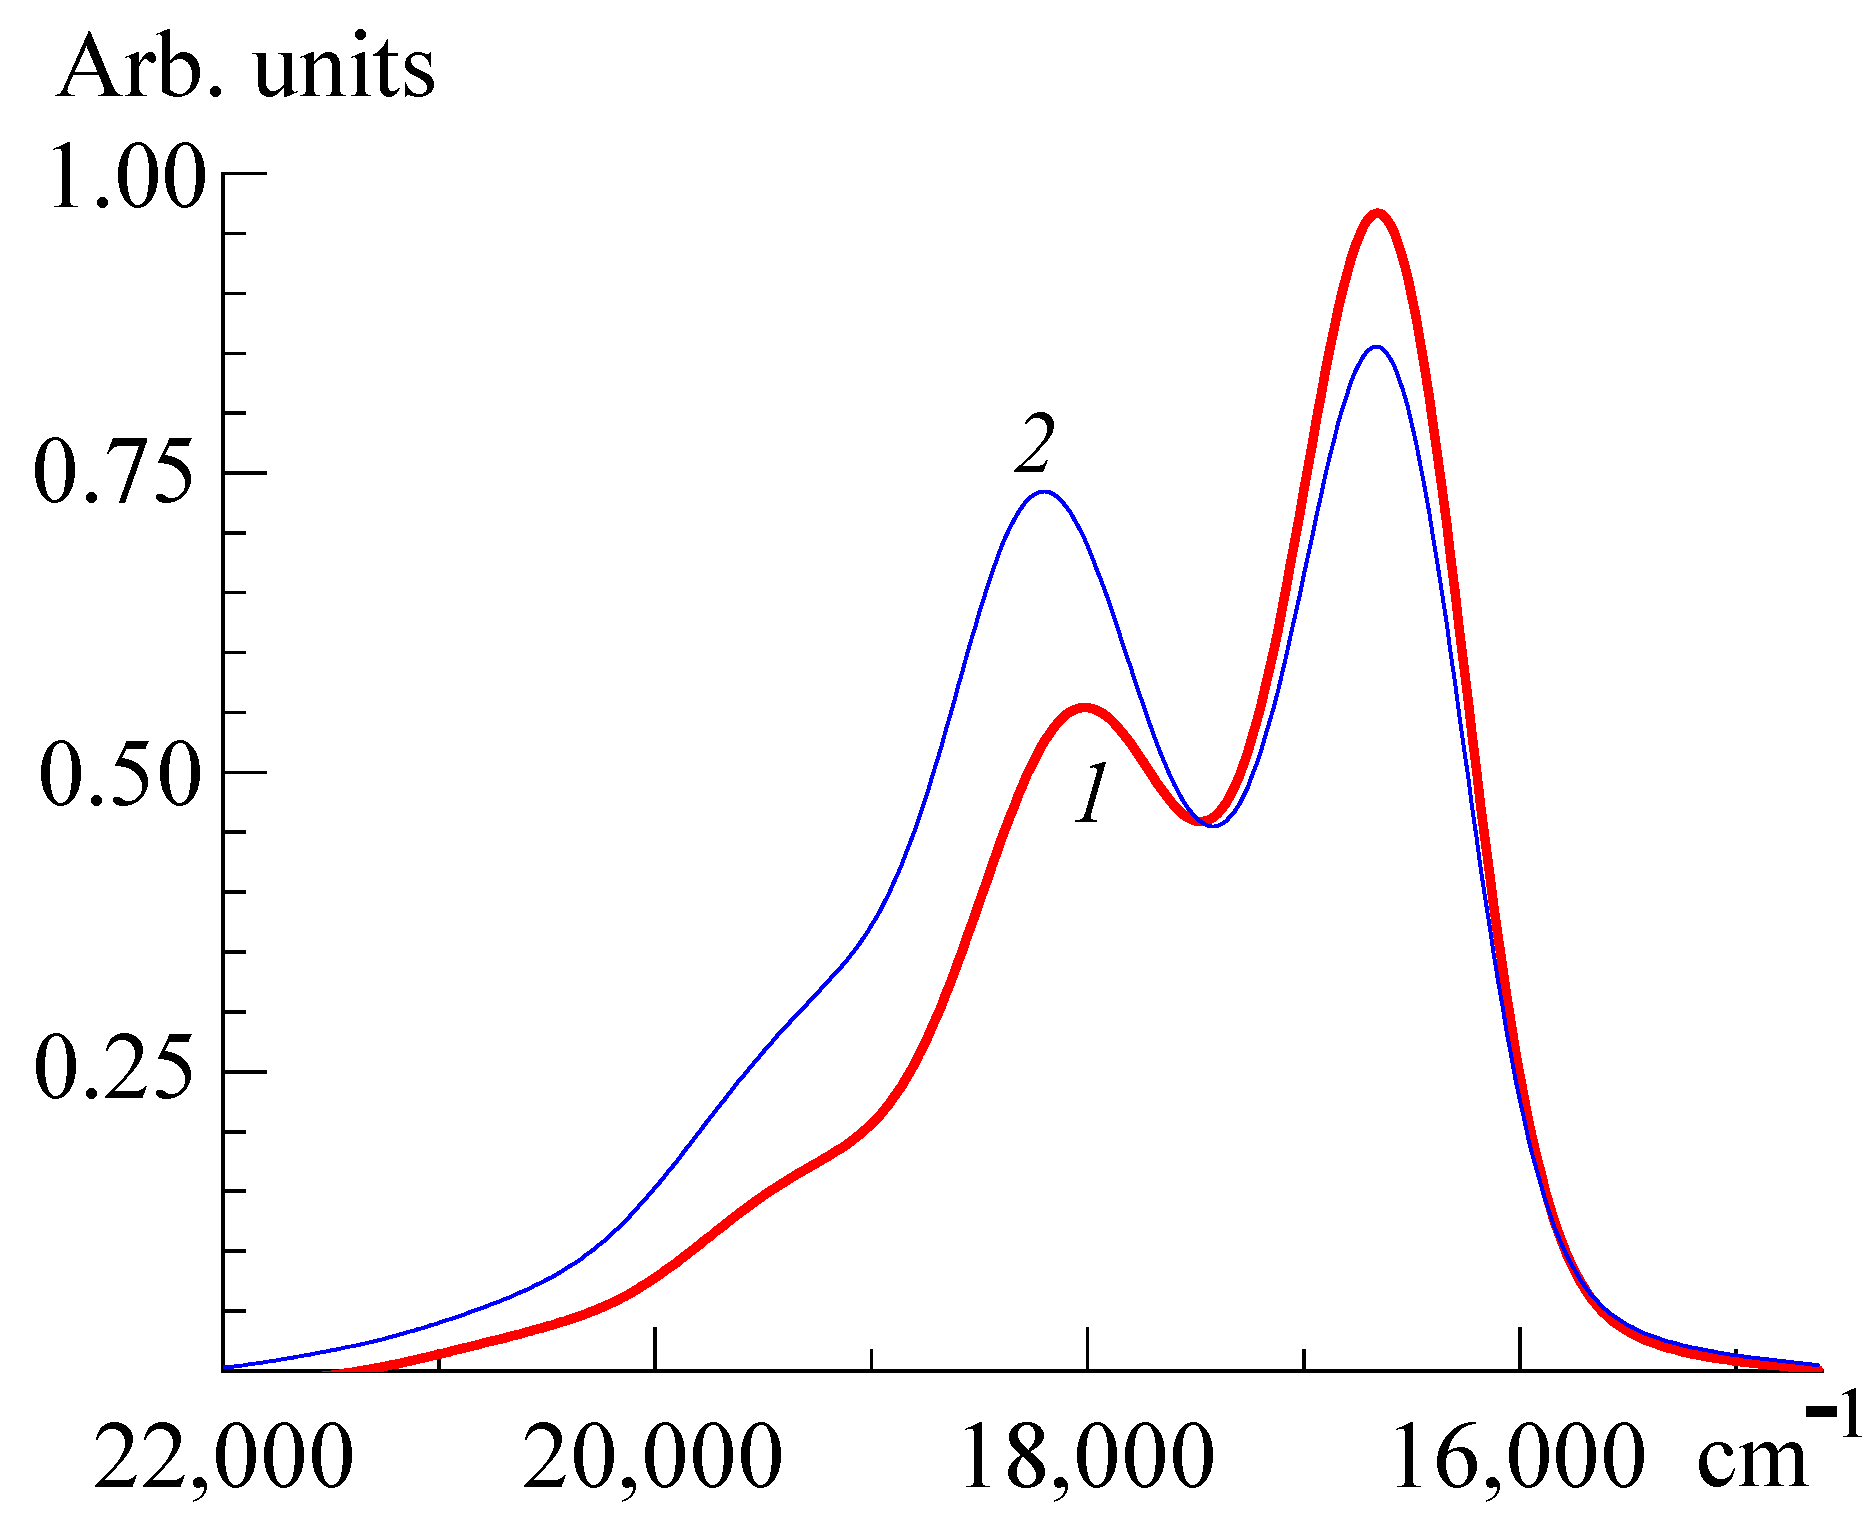
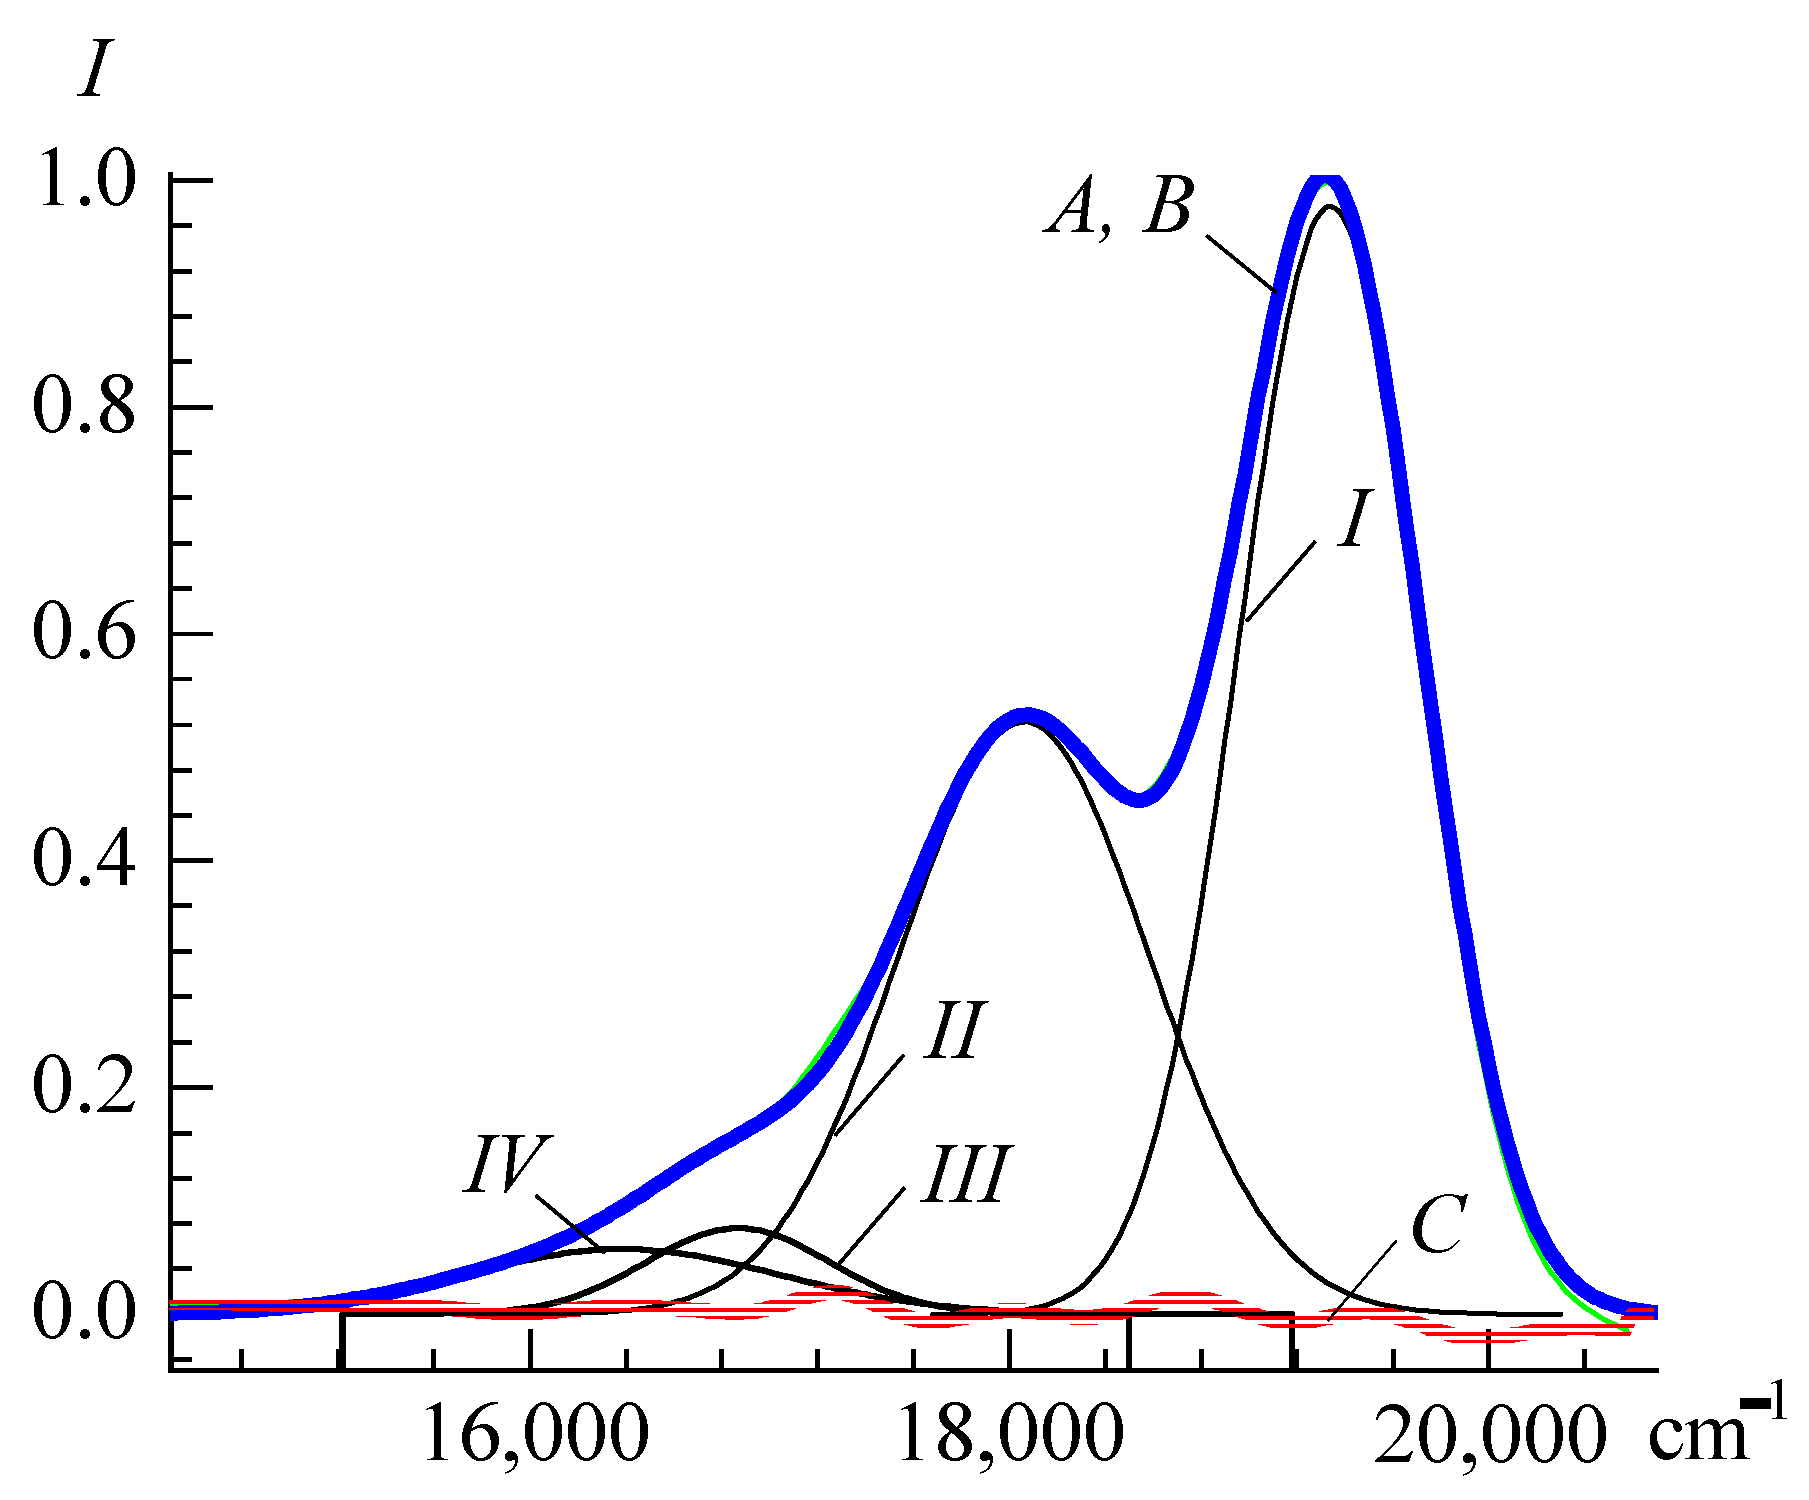
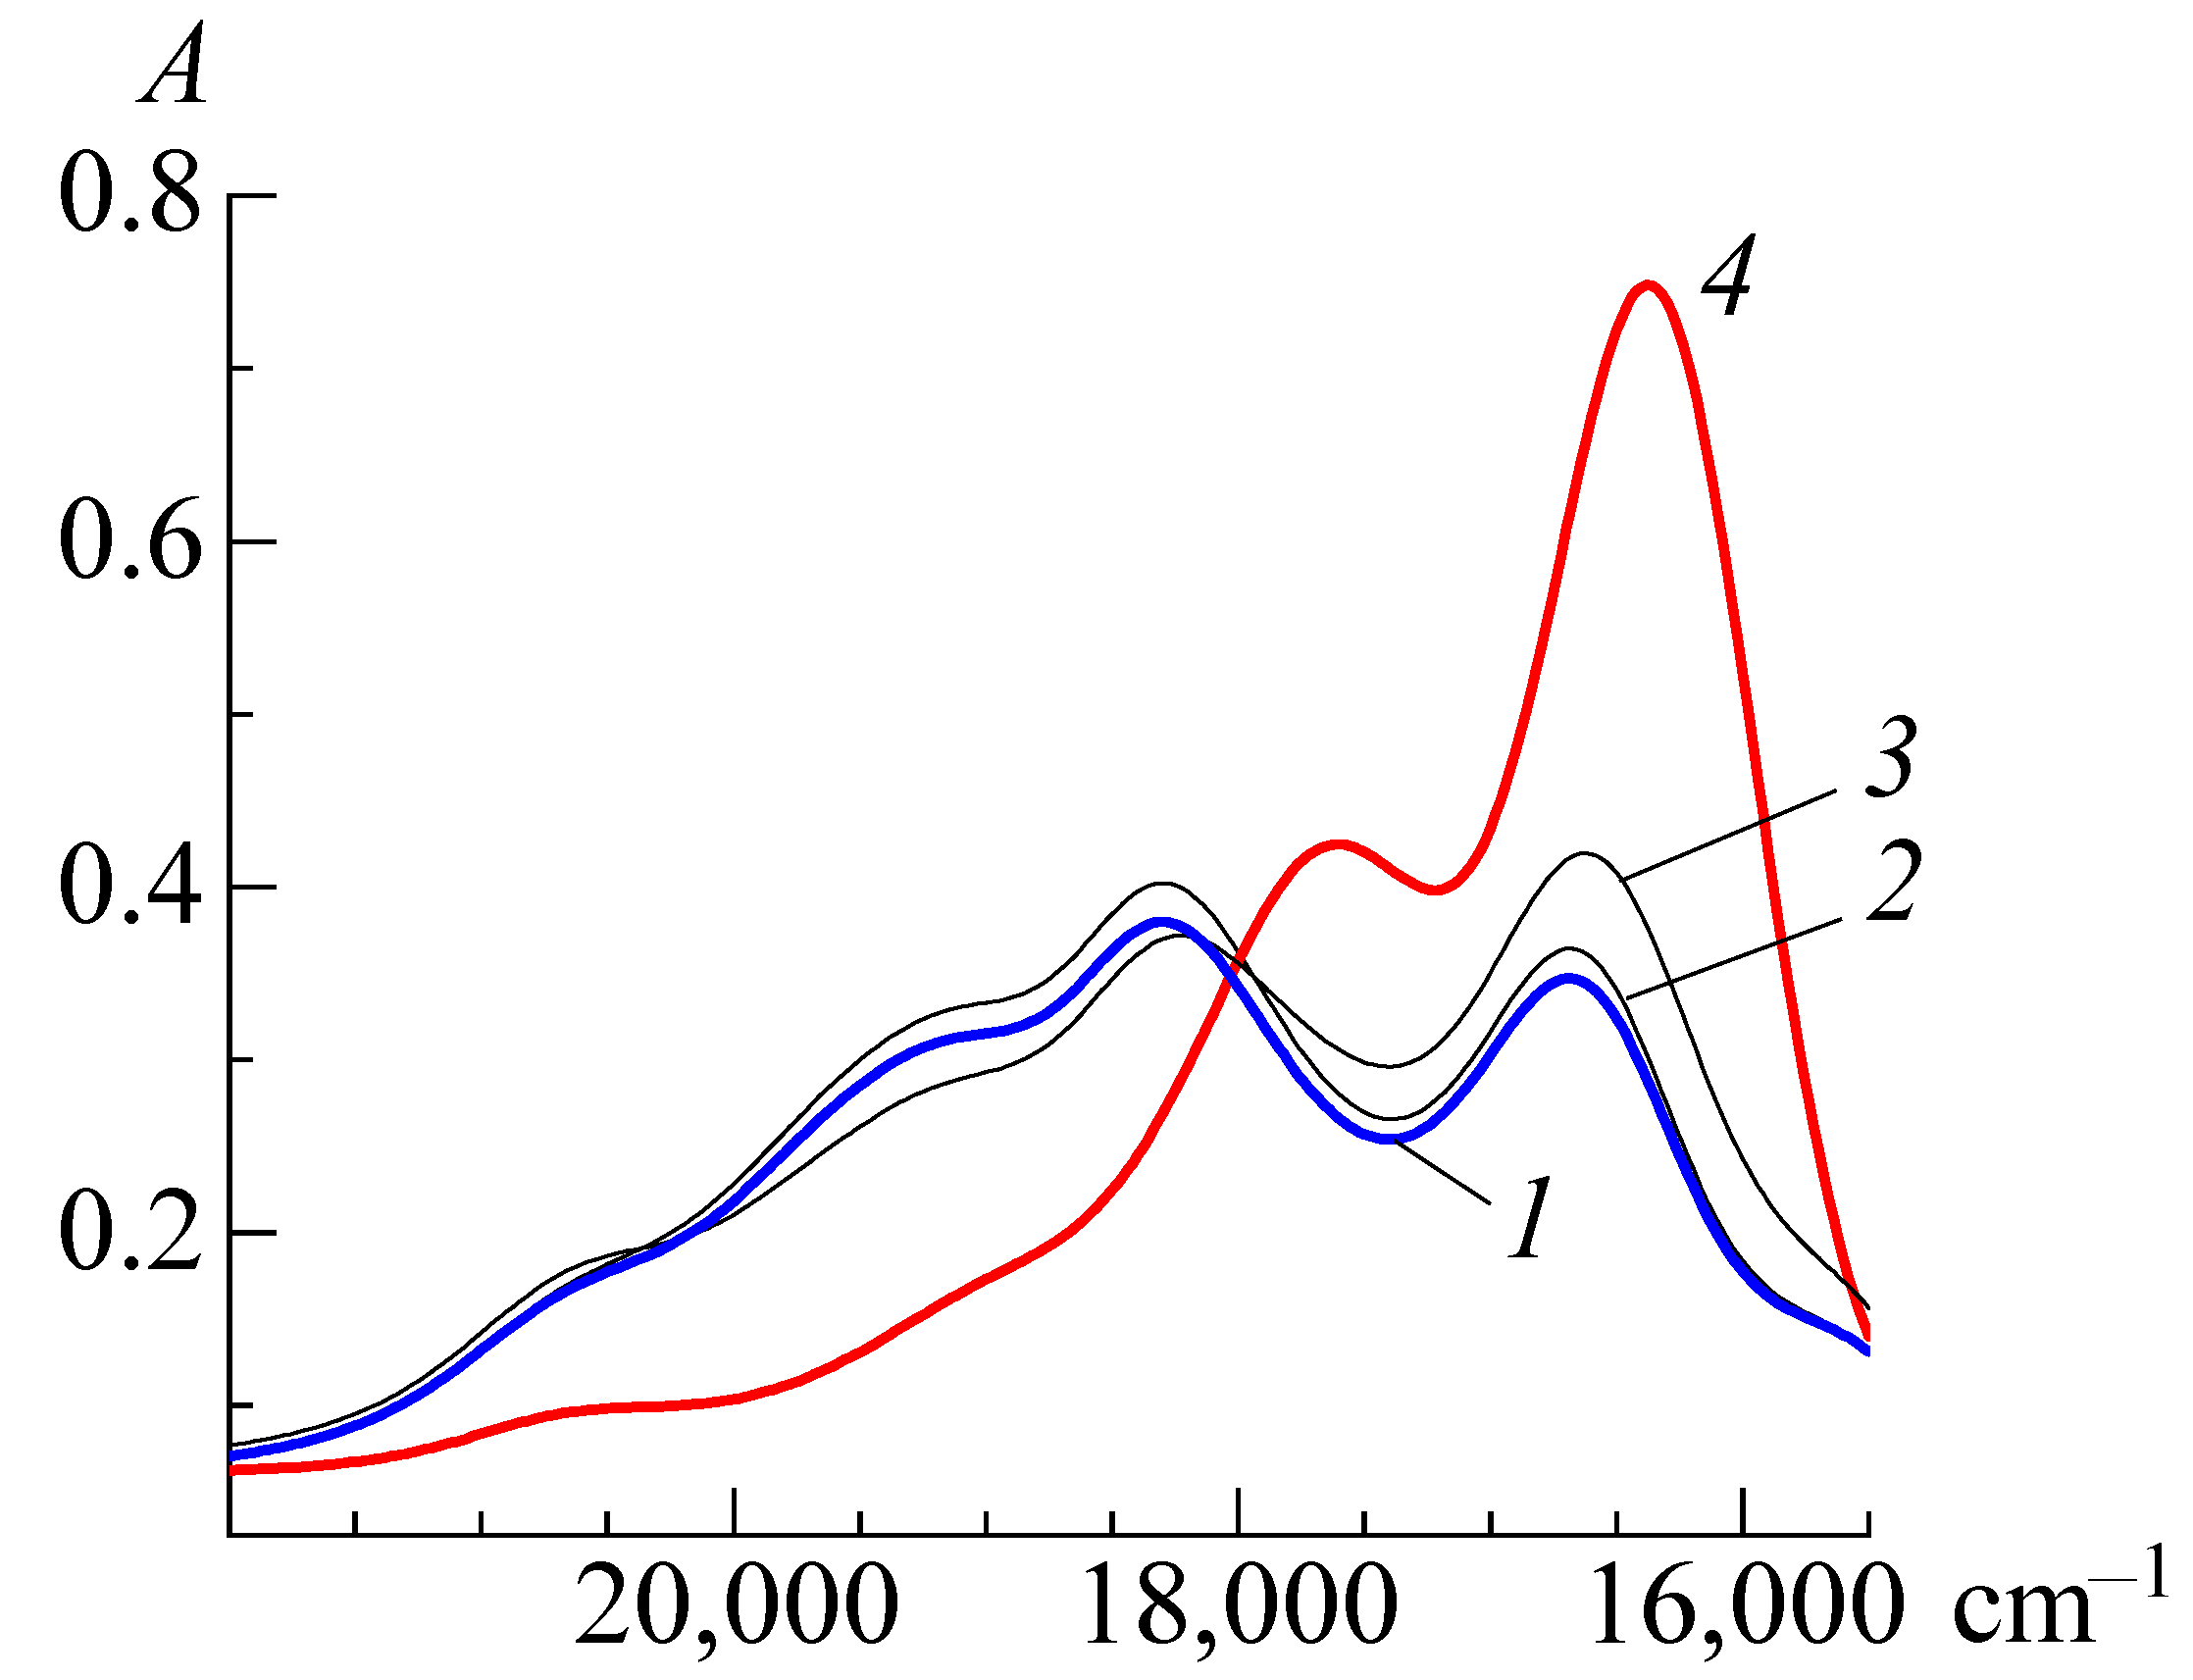
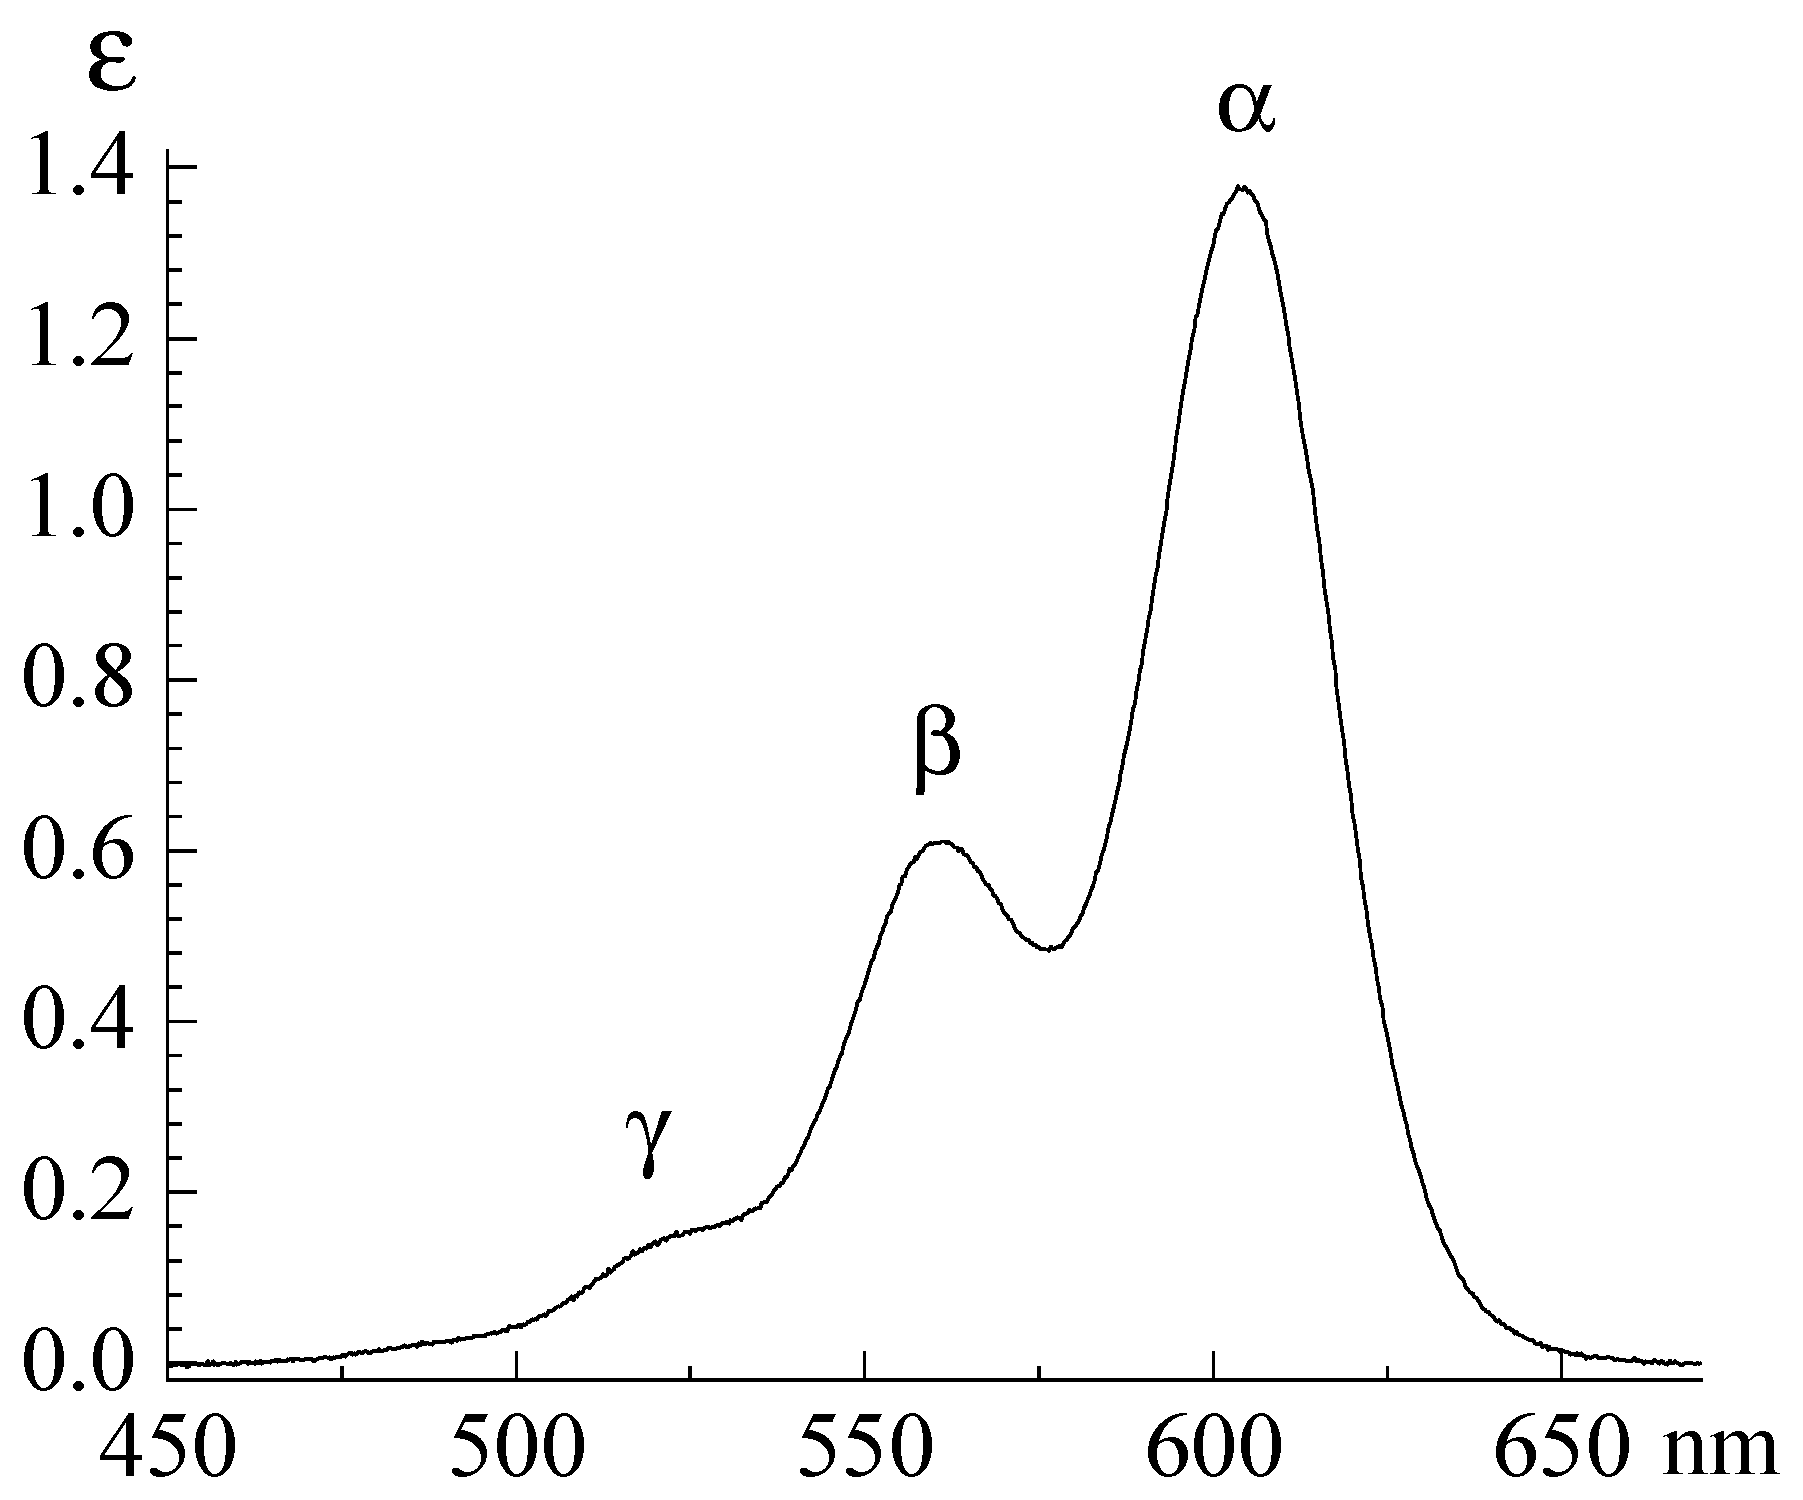
4. Spectral, Protolytic, and Aggregative Properties of the Dye
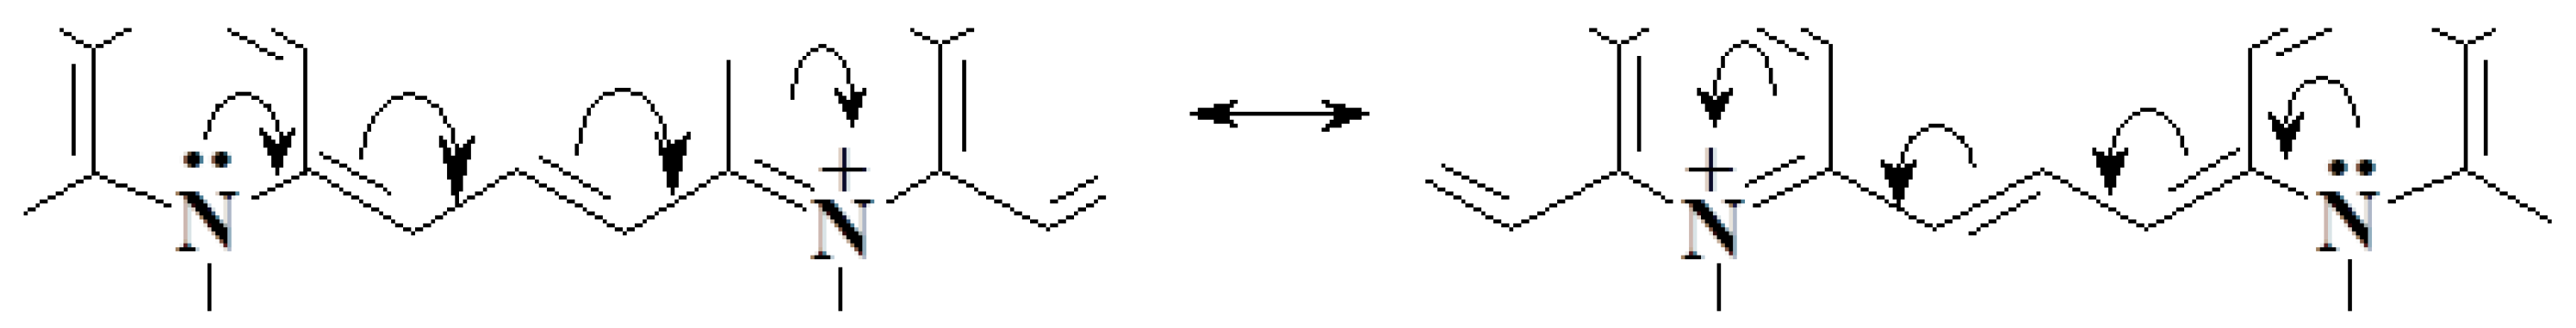
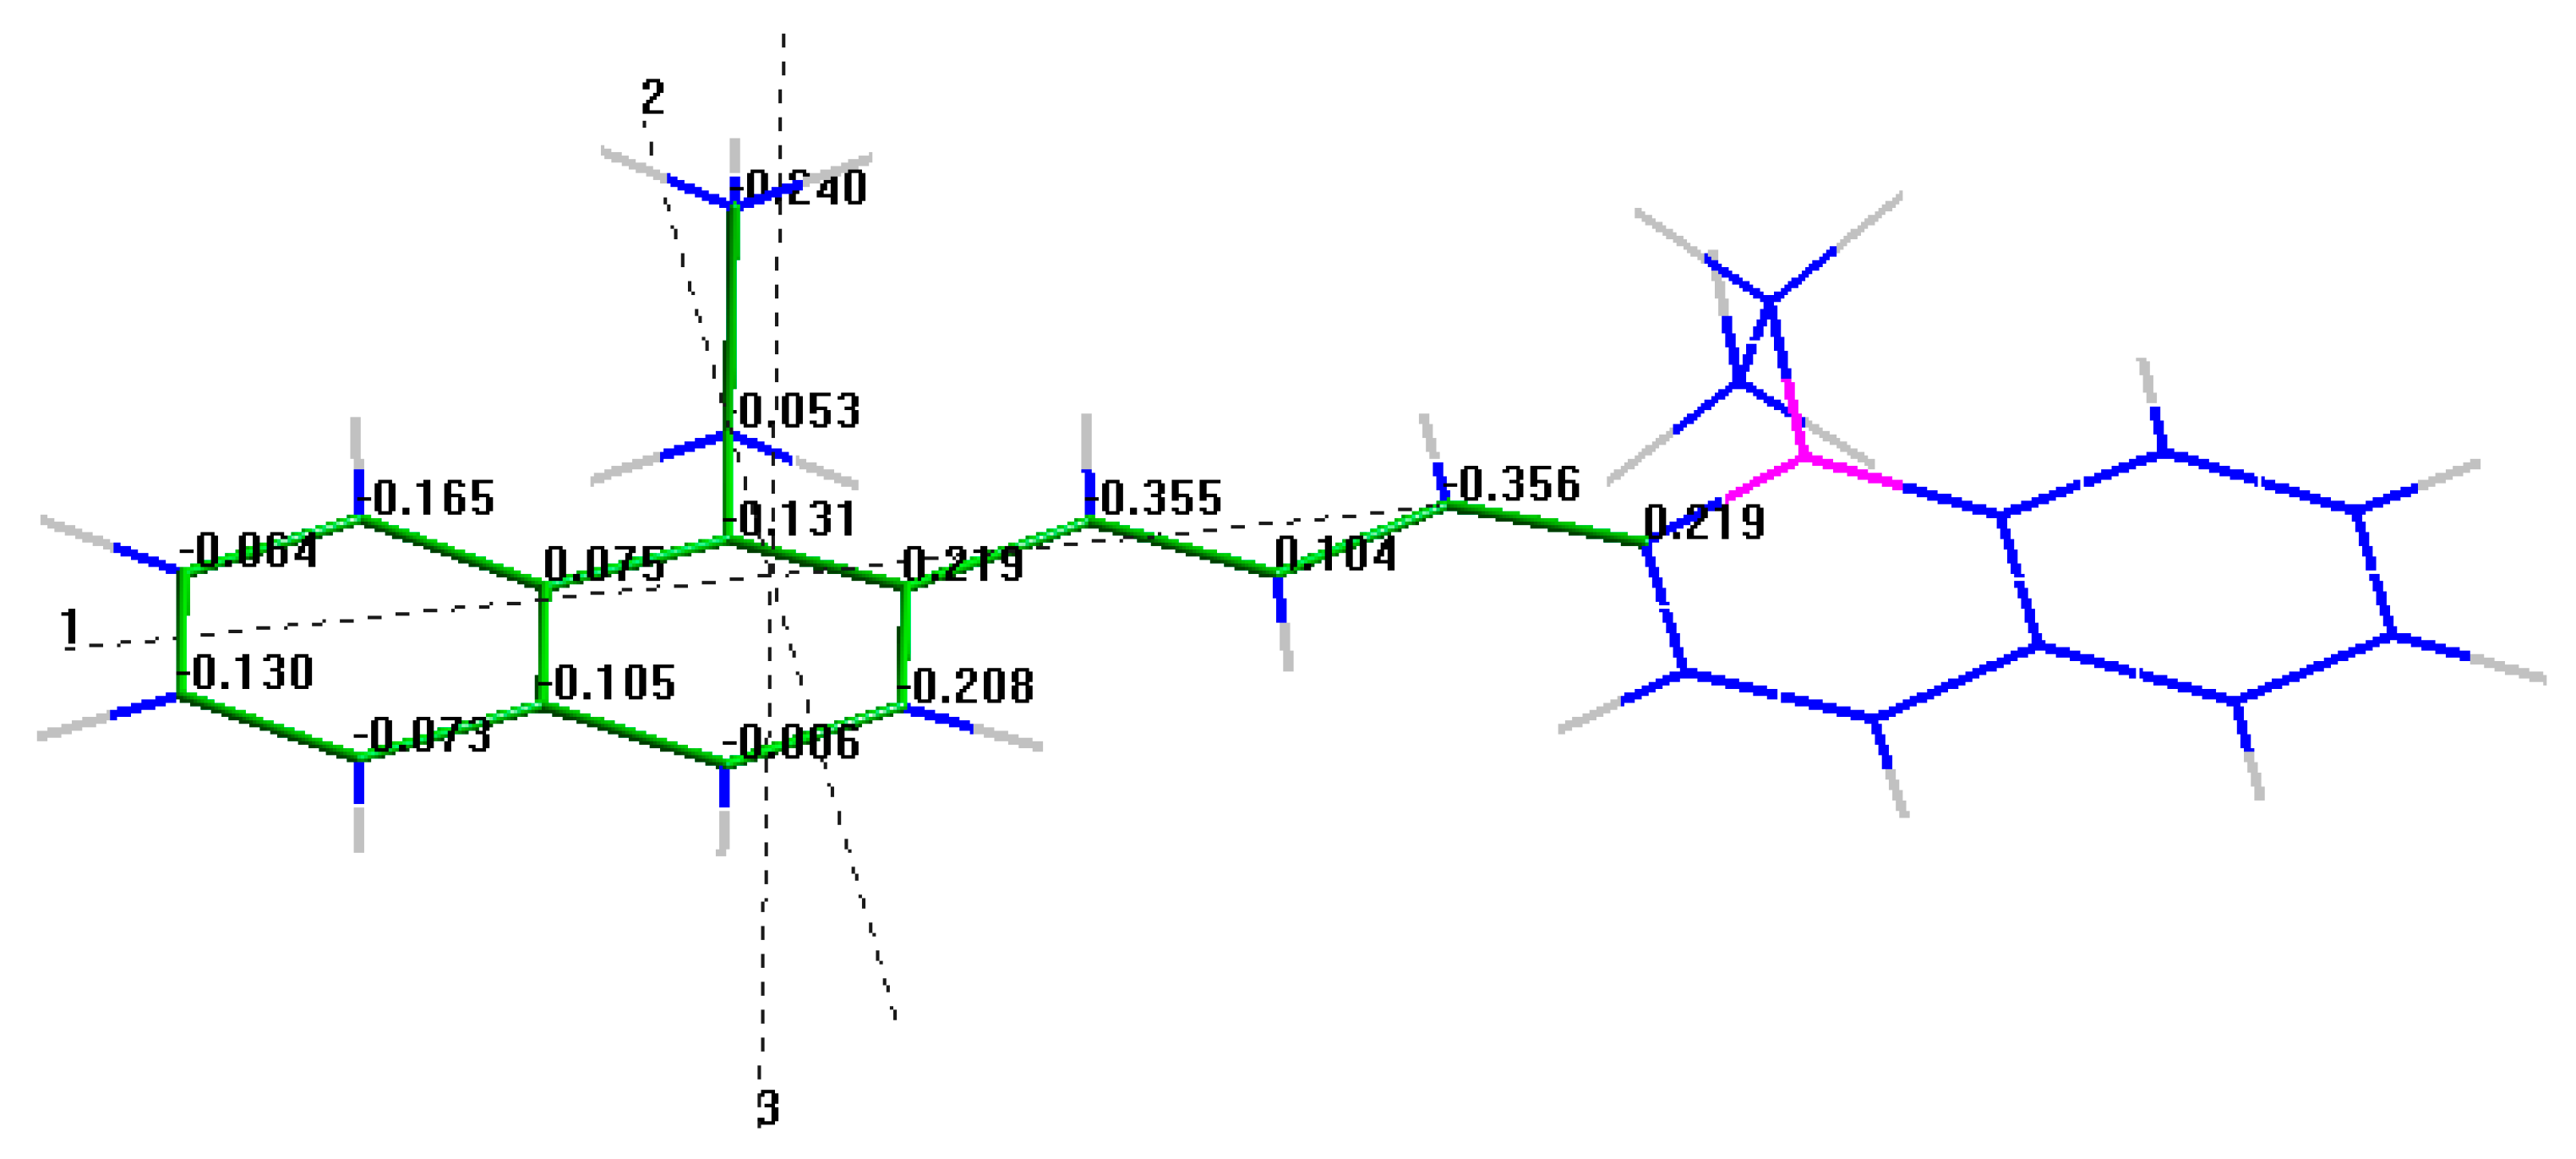
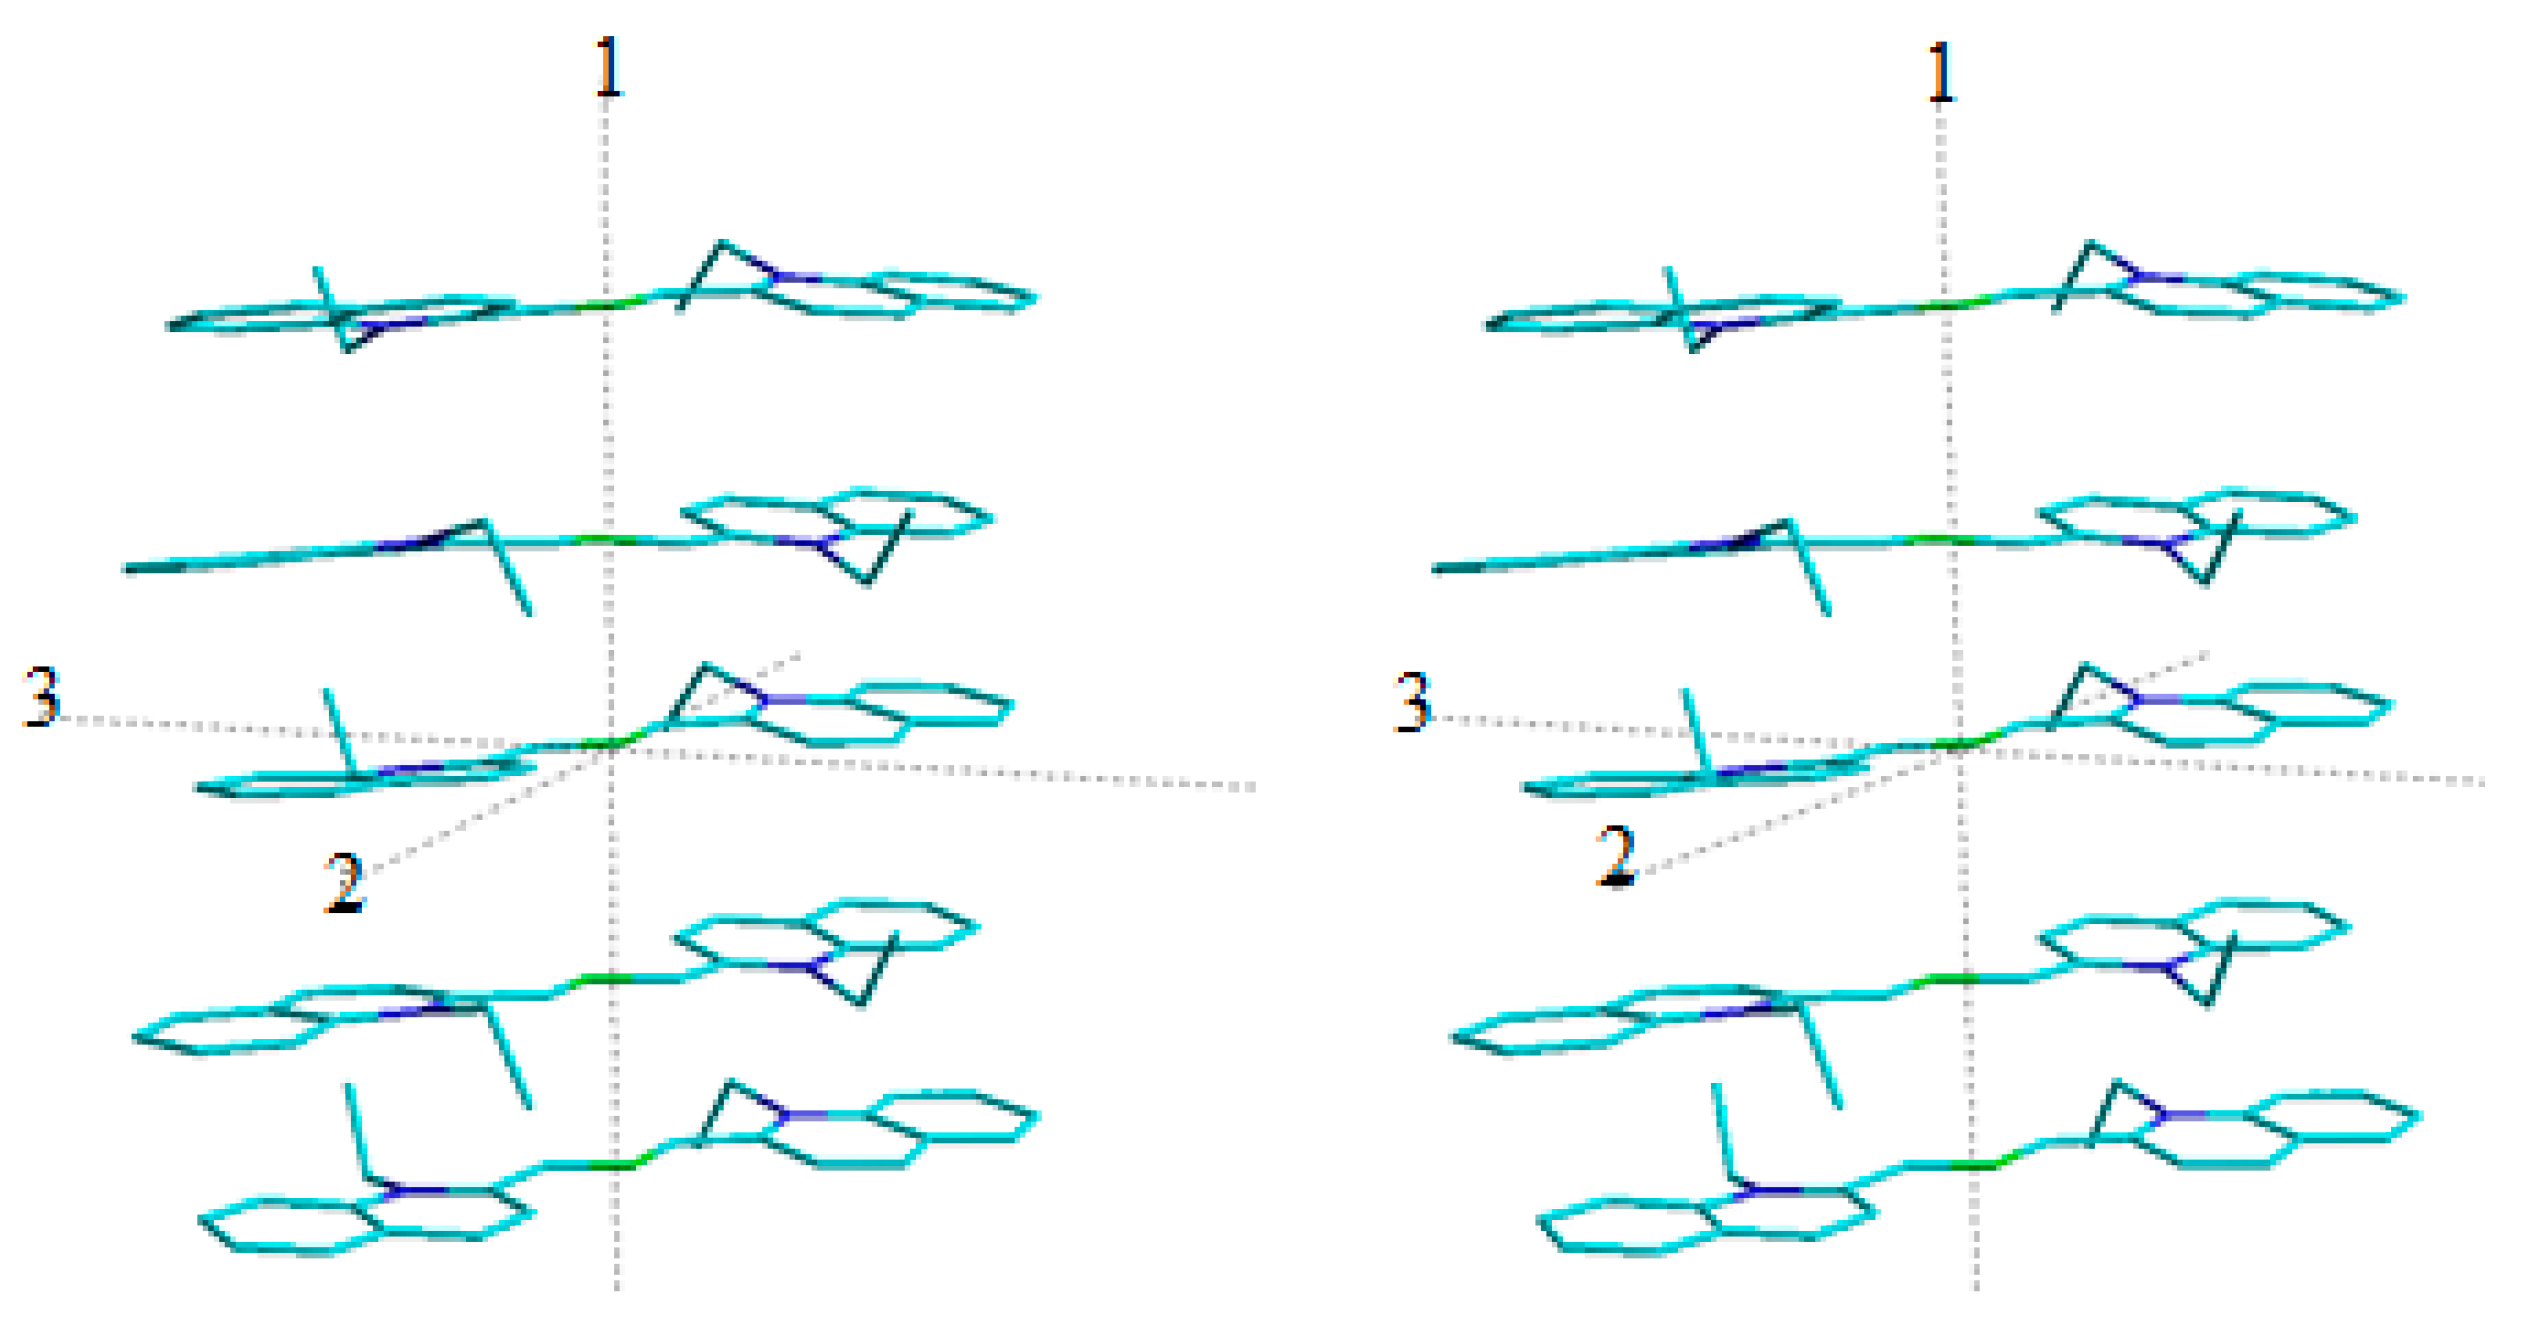
5. Structural and Thermodynamic Features of the Dye
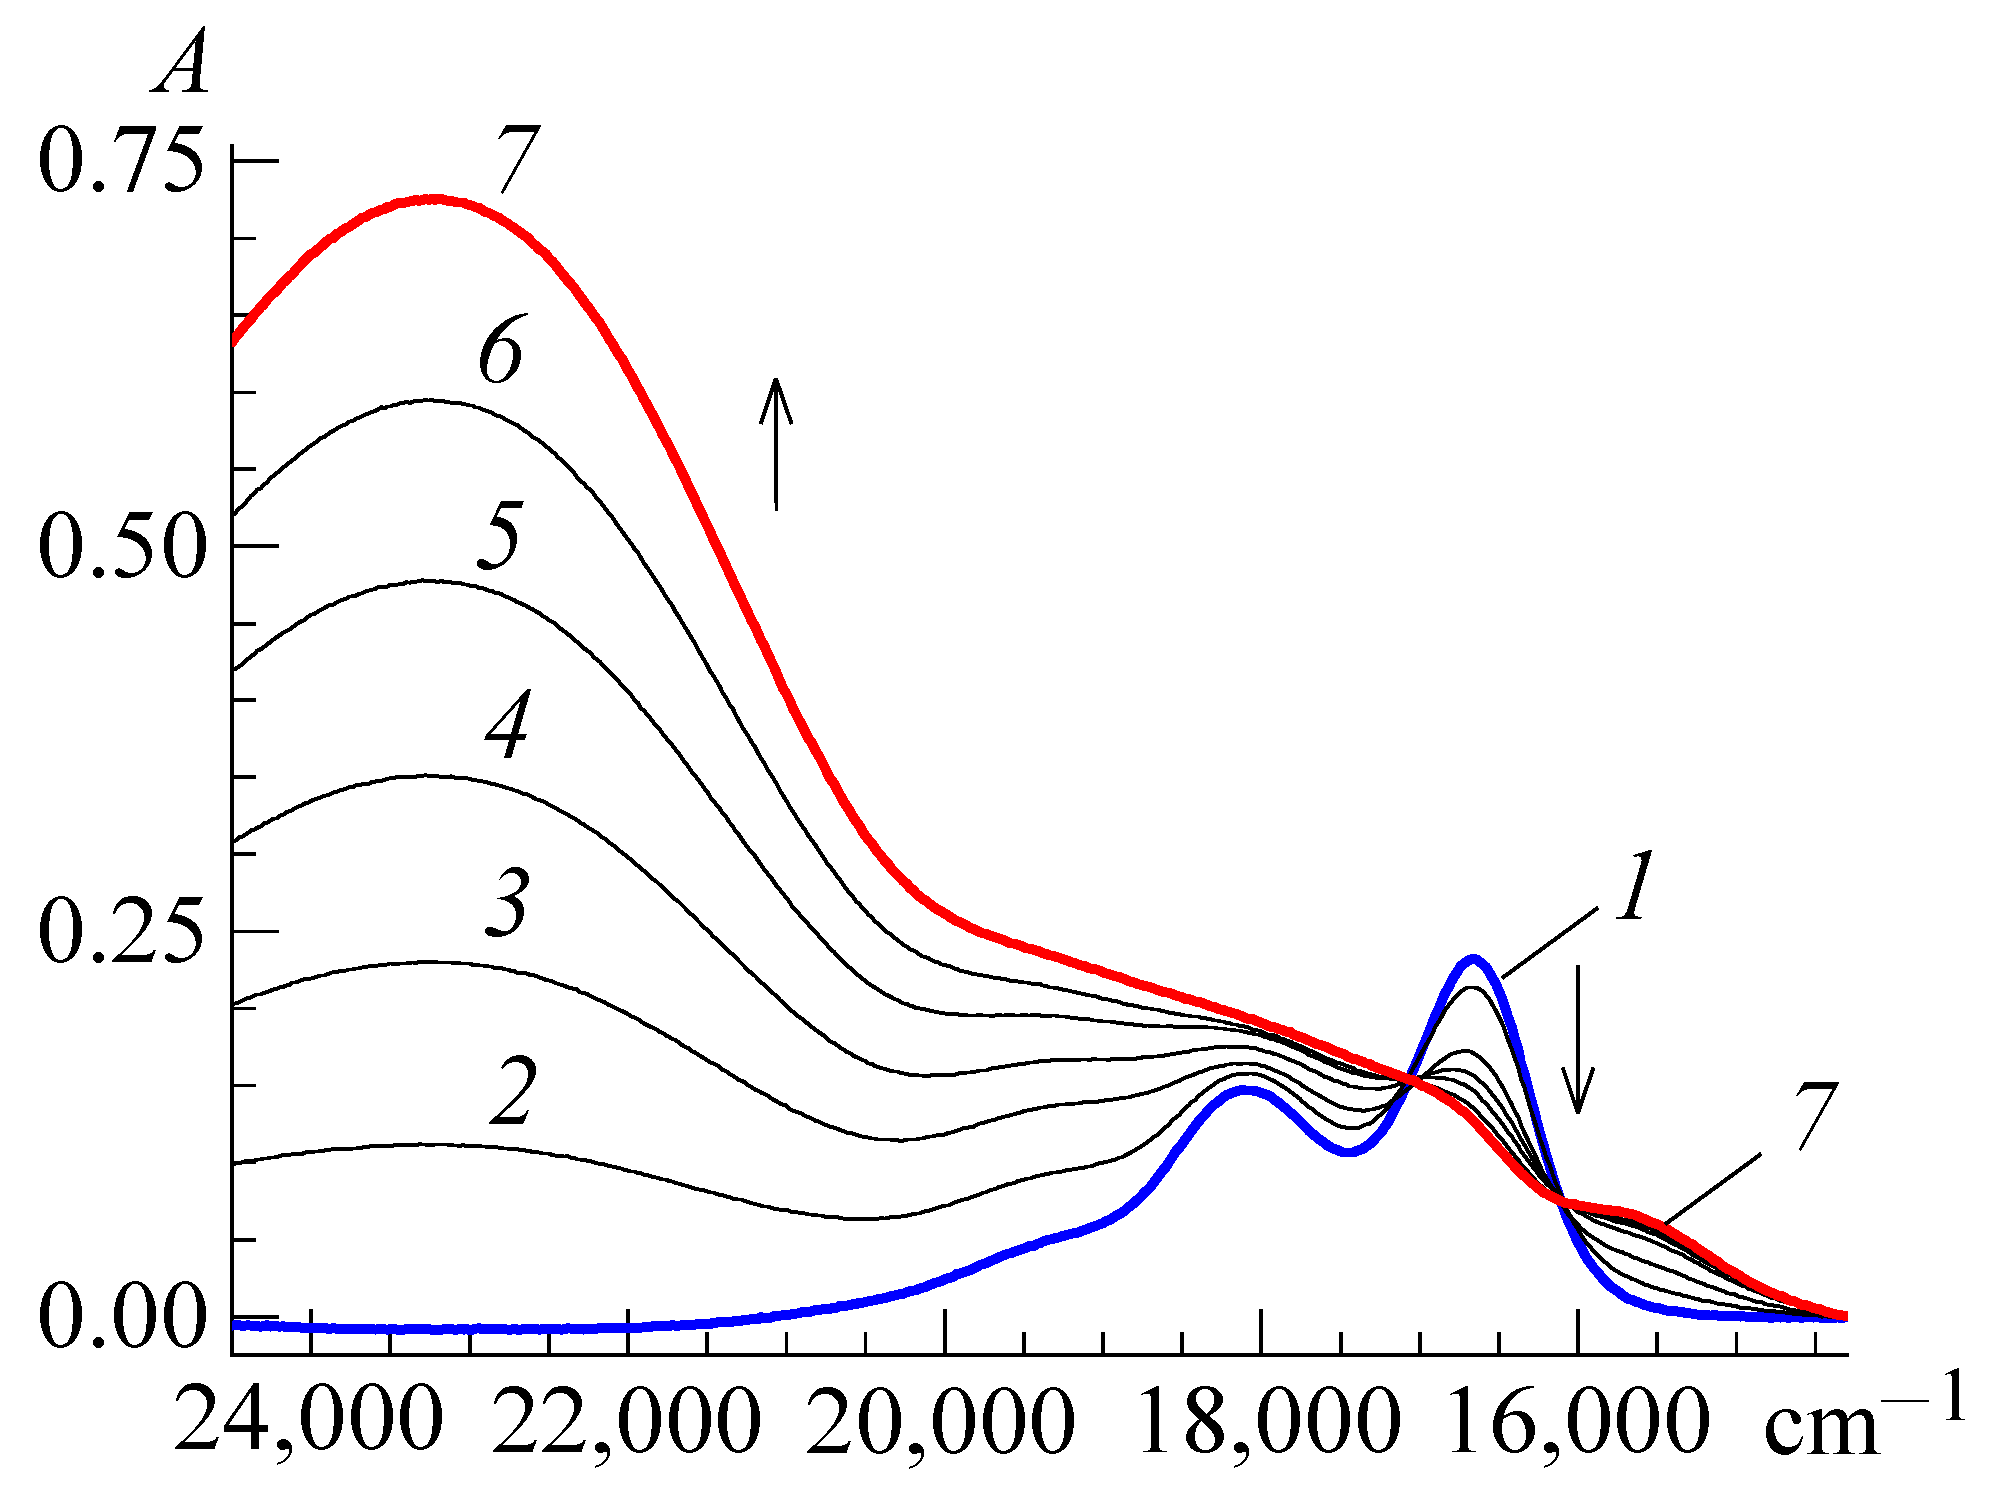
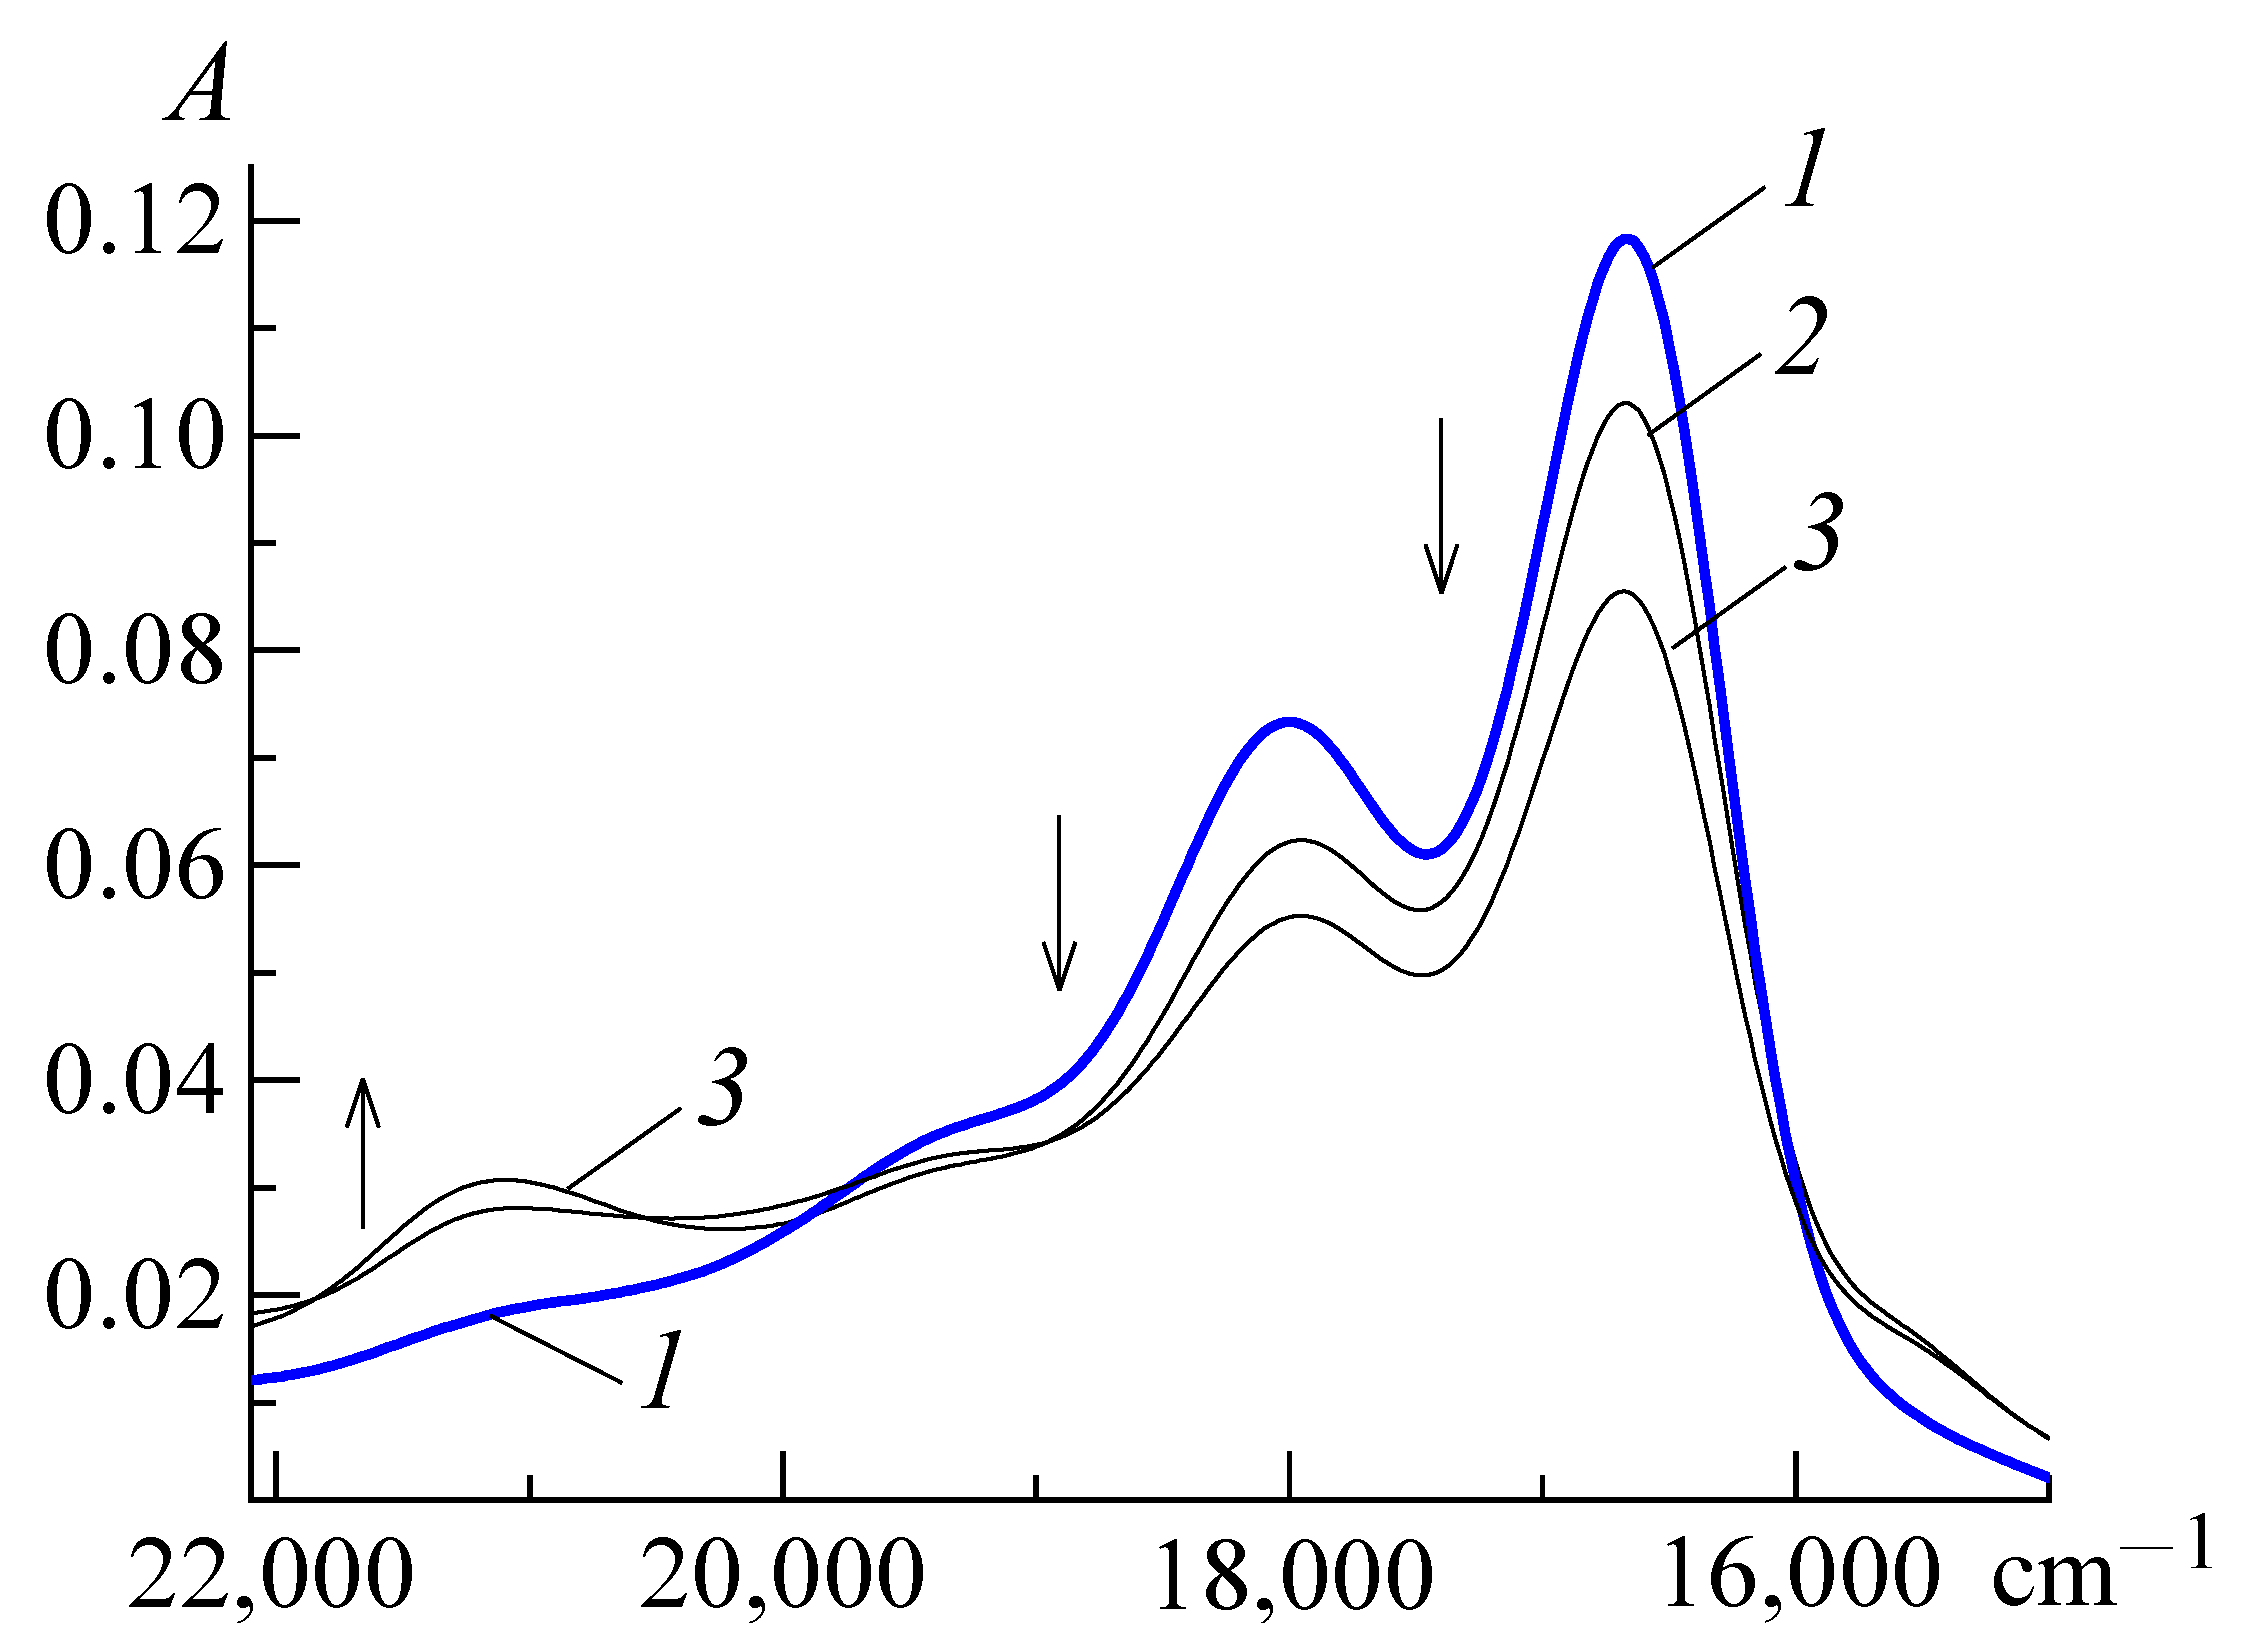
6. Intermolecular Interactions Involving PIN
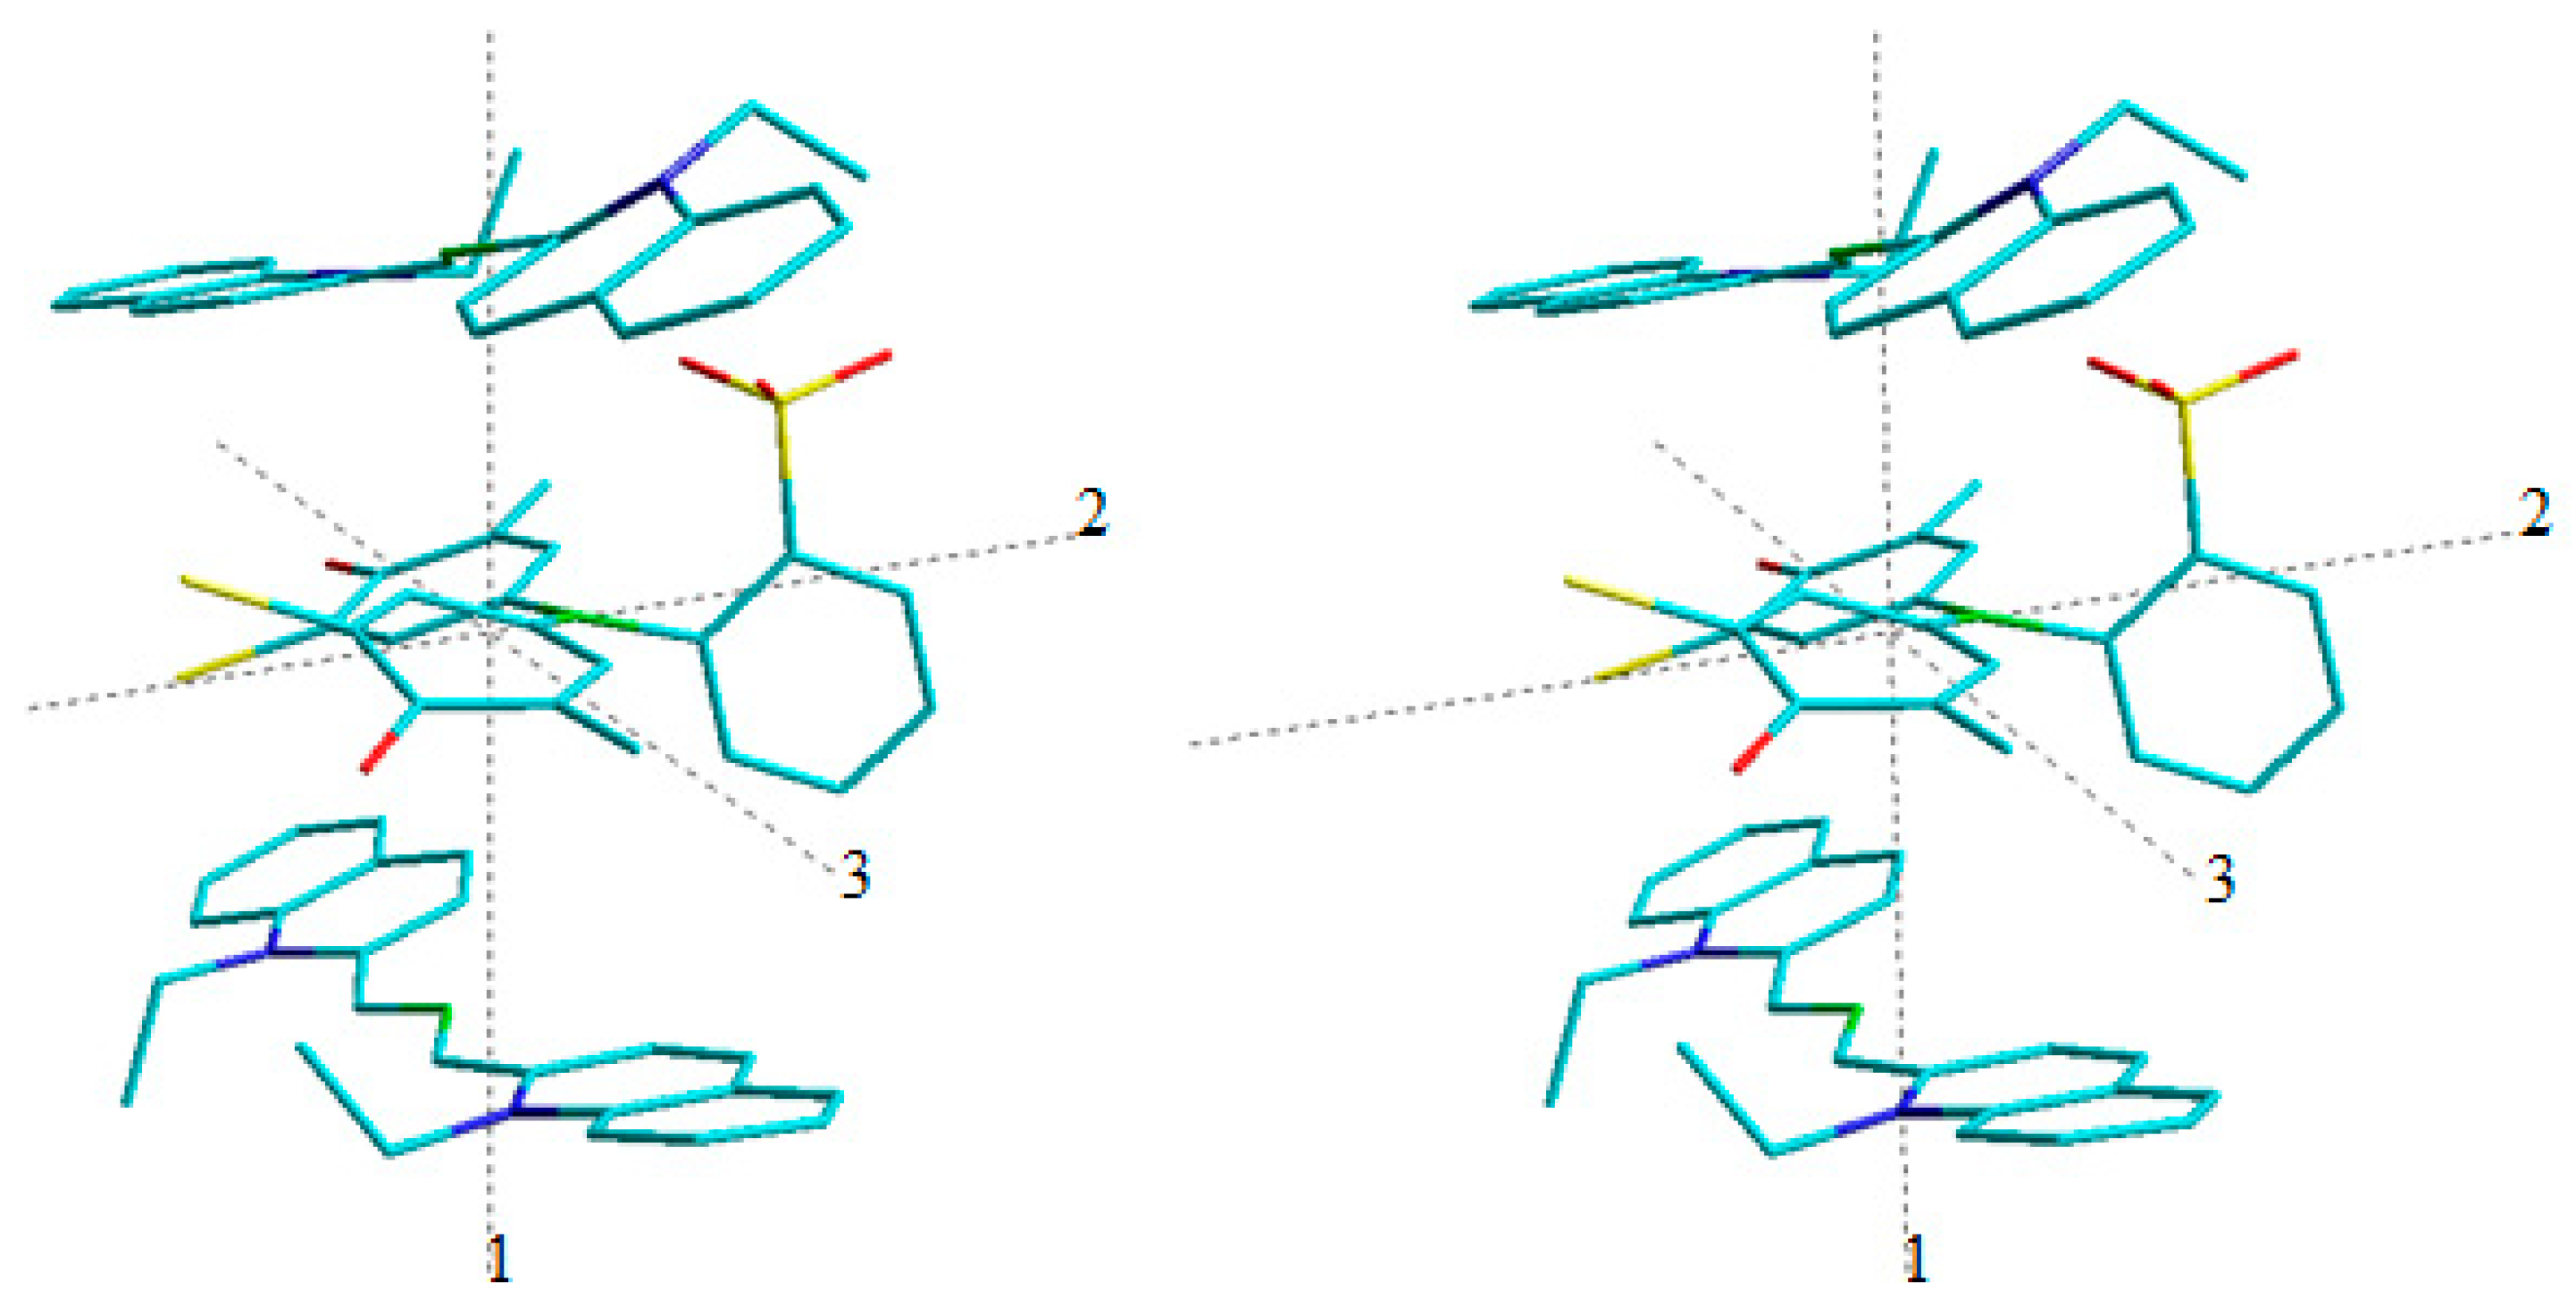
7. PIN in Surfactant-Containing Systems
8. Conclusions
Funding
Institutional Review Board Statement
Informed Consent Statement
Conflicts of Interest
References
- Unverdorben, O. Ueber das Verhalten der organischen Körper in höheren Temperaturen. Ann. Phys. Chem. 1826, 84, 397–410. [Google Scholar] [CrossRef] [Green Version]
- Runge, F.F. LXXV. Ueber einige Produkte der Steinkohlendestillation. Ann. Phys. Chem. 1834, 31, 513–524. [Google Scholar] [CrossRef]
- Fritzsche, J. Ueber das Anilin, ein neues Zersetzungsproduct des Indigo. Justus Liebigs Ann. Chem. 1840, 36, 84–90. [Google Scholar] [CrossRef] [Green Version]
- Zinin, N. Beschreibung einiger neuer organischer Basen, dargestellt durch die Einwirkung des Schwefelwasserstoffes auf Verbindungen der Kohlenwasserstoffe mit Untersalpetersäure. J. Prakt. Chem. 1842, 27, 140–153. [Google Scholar] [CrossRef] [Green Version]
- Hofmann, A. Chemische Untersuchung der organischen Basen im Steinkohlen-Theeröl. Ann. Chem. Pharm. 1843, 47, 37–87. [Google Scholar] [CrossRef]
- Natanson, J. Ueber Acetylamin und seine Derivate. J. Prakt. Chem. 1856, 67, 242–247. [Google Scholar] [CrossRef] [Green Version]
- Hübner, K. 150 Jahre Mauvein. Chem. Zeit 2006, 40, 274–275. [Google Scholar] [CrossRef]
- Travis, A.S. Perkin’s mauve: Ancestor of the organic chemical industry. Technol. Cult. 1990, 31, 51–82. [Google Scholar] [CrossRef]
- Williams, C. XXVI.—Researches on chinoline and its homologues. Trans. R. Soc. Edinb. 1856, 21, 377–401. [Google Scholar] [CrossRef] [Green Version]
- Zollinger, H. Color Chemistry: Syntheses, Properties, and Applications of Organic Dyes and Pigments; John Wiley & Sons: Zürich, Switzerland, 2003; 637p, ISBN 978-3-906-39023-9. [Google Scholar]
- Mishra, A.; Behera, R.; Behera, P.; Mishra, B.; Behera, G. Cyanines during the 1990s: A review. Chem. Rev. 2000, 100, 1973–2012. [Google Scholar] [CrossRef]
- PubChem Open Chemistry Database. Available online: https://pubchem.ncbi.nlm.nih.gov/#query=Pinacyanol&tab=compound (accessed on 27 January 2022).
- Sigma Trade Catalog. Available online: http://www.sigmaaldrich.com/catalog/search/ (accessed on 27 January 2022).
- Joule, J.; Mills, K. Heterocyclic Chemistry; Wiley-Blackwell: New York, NY, USA, 2010; 720p, ISBN 978-1-405-13300-5. [Google Scholar]
- Mitchell, E. Photographic Science; Wiley: New York, NY, USA, 1984; 404p, ISBN 978-0-471-09046-5. [Google Scholar]
- Mees, C.E.K. The Theory of Photographic Process; The Macmillan Company: New York, NY, USA, 1942; 1124p, Available online: https://openlibrary.org/works/OL1156030W/The_theory_of_the_photographic_process (accessed on 13 February 2020).
- Mees, C.E.K. The color sensitivity of photographic materials. J. Frankl. Inst. 1926, 201, 525–551. [Google Scholar] [CrossRef]
- Mills, W.; Hamer, F. CLXXI.—The cyanine dyes. Part III. The constitution of pinacyanol. J. Chem. Soc. Trans. 1920, 117, 1550–1562. [Google Scholar] [CrossRef] [Green Version]
- Hoyt, W. Biographical Memoirs (Vesto Melvin Slipher); National Academy of Sciences: New York, NY, USA, 1980; 495p, ISBN 978-0-309-03099-1. [Google Scholar]
- Slipher, V. The spectra of the major planets. Lowell Observ. Bull. 1908, 42, 231–238. [Google Scholar]
- Lowell, P. The spectra of the major planets. Nature 1908, 79, 42. [Google Scholar] [CrossRef] [Green Version]
- Blythswood, L.; Scoble, W. Photographs of certain ARC spectra from Å 5800 to Å 8300. Astrophys. J. 1906, 24, 125–127. [Google Scholar] [CrossRef]
- Wallace, R. Color filters for astronomical photography with reflecting telescopes. Astrophys. J. 1906, 24, 268–277. [Google Scholar] [CrossRef]
- Wallace, R. Orthochromatism by bathing. Astrophys. J. 1907, 26, 299–325. [Google Scholar] [CrossRef]
- Lazareff, P. Decoloration of pigments in the visible spectrum. J. Russ. Phys. Chem. Soc. Phys. Part 1907, 39, 236–246. [Google Scholar]
- General and physical chemistry. J. Chem. Soc. Abstr. 1908, 94, B1–B31. [CrossRef] [Green Version]
- Slipher, V. The spectrum of Mars. Astrophys. J. 1908, 28, 397–410. [Google Scholar] [CrossRef]
- De la Baume Pluvinel, A.; Baldet, F. Spectrum of comet morehouse (1908 c). Astrophys. J. 1911, 24, 89–111. [Google Scholar] [CrossRef]
- Wallace, R. The function of a color-filter and “isochromatic” plate in astronomical photography. Astrophys. J. 1908, 27, 106–124. [Google Scholar] [CrossRef]
- Ives, H. Experimental study of the Lipmann color photograph. Astrophys. J. 1908, 27, 325–352. [Google Scholar] [CrossRef]
- Wise, L.; Adams, E.; Stewart, J.; Lund, C. Synthesis of photosensitizing dyes: Pinaverdol and pinacyanol. J. Ind. Eng. Chem. 1919, 11, 460–463. [Google Scholar] [CrossRef]
- Hitchins, A. Maintaining photographic standards. J. Frankl. Inst. 1917, 184, 179–203. [Google Scholar] [CrossRef] [Green Version]
- Hitchins, A. Modern applications of photography. J. Frankl. Inst. 1919, 187, 129–146. [Google Scholar] [CrossRef]
- Sheppard, S.; Elliott, F. The reticulation of gelatine. J. Ind. Eng. Chem. 1918, 10, 727–732. [Google Scholar] [CrossRef]
- Sheppard, S.; Meyer, G. Chemical induction in photographic development. I. Induction and the Watkins factor. J. Am. Chem. Soc. 1920, 42, 689–700. [Google Scholar] [CrossRef]
- Sheppard, S.; Elliott, F. Photometric methods and apparatus for the study of colloids. J. Am. Chem. Soc. 1921, 43, 531–539. [Google Scholar] [CrossRef] [Green Version]
- Sheppard, S.; Sweet, S. The setting and melting points of gelatins. J. Ind. Eng. Chem. 1921, 13, 423–426. [Google Scholar] [CrossRef]
- Wightman, E.; Sheppard, S. The size-frequency distribution of particles of silver halide in photographic emulsions and its relation to sensitometric characteristics. J. Phys. Chem. 1921, 25, 181–195. [Google Scholar] [CrossRef] [Green Version]
- Sheppard, S.; Elliott, F. The drying and swelling of gelatin. Preliminary note. J. Am. Chem. Soc. 1922, 44, 373–379. [Google Scholar] [CrossRef] [Green Version]
- Sheppard, S. Recent contributions of chemistry to photography. J. Ind. Eng. Chem. 1922, 14, 820–822. [Google Scholar] [CrossRef] [Green Version]
- Wightman, E.; Trivelli, A.; Sheppard, S. The distribution of sensitivity and size of grain in photographic emulsions. J. Frankl. Inst. 1922, 194, 485–520. [Google Scholar] [CrossRef] [Green Version]
- Sheppard, S. Plasticity in relation to gelatin. J. Frankl. Inst. 1925, 200, 815. [Google Scholar] [CrossRef]
- Sheppard, S. Photographic sensitivity: A colloid chemical problem. J. Frankl. Inst. 1926, 201, 503–504. [Google Scholar] [CrossRef]
- Sheppard, S. Behavior of gelatin in the processing of motion picture film. J. Frankl. Inst. 1928, 205, 571–572. [Google Scholar] [CrossRef]
- Sheppard, S.; Trivelli, A. Comparison of some developers for sensitometric standardization. J. Frankl. Inst. 1929, 208, 434. [Google Scholar] [CrossRef]
- Sheppard, S. The function of gelatin in photographic emulsions. J. Frankl. Inst. 1929, 208, 559. [Google Scholar] [CrossRef]
- Wise, L.; Adams, E. Photographic sensitizing dyes: Their synthesis and absorption spectra. J. Ind. Eng. Chem. 1918, 10, 801–802. [Google Scholar] [CrossRef] [Green Version]
- Mees, C.; Gutekunst, G. Some new sensitizers for the deep red. J. Frankl. Inst. 1922, 194, 549. [Google Scholar] [CrossRef]
- Mees, C.; Gutekunst, G. Some new sensitizers for the deep red. J. Ind. Eng. Chem. 1922, 14, 1060. [Google Scholar] [CrossRef]
- Sheppard, S. Antagonism of radiations in photochemical and photographic reactions. Chem. Rev. 1928, 4, 319–353. [Google Scholar] [CrossRef]
- Sheppard, S.; Lambert, R.; Keenan, R. The adsorption of organic materials to the silver halides. J. Phys. Chem. 1932, 36, 174–184. [Google Scholar] [CrossRef]
- Bancroft, W.; Ackerman, J.; Gallagher, C. Optical sensitization in photography. J. Phys. Chem. 1932, 36, 154–173. [Google Scholar] [CrossRef]
- Doja, M. The cyanine dyes. Chem. Rev. 1932, 11, 273–321. [Google Scholar] [CrossRef]
- Kornfeld, G. The action of optical sensitizers on the photographic plate. J. Phys. Chem. 1938, 42, 795–813. [Google Scholar] [CrossRef]
- Sheppard, S.; Brigham, H. Some effects of solvents upon the absorption spectra of dyes. III. Temperature and organic solutions of cyanine dyes. J. Am. Chem. Soc. 1944, 66, 380–384. [Google Scholar] [CrossRef]
- Sheppard, S.; Geddes, A. Effect of solvents upon the absorption spectra of dyes. IV. Water as solvent: A common pattern. J. Am. Chem. Soc. 1944, 66, 1995–2002. [Google Scholar] [CrossRef]
- Klotz, I. The effects of salts and proteins on the spectra of some dyes and indicators. Chem. Rev. 1947, 41, 373–399. [Google Scholar] [CrossRef]
- Corrin, M.; Harkins, W. The effect of salts on the critical concentration for the formation of micelles in colloidal electrolytes. J. Am. Chem. Soc. 1947, 69, 683–688. [Google Scholar] [CrossRef] [PubMed]
- Merrill, R.; Spencer, R.; Getty, R. The effect of sodium silicates on the absorption spectra of some dyes. J. Am. Chem. Soc. 1948, 70, 2460–2464. [Google Scholar] [CrossRef]
- Merrill, R.; Spencer, R. Spectral changes of pinacyanol chloride in sodium silicate–salt solutions. J. Am. Chem. Soc. 1950, 72, 2894–2899. [Google Scholar] [CrossRef]
- Herzfeld, S. Effect of salt on the critical concentrations of potassium n-alkanecarboxylates as determined by the change in color of pinacyanole. J. Phys. Chem. 1952, 56, 959–963. [Google Scholar] [CrossRef]
- Corrin, M.; Harkins, W. Critical concentrations for micelle formation in mixtures of anionic soaps. J. Coll. Sci. 1946, 1, 469–472. [Google Scholar] [CrossRef]
- Corrin, M.; Harkins, W. Determination of the critical concentration for micelle formation in solutions of colloidal electrolytes by the spectral change of a dye. J. Am. Chem. Soc. 1947, 69, 679–683. [Google Scholar] [CrossRef]
- Klevens, H. The effects of temperature upon the critical concentrations of anionic and cationic detergents. J. Phys. Coll. Chem. 1947, 51, 1143–1154. [Google Scholar] [CrossRef]
- Harkins, W.; Mittelmann, R.; Corrin, M. Types of solubilization in solutions of long-chain colloidal electrolytes. J. Phys. Coll. Chem. 1949, 53, 1350–1361. [Google Scholar] [CrossRef]
- Klevens, H. The effect of added hydrocarbons upon critical concentrations of soap and detergent solutions. J. Phys. Coll. Chem. 1950, 54, 1012–1016. [Google Scholar] [CrossRef]
- Mukerjee, P. Use of ionic dyes in analysis of ionic surfactants and other ionic organic compounds. Anal. Chem. 1956, 28, 870–873. [Google Scholar] [CrossRef]
- Mukerjee, P. The nature of the association equilibria and hydrophobic bonding in aqueous solutions of association colloids. Adv. Coll. Interface Sci. 1967, 1, 242–275. [Google Scholar] [CrossRef]
- Yasunaga, T.; Takeda, K.; Harada, S. Kinetic study of sodium dodecyl sulfate micelle dissociation by a stopped-flow method. J. Coll. Interface Sci. 1973, 42, 457–463. [Google Scholar] [CrossRef]
- Takeda, K.; Tatsumoto, N.; Yasunaga, T. Kinetic study on solubilization of pinacyanol chloride into the micelle of sodium dodecyl sulfate by a stopped-flow technique. J. Coll. Interface Sci. 1974, 47, 128–133. [Google Scholar] [CrossRef]
- Reeves, R. Nature of mixed micelles from anionic dyes and cationic surfactants. Kinetic study. J. Am. Chem. Soc. 1975, 97, 6019–6024. [Google Scholar] [CrossRef]
- Timbers, A.; Lingafelter, E. Irreversible decolorization of pinacyanol chloride in the presence of paraffin-chain salts. J. Am. Chem. Soc. 1949, 71, 4155–4156. [Google Scholar] [CrossRef]
- Wu, J.; Harwell, J.; O’Rear, E. Two-dimensional reaction solvents: Surfactant bilayers in the formation of ultrathin films. Langmuir 1987, 3, 531–537. [Google Scholar] [CrossRef]
- Grieser, F.; Drummond, C. The physicochemical properties of self-assembled surfactant aggregates as determined by some molecular spectroscopic probe techniques. J. Phys. Chem. 1988, 92, 5580–5593. [Google Scholar] [CrossRef]
- West, W.; Carroll, B.; Whitcomb, D. The adsorption of sensitizing dyes in photographic emulsions. J. Phys. Chem. 1952, 56, 1054–1067. [Google Scholar] [CrossRef]
- Herz, A. Aggregation of sensitizing dyes in solution and their adsorption onto silver halides. Adv. Coll. Interface Sci. 1977, 8, 237–298. [Google Scholar] [CrossRef]
- Lutsenko, V.; Lutsenko, E.; Rosenshtein, L. Thermostimulated conductivity in organic dyes (pinacyanol). Phys. Status Sol. A 1970, 2, K165–K168. [Google Scholar] [CrossRef]
- Eske, A.; Razi Naqvi, K. Viscosity dependence of the fluorescence lifetimes of cryptocyanine, pinacyanol and DDI. Chem. Phys. Lett. 1979, 63, 128–132. [Google Scholar] [CrossRef]
- McGarry, M.; Hazel, J. Flocculation of pinacyanol chloride in alkali silicate solutions. J. Coll. Sci. 1964, 19, 294–301. [Google Scholar] [CrossRef]
- Kainz, G. Mit der spektralphotometrischen Bestimmung der Farbstoffe Pinacyanol und Pinakryptolgrün. Fresenius’ Z. Anal. Chem. 1962, 187, 225. [Google Scholar] [CrossRef]
- McQuillen, K.I. Effect of cetyl-trimethyl-ammonium bromide on the electrophoretic mobility of certain gram-positive bacteria. Biochim. Biophys. Acta 1950, 5, 463–471. [Google Scholar] [CrossRef]
- Babko, A.; Vasilieva, E. Complex compounds of pinacyanol with mercury. (For use in the analysis of complexes of cyanine dyes with metals). J. Anal. Chem. 1947, 2, 159–166. (In Russian) [Google Scholar]
- Vasilieva, E. Qualitative discovery of silver and mercury ions and their quantitative (colorimetric) determination. J. Anal. Chem. 1947, 2, 167–172. (In Russian) [Google Scholar]
- Babko, A.; Turov, D.; Turov, P. Polymolybdate of pinacyanol. Ukr. Chem. J. 1969, 35, 953–957. (In Russian) [Google Scholar]
- Turov, P.; Turov, D. Microtitrimetric determination of tungsten with pinacyanol. J. Anal. Chem. 1970, 25, 934–939. (In Russian) [Google Scholar]
- Guseinov, I.; Rustamov, N.; Bagbagly, S. Pinacyanol as a reagent for the extraction-photometric determination of rhenium (VII). Azerb. Chem. J. 1976, 4, 138–142. (In Russian) [Google Scholar]
- Anglister, J.; Steinberg, I. Resonance Rayleigh scattering of cyanine dyes in solution. J. Chem. Phys. 1983, 78, 5358–5368. [Google Scholar] [CrossRef]
- Barazzouk, S.; Lee, H.; Hotchandani, S.; Kamat, P. Photosensitization aspects of pinacyanol H-aggregates. Charge injection from singlet and triplet excited states into SnO2 nanocrystallites. J. Phys. Chem. B 2000, 104, 3616–3623. [Google Scholar] [CrossRef]
- Sundstroem, V.; Gillbro, T. Viscosity-dependent isomerization yields of some cyanine dyes. A picosecond laser spectroscopy study. J. Phys. Chem. 1982, 86, 1788–1794. [Google Scholar] [CrossRef]
- Gillbro, T.; Sundstrom, V. Picosecond spectroscopy using continuous analyzing light. Electronic relaxation in pinacyanol. Chem. Phys. Lett. 1980, 74, 188–192. [Google Scholar] [CrossRef]
- Arvis, M.; Mialocq, J. Flash photolysis of cyanine dyes. Pinacyanol chloride (1,1′-diethyl-2,2′-carbocyanine chloride). J. Chem. Soc. Faraday Trans. 2 Mol. Chem. Phys. 1979, 75, 415–421. [Google Scholar] [CrossRef]
- Fassler, D.; Feller, K.-H. Picosecond spectroscopy of polymethine dyes. J. Mol. Struct. 1988, 173, 377–387. [Google Scholar] [CrossRef]
- Werncke, W.; Tschol, T.; Weigmann, H.; Pfeiffer, M.; Lau, A.; Rentsch, S.; Graness, A. Photoisomerization studies of pinacyanol using nanosecond time-resolved resonance cars. J. Raman Spectr. 1987, 18, 323–326. [Google Scholar] [CrossRef]
- Stiel, H.; Teuchner, K.; Dähne, S. Photophysikalische Parameter des Pinacyanols aus nichtlinearen Absorptionsmessungen mit Nanosekundenimpulsen. Z. Chem. 2010, 25, 264–265. [Google Scholar] [CrossRef]
- Kaschke, M.; Kleinschmidt, J.; Wilhelmi, B. Calculation of the viscosity dependence of the excited-state lifetime in pinacyanol solution. Chem. Phys. Lett. 1984, 106, 428–430. [Google Scholar] [CrossRef]
- Sundstrom, V.; Gillbro, T. Transient absorption spectra of pinacyanol and cyanine photoisomers obtained with a sync-pumped picosecond dye laser and independently tunable probe light. Chem. Phys. Lett. 1983, 94, 580–584. [Google Scholar] [CrossRef]
- Thistlethwaite, P.; Griesser, H. The temperature dependence of the fluorescence lifetime of pinacyanol iodide. Chem. Phys. Lett. 1982, 91, 58–62. [Google Scholar] [CrossRef]
- Rentsch, S.; Danielius, R.; Gadonas, R. Ultrafast photophysical processes in pinacyanol after selective excitation. Chem. Phys. 1981, 59, 119–123. [Google Scholar] [CrossRef]
- Hébert, P.; Marguet, S.; Gustavsson, T.; Mialocq, J. Pinacyanol chloride as a saturable absorber in rhodamine B and 6G hybridly mode-locked dye lasers. Opt. Commun. 1992, 90, 85–88. [Google Scholar] [CrossRef]
- Iwamoto, Y.; Murakami, K.; Danno, M.; Tsuchiya, M.; Masuzawa, T.; Shimizu, T.; Morita, T.; Yanagihara, Y. Singlet oxygen production and photobiological effects of pinacyanol chloride on yeast Saccharomyces cerevisiae. J. Pharm.-Dynam. 1990, 13, 316–320. [Google Scholar] [CrossRef] [PubMed] [Green Version]
- Mialocq, J.; Jaraudias, J.; Goujon, P. Picosecond spectroscopy of pinacyanol (1,1′-diethyl-2,2′-monocarbocyanine chloride). Chem. Phys. Lett. 1977, 47, 123–126. [Google Scholar] [CrossRef]
- Mialocq, J. Picosecond study of pinacyanol photophysics. Chem. Phys. 1982, 73, 107–115. [Google Scholar] [CrossRef]
- Heisel, F.; Miehé, J.; Rachidi, J. The dynamics of the intramolecular and orientational motions of pinacyanol. Chem. Phys. Lett. 1987, 134, 379–384. [Google Scholar] [CrossRef]
- Sato, H.; Kawasaki, M.; Kasatani, K. Fluorescence and energy transfer of dye-detergent systems in the premicellar region. J. Photochem. 1981, 17, 243–248. [Google Scholar] [CrossRef]
- Manna, K.; Panda, A. Spectral studies on the interaction of pinacyanol chloride with binary surfactants in aqueous medium. Spectrochim. Acta A Mol. Biomol. Spectr. 2009, 74, 1268–1274. [Google Scholar] [CrossRef]
- Kodama, M.; Tagashira, Y.; Nagata, C. The interaction of pinacyanol with nucleic acids. Biochim. Biophys. Acta 1966, 129, 638–640. [Google Scholar] [CrossRef]
- Kodama, M.; Tagashira, Y.; Nagata, C. The interaction of pinacyanol and quinoline-1-oxides with nucleic acids: The base specificity of binding. J. Biochem. 1968, 64, 167–170. [Google Scholar] [CrossRef]
- Klinger, H.; Hammond, D. Rapid chromosome and sex-chromatin staining with pinacyanol. Stain Technol. 1971, 46, 43–47. [Google Scholar] [CrossRef] [PubMed]
- Kamimura, A. Colorimetric determination of long-chain n-acylglutamic acids with pinacyanol. Agric. Biol. Chem. 1973, 37, 457–464. [Google Scholar] [CrossRef]
- Pal, M.; Mandel, M. Differentiation between the α-helical and coillike conformations of poly(L-glutamic acid) in aqueous solution through binding of pinacyanol. Biopolymers 1979, 18, 2267–2277. [Google Scholar] [CrossRef]
- Narayan, R. A technique for C-banding chromosomes with pinacyanol chloride. Stain Technol. 1980, 55, 9–11. [Google Scholar] [CrossRef]
- Watanabe, M.; Williams, C. Mitochondria in the flight muscles of insects. J. Gen. Physiol. 1951, 34, 675–689. [Google Scholar] [CrossRef] [Green Version]
- Bensley, S. Pinacyanol erythrosinate as a stain for mast cells. Stain Technol. 1952, 27, 269–273. [Google Scholar] [CrossRef]
- Tanaka, Y. Effect of the ruby laser microbeam on mitochondria of KB cells supravitally stained by pinacyanol. J. Cell Biol. 1969, 41, 424–430. [Google Scholar] [CrossRef]
- Hellberg, H.; Bjerkås, I.; Vågnes, Ø.; Noga, E. Mast cells in common wolffish Anarhichas lupus L.: Ontogeny, distribution and association with lymphatic vessels. Fish Shellfish Immunol. 2013, 35, 1769–1778. [Google Scholar] [CrossRef]
- Bucholtz, M.; Light, R. Acetylation of 13-sophorosyloxydocosanoic acid by an acetyltransferase purified from Candida bogoriensis. J. Biol. Chem. 1976, 251, 424–430. [Google Scholar] [CrossRef]
- Dufrenoy, J. Emploi du pinacyanol pour l’étude du mécanisme d’action d’antibiotiques. Ann. Inst. Pasteur 1953, 85, 396–397. [Google Scholar]
- Sugimura, T.; Okabe, K.; Kodama, M. Induction of respiration-deficient mutant of Saccharomyces cerevisiae by pinacyanol. J. Bacteriol. 1969, 97, 964–965. [Google Scholar] [CrossRef] [PubMed] [Green Version]
- Shklyarevskiy, I.; Boamfa, M.; Christianen, P.; Touhari, F.; van Kempen, H.; Deroover, G.; Callant, P.; Maan, J. Magnetic field induced alignment of cyanine dye J-aggregates. J. Chem. Phys. 2002, 116, 8407–8410. [Google Scholar] [CrossRef]
- Dan, P.; Willner, I.; Dixit, N.; Mackay, R. Effects of colloidal SiO2 and cyclodextrins on the aggregation of dyes in aqueous solutions. J. Chem. Soc. Perkin Trans. 1984, 2, 455–459. [Google Scholar] [CrossRef]
- Rodríguez-Abreu, C.; Torres, C.; Tiddy, G. Chromonic liquid crystalline phases of pinacyanol acetate: Characterization and use as templates for the preparation of mesoporous silica nanofibers. Langmuir 2011, 27, 3067–3073. [Google Scholar] [CrossRef] [PubMed]
- Kobayashi, M.; Yuan, X.; Sakai, H.; Hoshi, T.; Okubo, J.; Tanizaki, Y. Preliminary analysis of the electronic absorption spectrum of a solute in a biaxially-stretched polymer film. Bull. Chem. Soc. Jpn. 1992, 65, 463–470. [Google Scholar] [CrossRef]
- Permogorov, V.; Lazurkin, Y. Study of anomalous dispersion of optical activity of complexes of desoxyribonucleic acid of phage T2 with pinacyanol. Polym. Sci. 1966, 8, 1238–1247. [Google Scholar] [CrossRef]
- Nunn, C.; Schechter, R.; Wade, W. Visual evidence regarding the nature of hemimicelles through surface solubilization of pinacyanol chloride. J. Phys. Chem. 1982, 86, 3271–3272. [Google Scholar] [CrossRef]
- Sato, H.; Kawasaki, M.; Kasatani, K. Energy transfer between rhodamine 6G and pinacyanol enhanced with sodium dodecyl sulfate in the premicellar region. Formation of dye-rich induced micelles. J. Phys. Chem. 1983, 87, 3759–3769. [Google Scholar] [CrossRef]
- Takeda, K.; Ohtawa, T.; Hachiya, K.; Aoki, K. Kinetics of the solubilization of pinacyanol chloride into a complex between bovine serum albumin and sodium dodecyl sulfate. Bull. Chem. Soc. Jpn. 1987, 60, 1174–1176. [Google Scholar] [CrossRef] [Green Version]
- Pal, M.; Pal, P. Dichroic probe of different modes of aggregation of pinacyanol by bis(2-ethylhexyl)sulfosuccinate below and above its critical micelle concentration. J. Phys. Chem. 1990, 94, 2557–2559. [Google Scholar] [CrossRef]
- Corrin, M.; Klevens, H.; Harkins, W. The determination of critical concentrations for the formation of soap micelles by the spectral behavior of pinacyanol chloride. J. Chem. Phys. 1946, 14, 480–486. [Google Scholar] [CrossRef]
- Mukerjee, P.; Mysels, K. A re-evaluation of the spectral change method of determining critical micelle concentration. J. Am. Chem. Soc. 1955, 77, 2937–2943. [Google Scholar] [CrossRef]
- Chakrabarti, A.; Nath, R.; Chakraborty, A. Induction of metachromasy in cationic dye by bacterial cell surface polysaccharide from Klebsiella K10. Spectrochim. Acta Part A Mol. Spectr. 1989, 45, 981–982. [Google Scholar] [CrossRef]
- Chakrabarti, A.; Nath, R.; Chakraborty, A. Chromotropic character of bacterial acidic polysaccharides: Part II–Induction of metachromasy in cationic dye pinacyanol chloride by Klebsiella K10 capsular polysaccharide. Ind. J. Biochem. Biophys. 1989, 26, 74–79. [Google Scholar]
- Nath, R.; Singh, T.; Dasgupta, S.; Mitra, A.; Panda, A. Interaction of cationic dye/surfactants with Klebsiella K18 capsular polysaccharides: Physico-chemical studies. Mater. Sci. Eng. C 2010, 30, 549–554. [Google Scholar] [CrossRef]
- Panda, A.; Chakraborty, A. Studies on the interaction of bacterial lipopolysaccharide with cationic dyes by absorbance and fluorescence spectroscopy. J. Photochem. Photobiol. A Chem. 1997, 111, 157–162. [Google Scholar] [CrossRef]
- Mitra, A.; Nath, R.; Chakraborty, A. Studies on induction of metachromasy in cationic dye pinacyanol chloride by Klebsiella K7 capsular polysaccharide. Ind. J. Biochem. Biophys. 1992, 29, 411–414. [Google Scholar]
- Mitra, A.; Chakraborty, A. Absorption and fluorescence studies on interaction between cationic dyes and Klebsiella K7 capsular polysaccharide. Ind. J. Biochem. Biophys. 1992, 29, 291–295. [Google Scholar]
- Mitra, A.; Chakrabarti, A.; Nath, R.; Chakraborty, A. Chromotropic character of bacterial acidic polysaccharides: Part III-Interaction of cationic dye pinacyanol chloride with Klebsiella K15 capsular polysaccharide. Ind. J. Biochem. Biophys. 1990, 27, 291–294. [Google Scholar]
- Mitra, A.; Chakraborty, A. Spectrophotometric and spectrofluorometric studies on interaction of cationic dyes with bacterial capsular polysaccharide. Ind. J. Biochem. Biophys. 1998, 35, 241–246. [Google Scholar]
- Teobaldi, G.; Zerbetto, F. Molecular dynamics of a dendrimer-dye guest-host system. J. Am. Chem. Soc. 2003, 125, 7388–7393. [Google Scholar] [CrossRef] [PubMed]
- Gopidas, K.; Whitesell, J.; Fox, M. Metal-core-organic shell dendrimers as unimolecular micelles. J. Am. Chem. Soc. 2003, 125, 14168–14180. [Google Scholar] [CrossRef] [PubMed]
- Aulenta, F.; Hayes, W.; Rannard, S. Dendrimers: A new class of nanoscopic containers and delivery devices. Eur. Polym. J. 2003, 39, 1741–1771. [Google Scholar] [CrossRef]
- Mayes, A.; Blyth, J.; Millington, R.; Lowe, C. Metal ion-sensitive holographic sensors. Anal. Chem. 2002, 74, 3649–3657. [Google Scholar] [CrossRef] [PubMed]
- Hait, S.; Majhi, P.; Blume, A.; Moulik, S. A critical assessment of micellization of sodium dodecyl benzene sulfonate (SDBS) and its interaction with poly(vinyl pyrrolidone) and hydrophobically modified polymers, JR 400 and LM 200. J. Phys. Chem. B 2003, 107, 3650–3658. [Google Scholar] [CrossRef]
- Laschewsky, A.; Wattebled, L.; Arotçaréna, M.; Habib-Jiwan, J.; Rakotoaly, R. Synthesis and properties of cationic oligomeric surfactants. Langmuir 2005, 21, 7170–7179. [Google Scholar] [CrossRef]
- Jones, G.; Jiang, H. Detection of lipopolysaccharide and lipid a employing a spermine−pyrene conjugate. Bioconjug. Chem. 2005, 16, 621–625. [Google Scholar] [CrossRef]
- Jana-Sur, P.; Chakraborty, A. Studies on the interaction of bacterial capsular polysaccharide-Klebsiella K16 with cationic dyes. J. Photochem. Photobiol. A Chem. 2005, 173, 64–69. [Google Scholar] [CrossRef]
- Mitra, A.; Nath, R.; Biswas, S.; Chakraborty, A.; Panda, A. A comparative study on the physico-chemical properties of bacterial capsular polysaccharides from different serotypes of Klebsiella. J. Photochem. Photobiol. A Chem. 2006, 178, 98–105. [Google Scholar] [CrossRef]
- Dasgupta, S.; Nath, R.; Biswas, S.; Mitra, A.; Panda, A. Interactions of bacterial polysaccharides with cationic dyes: Physicochemical studies. Ind. J. Biochem. Biophys. 2009, 46, 192–197. [Google Scholar]
- Voigt, G.; Nowak, F.; Ehlert, J.; Beenken, W.; Leupold, D.; Sandner, W. Substructures and different energy relaxation time within the first electronic transition of pinacyanol. Chem. Phys. Lett. 1997, 278, 380–390. [Google Scholar] [CrossRef]
- Mitchell, D.; Ryabov, A.; Kundu, S.; Chanda, A.; Collins, T. Oxidation of pinacyanol chloride by H2O2 catalyzed by FeIII complexed to tetraamidomacrocyclic ligand: Unusual kinetics and product identification. J. Coord. Chem. 2010, 63, 2605–2618. [Google Scholar] [CrossRef]
- Tang, L.; Gunderson, W.; Weitz, A.; Hendrich, M.; Ryabov, A.; Collins, T. Activation of dioxygen by a TAML activator in reverse micelles: Characterization of an FeIIIFeIV dimer and associated catalytic chemistry. J. Am. Chem. Soc. 2015, 137, 9704–9715. [Google Scholar] [CrossRef] [Green Version]
- Cano-Sarabia, M.; Angelova, A.; Ventosa, N.; Lesieur, S.; Veciana, J. Cholesterol induced CTAB micelle-to-vesicle phase transitions. J. Coll. Interface Sci. 2010, 350, 10–15. [Google Scholar] [CrossRef]
- Berlepsch, H.; Ludwig, K.; Böttcher, C. Pinacyanol chloride forms mesoscopic H- and J-aggregates in aqueous solution—A spectroscopic and cryo-transmission electron microscopy study. Phys. Chem. Chem. Phys. 2014, 16, 10659–10668. [Google Scholar] [CrossRef] [PubMed] [Green Version]
- Grygorova, G.; Klochkov, V.; Yefimova, S.; Malyukin, Y. Effects of orthovanadate-based nanoparticles of various sizes on the aggregation behavior of polymethine dyes in aqueous solutions. Chem. Phys. Lett. 2015, 621, 46–51. [Google Scholar] [CrossRef]
- Christensson, N.; Milota, F.; Hauer, J.; Sperling, J.; Bixner, O.; Nemeth, A.; Kauffmann, H. High frequency vibrational modulations in two-dimensional electronic spectra and their resemblance to electronic coherence signatures. J. Phys. Chem. B 2011, 115, 5383–5391. [Google Scholar] [CrossRef]
- Delgado, J.; Selsby, R. Density functional theory calculations on rhodamine B and pinacyanol chloride. Optimized ground state, dipole moment, vertical ionization potential, adiabatic electron affinity and lowest excited triplet state. Photochem. Photobiol. 2012, 89, 51–60. [Google Scholar] [CrossRef]
- Galestian Pour, A.; Lincoln, C.; Perlík, V.; Šanda, F.; Hauer, J. Anharmonic vibrational effects in linear and two-dimensional electronic spectra. Phys. Chem. Chem. Phys. 2017, 19, 24752–24760. [Google Scholar] [CrossRef]
- Magana, J.; Gumí-Audenis, B.; Tas, R.; Gascoigne, L.; Atkins, D.; Voets, I. Bioinspired scaffolding by supramolecular amines allows the formation of one- and two-dimensional silica superstructures. Chem. Eur. J. 2020, 26, 15330–15336. [Google Scholar] [CrossRef]
- Mewes, L.; Ingle, R.; Al Haddad, A.; Chergui, M. Broadband visible two-dimensional spectroscopy of molecular dyes. J. Chem. Phys. 2021, 155, 034201. [Google Scholar] [CrossRef] [PubMed]
- Yu, G.; Walker, M.; Wilson, M. Atomistic simulation studies of ionic cyanine dyes: Self-assembly and aggregate formation in aqueous solution. Phys. Chem. Chem. Phys. 2021, 23, 6408–6421. [Google Scholar] [CrossRef] [PubMed]
- Kiprianov, A. Absorption spectra of organic dyes containing two chromophores. Russ. Chem. Rev. 1971, 40, 594–607. [Google Scholar] [CrossRef]
- Yuzhakov, V. Association of dye molecules and its spectroscopic manifestation. Russ. Chem. Rev. 1979, 48, 1076–1091. [Google Scholar] [CrossRef]
- Ishchenko, A. Structure and spectral-luminescent properties of polymethine dyes. Russ. Chem. Rev. 1991, 60, 865–884. [Google Scholar] [CrossRef]
- Yuzhakov, V. Aggregation of dye molecules and its influence on the spectral luminescent properties of solutions. Russ. Chem. Rev. 1992, 61, 613–628. [Google Scholar] [CrossRef]
- Shapiro, B. Molecular assemblies of polymethine dyes. Russ. Chem. Rev. 2006, 75, 433–456. [Google Scholar] [CrossRef]
- Nandini, R.; Vishalakshi, B. A study of interaction of cationic dyes with anionic polyelectrolytes. Spectrochim. Acta Part A Mol. Biomol. Spectr. 2010, 75, 14–20. [Google Scholar] [CrossRef]
- Nandini, R.; Vishalakshi, B. A comparitive study of polyelectrolyte–dye interactions. Spectrochim. Acta Part A Mol. Biomol. Spectr. 2009, 74, 1025–1030. [Google Scholar] [CrossRef]
- Nandini, R.; Vishalakshi, B. Spectophotometric study of interaction between sodium carrageenate and cationic dyes. J. Chem. 2011, 8, S253–S265. [Google Scholar] [CrossRef]
- Gadde, S.; Batchelor, E.; Weiss, J.; Ling, Y.; Kaifer, A. Control of H- and J-aggregate formation via host−guest complexation using cucurbituril hosts. J. Am. Chem. Soc. 2008, 130, 17114–17119. [Google Scholar] [CrossRef] [PubMed]
- Gadde, S.; Batchelor, E.; Kaifer, A. Controlling the formation of cyanine dye H- and J-aggregates with cucurbituril hosts in the presence of anionic polyelectrolytes. Chem. Eur. J. 2009, 15, 6025–6031. [Google Scholar] [CrossRef] [PubMed]
- Batchelor, E.; Gadde, S.; Kaifer, A. Host–guest control on the formation of pinacyanol chloride H-aggregates in anionic polyelectrolyte solutions. Supramol. Chem. 2010, 22, 40–45. [Google Scholar] [CrossRef]
- Ishchenko, A.; Shapovalov, S. Heterogeneous association of the ions of dyes in solutions (review). J. Appl. Spectr. 2004, 71, 605–629. [Google Scholar] [CrossRef]
- Namani, T.; Ishikawa, T.; Morigaki, K.; Walde, P. Vesicles from docosahexaenoic acid. Coll. Surf. B BioInterface 2007, 54, 118–123. [Google Scholar] [CrossRef]
- Scalia, S.; Tursilli, R.; Bianchi, A.; Nostro, P.; Bocci, E.; Ridi, F.; Baglioni, P. Incorporation of the sunscreen agent, octyl methoxycinnamate in a cellulosic fabric grafted with β-cyclodextrin. Int. J. Pharm. 2006, 308, 155–159. [Google Scholar] [CrossRef]
- Solier, J.; Galera-Cortés, E.; Sabaté, R.; Estelrich, J. Translational diffusion in charged phospholipid bilayer membranes. Coll. Surf. A Physicochem. Eng. Asp. 2005, 270–271, 88–92. [Google Scholar] [CrossRef]
- Haro-Pérez, C.; Quesada-Pérez, M.; Callejas-Fernández, J.; Sabaté, R.; Estelrich, J.; Hidalgo-Álvarez, R. Probing the jellium model with colloidal dispersions of charged liposomes. Coll. Surf. A Physicochem. Eng. Asp. 2005, 270–271, 352–356. [Google Scholar] [CrossRef]
- Sabaté, R.; Estelrich, J. Pinacyanol as effective probe of fibrillar β-amyloid peptide: Comparative study with Congo red. Biopolymers 2003, 72, 455–463. [Google Scholar] [CrossRef]
- Sabaté, R.; Gallardo, M.; Estelrich, J. An autocatalytic reaction as a model for the kinetics of the aggregation of β-amyloid. Biopolymers 2003, 71, 190–195. [Google Scholar] [CrossRef]
- Sabaté, R.; Gallardo, M.; Estelrich, J. Temperature dependence of the nucleation constant rate in β amyloid fibrillogenesis. Int. J. Biol. Macromol. 2005, 35, 9–13. [Google Scholar] [CrossRef] [PubMed]
- Sabaté, R.; Estelrich, J. Stimulatory and inhibitory effects of alkyl bromide surfactants on β-amyloid fibrillogenesis. Langmuir 2005, 21, 6944–6949. [Google Scholar] [CrossRef] [PubMed]
- Sabaté, R.; Estelrich, J. Evidence of the existence of micelles in the fibrillogenesis of β-amyloid peptide. J. Phys. Chem. B 2005, 109, 11027–11032. [Google Scholar] [CrossRef] [PubMed]
- Poltev, V.; Grokhlina, T.; González, E.; Deriabina, A.; Cruz, A.; Gorb, L.; Leszczynski, J.; Djimant, L.; Veselkov, A. The study of three-dimensional structure of caffeine associates using computational and experimental methods. J. Mol. Struct. THEOCHEM 2004, 709, 123–128. [Google Scholar] [CrossRef]
- Veselkov, A.; Evstigneev, M.; Rozvadovskaya, A.; Hernandez Santiago, A.; Zubchenok, O.; Djimant, L.; Davies, D. 1H NMR structural and thermodynamical analysis of the hetero-association of daunomycin and novatrone in aqueous solution. J. Mol. Struct. 2004, 701, 31–37. [Google Scholar] [CrossRef]
- Davies, D.; Evstigneev, M.; Veselkov, D.; Veselkov, A. Hetero-association of anticancer antibiotics in aqueous solution: NMR and molecular mechanics analysis. Biophys. Chem. 2005, 117, 111–118. [Google Scholar] [CrossRef]
- Grigorev, I.; Korzhevskii, D. Modern imaging technologies of mast cells for biology and medicine (review). Mod. Technol. Med. 2021, 13, 93–109. [Google Scholar] [CrossRef]
- Shapovalov, S.; Koval, V.; Mchedlov-Petrossyan, N.; Kleschevnikova, V.; Derevyanko, N.; Ishchenko, A. Influence of the polymethine chain length of indopolycarbocyanine cations on their association with anionic dyes in water. Rep. NAS Ukr. 1999, 2, 156–161. (In Russian) [Google Scholar]
- Shapovalov, S.; Svishcheva, Y. Effect of cationic surfactants on association of pinacyanol with organic counterions. Russ. J. Appl. Chem. 2002, 75, 452–456. [Google Scholar] [CrossRef]
- Shapovalov, S.; Svishcheva, Y.; Larin, V. Association of pinacyanol with sulfonephthalein and oxyxanthene anions in aqueous solutions. Ukr. Chem. J. 2002, 68, 107–110. (In Russian) [Google Scholar]
- Shapovalov, S. Interaction of cationic forms of pinacyanol with organic anions in aqueous solutions: Estimation of structural factor. Ukr. Chem. J. 2004, 70, 25–29. (In Russian) [Google Scholar]
- Shapovalov, S. Effect of temperature on the stability and stoichiometric composition of ion associates of the pinacyanol cation. Russ. J. Phys. Chem. A 2005, 79, 478–482. Available online: https://elibrary.ru/item.asp?id=27770914 (accessed on 27 January 2022).
- Shapovalov, S.; Samoilov, E. Regularities of homo- and heteroassociation of the pinacyanol cation in aqueous solution. Russ. Chem. Bull. 2008, 57, 1405–1415. [Google Scholar] [CrossRef]
- Taniguchi, M.; Du, H.; Lindsey, J. Photochemcad 3: Diverse modules for photophysical calculations with multiple spectral databases. Photochem. Photobiol. 2018, 94, 277–289. [Google Scholar] [CrossRef] [PubMed]
- Taniguchi, M.; Lindsey, J. Database of absorption and fluorescence spectra of >300 common compounds for use in Photochem CAD. Photochem. Photobiol. 2018, 94, 290–327. [Google Scholar] [CrossRef] [PubMed] [Green Version]
- Rentsch, S.; Danielius, R.; Gadonas, R. Bestimmung von Lebensdauern und Transientenabsorptionsspektren von Polymethinfarbstoffen aus pikosekunden-spektroskopischen Messungen. J. Signalaufz.-Mater. 1984, 12, 319–328. [Google Scholar]
- Khouri, S.; Buss, V. UV/Vis spectral study of the self-aggregation of pinacyanol chloride in ethanol–water solutions. J. Sol. Chem. 2009, 39, 121–130. [Google Scholar] [CrossRef]
- Permogorov, V.; Serdyukova, L.; Frank-Kamenetsky, M. On the nature of the long-wavelength absorption band and luminescence of cyanine dyes. Opt. Spectrosc. 1967, 22, 979–981. (In Russian) [Google Scholar]
- Higgins, D.; Reid, P.; Barbara, P. Structure and exciton dynamics in J-aggregates studied by polarization-dependent near-field scanning optical microscopy. J. Phys. Chem. 1996, 100, 1174–1180. [Google Scholar] [CrossRef]
- Shindy, H. Fundamentals in the chemistry of cyanine dyes: A review. Dye. Pigment. 2017, 145, 505–513. [Google Scholar] [CrossRef]
- Herz, A. Protonation equilibria of cyanines of solution and at AgBr surfaces. Photogr. Sci. Eng. 1974, 18, 207–221. [Google Scholar]
- Sabaté, R.; Gallardo, M.; Estelrich, J. Location of pinacyanol in micellar solutions of n-alkyl trimethylammonium bromide surfactants. J. Coll. Interface Sci. 2001, 233, 205–210. [Google Scholar] [CrossRef] [PubMed]
- Svisheva, Y.; Shapovalov, S. Peculiarities of the association of cationic forms of pinacyanol with counterions in aqueous solution. Kharkiv Univ. Bull. Chem. Ser. 2000, 477, 112–116. (In Russian) [Google Scholar]
- Sheppard, S. The effects of environment and aggregation on the absorption spectra of dyes. Rev. Mod. Phys. 1942, 14, 303–340. [Google Scholar] [CrossRef]
- Sabaté, R.; Estelrich, J. Determination of the dimerization constant of pinacyanol: Role of the thermochromic effect. Spectrochim. Acta Part A Mol. Biomol. Spectr. 2008, 70, 471–476. [Google Scholar] [CrossRef]
- Naorem, H.; Devi, S. Determination of the dimerization constant of pinacyanol dye in mixed aqueous–organic solvent media with different hydrophobic character. J. Mol. Liq. 2012, 173, 119–123. [Google Scholar] [CrossRef]
- Yao, H.; Morita, Y.; Kimura, K. Effect Of organic solvents on J aggregation of pseudoisocyanine dye at mica/water interfaces: Morphological transition from three-dimension to two-dimension. J. Coll. Interface Sci. 2008, 318, 116–123. [Google Scholar] [CrossRef]
- Sabaté, R.; Estelrich, J. Determination of micellar microenvironment of pinacyanol by visible spectroscopy. J. Phys. Chem. B 2003, 107, 4137–4142. [Google Scholar] [CrossRef]
- Sabaté, R.; Freire, L.; Estelrich, J. Influence of dielectric constant on the spectral behavior of pinacyanol. A spectrophotometric experiment for physical chemistry. J. Chem. Educ. 2001, 78, 243. [Google Scholar] [CrossRef]
- Perram, J. Interpretation of spectra. J. Chem. Phys. 1968, 49, 4245–4246. [Google Scholar] [CrossRef]
- Antonov, L. UV–Vis spectroscopic and chemometric study on the aggregation of ionic dyes in water. Talanta 1999, 49, 99–106. [Google Scholar] [CrossRef]
- Sabaté, R.; Gallardo, M.; de la Maza, A.; Estelrich, J. A spectroscopy study of the interaction of pinacyanol with n-dodecyltrimethylammonium bromide micelles. Langmuir 2001, 17, 6433–6437. [Google Scholar] [CrossRef]
- Khouri, S.; Richter, D.; Buss, V. Circular dichroism and theoretical calculations of pinacyanol dimer inclusion in γ-cyclodextrin. J. Incl. Phenom. Macrocycl. Chem. 2009, 65, 287–292. [Google Scholar] [CrossRef]
- Ramette, R.; Sandell, E. Rhodamine B equilibria. J. Am. Chem. Soc. 1956, 78, 4872–4878. [Google Scholar] [CrossRef]
- Lavorel, J. Influence of concentration on the absorption spectrum and the action spectrum of fluorescence of dye solutions. J. Phys. Chem. 1957, 61, 1600–1605. [Google Scholar] [CrossRef]
- Rohatgi, K.; Singhal, G. Nature of bonding in dye aggregates. J. Phys. Chem. 1966, 70, 1695–1701. [Google Scholar] [CrossRef]
- West, W.; Pearce, S. The dimeric state of cyanine dyes. J. Phys. Chem. 1965, 69, 1894–1903. [Google Scholar] [CrossRef]
- Poluektov, N.; Beltyukova, S.; Meshkova, S. Dimerization constants of some basic dyes used in extraction-photometric methods of analysis. J. Anal. Chem. 1971, 26, 1042–1047. (In Russian) [Google Scholar]
- Davydov, A. The theory of molecular excitons. Sov. Phys. Uspekhi 1964, 7, 145–178. [Google Scholar] [CrossRef]
- Alfimov, M.; Shtykova, A.; Razumov, V. Photo- and thermoinitiated formation of J- and H-aggregates in amorphous dispersion of a carbocyanine dye. High Energy Chem. 2006, 40, 18–21. [Google Scholar] [CrossRef]
- Kim, S.; Kim, D. Determination of the structure of 1,1′-diethyl-2,2′-carbocyanine iodide using NMR spectra and GIAO-HF/DFT calculations. Dye. Pigment. 2008, 79, 1–6. [Google Scholar] [CrossRef]
- Adeagbo, W.; Buss, V.; Entel, P. Inclusion complexes of dyes and cyclodextrins: Modeling supermolecules by rigorous quantum mechanics. J. Incl. Phenom. 2002, 44, 203–205. [Google Scholar] [CrossRef]
- Ma, F.; Yartsev, A. Ultrafast photoisomerization of pinacyanol: Watching an excited state reaction transiting from barrier to barrierless forms. RSC Adv. 2016, 6, 45210–45218. [Google Scholar] [CrossRef]
- Shapovalov, S. Dimerization of Cyanine Dyes: Results of Quantum-Chemical Simulation. In Proceedings of the XXIV Galyna Puchkovska International School-Seminar “Spectroscopy of Molecules and Crystals”, Odessa, Ukraine, 25–30 August 2019; p. 47. Available online: https://isssmc.org.ua/files/books/2019-XXIV-ISSSMC.pdf (accessed on 27 January 2022).
- Shapovalov, S. Interaction of sulfophthaleine anions with cationic dyes in aqueous solution. Russ. J. Gen. Chem. 2010, 80, 953–963. [Google Scholar] [CrossRef]
- Shapovalov, S. Association of anions of phenolsulfonephthalein and its alkyl-substituted derivatives with single-charged cations of polymethines. Russ. Chem. Bull. 2011, 60, 465–473. [Google Scholar] [CrossRef]
- Shapovalov, S.; Kiseliova, Y. Association of thymolsulfonephthalein and cresolsulfonephthalein anions with cationic cyanines in aqueous solution. Chem. Chem. Technol. 2010, 4, 271–276. [Google Scholar] [CrossRef]
- Shapovalov, S. Association constants and enthalpies of formation of heteroassociates of anions of cresol red and thymol blue. Russ. J. Phys. Chem. A 2010, 85, 9–15. [Google Scholar] [CrossRef]
- Shapovalov, S.; Kiseleva, Y. Heteroassociation of the bromine-containing anions of sulfophthaleins in aqueous solution. Russ. Chem. Bull. 2010, 59, 1317–1326. [Google Scholar] [CrossRef]
- Shapovalov, S. Bromocresol purple in the processes of cation-anionic interactions in aqueous solutions: UV–Vis spectroscopy and computer simulation of dissimilar association. Spectrochim. Acta A Mol. Biomol. Spectr. 2022, 269, 120741. [Google Scholar] [CrossRef]
- Shapovalov, S. Cation-anionic association of organic dyes in aqueous solutions: Structure and properties of associates. Mod. Org. Chem. Res. 2017, 2, 195–203. [Google Scholar] [CrossRef]
- Shapovalov, S. Heteroassociates of singly- and doubly-charged anions of alizarin red S with the pinacyanol cation. Russ. Chem. Bull. 2011, 60, 89–98. [Google Scholar] [CrossRef]
- Shapovalov, S. Ionic association with anions of alizarin red S in aqueous solutions with surfactants. Russ. J. Phys. Chem. A 2011, 85, 1369–1375. [Google Scholar] [CrossRef]
- Svishchova, Y.; Shapovalov, S. Interactions between xylenol orange and pinacyanol in aqueous solutions. Kharkiv Univ. Bull. Chem. Ser. 2012, 21, 197–199. (In Russian) [Google Scholar]
- Shapovalov, S.; Svishchova, Y. Heteroassociates of pinacianol cation in aqueous solutions: Formation and their interaction with organic multiply charged anions. Fr. Ukr. J. Chem. 2018, 6, 21–30. [Google Scholar] [CrossRef]
- Shapovalov, S.; Ponomariov, V.; Mosharenkova, O.; Butenko, S. Studies of the association of dyes with surfactants in aqueous solutions: Spectrophotometry and computer simulation. Fr. Ukr. J. Chem. 2019, 7, 9–19. [Google Scholar] [CrossRef]
- Svisheva, Y.; Shapovalov, S. Dissimilar association of cationic dyes with humic acids in aqueous solutions. Kharkiv Univ. Bull. Chem. Ser. 2014, 23, 47–53. (In Ukrainian) [Google Scholar]
- Armitage, B.; Retterer, J.; O’Brien, D. Dimerization of cyanine dyes in water driven by association with hydrophobic borate anions. J. Am. Chem. Soc. 1993, 115, 10786–10790. [Google Scholar] [CrossRef]
- Nicoli, F.; Roos, M.; Hemmig, E.; Di Antonio, M.; de Vivie-Riedle, R.; Liedl, T. Proximity-induced H-aggregation of cyanine dyes on DNA-duplexes. J. Phys. Chem. A 2016, 120, 9941–9947. [Google Scholar] [CrossRef]
- Veselkov, D.A.; Evstigneev, M.P.; Kodintsev, V.V.; Djimant, L.N.; Davies, D.; Veselkov, A.N. Investigation of the heteroassociation of daunomycin and ethidium bromide molecules in aqueous solution by 1H NMR spectroscopy. J. Phys. Chem. 2001, 75, 879–884. (In Russian) [Google Scholar]
- Veselkov, D.A.; Sigaev, V.A.; Vysotskii, S.A.; Djimant, L.N.; Davies, D.; Veselkov, A.N. Investigation of the heteroassociation of caffeine with acridine orange dye in aqueous solution by 1H NMR spectroscopy. J. Struct. Chem. 2000, 41, 86–96. (In Russian) [Google Scholar] [CrossRef]
- Shapovalov, S.; Koval, V.; Chernaya, T.; Pereverzev, A.; Derevyanko, N.; Ishchenko, A.; Mchedlov-Petrossyan, N. Association of indopolymethine cyanine cations with anions of sulfonephthalein and xanthene dyes in water. J. Braz. Chem. Soc. 2005, 16, 232–240. [Google Scholar] [CrossRef] [Green Version]
- Shapovalov, S. Kinetics of interaction between cyanine dye ion association species and surfactants in aqueous solution. J. Phys. Chem. 2005, 79, 1586–1591. [Google Scholar]
- Shapovalov, S.; Lvovskaya, M. About interaction between pinacyanol and cations of astrafloxine or neutral red in aqueous solution. Kharkiv Univ. Bull. Chem. Ser. 2002, 9, 157–161. (In Russian) [Google Scholar]
- Hamai, S. Complex formation in cationic dye-organic anion systems in aqueous solution. Bull. Chem. Soc. Jap. 1985, 58, 2099–2106. [Google Scholar] [CrossRef] [Green Version]
- Larin, V.; Shapovalov, S. Association between complex ferrumcyanide anions with pinacyanol cation in aqueous solution. Chem. Chem. Technol. 2012, 6, 25–29. [Google Scholar] [CrossRef]
- Samoilov, E. Interaction between complex ferrum-cyanide ions and polymethine cations in aqueous solutions. Kharkiv Univ. Bull. Chem. Ser. 2009, 17, 208–212. (In Russian) [Google Scholar]
- Ganguly, B.; Nath, R. Spectral studies of pinacyanol chloride in sodium alkyl sulphate. Chem. Mater. Res. 2012, 2, 13–24. Available online: https://www.iiste.org/Journals/index.php/CMR/article/view/2183 (accessed on 27 January 2022).
- Shapovalov, S. Effect of surfactants on homo- and heteroassociation of pinacyanol cation in aqueous solution. Russ. J. Appl. Chem. 2008, 81, 1160–1166. [Google Scholar] [CrossRef]
- Maity, B.; Chatterjee, A.; Seth, D. Photophysics of lumichrome in anionic and cationic micellar media. RSC Adv. 2015, 5, 3814–3824. [Google Scholar] [CrossRef] [Green Version]
- Ali, A.; Bhushan, V.; Malik, N.; Behera, K. Study of mixed micellar aqueous solutions of sodium dodecyl sulfate and amino acids. Coll. J. 2013, 75, 357–365. [Google Scholar] [CrossRef]
- Khan, M.; Siddiqui, Z.; Uddin, F. Kinetic and mechanism study of the oxidative decolorization of neutral red by bromate in micellar medium. J. Iran. Chem. Soc. 2009, 6, 533–541. [Google Scholar] [CrossRef]
- Zaghbani, N.; Hafiane, A.; Dhahbi, M. Removal of safranin T from wastewater using micellar enhanced ultrafiltration. Desalination 2008, 222, 348–356. [Google Scholar] [CrossRef]
- Göktürk, S.; Yeşim Talman, R.; Erdinç, N.; Tunçay, M. Solution behaviour of rivanol in micellar environments. Spectr. Lett. 2006, 39, 357–372. [Google Scholar] [CrossRef]
- Barnadas-Rodríguez, R.; Estelrich, J. Photophysical changes of pyranine induced by surfactants: Evidence of premicellar aggregates. J. Phys. Chem. B 2009, 113, 1972–1982. [Google Scholar] [CrossRef] [PubMed]
- Hayakawa, K.; Sato, M.; Nagata, I.; Yamato, N.; Murata, H.; Tanokura, M. Temperature-induced chirality reversal of induced circular dichroism of premicellar aggregates of acridine orange derivatives and dodecanoyl-L-threonine in aqueous solution. Coll. Polym. Sci. 2006, 284, 1453–1458. [Google Scholar] [CrossRef]
- Tiwari, A.; Sonu; Sowmiya, M.; Saha, S.K. Study on premicellar and micellar aggregates of gemini surfactants with hydroxyl substituted spacers in aqueous solution using a probe showing TICT fluorescence properties. J. Photochem. Photobiol. A Chem. 2011, 223, 6–13. [Google Scholar] [CrossRef]
- Sowmiya, M.; Tiwari, A.; Saha, S. Fluorescent probe studies of micropolarity, premicellar and micellar aggregation of non-ionic Brij surfactants. J. Coll. Interface Sci. 2010, 344, 97–104. [Google Scholar] [CrossRef]
- Matsumoto, T.; Otsuki, T.; Sueishi, Y.; Yamamoto, S. Effects of anionic surfactants on the hydride-transfer reaction of NADH with methylene blue: In premicellar and micellar regions. Bull. Chem. Soc. Jap. 2008, 81, 291–297. [Google Scholar] [CrossRef]
- Nandini, R.; Vishalakshi, B. A spectroscopic study of interaction of cationic dyes with heparin. Orbital 2009, 1, 255–272. [Google Scholar]
- Pandey, S.; Kar, J.; Azam, A.; Pandey, S.; Chawla, H. Competitive self and induced aggregation of calix [4]arene ethers and their interaction with pinacyanol chloride and methylene blue in nonaqueous media. J. Sol. Chem. 2010, 39, 107–120. [Google Scholar] [CrossRef]
- Khouri, S.; Knierim, R.; Buss, V. Induced circular dichroism of the interaction between pinacyanol and algal alginates. Carbohyd. Res. 2009, 344, 1729–1733. [Google Scholar] [CrossRef] [PubMed]
- Wu, H.; Li, W.; Miao, K.; He, X.; Yu, C.; Huang, X.; Liang, H. Studies on the binding mode of pinacyanol chloride to nucleic acids. Chin. J. Chem. 2010, 20, 462–466. [Google Scholar] [CrossRef]


| Medium | λmax, nm (Band) | εmax (α-Band) |
|---|---|---|
| Water [82] | 600 (α) | 1.2 × 10⁵ |
| Methanol [193] | 603.5 (α) | 1.28 × 10⁵ |
| Ethanol, 30% [85] | 608 (α) | 1.35 × 10⁵ |
| Ethanol, abs. [194] | 606 (α) 563 (β) 522 (γ) | 1.752 × 10⁵ |
| Feature | Band | |||
|---|---|---|---|---|
| IM | IIM | IIIM | IVM | |
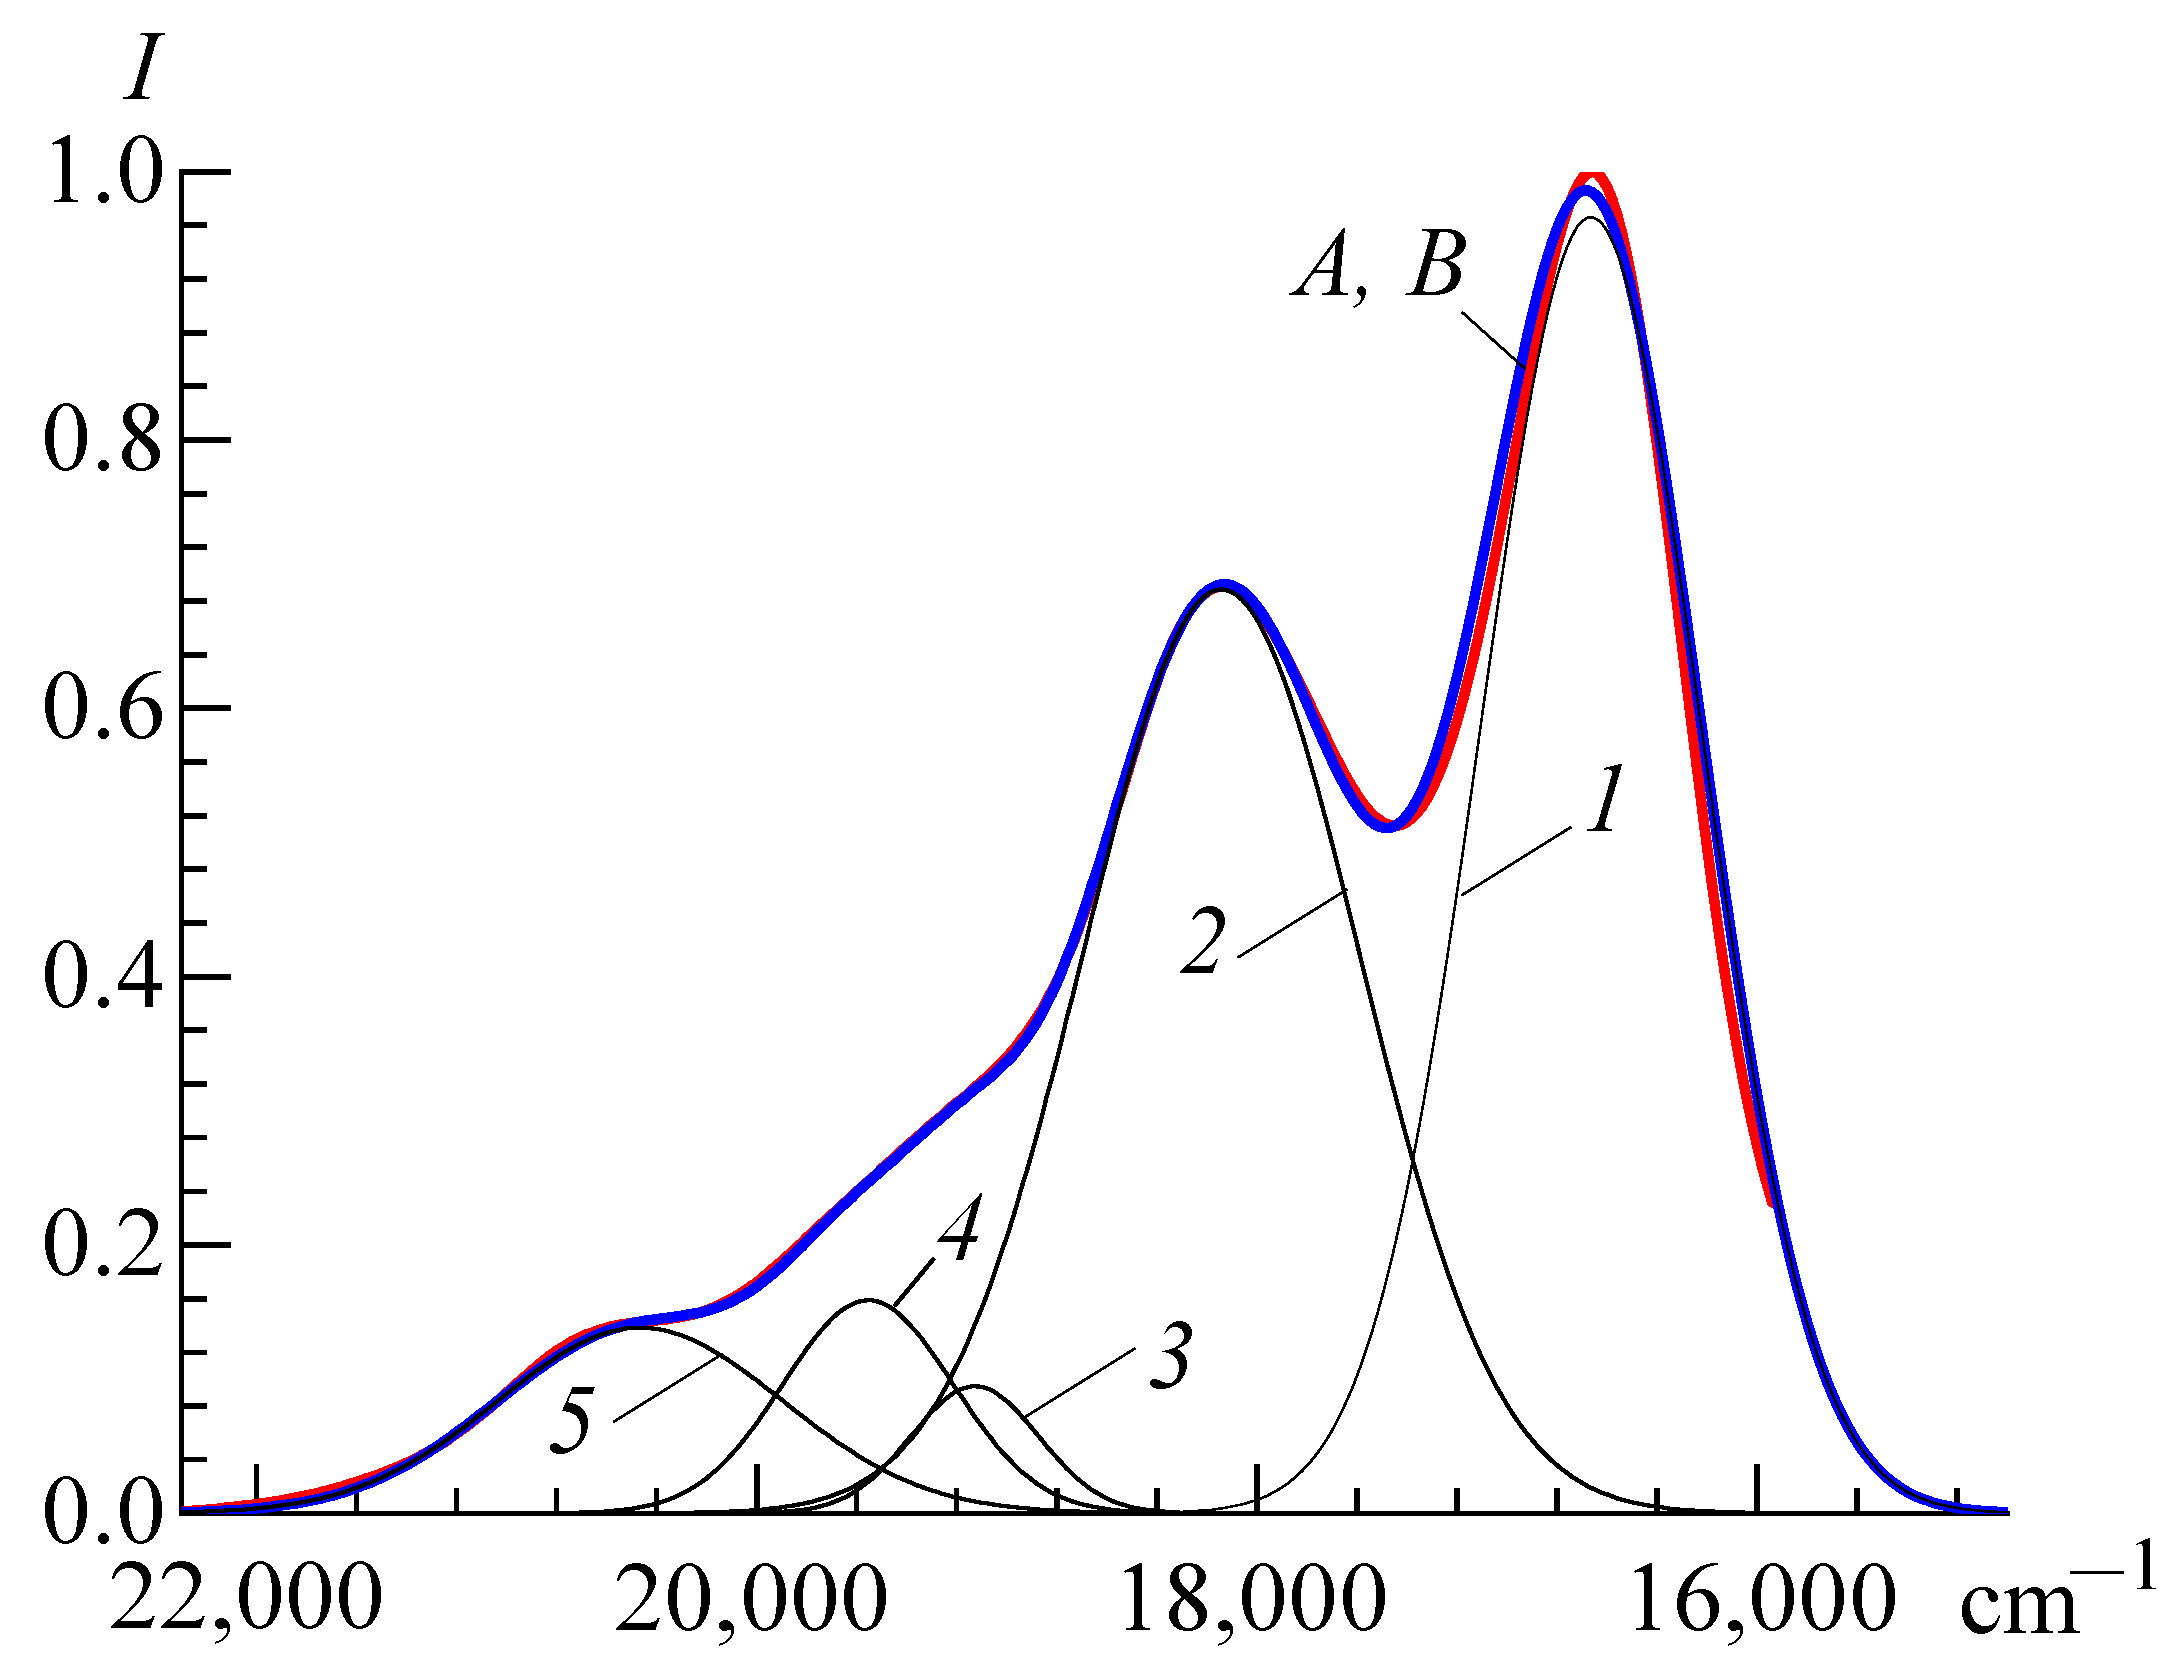
| νmax, cm−1 | 16,661 | 17,939 | 19,132 | 19,614 |
| λmax, nm | 600.2 | 557.4 | 522.3 | 509.7 |
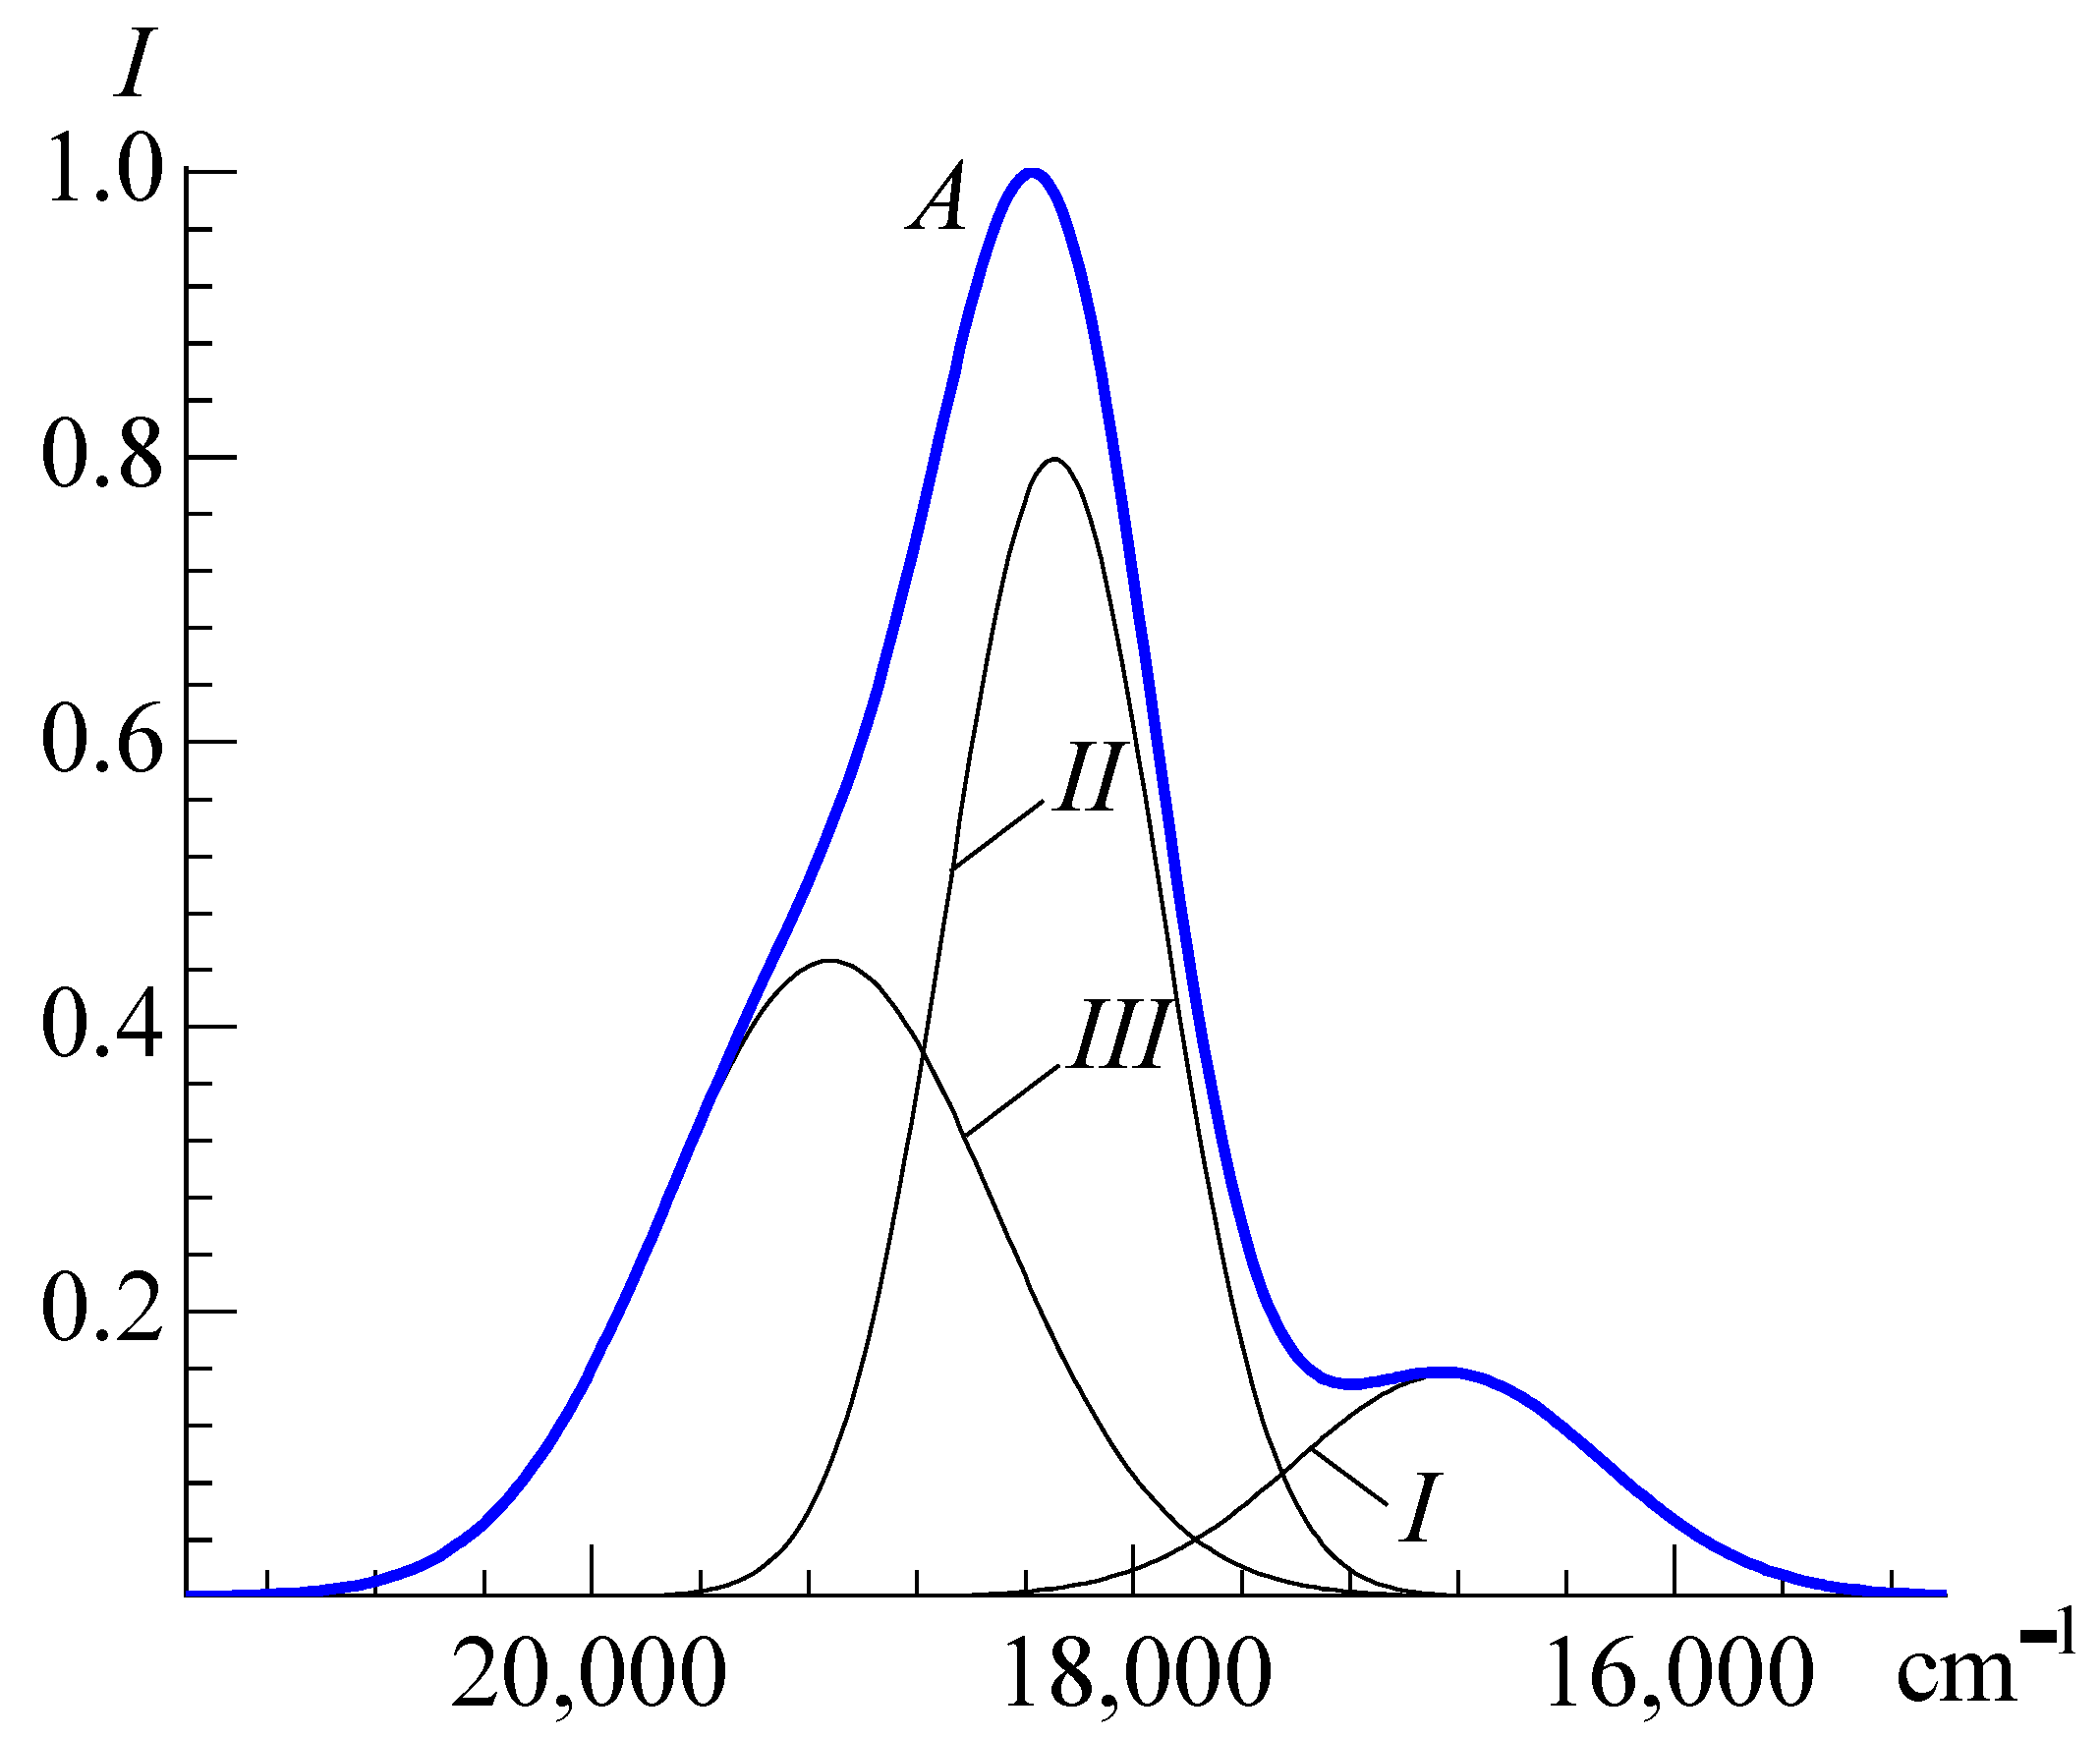
| I, relative units | 0.977 | 0.522 | 0.076 | 0.057 |
| Half-width, cm−1 | 892 | 1205 | 916 | 1543 |
| Surface area, cm−1 | 925.0 | 669.3 | 73.8 | 94.1 |
| Feature | Band | ||
|---|---|---|---|
| ID | IID | IIID | |
| νmax, cm−1 | 16,840 | 18,300 | 19,120 |
| λmax, nm | 593.8 | 546.5 | 523.0 |
| I, relative units | 0.156 | 0.798 | 0.446 |
| Half-width, cm−1 | 1340 | 950 | 1444 |
| Surface area, cm−1 | 223.5 | 800.1 | 688.4 |
| A Dye | log Kas | |
|---|---|---|
| Ct+·An− | (Ct+)2·An2− | |
| Alizarin red C | 6.12 ± 0.10 | 10.92 ± 0.10 |
| Bengal Rose B | 6.91 ± 0.12 | 13.46 ± 0.11 |
| Bromocresol green | 6.74 ± 0.04 | 12.09 ± 0.09 |
| Bromocresol purple | 6.67 ± 0.05 | 11.07 ± 0.10 |
| Bromophenol blue | 6.88 ± 0.05 | 13.73 ± 0.10 |
| Bromothymol blue | 5.95 ± 0.11 | 10.89 ± 0.09 |
| Cresol red | 4.59 ± 0.03 | 10.96 ± 0.10 |
| Eosin | 5.15 ± 0.09 | 11.25 ± 0.10 |
| Erythrosin | 6.60 ± 0.12 | 11.84 ± 0.10 |
| Ethyleosin | 5.45 ± 0.09 | – |
| Fluorescein | 4.58 ± 0.11 | 9.75 ± 0.10 |
| Phenol red | 5.83 ± 0.10 | 11.81 ± 0.10 |
| Tetrabromophenylfluoron | 6.38 ± 0.11 | – |
| Thymol blue | 5.29 ± 0.05 | 11.0 ± 0.1 |
| Feature | Band | ||||
|---|---|---|---|---|---|
| 1 | 2 | 3 | 4 | 5 | |
| νmax, cm−1 | 16,665 | 18,140 | 19,120 | 19,560 | 20,460 |
| λmax, nm | 600.24 | 551.27 | 523.01 | 511.25 | 488.76 |
| I, relative units | 0.966 | 0.6887 | 0.0947 | 0.1587 | 0.1382 |
| Half-width, cm−1 | 1011 | 1297 | 596 | 804 | 1349 |
| Surface area, cm−1 | 1039.120 | 947.033 | 60.144 | 135.700 | 198.255 |
Publisher’s Note: MDPI stays neutral with regard to jurisdictional claims in published maps and institutional affiliations. |
© 2022 by the author. Licensee MDPI, Basel, Switzerland. This article is an open access article distributed under the terms and conditions of the Creative Commons Attribution (CC BY) license (https://creativecommons.org/licenses/by/4.0/).
Share and Cite
Shapovalov, S.A. The First Century of Successful Applications of Pinacyanol: Some Noteworthy Results. Colorants 2022, 1, 165-192. https://doi.org/10.3390/colorants1020011
Shapovalov SA. The First Century of Successful Applications of Pinacyanol: Some Noteworthy Results. Colorants. 2022; 1(2):165-192. https://doi.org/10.3390/colorants1020011
Chicago/Turabian StyleShapovalov, Serghey A. 2022. "The First Century of Successful Applications of Pinacyanol: Some Noteworthy Results" Colorants 1, no. 2: 165-192. https://doi.org/10.3390/colorants1020011
APA StyleShapovalov, S. A. (2022). The First Century of Successful Applications of Pinacyanol: Some Noteworthy Results. Colorants, 1(2), 165-192. https://doi.org/10.3390/colorants1020011