Article

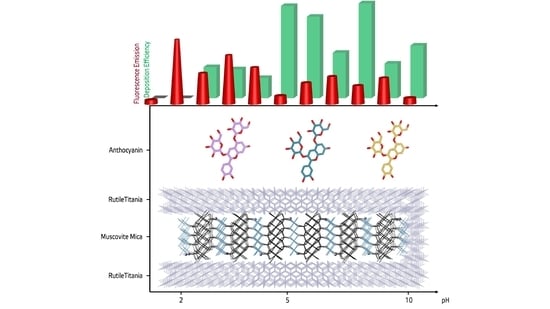
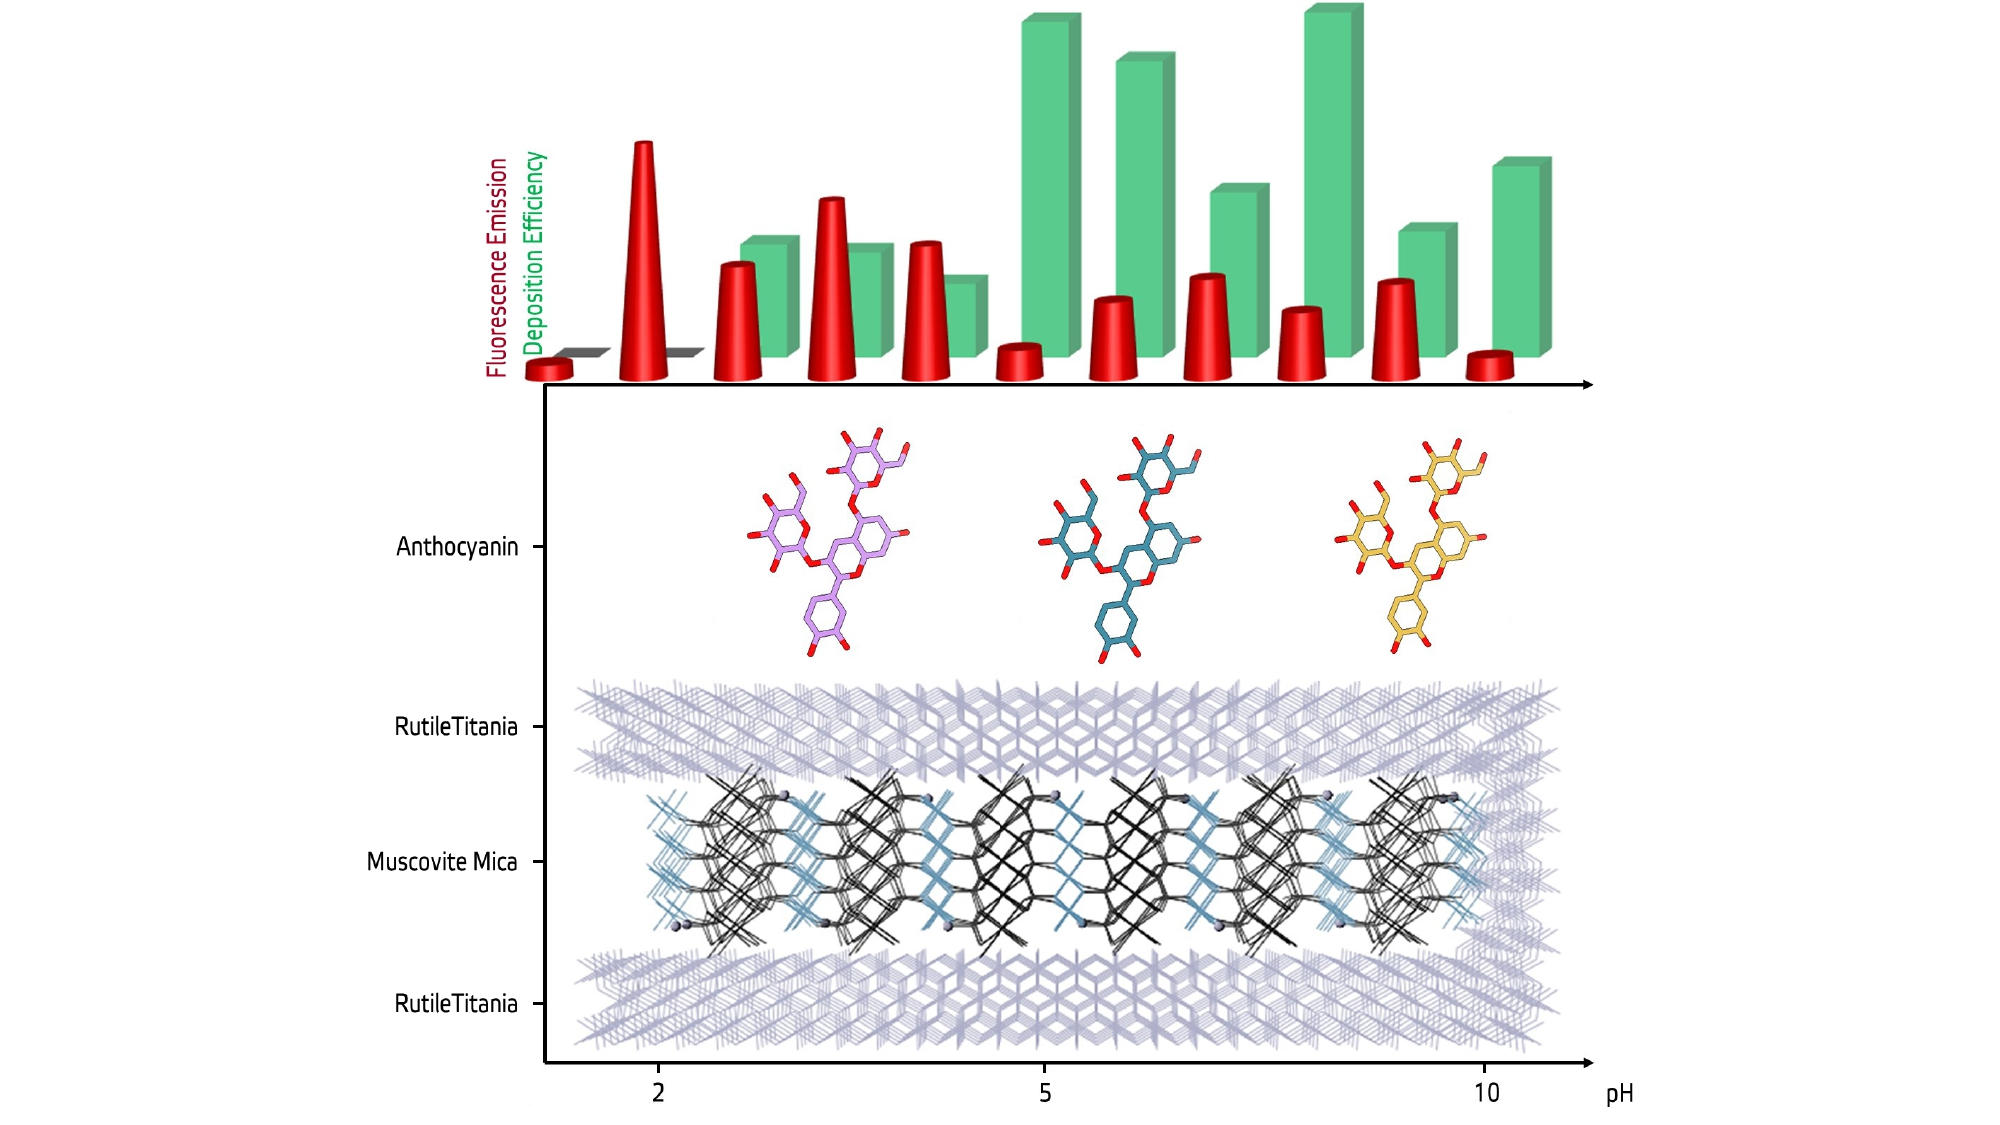
pH-Dependent Coloring of Combination Effect Pigments with Anthocyanins from Brassica oleracea var. capitata F. rubra

1
Institute of Science and Technology Austria, 3400 Klosterneueburg, Austria
2
Nanotechnology and Nanomedicine Division, Hacettepe University, Beytepe, Ankara 06800, Turkey
3
Chemical Engineering Department, Middle East Technical University, Ankara 06531, Turkey
4
Energy Institute, Istanbul Technical University, Maslak, İstanbul 34469, Turkey
5
Nuclear Engineering Department, Hacettepe University, Beytepe, Ankara 06800, Turkey
6
Mechanical Engineering Department, Hacettepe University, Beytepe, Ankara 06800, Turkey
*
Author to whom correspondence should be addressed.
Colorants 2022, 1(2), 149-164; https://doi.org/10.3390/colorants1020010
Submission received: 21 February 2022 / Revised: 17 March 2022 / Accepted: 30 March 2022 / Published: 1 April 2022

Abstract

:
Mica-titania pearlescent pigments (MTs) were previously coated with organic molecules to obtain combination pigments (CPs) for achieving certain improvements or functionalities. Anthocyanins (ACNs) are molecules that can be extracted from natural resources and exhibit color changes via pH modifications of the enclosing medium. The purpose of the study was to produce a new series of CPs by depositing ACNs on MTs at different pH values, to observe the changes in color, and to associate these changes to thermogravimetrically determined deposition efficiencies in light of spectral differences. The extraction and deposition methods were based on aqueous chemistry and were straightforward. The ACN deposition generally increased with increasing pH and correlated with the consistency between the charges of the MT surfaces and the dominant ACN species at a specific pH value. The fluorescence of the CPs was inversely correlated with the deposition quantities invoking the possibility of a quenching effect.

Graphical Abstract

1. Introduction

The trend towards sustainability in engineered systems necessitates the development and improvement of reproducible, cheap, and harmless resources as a major design element, leading to the consideration of natural pigments as functional materials, dye or dye components, and building blocks for many applications [1]. The anthocyanin (ACN) molecules of plants, functioning in protection against light stress and oxidative stress in addition to serving as allurers to seed dispersers [2], have a high potential as colorants and functional molecules with their complex chemistry, bearing control over stability and color diversity. Being glucosides of polyhydroxy and polymethoxy derivatives of 2-phenylbenzoprylium or flavylium salts, ACNs are responsive to alterations in the pH of the surrounding medium [3]. The coupling of two aromatic rings by an oxygenated heterocycle not only provides the pH responsiveness but also enriches the capabilities of the entity by providing anchoring points for sugars, which further promote the molecule by the potential attachment of aliphatic or aromatic acids, enabling proton transfer, hydration, and tautomeric reactions as well as metal complexation and copigmentation reactions, making ACNs highly tractable molecular tools for various potential applications [4,5], particularly as sensitizing components of photocatalytic, photovoltaic, or electrochemical sensor systems [6,7,8,9]. However, the limited stability of these molecules and their structural/physicochemical versatility contingent upon pH governed equilibrium dynamics [10] unambiguously elaborates the applications, obliging structured investigations of ACN behavior on surfaces.
In this study, our aim was to investigate the possibility of using ACNs as a cost-effective, natural, and easily accessible component of combination effect pigments to potentially regulate the optical properties while assessing their behavior on metal oxide surfaces of pearlescent pigment (PP) substrates. Pearlescent effect pigments are widely used pigments that mimic natural pearls [11,12]. Differences in the refractive indexes of layers of materials constituting the PPs and their thicknesses allow the control of scattering properties. This basic core-shell like structure constituting layer or layers of metal oxides of different thicknesses enclosing a platelet of adjustable size is used to control color, light interference, and angle-dependent optical properties [13], and when devised as a substrate for anchoring molecules, could prove very useful in manipulating light-induced interactions [14]. The benefits of lamellar crystal metal oxide interactions extend beyond the optical manipulation, since this compound also offers manipulation of the electronic properties [15] and surface area by geometry, making it a potential subject for applications such as band gap engineering [16,17] and electro-optical engineering [18].
Our group has shown that PPs based on mica–titania (MT) can be coated with organic dye molecules, such as phthalocyanines, to further improve the optical properties of PPs and stability of dye molecules against agglomeration [19]. Depending on the peripheral substitutions in phthalocyanines, these “combination effect pigments” can be equipped with superior fluorescence properties compared to that of PPs [20]. Such improvements in fluorescence were also reported for hybrid pigments of ACN and sepiolite clay [21]. However, MT has never been used in combination with ACN until now, nor has it been possible to create a variation in color by simply controlling a deposition parameter.
ACN molecules from Brassica oleracea var. capitata F. rubra (red cabbage) may provide a pH-controlled color variation in combination effect pigments by the use of a single resource, thanks to their rich chemistry. The resulting interaction of MT with ACN molecules in a pH range of 2–10 was investigated to gain an understanding of the variation in color that differs from the already established pH-dependent color changes of free ACN molecules in a solution.
Here, we used a mild extraction method for ACN isolation, spectroscopic analyses for characterization of ACN from Brassica oleracea var. capitata F. rubra, and a low-cost, reproducible deposition method to coat ACN on PPs. The resulting combination pigments (referred to as CPs hereafter) produced in a range of pH values were investigated by the thermogravimetric method to analyze the deposition efficiencies. The variation in infrared and fluorescence spectra of the CPs was compared in a systematic manner to identify the modes of interaction between ACN and PPs at different pH values to reveal the mechanism behind the color variation of ACNCPs. This approach allowed us to consider the MT as a substrate and elucidate the ACN behavior in a molecule–substrate interaction framework. It has been shown that the nature of ACN molecules dictating an equilibrium of subpopulations induces a competitive deposition on titania surfaces, and the deposition pH affects the mode of binding as well as the deposition efficiencies, resulting in a color variation in ACNCPs.

2. Materials and Methods

2.1. Mica/Titania (MT) Synthesis

The coating procedure of mica with titania (in rutile phase) was described in detail elsewhere [11]. Mica ground by a jetmill was supplied by Sabuncular Mining Co. (Aydın, Turkey). The mica flakes used in this study had a diameter of 53 μm according to particle size distribution analysis.

2.2. Anthocyanin Extraction

ACN molecules were extracted from commercially available red cabbage based on a slightly modified protocol [22]. A total of 100 g of red cabbage was cut into 5 cm × 5 cm pieces and soaked in a media bottle with 200 mL of deionized water. After 120 h in dark, the “dark purple” colored solution was filtered. A three-step vacuum-assisted filtration was applied in the respective order with: (i) Whatman 42 filter papers of 2.5 µm pore size, Sartorius Stedim filter papers of (ii) 0.42 µm, and (iii) 0.2 µm pore sizes. The pH value after the filtration was 3.7. For further purification and removal of the possible unwanted plant material (chlorophylls, carotenes, fat molecules, and polyphenols), hexane, chloroform, ethylene glycol, and diethyl ether were used to elute the filtrated aqueous solution of ACNs. Briefly, 250 mL of aqueous ACN solution was mixed with 500 mL of each of the stated solutions independently in respective order. After mixing with each solvent, phase separation was awaited, and phases were separated using a separation funnel. The final eluted extract was centrifuged in 250 mL polypropylene bottles at 10,000 rpm for 10 min to eliminate any remaining particulate matter. The pH of the solution reached 4.4 after this final step of extraction. A 5 g aliquot of the final extract was left to evaporate at 30 °C for 120 h. The weight of the remaining solid was measured as 0.1226 g, which corresponded to a pigment concentration of 0.0245 g/mL in the extract, with the extract density assumed as 1 g/cm3.

2.3. Combination Pigment Synthesis

A total of 0.05 g PP pigment was dispersed in 12.5 mL of ACN extract and additional deionized water to attain a 50 mL final solution volume, corresponding to a dilution of 4 times with respect to the initial extract concentrations resulting in an ACN/MT weight ratio over 6. After adjusting the pH of these final suspensions to targeted values, they were stirred at 500 rpm for 120 h by a magnetic stirrer. pH values of final coating solutions were then adjusted by dropwise additions of 0.1 M hydrochloric acid (Merck, Darmstadt, Germany) and 0.1 M sodium hydroxide (Merck, Darmstadt, Germany) stock solutions. The coating solution was filtered with vacuum filtration. Separated CPs were washed with ethanol 3 times with respective filtering steps in between and dried in an oven at 30 °C overnight before characterization.

2.4. Characterization

Thermogravimetric analyses (TGA) were conducted with Perkin Elmer (MA, USA) Pyris 1 TGA unit in the 25–950 °C range with a heating and cooling rate of 10 °C/min. Since the mica substrate and the titania coating enclosing the mica flakes can become thermally unstable after 800 °C, to evaluate the deposition amounts and efficiencies at different pH values, percent weight loss values up to 800 °C were taken as the basis of comparison and named as WL800. MT alone showed a potential loss of 3.6 wt.% up to 800 °C. This was subtracted from WL800 of all CPs individually to find the approximate values of deposited pigments at a specific pH value (WL800corr). WL800 for dried ACNs prepared at pH values of 2 and 5 were 71 and 67 wt.%, respectively. Here the average value of these two (i.e., 69 wt.%) was taken as for the highest possible percent weight loss from any ACN up to 800 °C (WL800maxACN). Thus, the approximate weight percent of the ACN molecules and MT flakes within CPs can be calculated by (1) and (2), successively.
A C N C P = W L 800 c o r r × 100 W L 800 m a x A C N   ( % )
M T C P = 100 A C N C P   ( % )
If all free ACNs in the initial coating solution were to be coated on MT surfaces with 100% efficiency, the weight percent of ACNs within a CP would have corresponded to 86%. The approximate percent efficiency of coatings (CE) was calculated accordingly using the method in (3).
C E = ( A C N C P ) 86 × 100
UV-Vis spectra were acquired using a Perkin Elmer (MA, USA) Lambda 35 UV-VIS spectrophotometer between 200–1100 nm by diluting 0.25 mL of ACN extract with deionized water to a final volume of 3 mL. Infrared spectra were recorded using a Termo Fisher Scientific (MA, USA) Picolet 6700 unit using potassium bromide pellets (KBr). KBr pellets were prepared by mixing 0.0002 g CP with 0.0018 g KBr and vacuum pressing the pellets under 8 MPa for 5 min. Fluorescence spectra were recorded using Cary Eclipse Varian unit. One-part combination pigment was dispersed well in two parts deionized water by weight. Excitation wavelengths were chosen according to the initial fluorescence scanning of ACN solutions. Related spectra are given in Figure S1. The measurements were carried out with 270 nm, 380 nm, and 420 nm excitation wavelengths with 2.5 nm excitation slit and 5 nm emission slit, at a scan rate of 120 nm/min and with a data interval of 1 nm using quartz cuvettes. The weight of all CPs was adjusted to be the same as the reference MT sample during measurements. Results of TGA were used to normalize the fluorescence and FTIR spectra of MT with respect to the approximate MT content of a specific CP prepared at a certain pH value. Specifically, for fluorescence spectra (i) noise in intensity was reduced by taking the moving average of 5 consecutive data points; (ii) all spectra including those of MTs were divided by the maximum intensity value observed in the MT spectrum at a certain excitation wavelength for straightforward comparison, and (iii) result of Equation (2) was divided by 100 to obtain the approximate ratio of MT in a specific CP, and each CP spectra was then divided by this divisor to obtain the spectra normalized with respect to the MT within the CP. For the FTIR spectra, the moving average was 3 data points, and an additional step of dividing the individual spectra by the highest transmission value in the respective spectrum was introduced to normalize the sample amount compressed within the pellet.

3. Results

3.1. Anthocyanin Extraction and Spectral Analyses

We successfully extracted the ACN molecules from Brassica oleracea var. capitata F. rubra and deposited the molecules on MT pearlescent pigments at room temperature without any further elimination or separation. All pure ACN measurements were based on the extract that reportedly comprises 20 varieties of cyanidin derivatives, differing in glycosylation and acylation patterns [22]. A spectral analysis of extracted ACNs in solutions adjusted to different pH values gives a depiction of the population dynamics of these molecules in the solution. The UV-Vis spectra given in Figure 1a reflect the color change that can also be observed in photographs of the fresh and aged extracts (Figure S2) and was in line with the previous literature regarding the ACN subpopulation dynamics (i.e., the different forms of ACN molecules). Despite the differences in the acylation and glycosylation profiles of different ACN subpopulations within the extract, ACN molecules bear pH-dependent structural changes in a concerted manner. The increase in the pH gave rise to a gradual decrease in absorbance around 530 nm with a shift towards the red end of the spectra. It has been thoroughly explained that the dynamics of the structural variation of ACN molecules, in other words, the reorganization of molecules in flavylium cation, quinoidal bases, carbinol, and chalcone forms are responsible for the observation of such a color palette [1]. The dominance of the flavylium form, the only stable form under acidic conditions, results in red hues, strongly absorbing from the green part of the spectra. An increase in pH to more neutral values steers a transformation to quinoidal forms curtailing the green absorbance with a shift toward the red wavelengths. As the pH approaches 7, another structural conversion from flavylium to carbinol is reportedly introduced, reducing the right shifted absorptions even more as visualized in Figure 1a and breeding pale tones of orange and yellow. Finally, at the highly basic pH values, the ring opening reaction of the carbinol form brings about the formation of the colorless chalcone form, and these final two forms dominate in the higher pH values. With this, it is possible to picture a population distribution, wherein all molecules are in the same form at low pH values and, as the pH increases, some portions of this population turn into new forms until the solution reaches a balanced state. Here, we evidenced this behavior in the systematical and comparative FTIR spectra (Figure 1b), as well. The disappearance of the peak at 1720 cm−1 after pH = 5 accounts for the diminishing of the C = O+ bond, evidencing the deprotonation of ACNs [23]. The emergence of a peak at 1410 cm−1 after pH = 5 indicates the neutralization of the benzoprylium ring, in complement to the variations at 1720 cm−1, demonstrating the outset of the carbinol forms and depletion of flavylium cations. Moreover, the appearance of a double peak at 620 cm−1 and 650 cm−1 after pH 6 is assigned for the new in-plane deformations of the catechin ring [23], which possibly gained new degrees of freedom with the introduction of chalcone variants where the central ring is broken.
These variations were also supported by our fluorescence measurements (Figure 1c,d) at 270 nm and 420 nm, respectively. With 270 nm excitation, the peak at around 450 nm diminished, and with 420 nm excitation, a peak around 530 nm formed after the pH value of 5. The low wavelength shoulder observed to be forming in the latter below 530 nm at the pH value of 8 can be interpreted as the introduction of the chalcone form.
Combining all these observations, it is possible to say that the ACN extract subjected to the spectral analyses alone shows that population dynamics of extracted pigments follow typical behavior of isolated ACN molecules. Spectral behavior of ACN in UV-Vis and infrared regions of the spectrum are all in good agreement with the literature and prescribe potential different modes of interactions with MT surfaces in different deposition pH values.

3.2. Combination Pigments

3.2.1. pH-Specific Depositions

The formation of CPs was achieved with a room temperature deposition process in a pH range between 2 and 10. Deposition at different pH values resulted in a clearly observable pH-dependent color variation on the MTs using a single source of additive pigments as visualized in Figure 2. The color of CP at ACN extraction pH (i.e., 4.37, Figure 2c) was remarkably more gleamy compared to other CPs prepared in pH-controlled mediums. (Figure 2e). The vibrant red hue produced by the dominance of flavylium forms at a pH value of 2 in the solution state (Figure S2) was not emulated on the CP. The blue hues introduced by the diversification of flavylium cations into the quinoidal bases in solution are virtually reflected in CPs with a deterioration of saturation until the color appears in grey tones at a deposition pH value of 7. The conversion into green and finally yellow with the accumulation of carbinol and chalcone forms in solutions at higher pH values rendered the formation of yellow hues on CPs deposited at pH values of 8, 9, and 10.
The pH-dependent effect of ACNs on CP color can not only be explained by a pH-dependent selectivity, which favors the interaction of a subpopulation of ACN molecules with titania surfaces. A potential variation of deposition efficiencies at respective pH values could also influence the color output. In addition to potential commingling of these effects, the discrepancies in color could be stemming from the interaction of surface bound ACN molecules. To formulate the coloring and unravel the corresponding interactions, we investigated the CPs by thermogravimetry, FTIR spectroscopy, and fluorescence spectroscopy.

3.2.2. Thermogravimetric Analyses

To establish the relationship between ACN deposition at different pH values and observed changes in CP color, TGA was performed (see Figure S3 for individual data). Data calculated from Equations (1) and (3) are given in Table S1. Coating efficiencies determined from Equation (3) were plotted with respect to the pH of the deposition medium and are given in Figure 3. We also plotted the amount of drop in pH of the deposition medium compared to its initial pH at the termination of the deposition reaction.
Modest deposition efficiencies of ACN at low pH values (up to 4) showed a sharp increase in pH value to 5. This was followed by a decrease to a pH value of 7 and a second sharp increase to 8 before dropping down again to 9 and 10. The drops in pH after the termination of deposition reactions were insignificant up to initial pH values of 4, but then increased to 8 with a stagnation between 5 and 6. These fluctuations in ACN deposition efficiencies can be taken as the result of pH-dependent variations in ACN-MT interactions.
The variation of deposition efficiencies also provides insights into the stability of anthocyanin molecules on MT surfaces. The comparative derivative TGA plot in Figure S3 shows that the ACN molecule degradation on MT surfaces is represented by a single event around 300 °C at acidic pH values. Starting from the pH = 5 deposition, another event around 550 °C emanates, possibly representing a stronger bonding to surfaces and a higher stability.

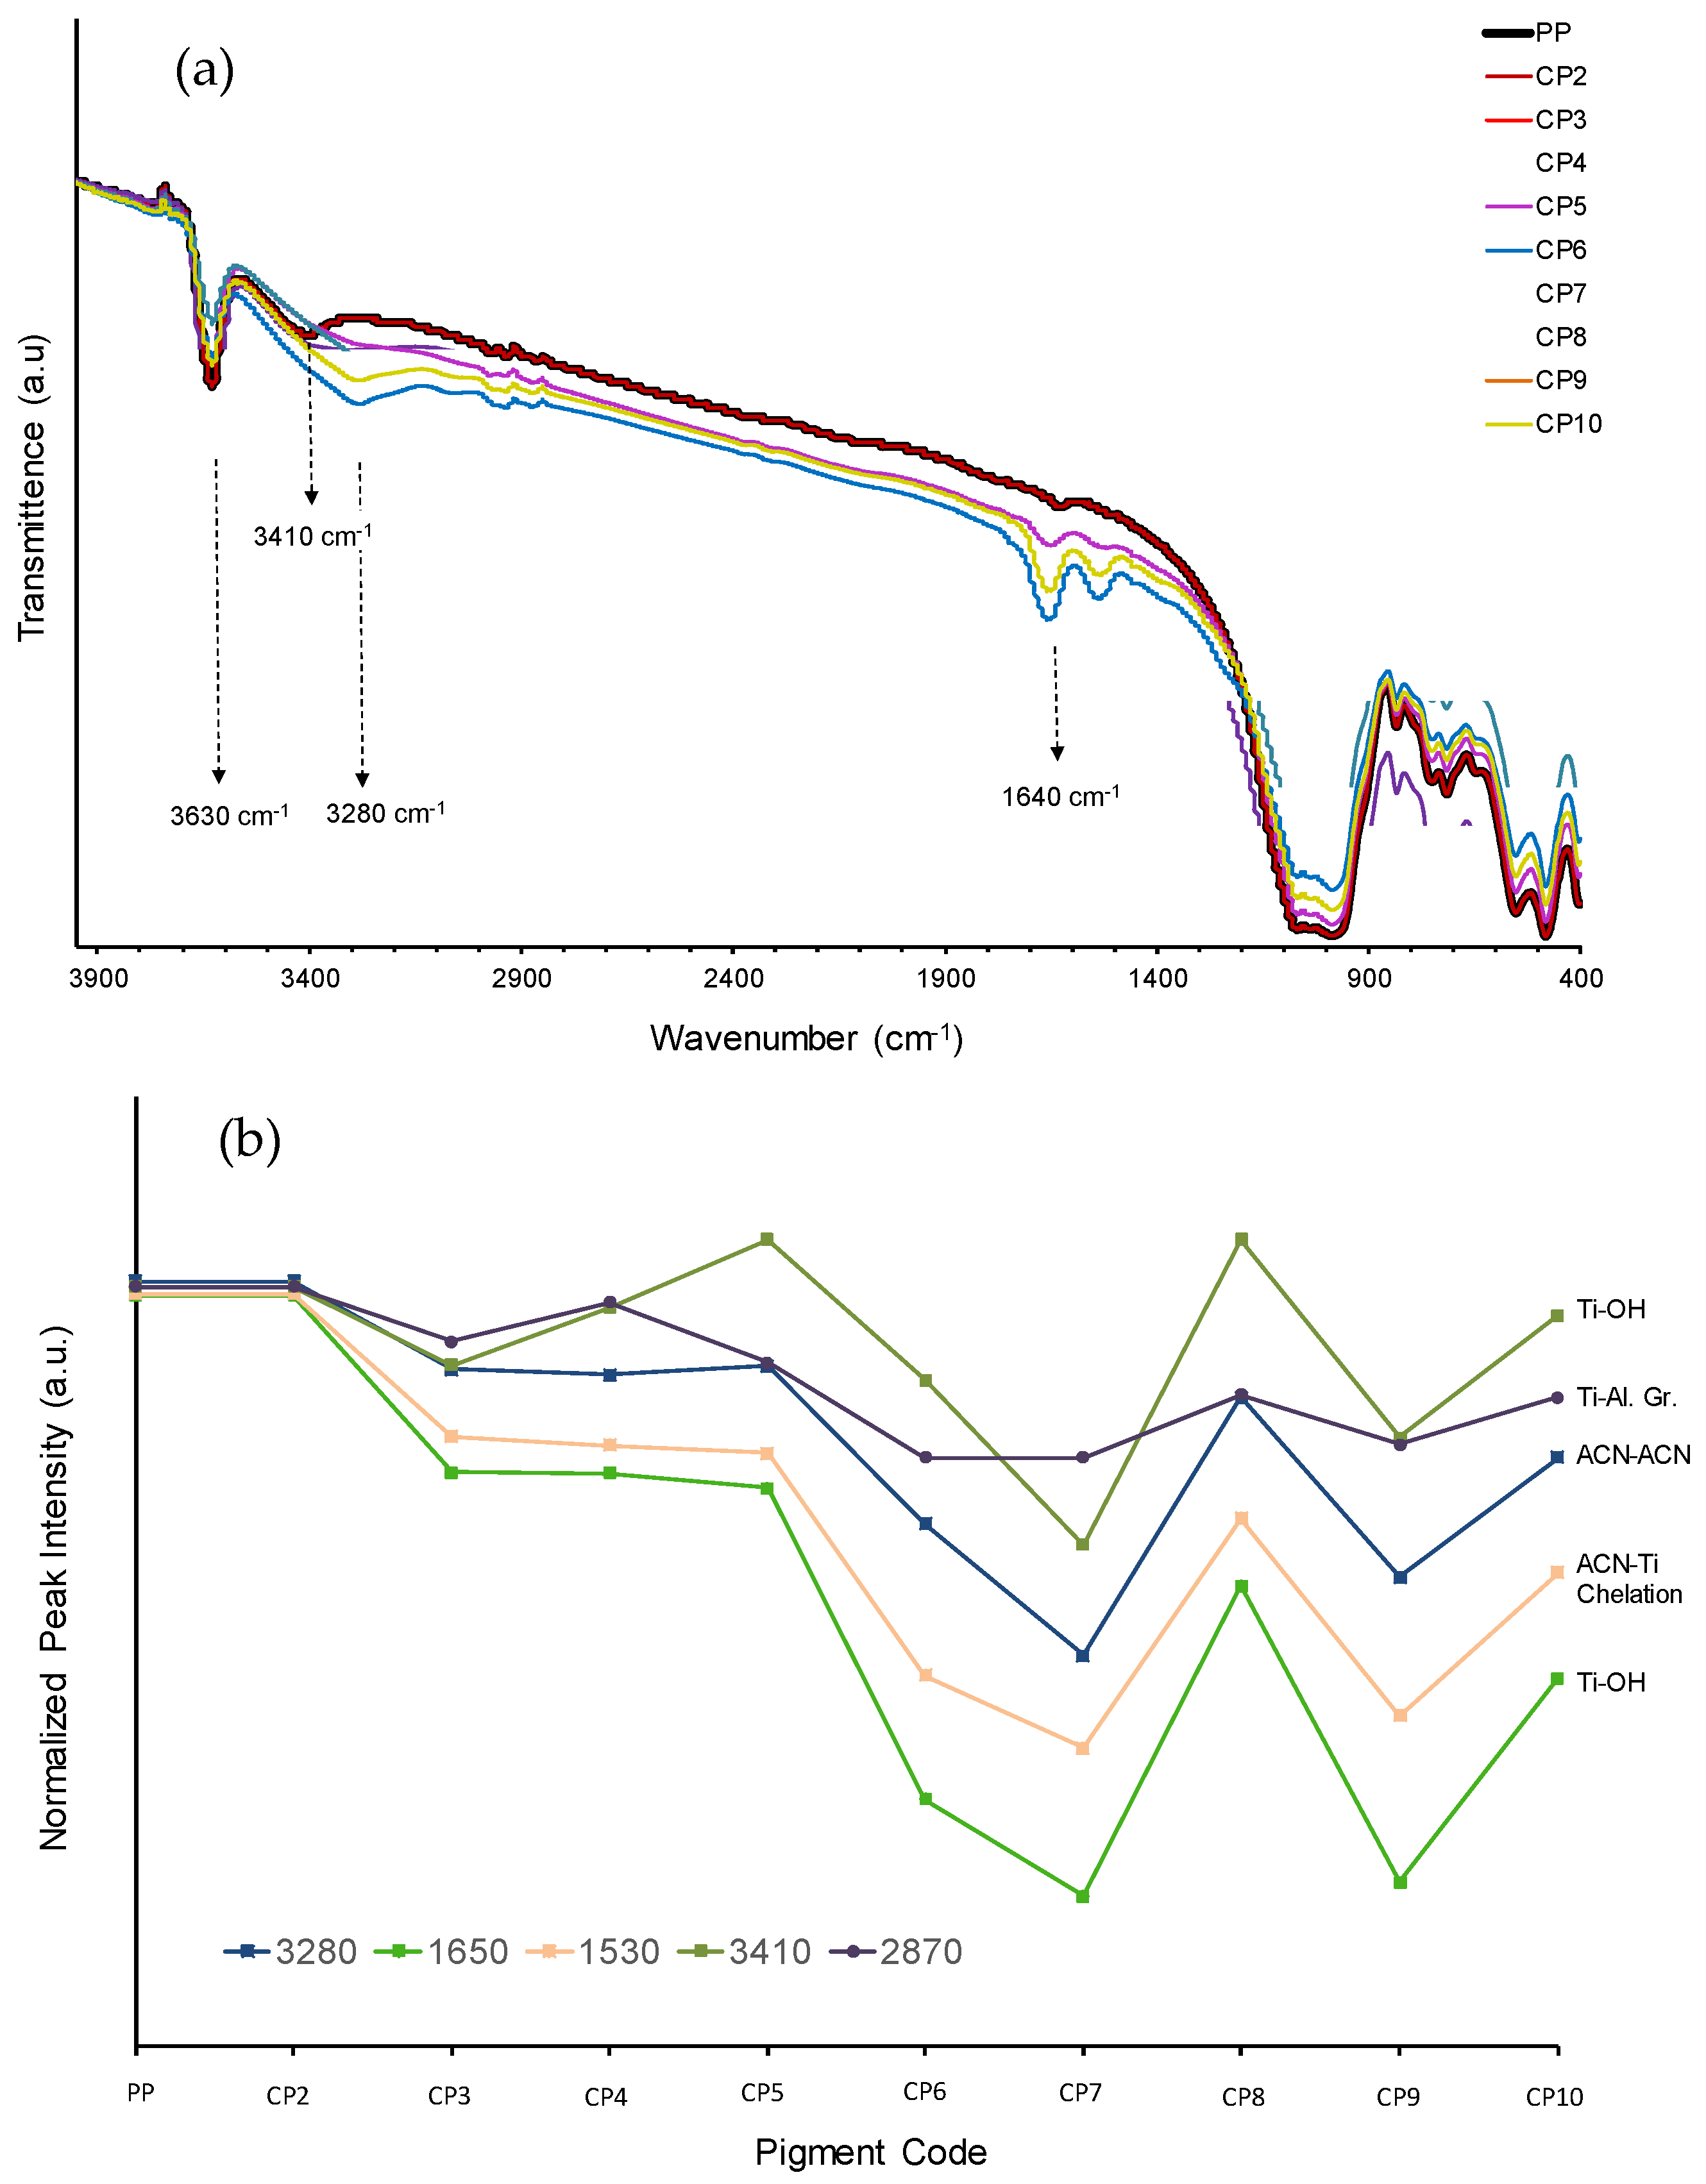
3.2.3. FTIR Spectra of Combination Pigments

The variation of the deposition efficiencies can be interpreted as a pH-dependent fluctuation in the amount of ACN molecules confined on the PP. However, considering the diversity of molecules and their forms, the introduction of MTs to a solution enlarges the possibility space for potential reactions significantly. A survey conducted throughout the literature on ACN reaction dynamics shows that given the proper conditions, ACN molecules undergo copigmentation reactions [24], which include but are not limited to ACN-ACN reactions (self-association), metal-ACN reactions (complexation), or molecules with free electron pairs (intermolecular copigmentation). In addition to protonation-deprotonation events, water addition/elimination reactions, and isomeric reactions induced by the pH changes, these external reactions also can induce variations in the end product that could affect the final spectral properties [5]. Moreover, it is not possible to rule out the possible effects of a secondary deposition of ACNs on CPs via a “bound ACN–free ACN” interaction. FTIR spectroscopy was utilized to reveal the details of ACNMT interactions by means of pH-dependent bond formations. The resulting comparative spectra are shown in Figure 4a.
The comparison indicates that ACN binding has minor but noticeable effects on the MT spectra. In all of the samples, the dominant MT spectral shape is preserved with most of the peaks fingerprinting the inner mica-titania bonds. However, there are prominent changes in the spectra and additional peaks with varying intensities formed at the 3400–3200 cm−1 region and the 1800–1600 cm−1 region. A closer look at these peaks shows a pH-dependent variation in the associated band intensities, as delineated in Figure 4b. It is possible to describe these changes as a variation of intensity at around 3630 cm−1, a shift of the wavelength from 3410 cm−1 to 3280 cm−1 accompanied by an intensity variation, and the formation of new peaks in the 1800–1600 cm−1 region.
The titania coating on mica results in the elimination of surface OH groups of mica, and an infrared transparency between the 4000–1200 cm−1 region. The part of the spectrum between 1200–400 cm−1 fingerprints the lattice vibrations. The peak around 3630 cm−1 is assigned to OH binding to surfaces in various publications [25,26]. The small peaks observed in the MT spectra at around 3410 cm−1 and 1640 cm−1 are reported to be related to H2O stretching and bending [27] and are possibly introduced to the MT spectrum during the sample preparation while the MT was wetted. The variations in the intensities of these bands with respect to pH may be attributed to the hydrogen bonding of the ACN molecules on titania surfaces via the formation of the Ti–OH bond [26]. As the increase in the intensity implies the population growth of functional groups associated with the molecular bond, the red shift in the stretching denotes an increase in the intermolecular bonding of these groups [28]. The bands at around 2920 cm−1 are reported to be related to the binding of aliphatic compounds to layered mica structures. Their presence here could be a sign of a second type of titania–ACN interaction through ACN acyl groups [29]. The peak around 1530 cm−1 is proclaimed as a mark of ACN–metal chelation [30,31] and may be considered as the third type of the ACNMT interactions. These intensities associated with different modes of interaction are traced in Figure 4b.
The evolution of peak intensities over the pH range clearly shows that the hydrogen bonding of ACNs to TiO2 surfaces and chelation events follows the same trend, and both are enhanced after pH 2, stagnant in pH 3–pH 5 transition, and intensified until the deposition at pH 8. The decrease to pH 8 reverses at pH 9, and another decrease is observed at pH 10 deposition. However, H2O stretching at 3410 cm−1 differs from the behavior of the aforementioned peaks by showing a decrease from the deposition at pH 3 to deposition at pH 5. This may be related to the variation in ACN intermolecular interactions. On the other hand, the binding of ACN molecules to titania surfaces through the acyl groups shows a different behavior. It shows a minimum at pH 4 deposition and a second minimum at pH 8 following a stagnation at pH 6 and pH 7 depositions. This behavior connotes a relation between the protonation of quinoidal forms and acyl groups bound on titania surfaces. Significant parity of the 3280 cm−1 peak (ACN-ACN interactions) to 1530 cm−1 (chelation) and 1650 cm−1 (Ti-OH) peaks relate the ACN-ACN intermolecular reactions to chelation and Ti-OH events, implying the potential interactions between molecules bound to the titania surface via different interactions.

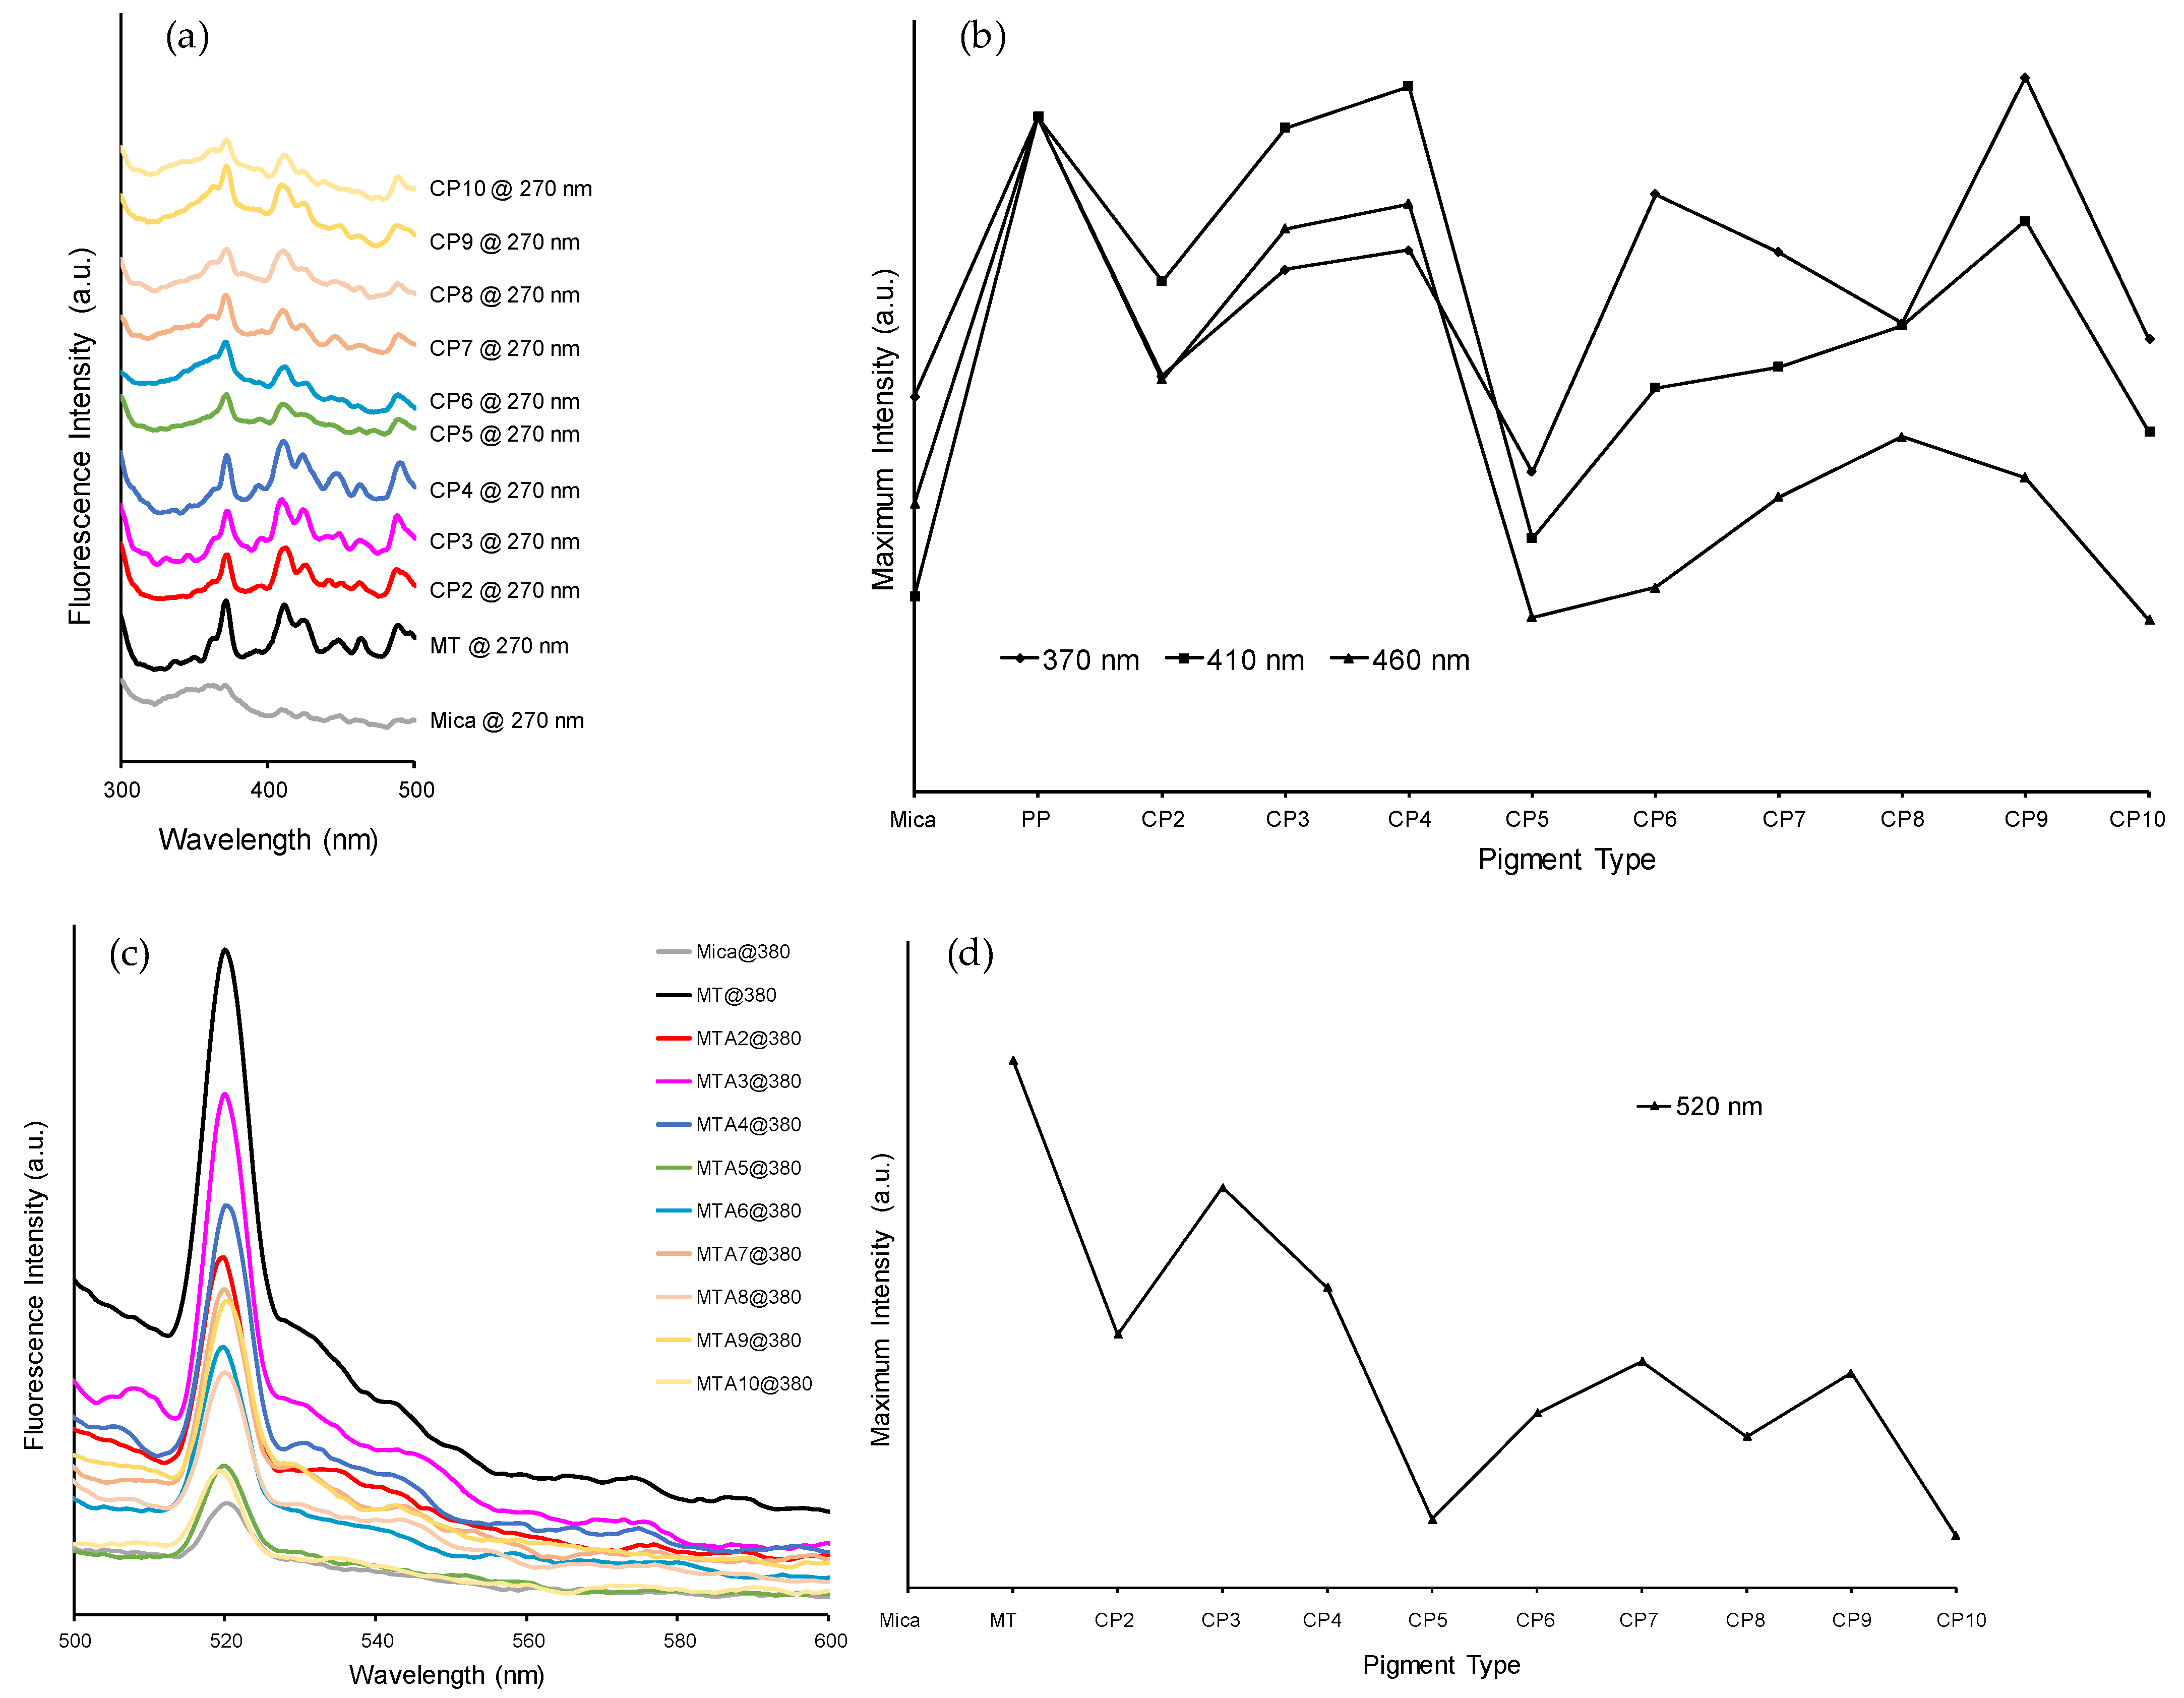
3.2.4. Fluorescence Spectra of Combination Pigments

An understanding of the deposition efficiencies and the interaction types presents a perspective on the fundamental events that constitute the color palette in the given pH range. Yet, the remarkable complexity of the CP-ACN system requires the elaboration of light-CP interactions for a more accurate depiction.
An adjustment of the fluorescent properties of CP by molecular pigment depositions on its surface was achieved in our precedent studies. Even though the pearlescent nature of MT blurs the identification of fluorescing groups and their relations owing to the internal reflection, scattering, and interference events, it was possible to quantify a synergistic increase in the fluorescence intensity [20]. However, those systems were populated by a single source of molecular pigment, and the fluorescence properties were controlled over the deposition amount. Here, the CP system is much more crowded with at least three different kinds of interactions present on each condition; moreover, owing to the dynamic nature of ACN structural transitions, it is not possible to quantify the different form subpopulations contributing to the CP system. Nevertheless, it was possible to recognize the differences caused by the cumulative effect of ACNs attached to the surfaces during the depositions at different pH levels.
Consistent with the FTIR results, the MT character dominates the spectra here too, and the ACN effect is discernable through the pH-dependent intensity variations. This is shown in the comparative spectra of 270 nm excitation in Figure 5a and 380 nm excitation in Figure 5b.
As a result of the MT domination on the resulting CP spectra, the characteristic emission peaks of MT are preserved at every deposition pH; however, variation in the intensities of these peaks is distinct with a tendency to decrease as the deposition pH increases. This behavior is documented in Figure 5b,d. For 270 nm excitation where the MT fluorescence apexes, the deposition pH-dependent intensity change of the three most prominent peaks shows an interesting behavior that exactly contrasts the deposition efficiency changes until pH 6. The drop of deposition efficiency for CP7 renders a decline in 370 nm peak intensity, while the 410 and 460 nm peak intensities continue increasing. The transition to a higher deposition at pH 8 results in a successive decrease to a 370 nm peak intensity, while the 410 and 460 nm peak intensities continue upsurging. After pH 8, the contrast of changes in deposition efficiency and fluorescence intensity is observed to be re-established. The disruption of the reverse correlation of deposition efficiency and the fluorescence intensity suggests an effect of the ACN form subpopulations on fluorescence intensities and their effects on different fluorescing groups of MT.
The complexity of the CP system along with the crowded fluorescence pattern of MT at 270 nm excitation directed us to investigate the pH-dependent ACNMT interactions at the 380 nm excitation wavelength, where ACN and MT both show fluorescent activity, but MT fluorescence is less complex. Including the mica flakes used for MT construction in the comparison showed that CP intensities at peak 520 nm inhibit the titania fluorescence but do not diminish it to the mica level. Moreover, the observed pattern of peak intensity contradicts the deposition efficiency pattern to a larger extent with a deviation at CP3–CP4 transition.
As a complement to the FTIR analyses, our fluorescence data suggest a variation in the bound ACN population on titania surfaces, and accordingly, the varying interaction types regulate the pH-dependent quenching of the fluorescence. The variation of the deposition pH affects this concept by designating the interaction types via the control of subpopulation dynamics of ACNs in the solution.

4. Discussion

The color palette of ACNs in the solution formed by pH changes is not reflected in the color palette of the CPs formed by the deposition of ACNs on MT surfaces at different pH values. A visual comparison shows that the CPs exhibit a closer palette to the aged ACN solution palette (Figure S2-bottom and Figure 2), which suggests that during 5 days of the deposition, pH-dependent reactions of ACNs are completed, and the resulting population distributions are responsible for the color variation. The violet coloring of CP3, CP4, and CP5 depositions; the yellow shades produced at CP8, CP9, and CP10 as well as the gray tones observed at CP2, CP6, and CP7 eliminate the possibility of codeposition of ACN subpopulations (flavylium ions, quinoidal bases, carbinols, and chalcones) on MT surfaces in proportion to the ACN subpopulations present in the solution. Another model, wherein ACN subpopulations are selectively deposited on titania surfaces, could suggest that quinoidal forms are favored over the flavylium forms in acidic conditions where flavylium is the dominant form, implying a change in the favored species with respect to the pH of the deposition medium. In this scenario, flavylium, the only dominant form at pH = 2, has a very low affinity to TiO2 making the respective CP very weak in color. An increase in pH introduces the quinoidal forms to the solution accounting for the violet coloring in CP3, CP4, and CP5. As the favored form becomes colorless carbinol after this pH, the following CPs are in gray tones until the chalcones become the preferred species at pH = 8.
However, the solution palette suggests that there are colored forms present in the solution at pH = 2, 5, and 6, indicating a more complex coloring mechanism. Another supposition could be the selective deposition of forms to the surfaces allowing the selective precipitation of quinoidal forms on MT between the pH range of 3–5, carbinol forms between 6–7, and chalcone forms between 8–10. However, this model does not explain the coloring at pH 2 since the carbinol population could be expected to be very low at this acidity.
Considering the deposition medium and its dynamics, charges to the interacting and noninteracting species emerge as decisive means, making the deposition pH a critical parameter by defining an ancillary role of regulating ACN-MT interactions through the protonation states of the species. This makes the color palette of CPs in the given pH range an aftermath of the pH-governed conditions: relative populations of the ACN forms, relative charges of the ACN forms present in the solution, and the relative charge of the MT particles. Conductive to that, the point of zero charge (PZC) of titania surfaces is reported to be between 5 and 7 (depending on the source, raw chemicals used in its synthesis, and phase, etc.). Therefore, the anticipated PZC of MT is equivalent to that of rutile titania and is around or above 6 [32]. In this regard, at acidic pH levels, the surface charge of rutile titania is expected to increase as the pH value decreases. The protonated ACN molecules at this pH level (i.e., flavylium form) would not be readily attracted to titania surfaces with a high electrostatic tendency [33]. Nevertheless, it has been reported that a negative charge can remain on rutile at low pHs [34], which can be explained by the presence of persistent Cl ions remnant of the TiCl4 from the synthesis medium of MT [35]. The fact that a low level of coating efficiency can still be observed and that the pH drop during deposition is minimal could be attributed to the interaction of positively charged ACNs and the remnant negative charges. A very weak interaction with a relatively low amount of ACN molecules explains the desaturated color produced at pH = 2, where most of the ACN molecules are in the form of flavylium cation and only a small portion is attached to the surface by an interaction to negative remnant ions on the surface, producing an FTIR spectrum for CP2 that is nearly identical to that of MT. The blue–violet colored quinoidal forms are more negatively charged compared to the flavylium forms and are introduced at pH = 3, as evidenced by the solution color palette and solution state spectral investigation. Their abundance and protonation change accompanied by the increase in pH until neutral values rationalize the coloring of CP3, CP4, and CP5. The evolution of the 3410 cm−1 peak (assigned as Ti-OH bonds) with respect to the deposition pH also supports this claim with a clear increase in the intensity from pH = 3 to pH = 5. Consistency of the DTGA (Derivative TGA, Figure S3m) profiles of CP2, CP3, and CP4 also fits nicely with this model, where the number of bound molecules to the surface increase with the pH as observed at around 330 °C and 776 °C, showing that main interactions remain the same; however, depending on the relative charges, the bound amount increases with pH.
The level of interaction increases at around pH level of 5 (i.e., deposition efficiencies increase), where the rutile surfaces could still be considered slightly positive. At this pH, a considerable amount of flavylium cations should have been deprotonated into neutral quinoidal base forms [5]. This is evidenced by the sensible drop in pH observed during deposition. Here, it can be expected that the nature of interactions would be through hydrogen bonding between slightly positive rutile surfaces and the hydroxyls of dominant quinoidal forms of ACN. In addition, the transformation of flavylium forms into colorless carbinol supposedly becomes pronounced at pH 5, as demonstrated by the disappearance of the 1720 cm−1 peak in the ACN solution state FTIR spectra. The loss of saturation and a shift toward the teal color promotes the conception of co-occupation of MT surfaces by two different ACN forms, disputing the selective deposition hypothesis.
For the depositions after pH = 5, C = 0+ bond represented by the 1720 cm−1 peak of the ACN solution state spectra becomes unnoticeable, showing that colorless carbinol forms start to dominate and emerge as a new potential interaction partner for MT in addition to neutral quinoidal forms. Moreover, from pH = 5 onward, a thermogravimetric mass loss emerges after 500 °C that was not observed at the thermograms of lower pH depositions, possibly pointing to another type of interaction between ACN molecules and MT surfaces. This peculiar mass loss in DTGA is accompanied by increases in Ti–OH bonding, ACN–Ti chelation, and ACNACN relative transmission intensities in the FTIR spectrum of the CPs. However, despite the increase in the coating efficiency, the color of the CPs seems to fade with pH increases. This puts the carbinol form in a position that directly interacts with the MT. The color fade shows that the relative population of this form on MT surfaces increases much faster than that of quinoidal forms, making the carbinol the dominant reaction partner of MT in the pH = 5–7 range. Their abundance in interaction is reflected as the loss of violet color on CP6 and CP7. At the pH level of 7, the drop in the deposition quantities may be explained by the attainment of PZC on the host surfaces. Nevertheless, proton dissociation from the present quinoidal forms with negative charges has the potential to provide the needed polarity to the surfaces for the coating levels achieved. The presence of a weak teal color can be annotated as a result of a competition of quinoidal anions and carbinol forms for titania surfaces, wherein quinoidal anions start to dominate at pH = 8 [5] providing an even more extensive source of protons for the MT surfaces compared to lower pH values. The higher relative drop in pH in this medium upon termination supports this argument as well as the formation of the light green color at CP8. In turn, a rather interesting synchrony based on columbic attraction is attained between the maximum coating efficiency at the initial pH of 8 and the maximum drop in pH observed for this initial point. The solution state spectral measurements show that the slow-forming carbinol form is introduced to the solutions at pH 6, and despite its presence, its effect on the final CPs is not visible by means of color formation until reaching high levels of alkalinity. Although high pH forms are known for their fade in color, the rather low final pH contradicts this argument for this initial set value of 8 and invokes the possibility of another type of interaction, which could have been a result of the deposition of chalcone variants of ACN on the MT surface. The dominance of these forms observed in the colors of CP9 and CP10 could be explained by the relatively positive charge of these species compared to anionic quinoidal forms that are close to depletion just as the carbinol forms due to high ACN solution dynamics.
In this context, the coloring of CPs is evidently dependent on not only the selectivity during the deposition but also on the competition between different forms of ACNs present in the deposition medium. While the lack of color at CP2 is related to low binding affinities of the present species, as the quinoidal forms are introduced, they take over the dominance resulting in violet tones of color. The introduction of the carbinol form results in the fade of violet color at CP5, and the increasing dominance of this form leads to a grey color at CP6. As the titania becomes negative at around pH = 7, the competition between carbinol and quinoidal anions creates weak blue–teal tones on pH 7 and light green color at pH 8. Finally, as the chalcone forms start to dominate, the color turns to yellow tones for CP9 and CP10.
The pearlescence effect is defined as an angle-dependent luster and is produced by the organization of materials with different refractive indexes in a layered structure. Depending on the layer refractive index and thicknesses, the intensity and the wavelength of reflected and transmitted light vary. The transmitted light is subject to further reflections. Moreover, depending on the angle and layer thicknesses, reflected waves interfere and become stronger or weaker. These practices directly affect the fluorescence intensities, resulting in an emission that is spread over the visible part of the spectrum as presented in the MT fluorescence spectrum. Our measurements demonstrated how the presence of ACNs on MT surfaces translates into a decrease in the fluorescence intensities of CPs relative to the MT alone. The complex fluorescence spectra of MT forming at 270 nm excitation showed that different deposition pH results in changes in different fluorescence bands. It could be postulated that all forms trapped on the surface affect different fluorescing groups of MT structure. This quenching effect is also evinced with 380 nm excitation. Despite the fluorescent activity of the ACN molecules in this excitation, the relatively less complex spectrum of the MT still subsided with the attachment of ACN molecules on MT surfaces. Interestingly, the lessening of intensity showed a very correlated trend with the deposition efficiencies throughout the pH range. Still, slight variations off the trend are hints of coinhabitance of the surfaces. The behavior of the 520 nm peak shows that the increase in the negativity of bound quinoidal forms results in more effective quenching. Clinging to the fact that quinoidal forms start competing with the carbinol form introduced at pH = 5 and the carbinol dominance on surfaces increase in the pH = 5–7 range, it is possible to say that carbinol does not quench the signal as much as the neutral quinoidal forms. The increase in the bound quinoidal anions on the surface at pH = 8 exhibits an increase in the quenching; however, as the chalcones annex, this increases again and finds the peak position in a condition where the most abundant form on the surfaces is chalcone. However, the complexity of the system necessitates further theoretical calculations regarding all the bonding modes of individual ACN forms to the MT surfaces.
Since ACN molecules are considered one of the cost-efficient, cleaner alternatives of highly efficient commercial dye sensitizers for photovoltaics [7,36,37,38,39], they have been applied on TiO2 surfaces in various studies with the aim of improving the light harvesting capacity of metal oxide and forming efficient charge transfer complexes. Therefore, the pH-dependent coinhabitation effect is very critical in understanding the fundamentals of the light-ACN/metal-oxide interactions. The work of Chien and Hsu shows that pH is important in the efficiency of the light-induced electron transfer in regard to changing ACN electronic levels and ACN affinity to titania surfaces. In the same study, they also find the positive effect of some unknown copurified components on the light conversion efficiency, supporting our coinhabitation hypothesis. However, a full-scale resolution of the light-induced effects on the metal oxide–ACN couple could only be possible by the investigation of isolated ACN forms on these surfaces. The established pearlescent pigment architecture could be beneficial in such an attempt since different metal oxide layers are already used for tailoring the pearlescence properties. The variations in the surface of the pigment could result in selective inhabitation and provide the essential separation in the deposition phase. Furthermore, this substrate-based selectivity could be used for realizing the utilization of pigment cocktails [36] for the improvement of solar spectrum usage in light induced electron transfer devices.

5. Conclusions

In summary, ACN molecules extracted from Brassica oleracea var. capitata F. rubra were investigated by spectroscopy in UV, visible, and IR regions. It was possible to observe the effects of the transformation of the molecules among flavylium, quinoidal, carbinol, and chalcone forms in the pH range of 2–10. The introduction of new forms was observed via the differences in certain bond signals through the medium of the FTIR spectrum. Immobilization of these molecules on MT particles in the same pH range resulted in a peculiar color palette that differs from the color palette produced by ACNs in the solution state. We employed TGA to investigate the deposition efficiencies and used this information for normalizing the spectral data produced by CPs to be able to trace the spectral intensities in regard to deposition pH values. The results show that the interaction of the dominant flavylium cations at pH 2 with MT surfaces is insignificant, possibly due to the positively charged state of each component. As the pH increases, the dominance of neutral quinoidal forms leads to blue-violet colored CPs. The introduction of the colorless carbinol form at pH 5 results in a desaturation, which increases until pH 7, where quinoidal anions take over the dominance and increase the saturation to blue–green tones slightly. As the chalcone forms become abundant at pH 9, CPs appear with a yellow color. The competition for the MT surfaces among the dominant forms is evidenced by the changes in FTIR spectra as well as the TGA results, demonstrating that just as the solutions are dominated by various groups of ACNs, so are the MT surfaces. The variance of trends in different fluorescence peaks induced by the 270 nm excitation also shows that different fluorescing groups of MT are affected differently by the anchored populations. However, all ACN forms bound to surfaces are observed to quench MT fluorescence, which is a clear exhibition of the capability of electron transfer from MT to ACN molecules. On the other hand, it should be noted that the population variance results in a different level of quenching for every deposition pH, demonstrating the effect of different forms codeposited on MT surfaces. A final important point to acknowledge is the varying amount of interaction between the bound ACN types, which may also influence the electronic structure of the CPs.
These results show that the PP system is suitable for achieving a differentiation in coloring using a single source of molecular pigments like ACNs. Even though it is a complex system, control of a single parameter can provide the tailoring of optical properties. The cocktail-like nature of ACN extract causes selective coinhabitation of the MT surfaces. Increasing the variation of the PP metal oxide surfaces in the deposition medium could lead to a selective inhabitation, where the components of a molecular dye cocktail are distributed on the surfaces of different PPs, to achieve individual molecular dye–substrate interactions rather than the observed cumulative interactions. The possibility of tailoring in both components of this system could be useful for achieving single parameter controlled optical effects.

Supplementary Materials

The following supporting information can be downloaded at: https://www.mdpi.com/article/10.3390/colorants1020010/s1, Figure S1. Fluorescence spectra of: (a) MT with excitations from 220 to 250 nm, (b), (c), (d), (e) Mica, MT, and CPs at 220, 270, 380, and 420 nm excitation wavelengths, respectively. pH range of 2 (bottom) to 10 (top); Figure S2. The color change among fresh (top) and aged (bottom) extracts in a pH range of 2 (left) to 10 (right); Figure S3. TGA of ACN at pH values of: (a) 2 and (b) 5, MT (c) and CPs prepared at pH values of; (d) 2, (e) 3, (f) 4, (g) 5, (h) 6, (i) 7, (j) 8, (k) 9, and (l) 10. (m) Comparative Derivative TGA plots for CP; Table S1. TGA data analyzed with Equations (1)–(3).

Author Contributions

Conceptualization, all authors; methodology, G.G., B.M. and O.Ç.; formal analysis, O.Ç. and B.M.; investigation, O.Ç.; resources, O.Ç. and B.M.; writing—original draft preparation, O.Ç. and B.M.; writing—review and editing, all authors; visualization, O.Ç. and B.M.; supervision, G.G., Ü.Ç. and B.M.; project administration, O.Ç. and B.M.; funding acquisition, B.M. All authors have read and agreed to the published version of the manuscript.

Funding

This research was partly funded by Hacettepe University (Bilimsel Araştırma Projeleri Koordinasyon Birimi), grant number FHD-2015-8094.

Data Availability Statement

The data presented in this study are contained within the article and are available in the Supplementary Materials.

Acknowledgments

The authors are indebted to Ahmet Önal for his supports in acquiring the fluorescence spectra and the decision of excitation wavelengths. The authors also acknowledge use of the services and facilities of UNAM-National Nanotechnology Research Center at Bilkent University and mica donation from Sabuncular Mining Co.

Conflicts of Interest

The authors declare no conflict of interest.

References

  1. Delgado-Vargas, F.; Jiménez, A.R.; Paredes-López, O. Natural Pigments: Carotenoids, Anthocyanins, and Betalains—Characteristics, Biosynthesis, Processing, and Stability. Crit. Rev. Food Sci. Nutr. 2000, 40, 173–289. [Google Scholar] [CrossRef] [PubMed]
  2. Steyn, W.J. Prevalence and Functions of Anthocyanins in Fruits. In Anthocyanins: Biosynthesis, Functions, and Applications; Winefield, C., Davies, K., Gould, K., Eds.; Springer: New York, NY, USA, 2009; pp. 86–105. [Google Scholar]
  3. Kong, J.-M.; Chia, L.-S.; Goh, N.-K.; Chia, T.-F.; Brouillard, R. Analysis and biological activities of anthocyanins. Phytochemistry 2003, 64, 923–933. [Google Scholar] [CrossRef]
  4. Brouillard, R.; Delaporte, B. Chemistry of anthocyanin pigments. 2. Kinetic and thermodynamic study of proton transfer, hydration, and tautomeric reactions of malvidin 3-glucoside. J. Am. Chem. Soc. 1977, 99, 8461–8468. [Google Scholar] [CrossRef]
  5. Dangles, O.; Fenger, J.-A. The Chemical Reactivity of Anthocyanins and Its Consequences in Food Science and Nutrition. Molecules 2018, 23, 1970. [Google Scholar] [CrossRef] [PubMed] [Green Version]
  6. Zyoud, A.H.; Saleh, F.; Helal, M.H.; Shawahna, R.; Hilal, H.S. Anthocyanin-Sensitized TiO2 Nanoparticles for Phenazopyridine Photodegradation under Solar Simulated Light. J. Nanomater. 2018, 2018, 2789616. [Google Scholar] [CrossRef] [Green Version]
  7. Gokilamani, N.; Muthukumarasamy, N.; Thambidurai, M.; Ranjitha, A.; Velauthapillai, D. Utilization of natural anthocyanin pigments as photosensitizers for dye-sensitized solar cells. J. Sol-Gel Sci. Technol. 2013, 66, 212–219. [Google Scholar] [CrossRef]
  8. Ezike, S.C.; Hyelnasinyi, C.N.; Salawu, M.A.; Wansah, J.F.; Ossai, A.N.; Agu, N.N. Synergestic effect of chlorophyll and anthocyanin Co-sensitizers in TiO2-based dye-sensitized solar cells. Surf. Interfaces 2021, 22, 100882. [Google Scholar] [CrossRef]
  9. Martinez-Pacheco, M.; Lozada-Ramirez, J.D.; Martinez-Huitle, C.A.; Cerro-Lopez, M. Hibiscus sabdariffa L. Anthocyanins Immobilization on TiO2 Nanotubes and Its Electrochemical Characterization as a Hydrogen Peroxide Sensing Electrode. J. Electrochem. Soc. 2019, 166, B1506–B1512. [Google Scholar] [CrossRef]
  10. Fang, J.-L.; Luo, Y.; Yuan, K.; Guo, Y.; Jin, S.-H. Preparation and evaluation of an encapsulated anthocyanin complex for enhancing the stability of anthocyanin. LWT 2020, 117, 108543. [Google Scholar] [CrossRef]
  11. Topuz, B.B.; Gündüz, G.; Mavis, B.; Çolak, Ü. The effect of tin dioxide (SnO2) on the anatase-rutile phase transformation of titania (TiO2) in mica-titania pigments and their use in paint. Dyes Pigment. 2011, 90, 123–128. [Google Scholar] [CrossRef]
  12. Pfaff, G. Special Effect Pigments. In High Performance Pigments; Wiley-VCH: Weinheim, Germany, 2001; pp. 75–101. [Google Scholar]
  13. Maile, F.J.; Pfaff, G.; Reynders, P. Effect pigments—past, present and future. Prog. Org. Coat. 2005, 54, 150–163. [Google Scholar] [CrossRef]
  14. Ren, M.; Yin, H.; Ge, C.; Huo, J.; Li, X.; Wang, A.; Yu, L.; Jiang, T.; Wu, Z. Preparation and characterization of inorganic colored coating layers on lamellar mica-titania substrate. Appl. Surf. Sci. 2012, 258, 2667–2673. [Google Scholar] [CrossRef]
  15. Gao, Q.; Wu, X.; Fan, Y.; Du, C. Influence of the seed layer on photoactivity inhibition of mica–titania pigments. Ceram. Int. 2016, 42, 6595–6600. [Google Scholar] [CrossRef]
  16. Fang, X.; Lu, G.; Mahmood, A.; Wang, Y.; Wang, X.; Xie, X.; Tang, Z.; Sun, J. A novel ternary mica-titania@rGO composite pearlescent pigment for the photocatalytic degradation of gaseous acetaldehyde. Chem. Eng. J. 2020, 396, 125312. [Google Scholar] [CrossRef]
  17. Tan, J.; Shen, L.; Fu, X.; Hou, W.; Chen, X. Preparation and conductive mechanism of mica titania conductive pigment. Dyes Pigment. 2004, 62, 107–114. [Google Scholar] [CrossRef]
  18. Zuo, S.; Liu, Z.; Liu, W.; Li, X.; Li, Z.; Yao, C.; Chen, Q.; Fu, Y. TiO2 nanorod arrays on the conductive mica combine photoelectrochemical cathodic protection with barrier properties. J. Alloys Compd. 2019, 776, 529–535. [Google Scholar] [CrossRef]
  19. Topuz, B.B.; Gündüz, G.; Mavis, B.; Çolak, Ü. Synthesis and characterization of copper phthalocyanine and tetracarboxamide copper phthalocyanine deposited mica-titania pigments. Dyes Pigment. 2013, 96, 31–37. [Google Scholar] [CrossRef]
  20. Kahya, S.S.; Sönmez, Y.; Gündüz, G.; Mavis, B. Combination effect pigments with enhanced fluorescence. Pigment. Resin Technol. 2019, 48, 277–292. [Google Scholar] [CrossRef]
  21. Silva, G.T.M.; da Silva, K.M.; Silva, C.P.; Rodrigues, A.C.B.; Oake, J.; Gehlen, M.H.; Bohne, C.; Quina, F.H. Highly fluorescent hybrid pigments from anthocyanin- and red wine pyranoanthocyanin-analogs adsorbed on sepiolite clay. Photochem. Photobiol. Sci. 2019, 18, 1750–1760. [Google Scholar] [CrossRef]
  22. Rodriguez-Saona, L.E.; Wrolstad, R.E. Extraction, Isolation, and Purification of Anthocyanins. Curr. Protoc. Food Anal. Chem. 2001, F1.1.1–F1.1.11. [Google Scholar] [CrossRef]
  23. Pismenskaya, N.; Sarapulova, V.; Klevtsova, A.; Mikhaylin, S.; Bazinet, L. Adsorption of Anthocyanins by Cation and Anion Exchange Resins with Aromatic and Aliphatic Polymer Matrices. Int. J. Mol. Sci. 2020, 21, 7874. [Google Scholar] [CrossRef] [PubMed]
  24. Pina, F.; Oliveira, J.; de Freitas, V. Anthocyanins and derivatives are more than flavylium cations. Tetrahedron 2015, 71, 3107–3114. [Google Scholar] [CrossRef]
  25. Singh, M.; Singh, L. Vibrational spectroscopic study of muscovite and biotite layered phyllosilicates. Indian J. Pure Appl. Phys. 2016, 54, 116–122. [Google Scholar]
  26. Prima, E.C.; Nugroho, H.S.; Nugraha; Refantero, G.; Panatarani, C.; Yuliarto, B. Performance of the dye-sensitized quasi-solid state solar cell with combined anthocyanin-ruthenium photosensitizer. RSC Adv. 2020, 10, 36873–36886. [Google Scholar] [CrossRef]
  27. Gregorkiewitz, M.; Rausell-Colom, J.A. Characterization and properties of a new synthetic silicate with highly charged mica-type layers. Am. Mineral. 1987, 72, 515–527. [Google Scholar]
  28. Nie, B.; Stutzman, J.; Xie, A. A Vibrational Spectral Maker for Probing the Hydrogen-Bonding Status of Protonated Asp and Glu Residues. Biophys. J. 2005, 88, 2833–2847. [Google Scholar] [CrossRef] [Green Version]
  29. Dawy, M. Electrical Properties and Infrared Studies of Heated Mica Sheets. Egypt. J. Solids 2002, 25, 137–152. [Google Scholar] [CrossRef]
  30. Buchweitz, M.; Gudi, G.; Carle, R.; Kammerer, D.R.; Schulz, H. Systematic investigations of anthocyanin–metal interactions by Raman spectroscopy. J. Raman Spectrosc. 2012, 43, 2001–2007. [Google Scholar] [CrossRef]
  31. Ribeiro, H.L.; Oliveira, A.V.d.; Brito, E.S.d.; Ribeiro, P.R.V.; Souza Filho, M.d.s.M.; Azeredo, H.M.C. Stabilizing effect of montmorillonite on acerola juice anthocyanins. Food Chem. 2018, 245, 966–973. [Google Scholar] [CrossRef]
  32. Kosmulski, M. The pH-dependent surface charging and points of zero charge: V. Update. J. Colloid Interface Sci. 2011, 353, 1–15. [Google Scholar] [CrossRef]
  33. Andersen, Ø.M.M.K.R. Flavonoids: Chemistry, Biochemistry, and Applications; CRC, Taylor & Francis: Boca Raton, FL, USA, 2006. [Google Scholar]
  34. Hawkins, T. Surface Charge Characterization of Anatase and Rutile Using Flow Adsorption Microcalorimetry. Master’s Thesis, Georgia State University, Atlanta, GA, USA, 2016. [Google Scholar]
  35. Alfarano, S.R.; Pezzotti, S.; Stein, C.J.; Lin, Z.; Sebastiani, F.; Funke, S.; Hoberg, C.; Kolling, I.; Ma, C.Y.; Mauelshagen, K.; et al. Stripping away ion hydration shells in electrical double-layer formation: Water networks matter. Proc. Natl. Acad. Sci. USA 2021, 118, e2108568118. [Google Scholar] [CrossRef] [PubMed]
  36. Ranasinghe, C.S.K.; Wanninnayake, W.M.N.M.B.; Kumara, G.R.A.; Rajapakshe, R.M.G.; Sirimanne, P.M. An enhancement of efficiency of a solid-state dye-sensitized solar cell due to cocktail effect of N719 and black dye. Optik 2014, 125, 813–815. [Google Scholar] [CrossRef]
  37. Rajkumar, S.; Kumar, M.N.; Suguna, K.; Muthulakshmi, S.; Kumar, R.A. Enhanced performance of dye-sensitized solar cells using natural cocktail dye as sensitizer. Optik 2019, 178, 224–230. [Google Scholar] [CrossRef]
  38. Hao, S.; Wu, J.; Huang, Y.; Lin, J. Natural dyes as photosensitizers for dye-sensitized solar cell. Sol. Energy 2006, 80, 209–214. [Google Scholar] [CrossRef]
  39. Chien, C.-Y.; Hsu, B.-D. Optimization of the dye-sensitized solar cell with anthocyanin as photosensitizer. Sol. Energy 2013, 98, 203–211. [Google Scholar] [CrossRef]
Figure 1. The comparative spectra of ACN solutions prepared with different pH values (between pH = 2 and pH = 10, values increased from bottom to top); (a) UV-Vis spectra, (b) Infrared Spectra, (c) Fluorescence spectra at 270 nm excitation, and (d) Fluorescence spectra at 420 nm excitation.
Colorants 01 00010 g001
Figure 2. Color variation of CPs depending on the deposition pH; (a) Mica flakes, (b) MT, (c) CP deposited at ACN extraction pH (i.e., 4.37), CPs deposited at pH values of (d) 2, (e) 3, (f) 4, (g) 5, (h) 6, (i) 7, (j) 8, (k) 9, and (l) 10.
Colorants 01 00010 g002
Figure 3. Coating efficiency of ACN on MT at different pH values determined according to Equation (3) (a). The amount of drop in pH measured after deposition reaction was terminated with respect to the initial pH values of deposition medium. Marked labels indicate the actual final pH values (b).
Colorants 01 00010 g003
Figure 4. (a) Normalized FTIR spectra of CPs and (b) Transmission peak intensity fluctuations of different absorptions.
Colorants 01 00010 g004
Figure 5. Normalized fluorescence spectra of CPs with (a,b) 270 nm and (c,d) 380 nm excitation. In (b,d), the normalized maximum intensities at different fluorescence wavelengths were compared with the coating efficiencies already given in Figure 3a.
Colorants 01 00010 g005
Publisher’s Note: MDPI stays neutral with regard to jurisdictional claims in published maps and institutional affiliations.

