Article

Framework for Predicting Failure in Polymeric Unidirectional Composites through Combined Experimental and Computational Mesoscale Modeling Techniques

School of Sustainable Engineering and the Built Environment, Arizona State University, Tempe, AZ 85287, USA
*
Author to whom correspondence should be addressed.
Fibers 2021, 9(8), 50; https://doi.org/10.3390/fib9080050
Submission received: 7 May 2021 / Revised: 4 June 2021 / Accepted: 21 July 2021 / Published: 2 August 2021
(This article belongs to the Special Issue Polymer Fibers and Composites)

Abstract

:
As composites continue to be increasingly used, finite element material models that homogenize the composite response become the only logical choice as not only modeling the entire composite microstructure is computationally expensive but obtaining the entire suite of experimental data to characterize deformation and failure may not be possible. The focus of this paper is the development of a modeling framework where plasticity, damage, and failure-related experimental data are obtained for each composite constituent. Mesoscale finite elements models consisting of multiple repeating unit cells are then generated and used to represent a typical carbon fiber/epoxy resin unidirectional composite to generate the complete principal direction stress-strain curves. These models are subjected to various uniaxial states of stress and compared with experimental data. They demonstrate a reasonable match and provide the basic framework to completely define the composite homogenized material model that can be used as a vehicle for failure predictions.

1. Introduction

Predicting failure in composite structures has historically proven to be a challenging task. Researchers have proposed various methods to solve this problem, with many of these methods being compared and thoroughly tested as a part of the first, second, and third world-wide failure exercise [1,2]. However, even after the concerted effort to assess strengths and weaknesses spanning nearly 25 years, a consensus still has not been reached on the most effective techniques for predicting composite failure. Attempting to mathematically describe the failure mechanisms is challenging [3], especially when different material combinations and architectures are considered as failure is typically caused by phenomena originating at the microscale or mesoscale and are difficult to mathematically quantify. In our earlier work [4], a combination of physical and virtual testing was used to generate the deformation-related behavior of unidirectional composites. In this paper, we will show why those ideas can and need to be extended to describe not only the deformation but also damage and especially failure predictions.
To fully validate a three-dimensional (3D) failure theory or criterion for a given composite requires generating a full suite of data under a variety of loading conditions. The required data involves performing experiments under uniaxial, biaxial, and triaxial stress conditions. However, obtaining the experimental data is neither easy nor tractable, as prior research has shown. Experimental programs have been developed to characterize the in-plane failure properties of unidirectional composites [5,6,7]. However, many of these programs involve custom test equipment or complex specimen geometries necessitating advanced stress analysis to derive accurate results. While much of the previous research has focused on characterizing in-plane properties, there have been a few efforts to experimentally characterize out-of-plane properties [8,9].
Experimental challenges and limitations have led to the rise of computational techniques to aid in composite failure analysis. These computational studies are typically performed at the composite microscale or mesoscale or using a multiscale approach. The choice of scale depends on the desired level of fidelity in the model and, more importantly, on the architecture of the composite since this is typically what dictates the governing failure mechanisms. Significant efforts have been made to generate failure surfaces through virtual testing via finite element analysis (FEA), which provides more control over the desired states of stress or strain in the composite. Often, micromechanical models of the unidirectional composite are created using a representative volume element (RVE) where the fiber, matrix, and interface are explicitly represented. The fibers are often represented as elastic orthotropic components, the matrix is typically represented using a nonlinear material model involving one or both of plasticity and damage, and the fiber/matrix interface is represented using the concepts of nonlinear fracture mechanics in the form of cohesive zone modeling. This approach has been used by numerous researchers to derive parts of the failure locus of specific unidirectional composites subjected to various multiaxial states of stress, transverse tension, and out-of-plane shear using a 2D RVE [10], shear, and transverse tension-compression with 3D RVE [11,12], combined transverse compression and shear with 3D RVE [13], and transverse tensile and shear loading with 3D RVE [14].
The strengths of virtual testing in generating a predictive framework are several. First, it shows the significance of the underlying composite architecture and explains why macroscale models are mostly deficient in predicting damage and failure. Second, it provides a means of obtaining experimental data for macroscale models when experiments cannot be conducted reliably or not at all. Third, and this is the focus of this paper, it can provide data so as to be able to generate a point cloud of data that represents the failure surface when it is simply not possible to generate the data experimentally or analytically. The framework presented in this paper represents the first step of the overall goal, which is to use a tabulated failure surface [15] generated using a mix of physical and virtual testing as complementary tools from both the composite and composite constituents to simulate high-velocity impact and crush events. A combined virtual and physical testing approach is required to achieve this goal for various reasons. First, physical experiments are used to establish validation data for both the composite as well as for the individual constituents of the composite. Second, physical experiments are expensive to conduct, and a vast number of multiaxial states of stress are currently impossible to obtain in the laboratory. While virtual testing complements physical testing, the virtual test models must be rigorously validated to ensure confidence in the predictions. The tabulated failure surface is provided as two independent sets of data: one representing the in-plane (IP) and the other out-of-plane (OOP) failure response, respectively. The two independent responses are coupled to predict whether failure has occurred in the material and subsequently if the finite element is numerically eroded. The failure criteria are valid for both thin shells and solid elements. The failure of thin shell elements is fully described by the in-plane failure data, while the failure of solid elements is fully represented by both the in-plane and out-of-plane failure surfaces. Figure 1 provides a representation of the in-plane and out-of-plane failure surfaces, with the level of fidelity in the failure surface description being dependent on the density of the point cloud. It should be noted that this approach has been used in a limited fashion in impact simulations, indicating that this approach is effective as a predictor of failure onset [15,16].
The solid circles shown in Figure 1 represent the failure states of the composite material derived experimentally when the test specimen is subjected to various states of uniaxial loading. Matching virtual test data to experimental data for these same tests by adjusting material model parameters provides a calibrated material model that can be used to populate the remainder of the point cloud represented by hollow circles.
Issues identified earlier as being crucial in making composite behavior predictable are addressed in this paper, building a framework that includes physical testing and virtual testing as complementary tools; validating the micromechanical (meso-scale) model used in the virtual tests with laboratory test results; and demonstrating the capabilities of the framework by generating the anchor points in the point cloud representation of the failure surface via virtual testing and comparing them to experimentally obtained data. A commonly used structural composite, the T800-F3900 (https://www.toraycma.com/page.php?id=27 (accessed on 20 July 2021)) unidirectional composite is used to illustrate these ideas. The first part of the paper presents experimental techniques to obtain the mechanical properties of the constituent materials T800S carbon fiber and the F3900 epoxy resin. The experimental data is used to derive input for the constitutive models for the carbon fiber (MAT_213) and epoxy resin (MAT_187), material models available in LS-DYNA, a commercial finite element program [17]. Next, mesoscale modeling techniques are used to generate representative unit cells (containing fibers and epoxy resin) and ultimately the virtual testing specimens. The virtual test specimens are subjected to various uniaxial states of stress (in the 1–2 plane), and the homogenized results of the simulations are then compared with previously obtained experimental results [18] to validate the virtual testing models. The ultimate goal of the research is to exercise the developed virtual testing framework first in the 1–2 plane (suitable for use with plane stress/shell elements), then to extend the ideas to the out-of-plane direction (necessary for use with solid elements), and ultimately to use the proposed framework to generate known multiaxial states of stresses that today are virtually impossible to generate in the laboratory. This will help generate a tabulated failure surface data table with sets of ( σ 1 , σ 2 , τ 12 ) , or ( σ 1 , σ 2 , σ 3 , τ 23 ) , or ( σ 1 , σ 2 , σ 3 , τ 12 , τ 23 , τ 31 ) data that can then be used in macroscale modeling of impact and crush events. The goal is to enhance the MAT_213′s failure prediction model where the input of failure surfaces as tabulated input [15,19,20,21,22,23] is currently used via tabular interpolation techniques to ascertain when failure has occurred.

2. Composite Constituent Properties

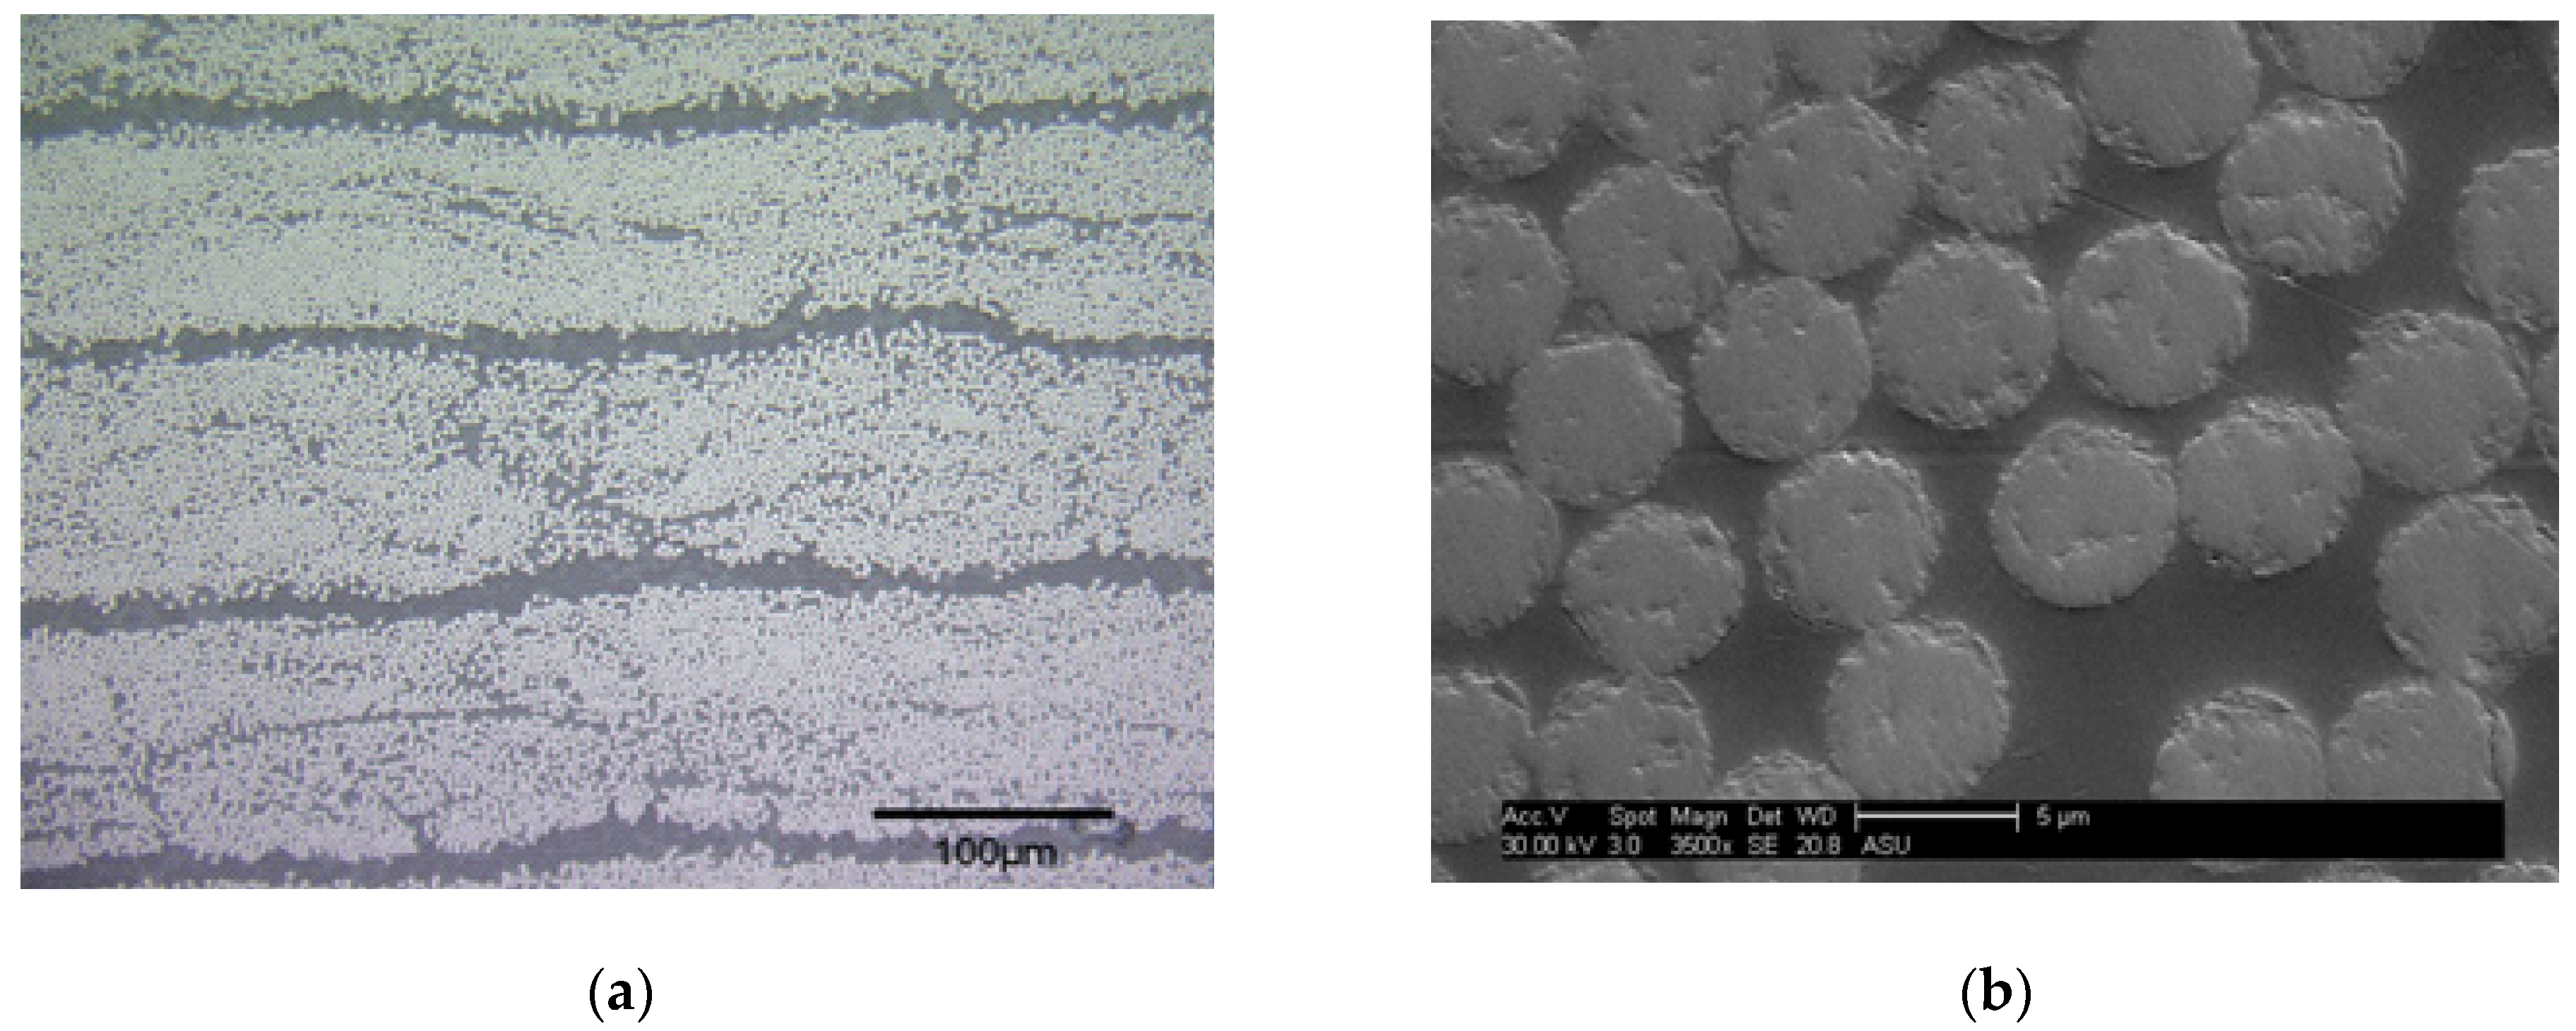
Experimental data for each composite constituent is obtained to meet the input specifications of the respective computational material model. Much of the experimentation presented in this paper is focused on characterizing the F3900 epoxy matrix as the complex nonlinear behavior observed in the composite is attributed to the matrix. Properties of both the carbon fiber and the fiber/matrix interface are obtained partially through publicly available data and partially through numerical calibration of specific finite element models against experimental T800/F3900 composite data. Micrographs of the composite are shown in Figure 2.

2.1. Carbon Fiber Properties

Characterizing carbon fibers for microscale or mesoscale analyses is best performed through various monofilament experiments. However, this endeavor proves challenging as there are many factors that influence experimental findings. For example, strengths derived from longitudinal monofilament tension tests exhibit a large dependence on gage length due to the distribution of flaws [24,25]. Carbon fibers have been shown to exhibit orthotropic properties, indicating a need to independently acquire transverse and shear properties. These properties are difficult to obtain experimentally because of the small size of carbon fibers.
In light of these challenges and in keeping with the goals of this research work, the carbon fiber properties are obtained in part through manufacturer data sheets (https://www.toraycma.com/page.php?id=661 (accessed on 20 July 2021).) and through micromechanical inverse analysis of specific composite tests on the T800/F3900 composite [4]. The carbon fiber is assumed to be linearly elastic and orthotropic. Table 1 provides the elastic constants used for the T800S carbon fiber.
The properties of the carbon fibers have a direct influence on the response of the composite under fiber-dominated loading modes, e.g., tension and compression in the longitudinal direction. While the fiber properties do not have a significant influence on the stress-strain response of matrix-dominated loading modes, e.g., transverse tension/compression and shear, the properties affect the numerical stability of the simulations. Large discrepancies between the elastic properties of the fiber and matrix may lead to convergence issues in elements at the fiber/matrix interfaces caused by a large gradient in the deformation or stress across the boundary. The properties shown in Table 1 resulted in stable simulations and thus were left unchanged. The T800S longitudinal modulus is shown to be the same in both tension and compression. This assumption is strictly not valid, and a numerical study is presented later in the paper to assess the influence of the longitudinal modulus on the composite response.

2.2. Epoxy Matrix Properties

F3900 is a highly toughened epoxy resin. Experimental results show the material exhibits significant nonlinear behavior under uniaxial tension, compression, and shear stress loading conditions. Additionally, the behavior under all three conditions varies significantly. Thus, an advanced material model is required to appropriately capture the constitutive behavior. LS-DYNA’s MAT_187 [26,27] provides sufficient freedom to the user to model a wide range of polymer material behavior. Much of the input is in the form of tabulated data, which provides a means of more accurately representing the nonlinear and failure behavior than other material models, which are largely driven by analytical methodologies. Nonlinear behavior refers only to the plastic flow of the epoxy resin. While MAT_187 contains provisions to model post-peak softening due to damage, the requisite input has not been derived. Additionally, the viscoelastic behavior of the epoxy resin has been ignored since the high strain rate, and loading/unloading behavior is not of interest in the current work. Additionally, specialized tests would have to be devised and conducted to obtain the viscoelastic properties of both the epoxy resin and the unidirectional composite. A portion of the MAT_187 input parameters has been obtained directly from the experimental work presented in this research. The remaining required input is calibrated as most of them cannot be obtained experimentally. This process is discussed later in the paper.
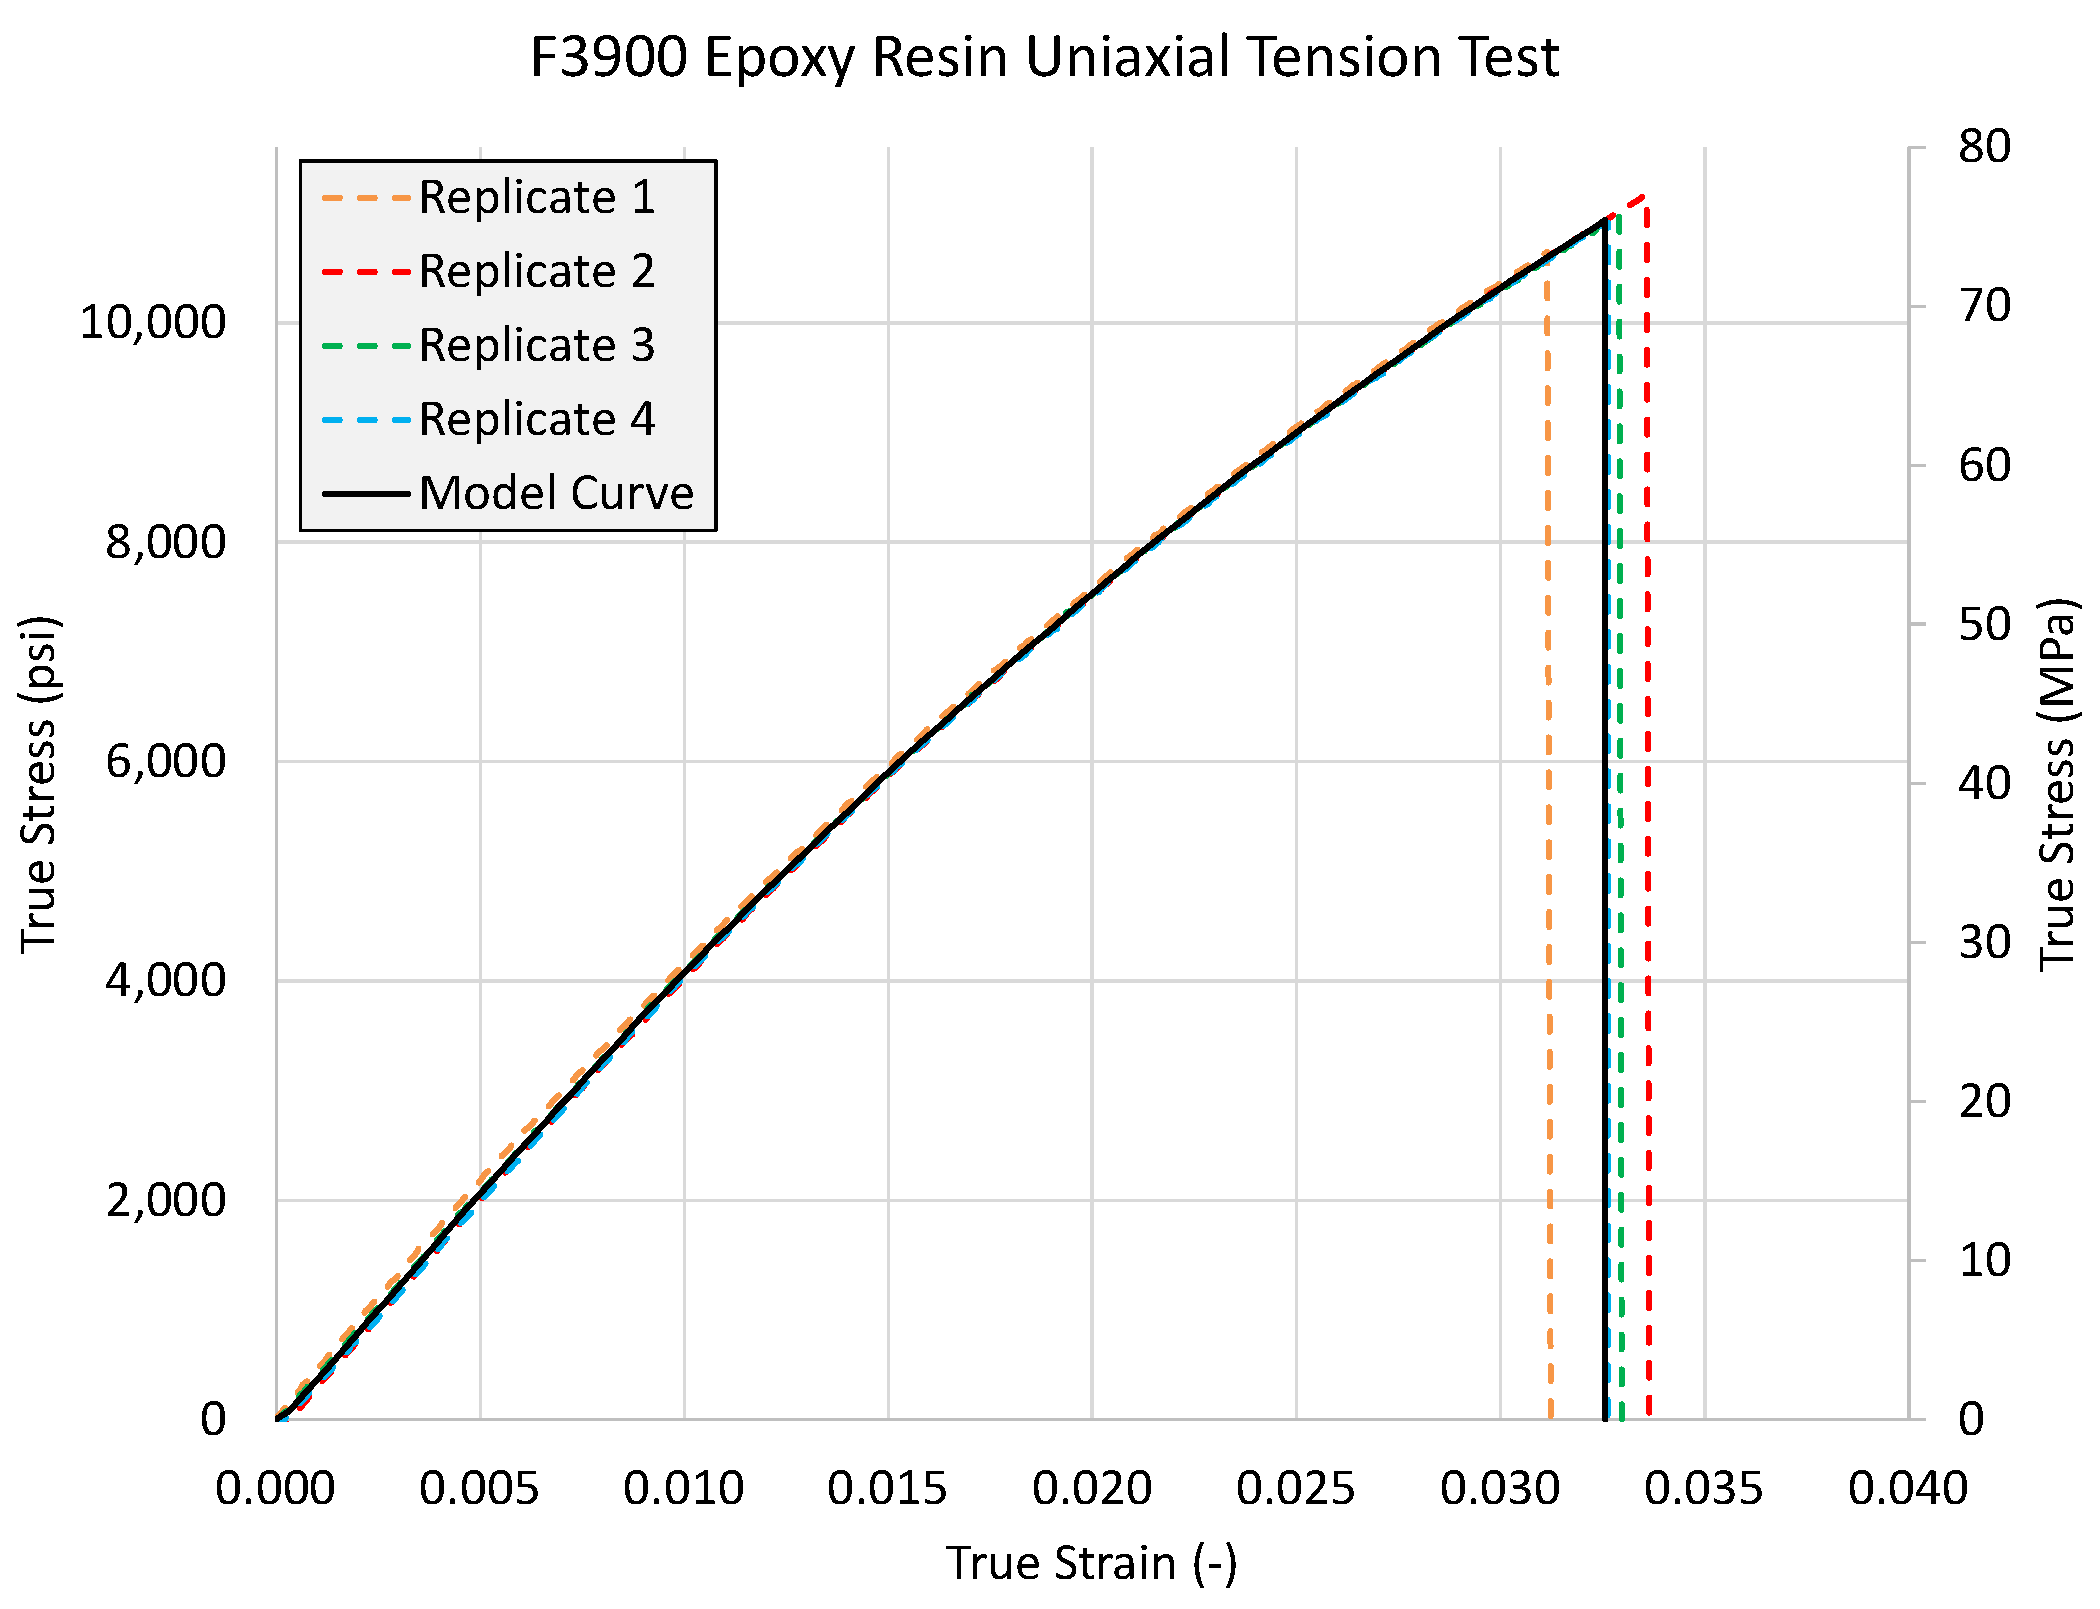
The minimum required input for MAT_187 is derived from experiments performed on specimens manufactured from an F3900 neat resin panel [28]. Test specimens are manufactured using waterjet and CNC milling with the specimen geometries and dimensions following the appropriate ASTM standard, when applicable. Three types of experiments are performed: uniaxial tension, uniaxial compression, and uniaxial shear. These uniaxial stress tests are pivotal for characterizing the plastic flow behavior of the F3900 resin. The stress-plastic strain curves, dubbed LCID-X where X represents a particular mode of loading, are obtained directly from the experimental response and provided as input to MAT_187 to govern the yield surface evolution and plastic flow of the material. Digital image correlation (DIC) is used to capture strain fields developed on the surface of all specimens. The Lagrangian strain tensor is used for the analysis, with the true strain taken directly from the DIC analysis used for generating the stress-strain curves. Similarly, engineering stress is measured and converted into true stress. All tests are performed under displacement control with the actuator stroke rate specified such that the measured strain rates are quasi-static (~10−4/s). For each experiment type, a representative stress-strain response is generated by averaging the experimental data. We label this representative curve as the Model Curve that is used as input data for the FE model. The Model Curve in true stress-strain space is converted into true stress-plastic strain space for use with MAT_187.

2.2.1. Tension Tests

Tension specimens are manufactured in accordance with the geometry specified in ASTM 638-14 [29] for a Type II specimen (Figure 3). A typical failed specimen is shown in Figure 4, where the failure in the specimen is obtained away from the grips.
The resulting true stress-strain curves from multiple replicates, as well as the resulting average response (Model Curve), are shown in Figure 5.

2.2.2. Compression Tests

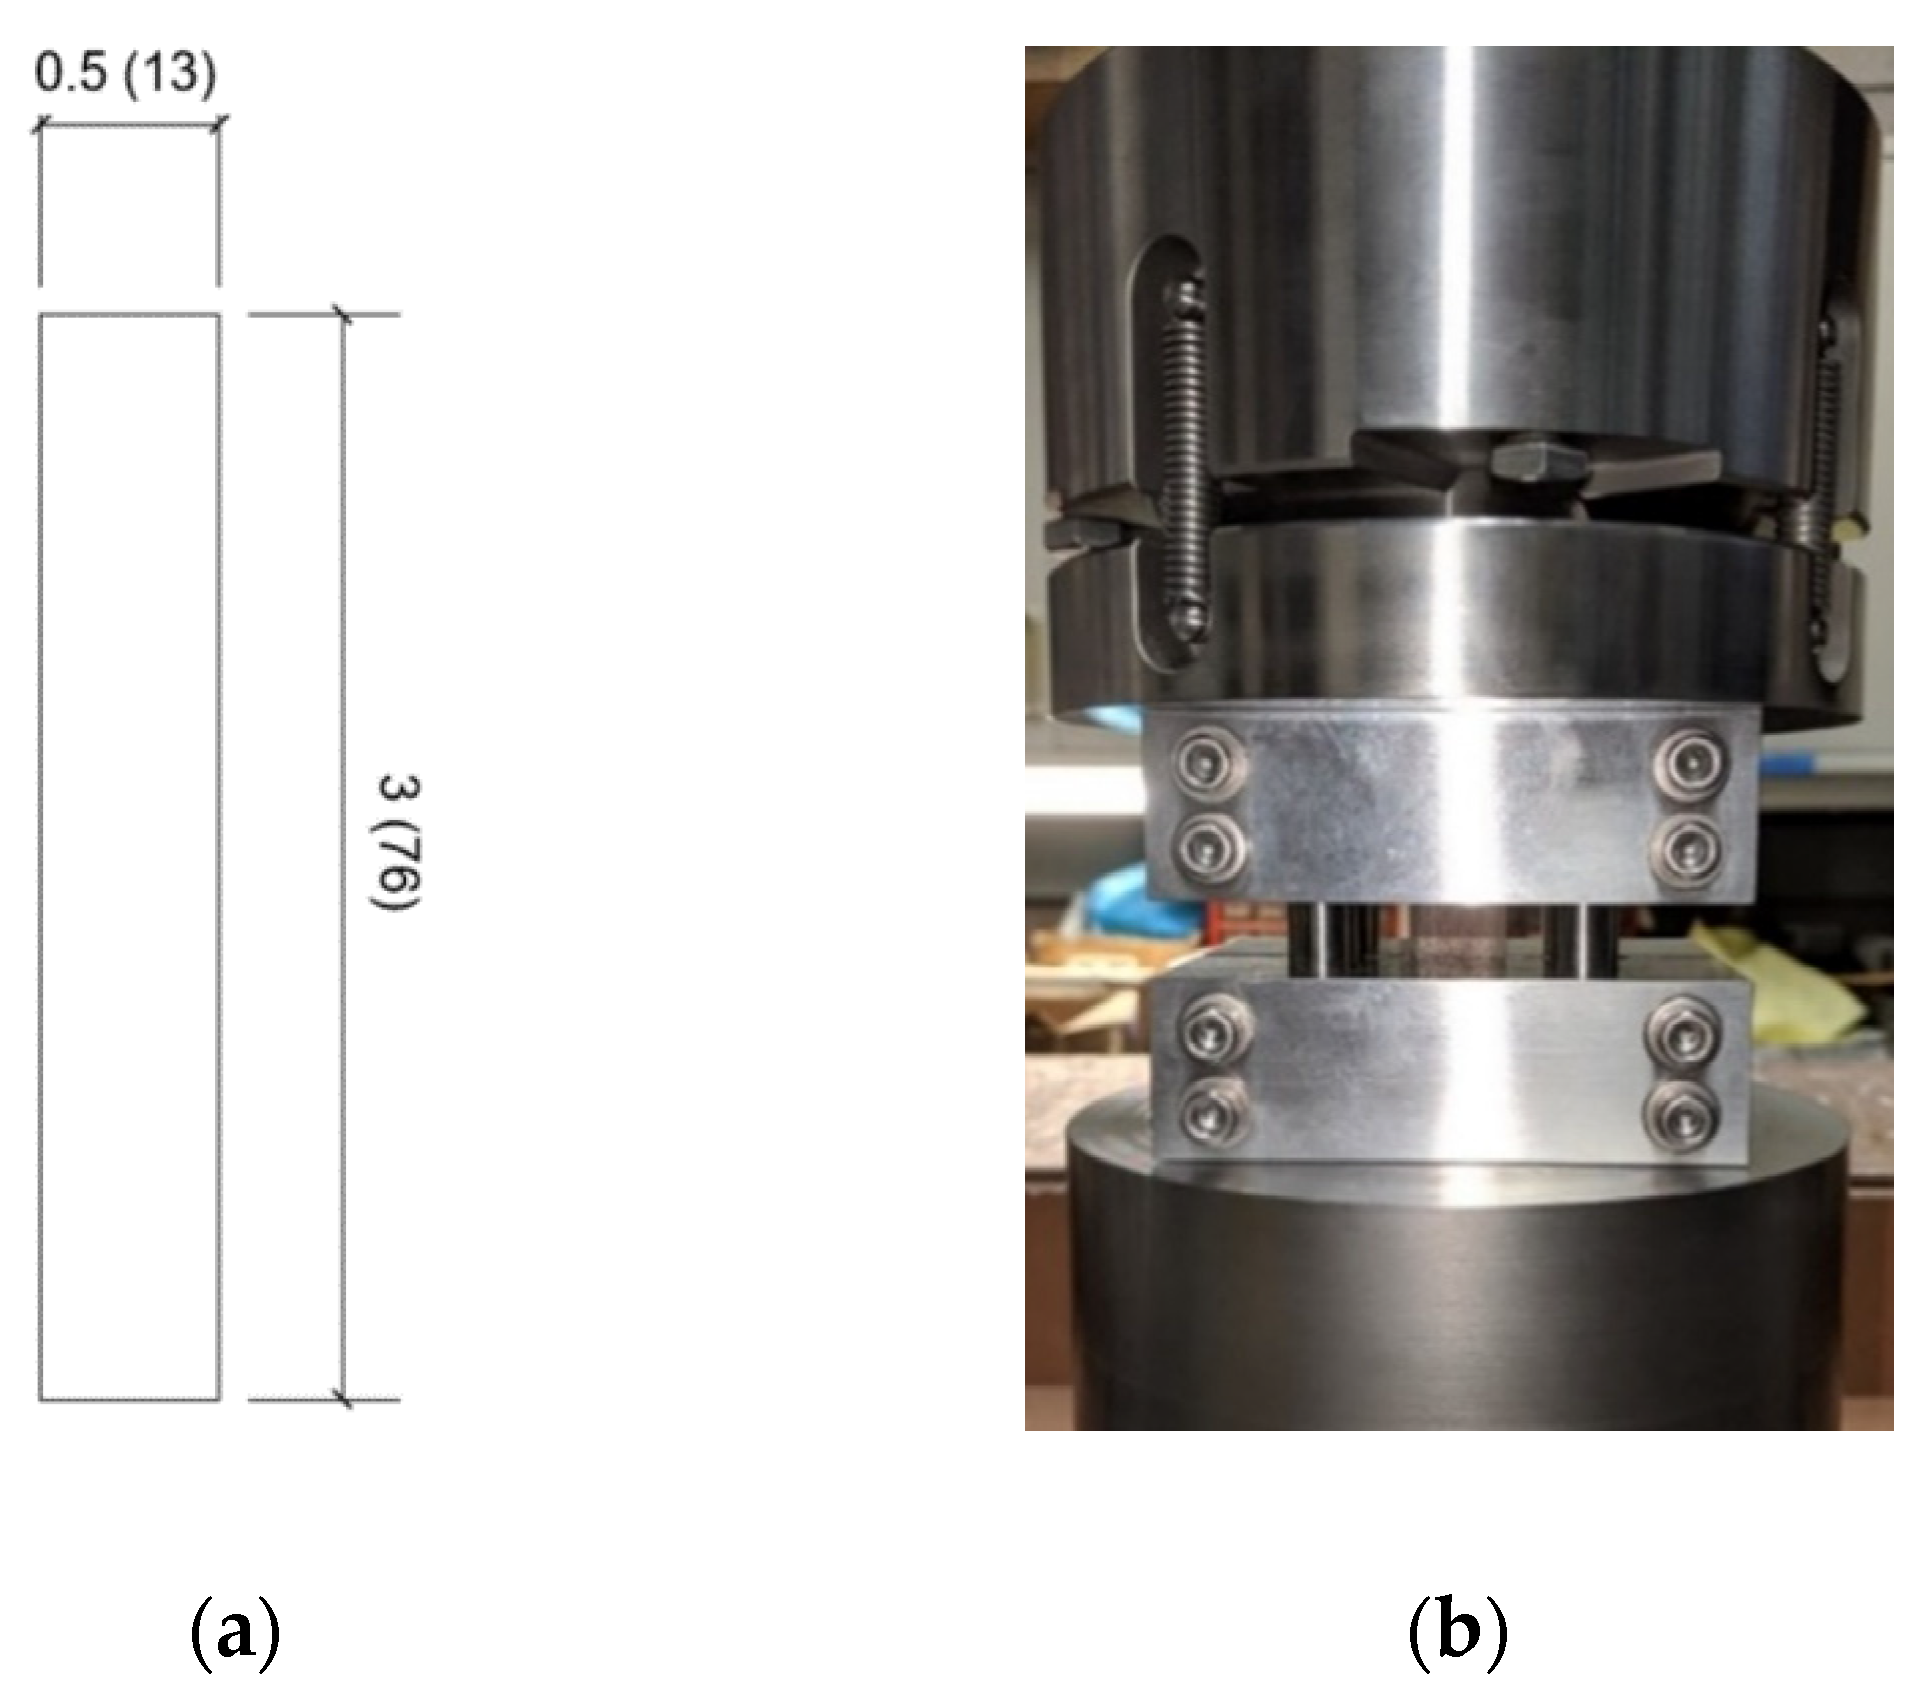
Compression specimen geometry and dimensions are based on recommendations taken from ASTM D6641-16 [30]. However, the dimensions are scaled down for use with a modified combined loading compression (CLC) fixture (http://wyomingtestfixtures.com/products/compression/wyoming-combined-loading-compression-test-fixture-astm-d-6641/ (accessed on 20 July 2021).) due to the limited availability of the neat resin. The specimen dimensions and geometry, along with the test setup, are shown in Figure 6. A typical failed specimen is shown in Figure 7.
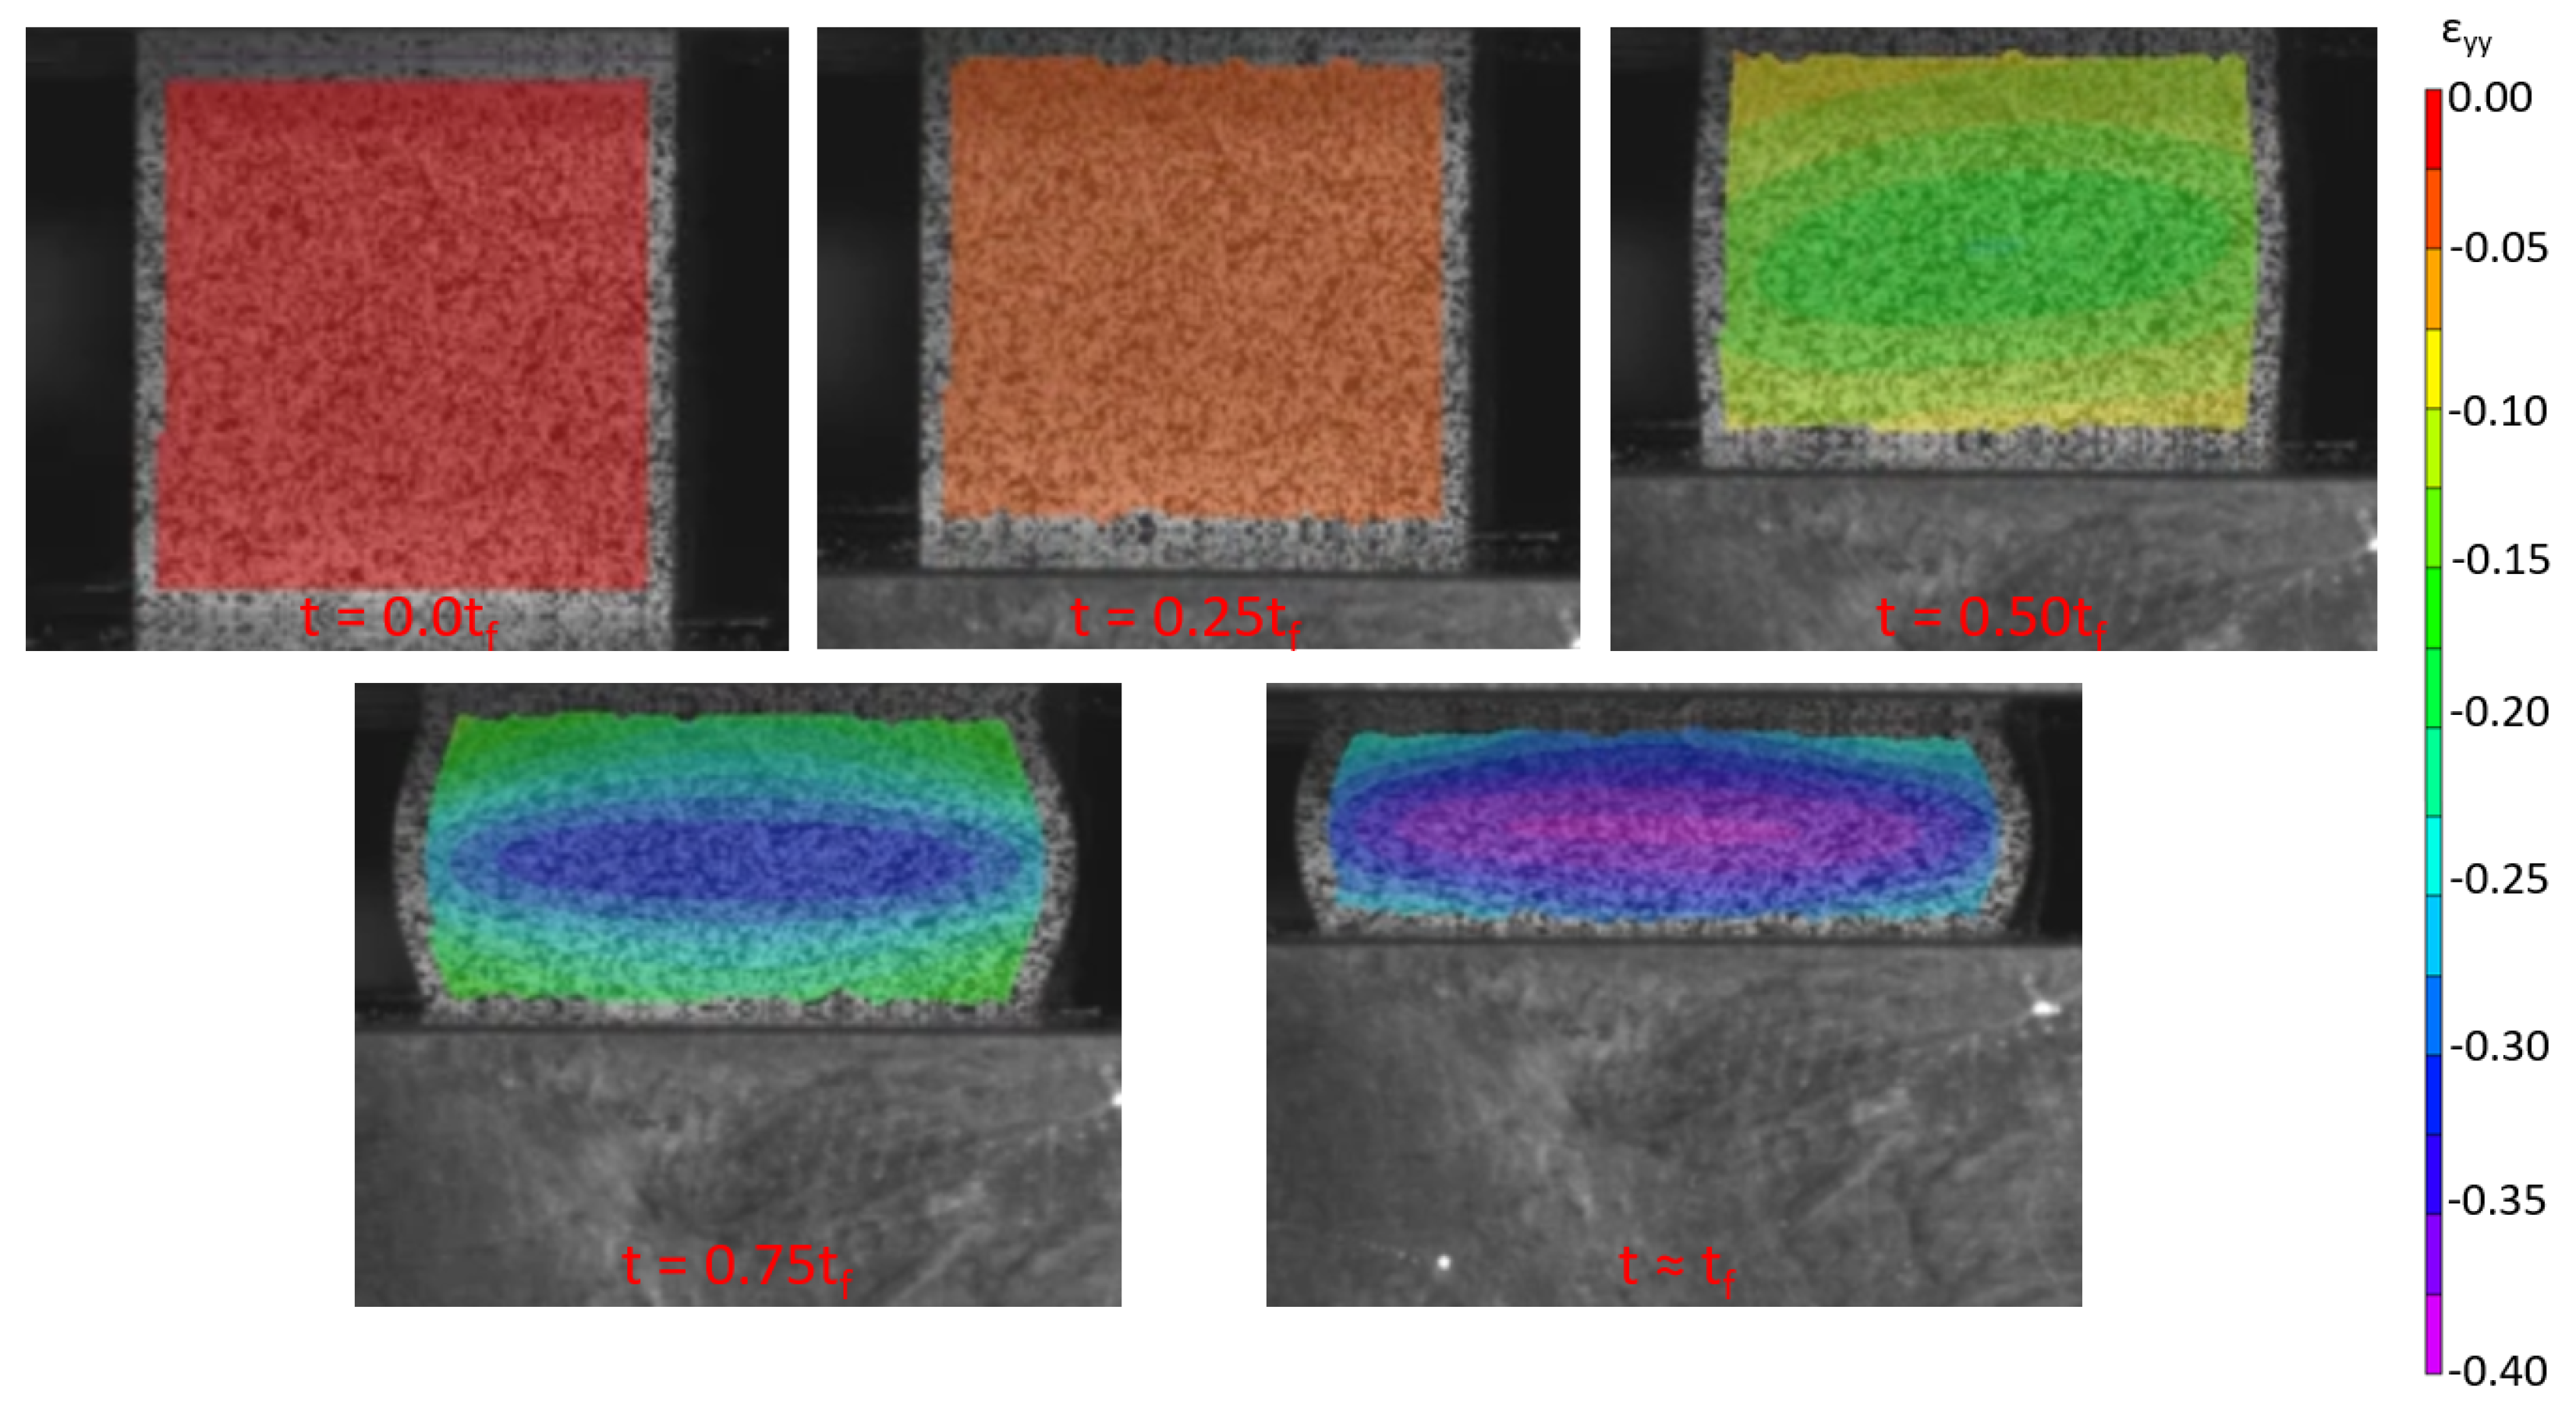
The compression specimen underwent significant lateral deformation, as shown in Figure 7. This is likely due to the friction caused by the gripping fixture at the top and bottom of the gage section meaning the specimen is likely to have developed lateral stresses during the experimental procedure. To adjust for the possible multiaxial stress state, additional numerical calibration is necessary to capture the true uniaxial compression behavior for use with MAT_187. Figure 8 shows how the longitudinal strain field evolved during the tests, with the contour indicating a deviation from a state of uniaxial stress as much of the strain concentrates in the center of the specimen. The test is terminated when the specimen loses load-carrying capacity.
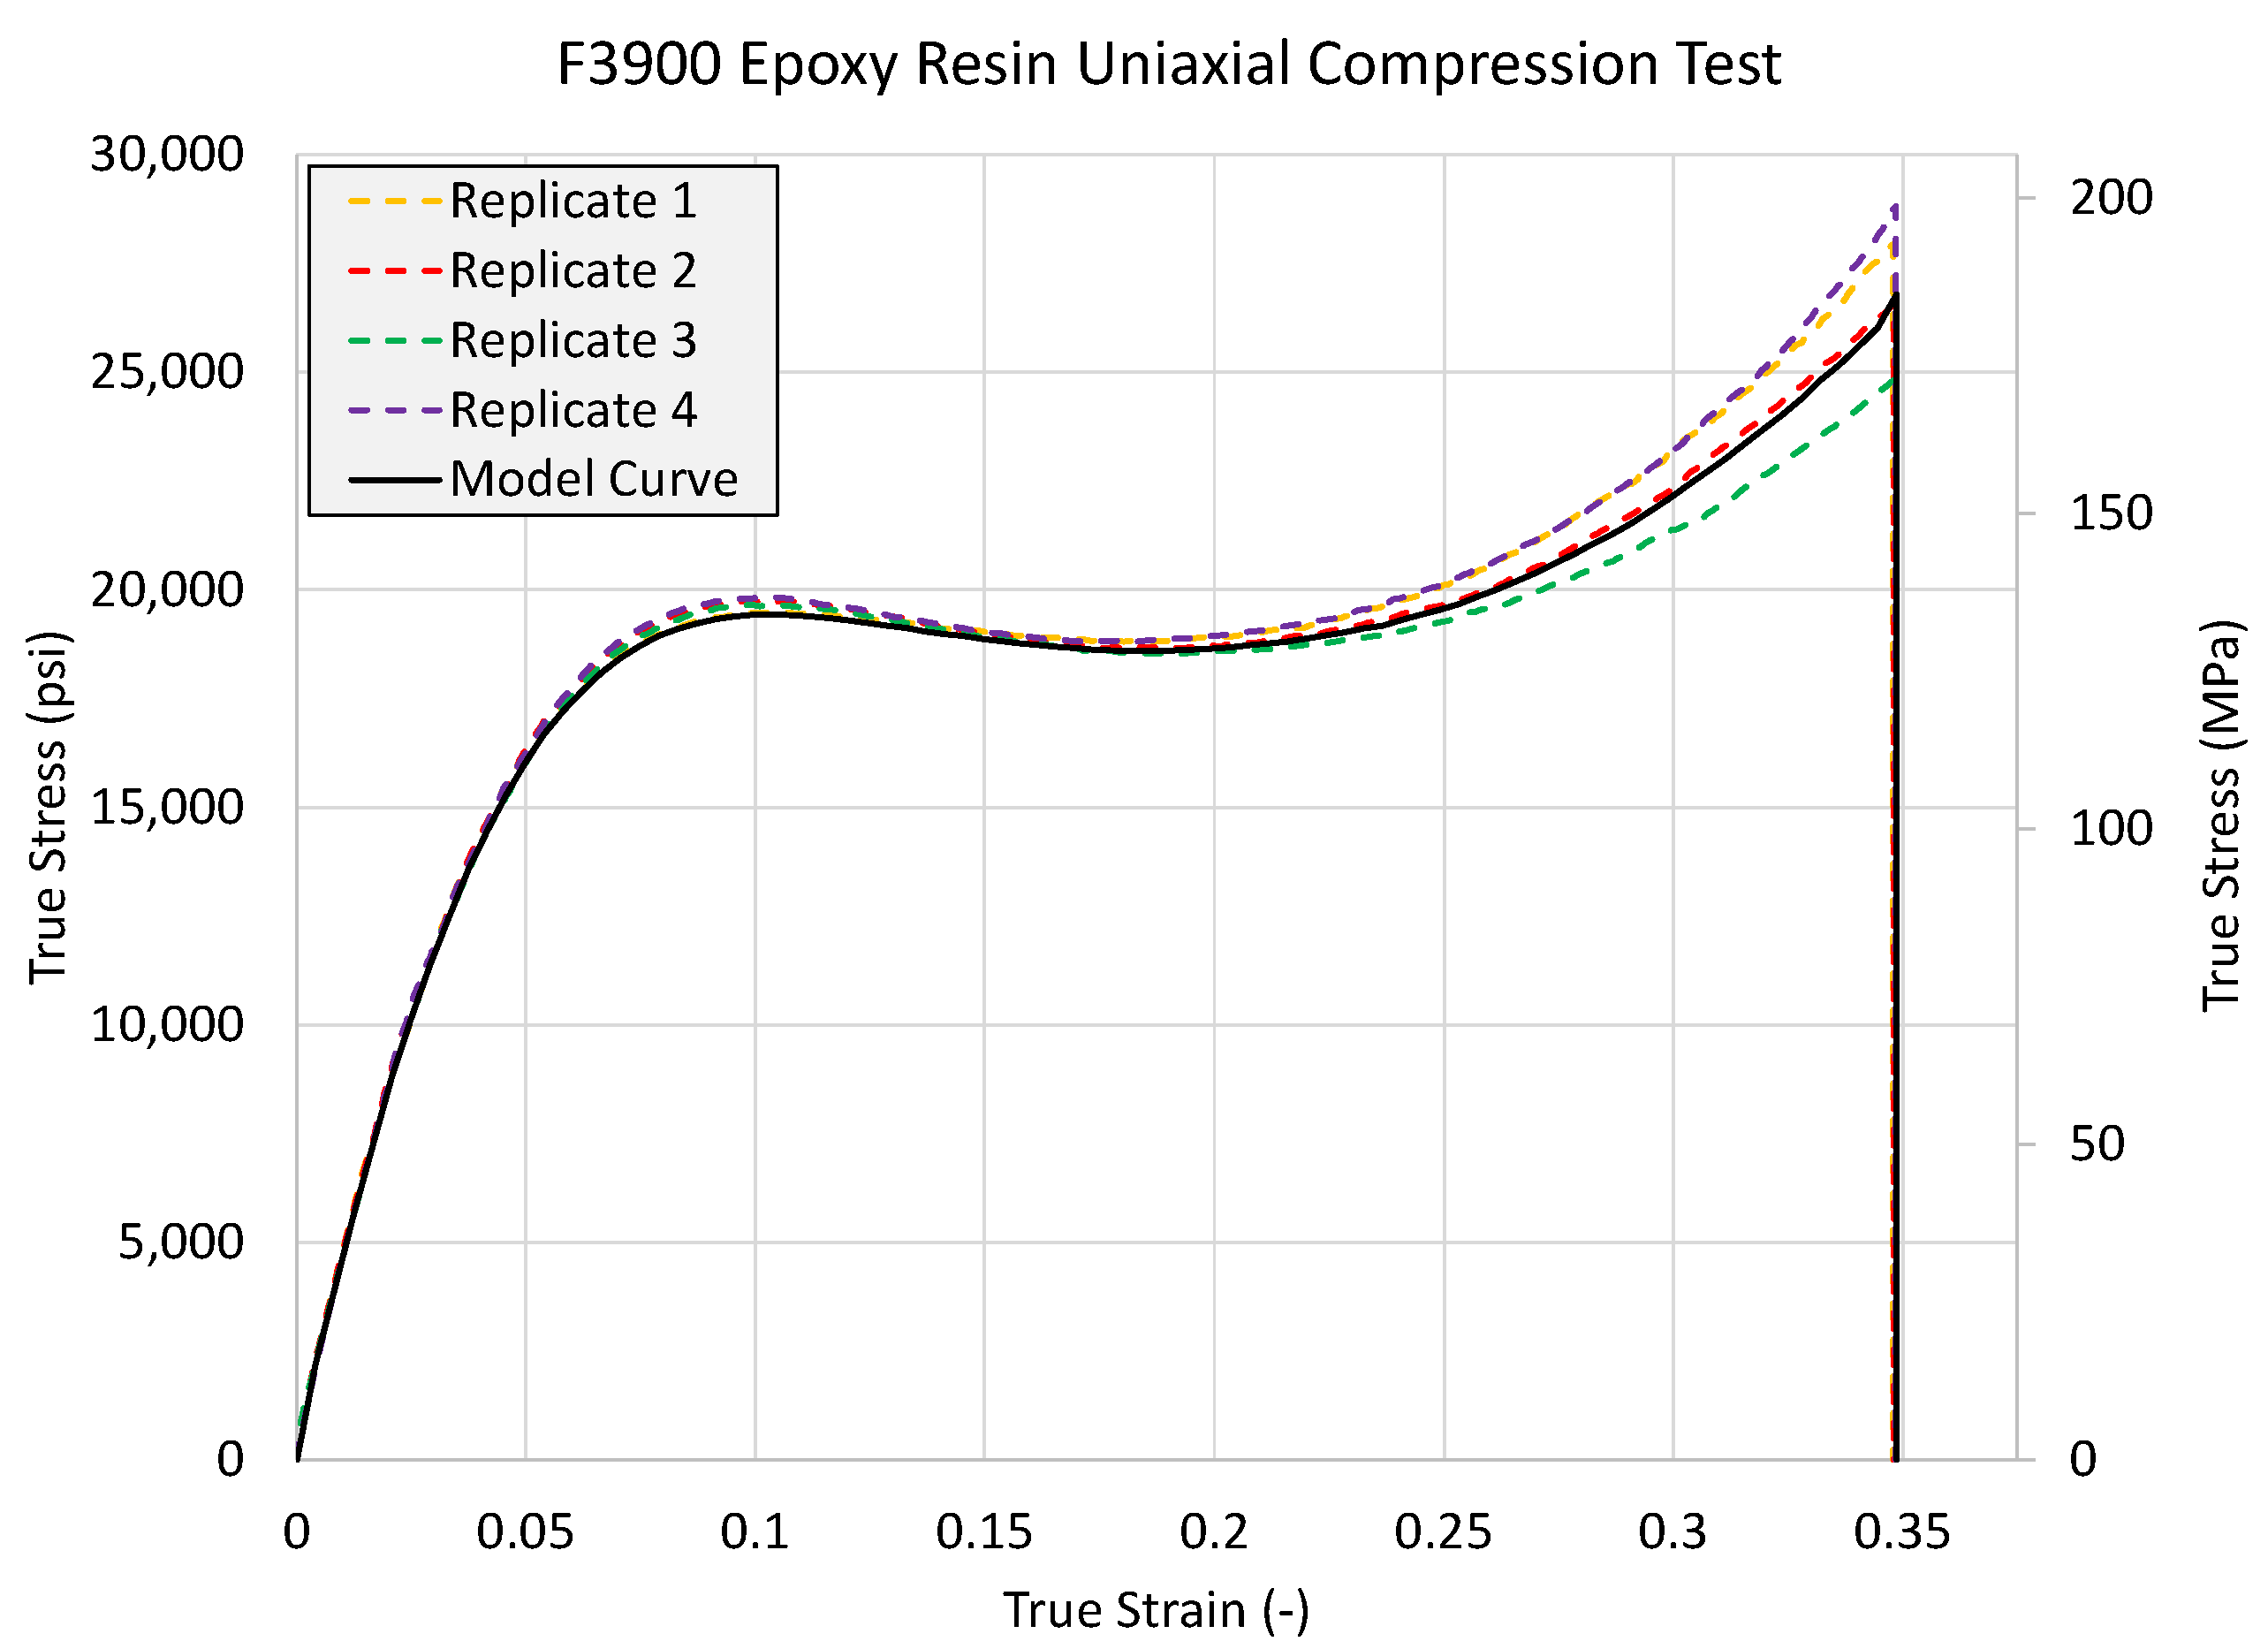
The resulting true stress-strain curves from multiple replicates, as well as the resulting Model Curve, are shown in Figure 9.

2.2.3. Shear Tests

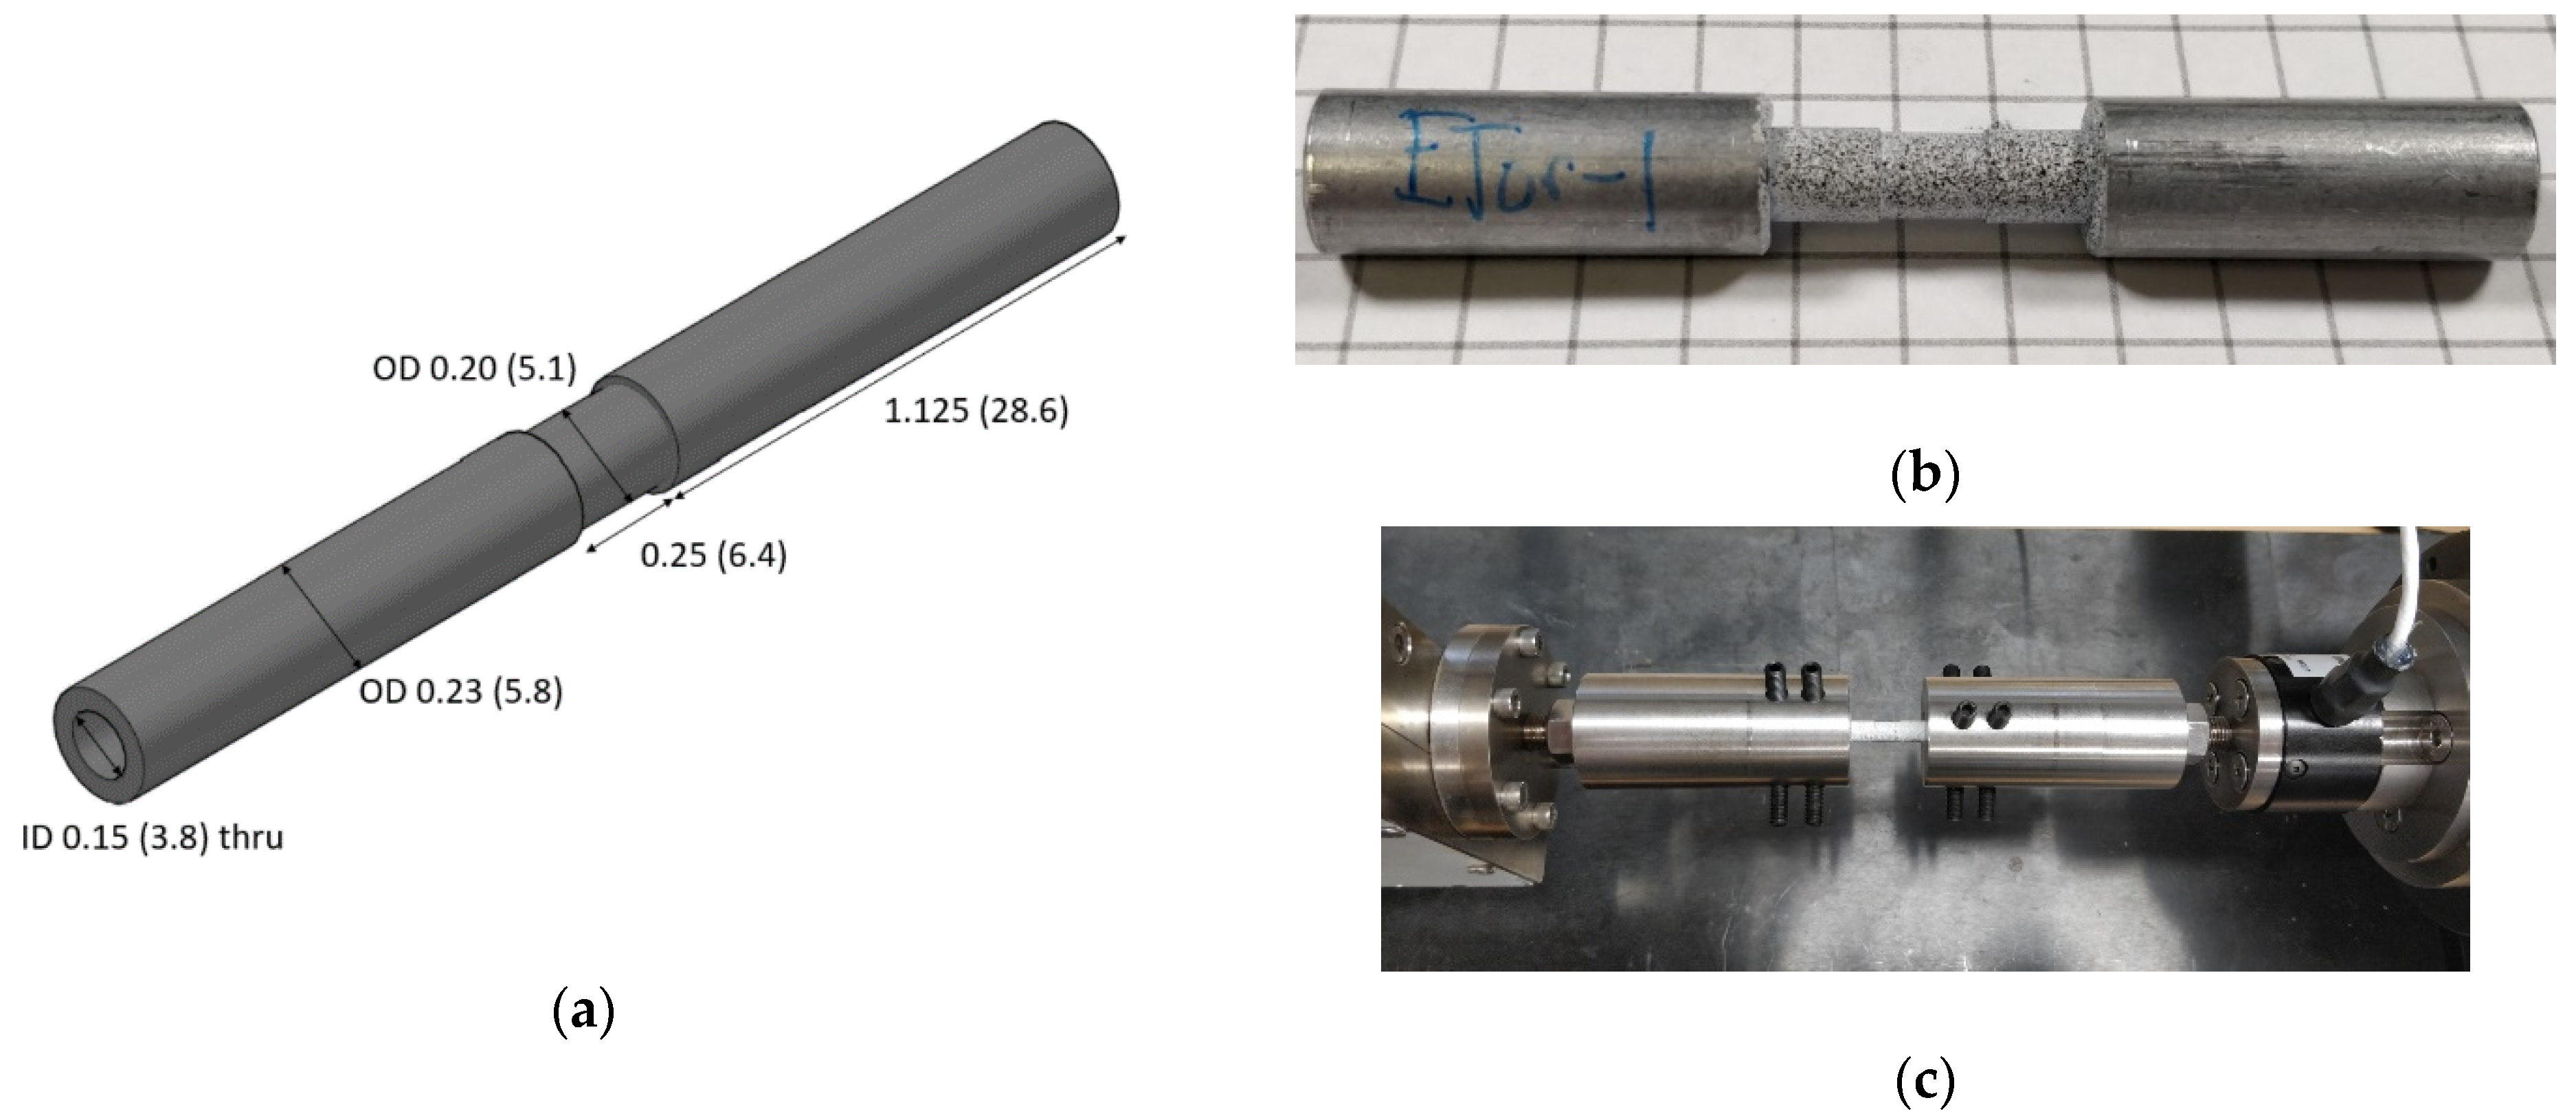
Thin-walled torsion tube specimens were used to derive the required pure shear behavior using the techniques provided by Littell [31] as a guide. Figure 10a provides a schematic of the specimen. The gripping region of the specimens was epoxied inside of stainless-steel collars (Figure 10b) to protect against potentially collapsing the material when gripped using set screws in the test frame (Figure 10c).
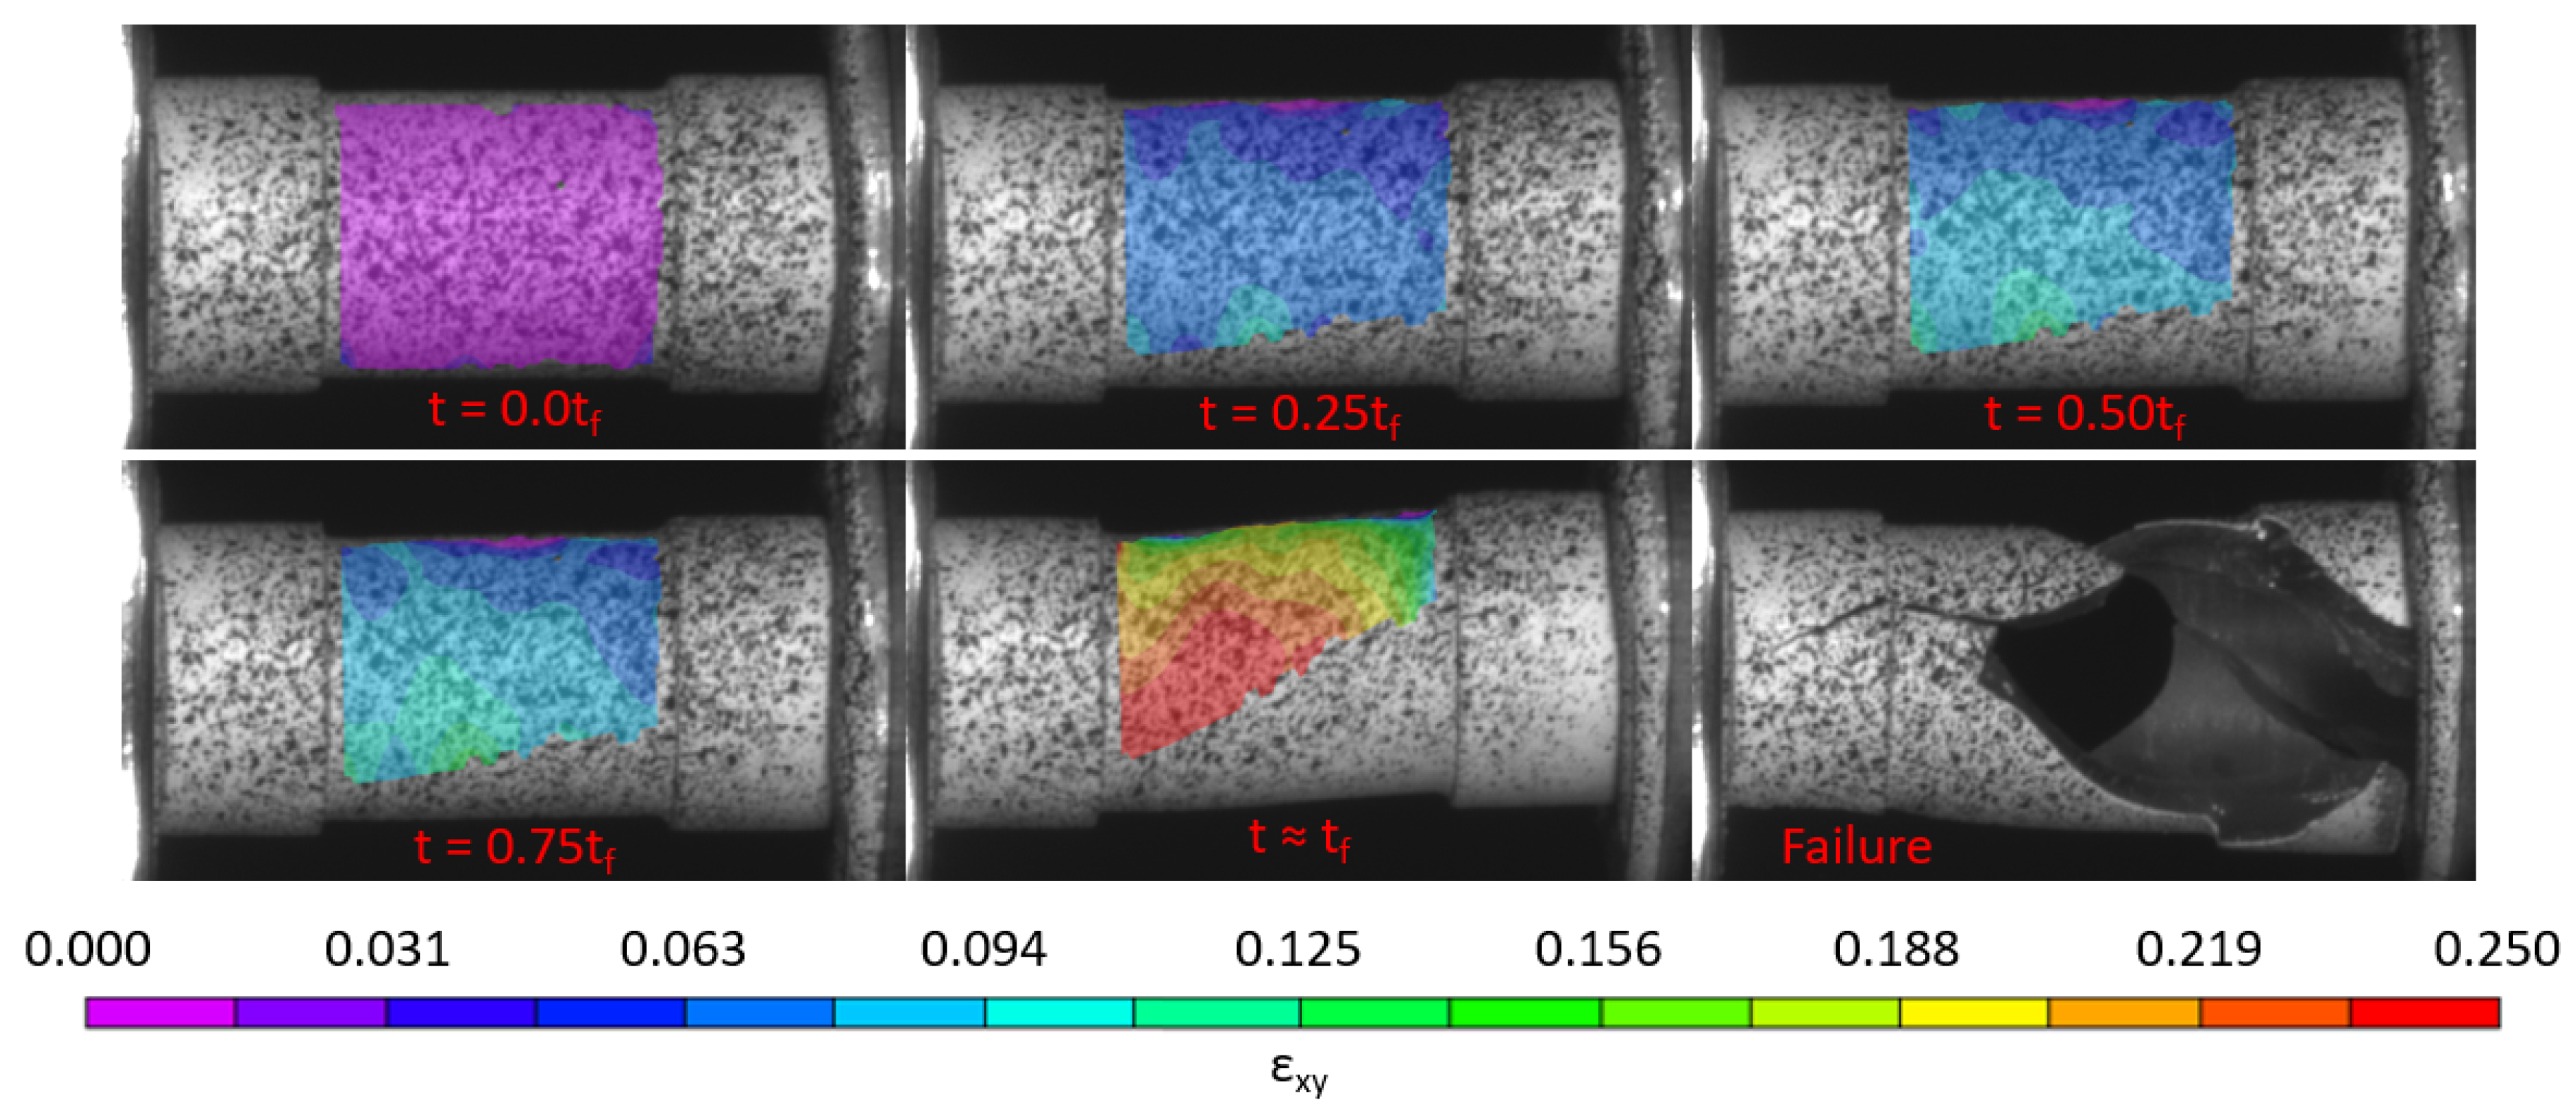
The specimens underwent significant deformation prior to the ultimate failure of the material, causing the initial DIC analysis to largely disappear from the field of view. As such, the Incremental Correlation option was used within Vic-3D v7 [32] to perform the analysis. Figure 11 shows the evolution of the shear strain field during the experimental procedure.
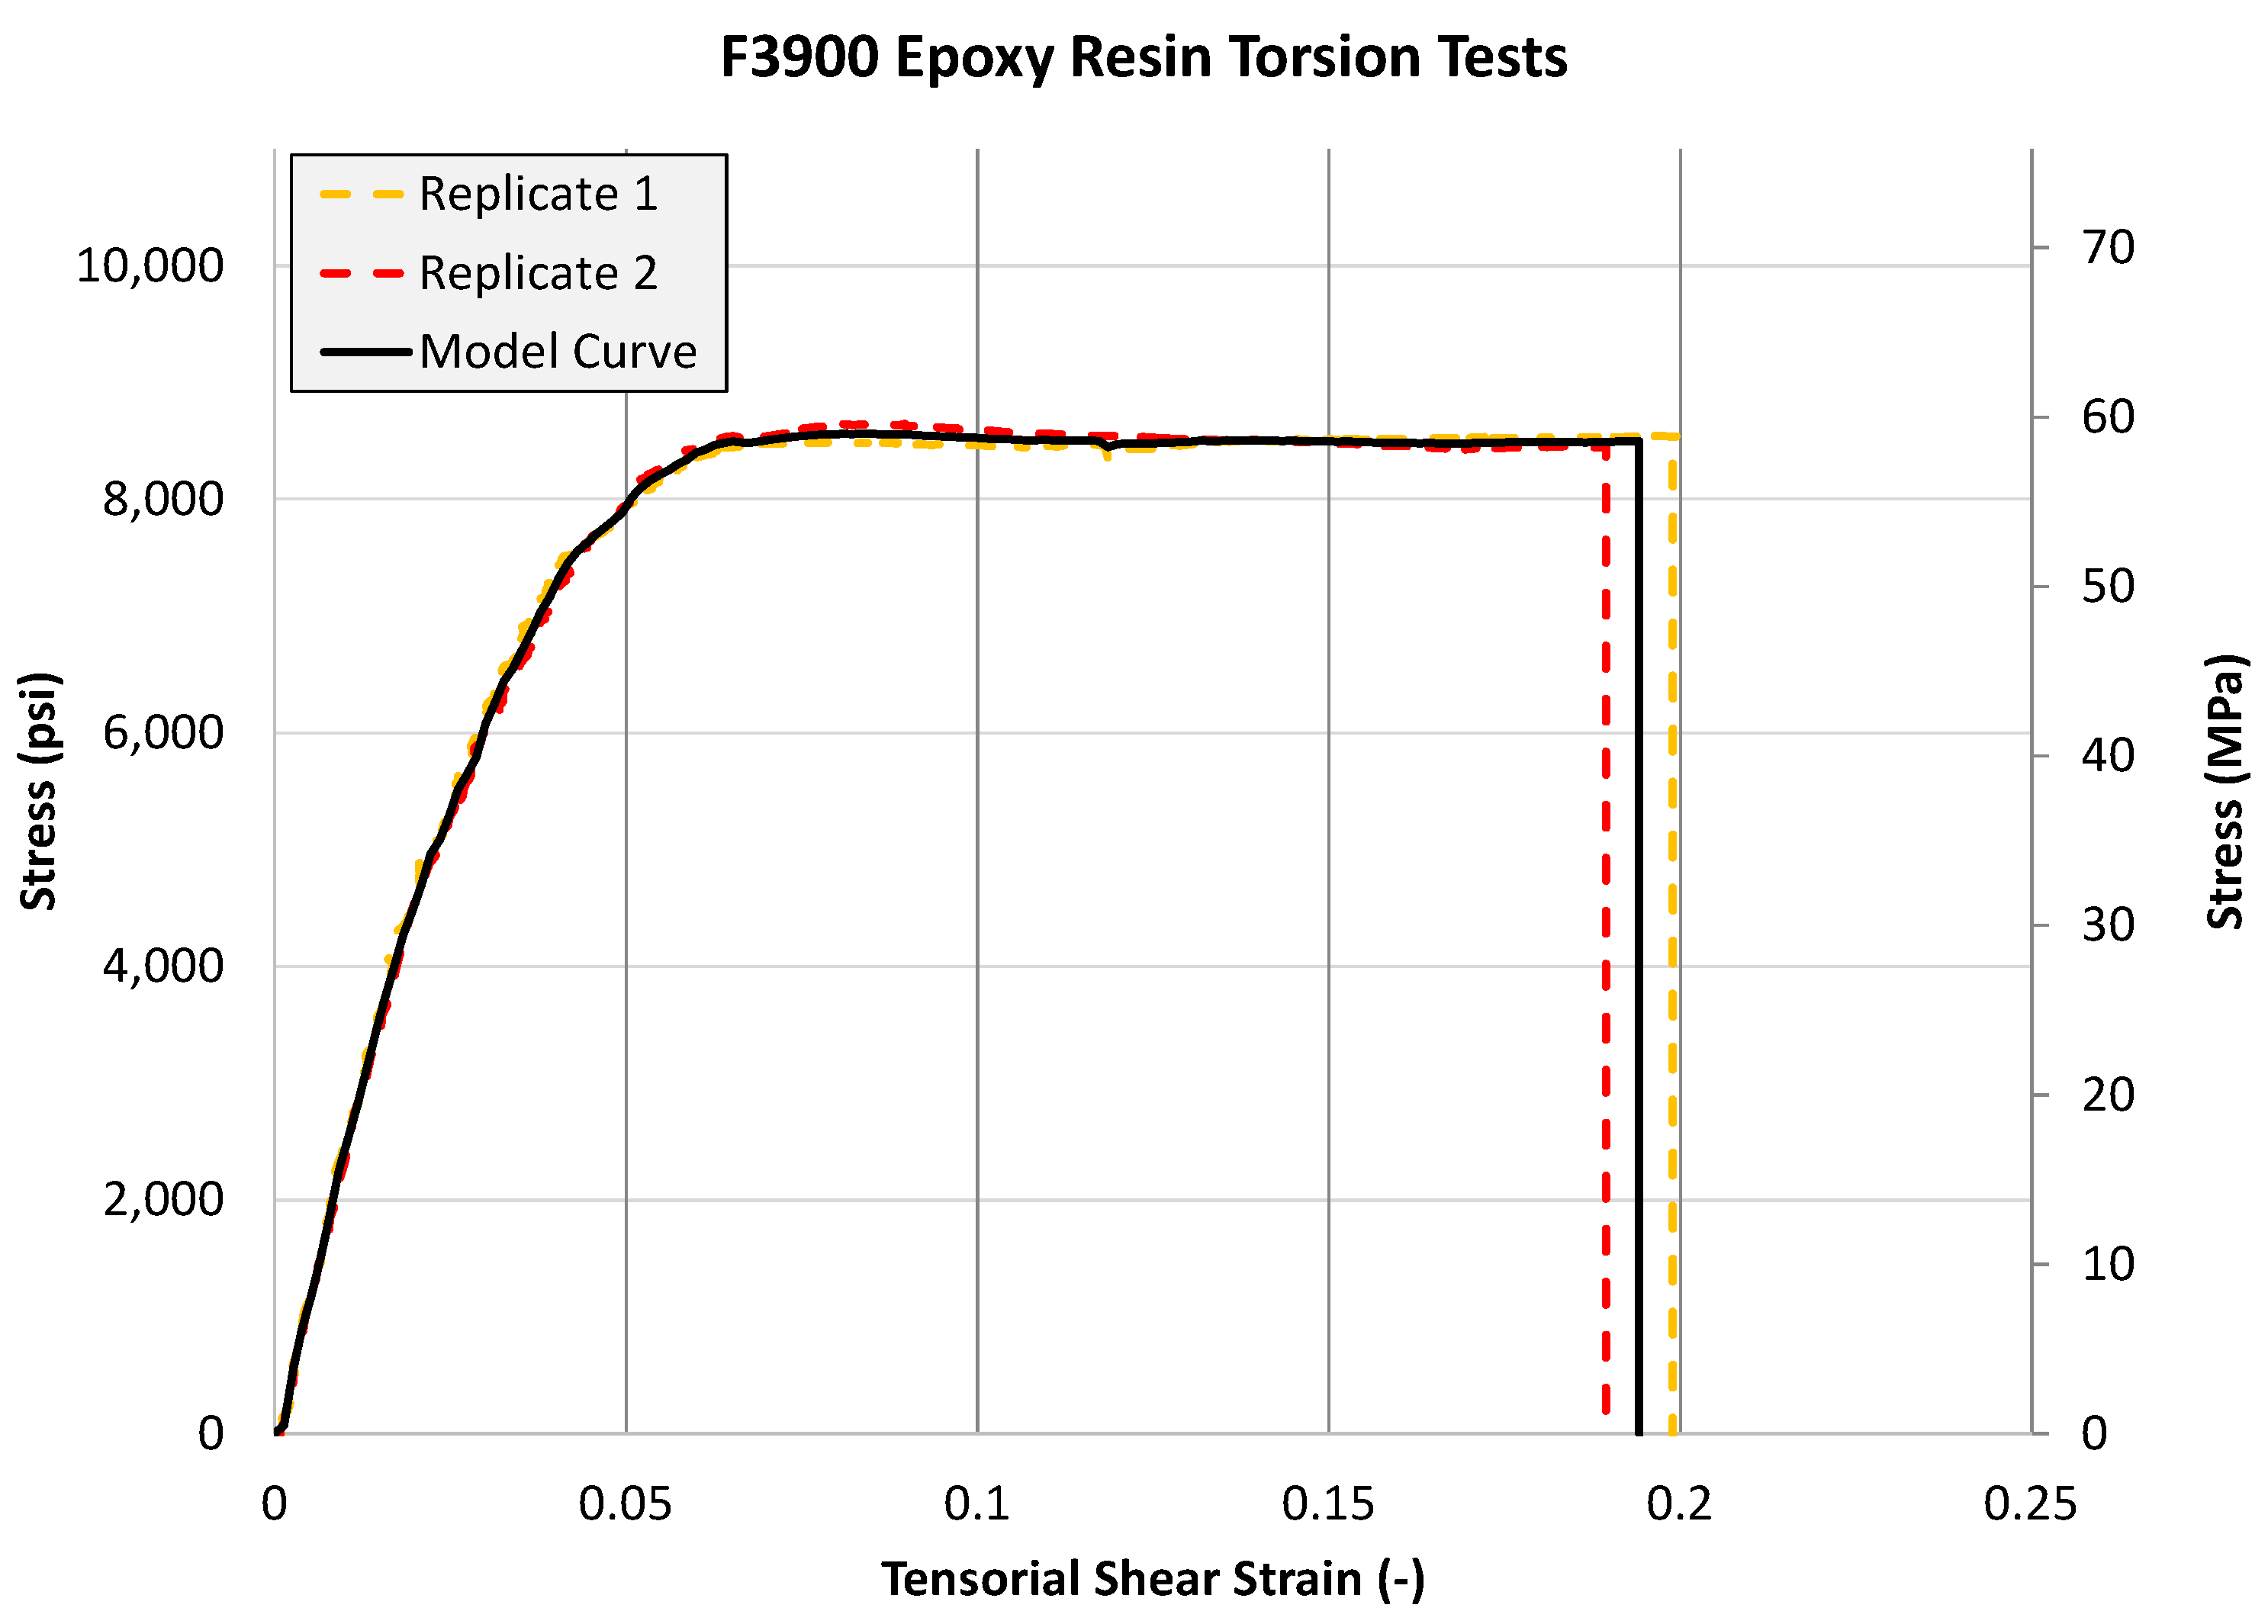
The resulting stress-strain curves from two replicates, as well as the resulting Model Curve, are shown in Figure 12. The stress reported is the average stress of the inner wall and outer wall of the specimen. This technique is used since there is a variation of shear stress in the radial direction between the inner wall and the outer wall of the tubular specimen subjected to torsion. The point where failure initiates within the wall is unknown, and thus, the stress cannot be computed as accurately as desired. The specimen also fails within the tapered gage section, where the wall thickness and specimen radii are uniform.

2.2.4. Remaining Input Data

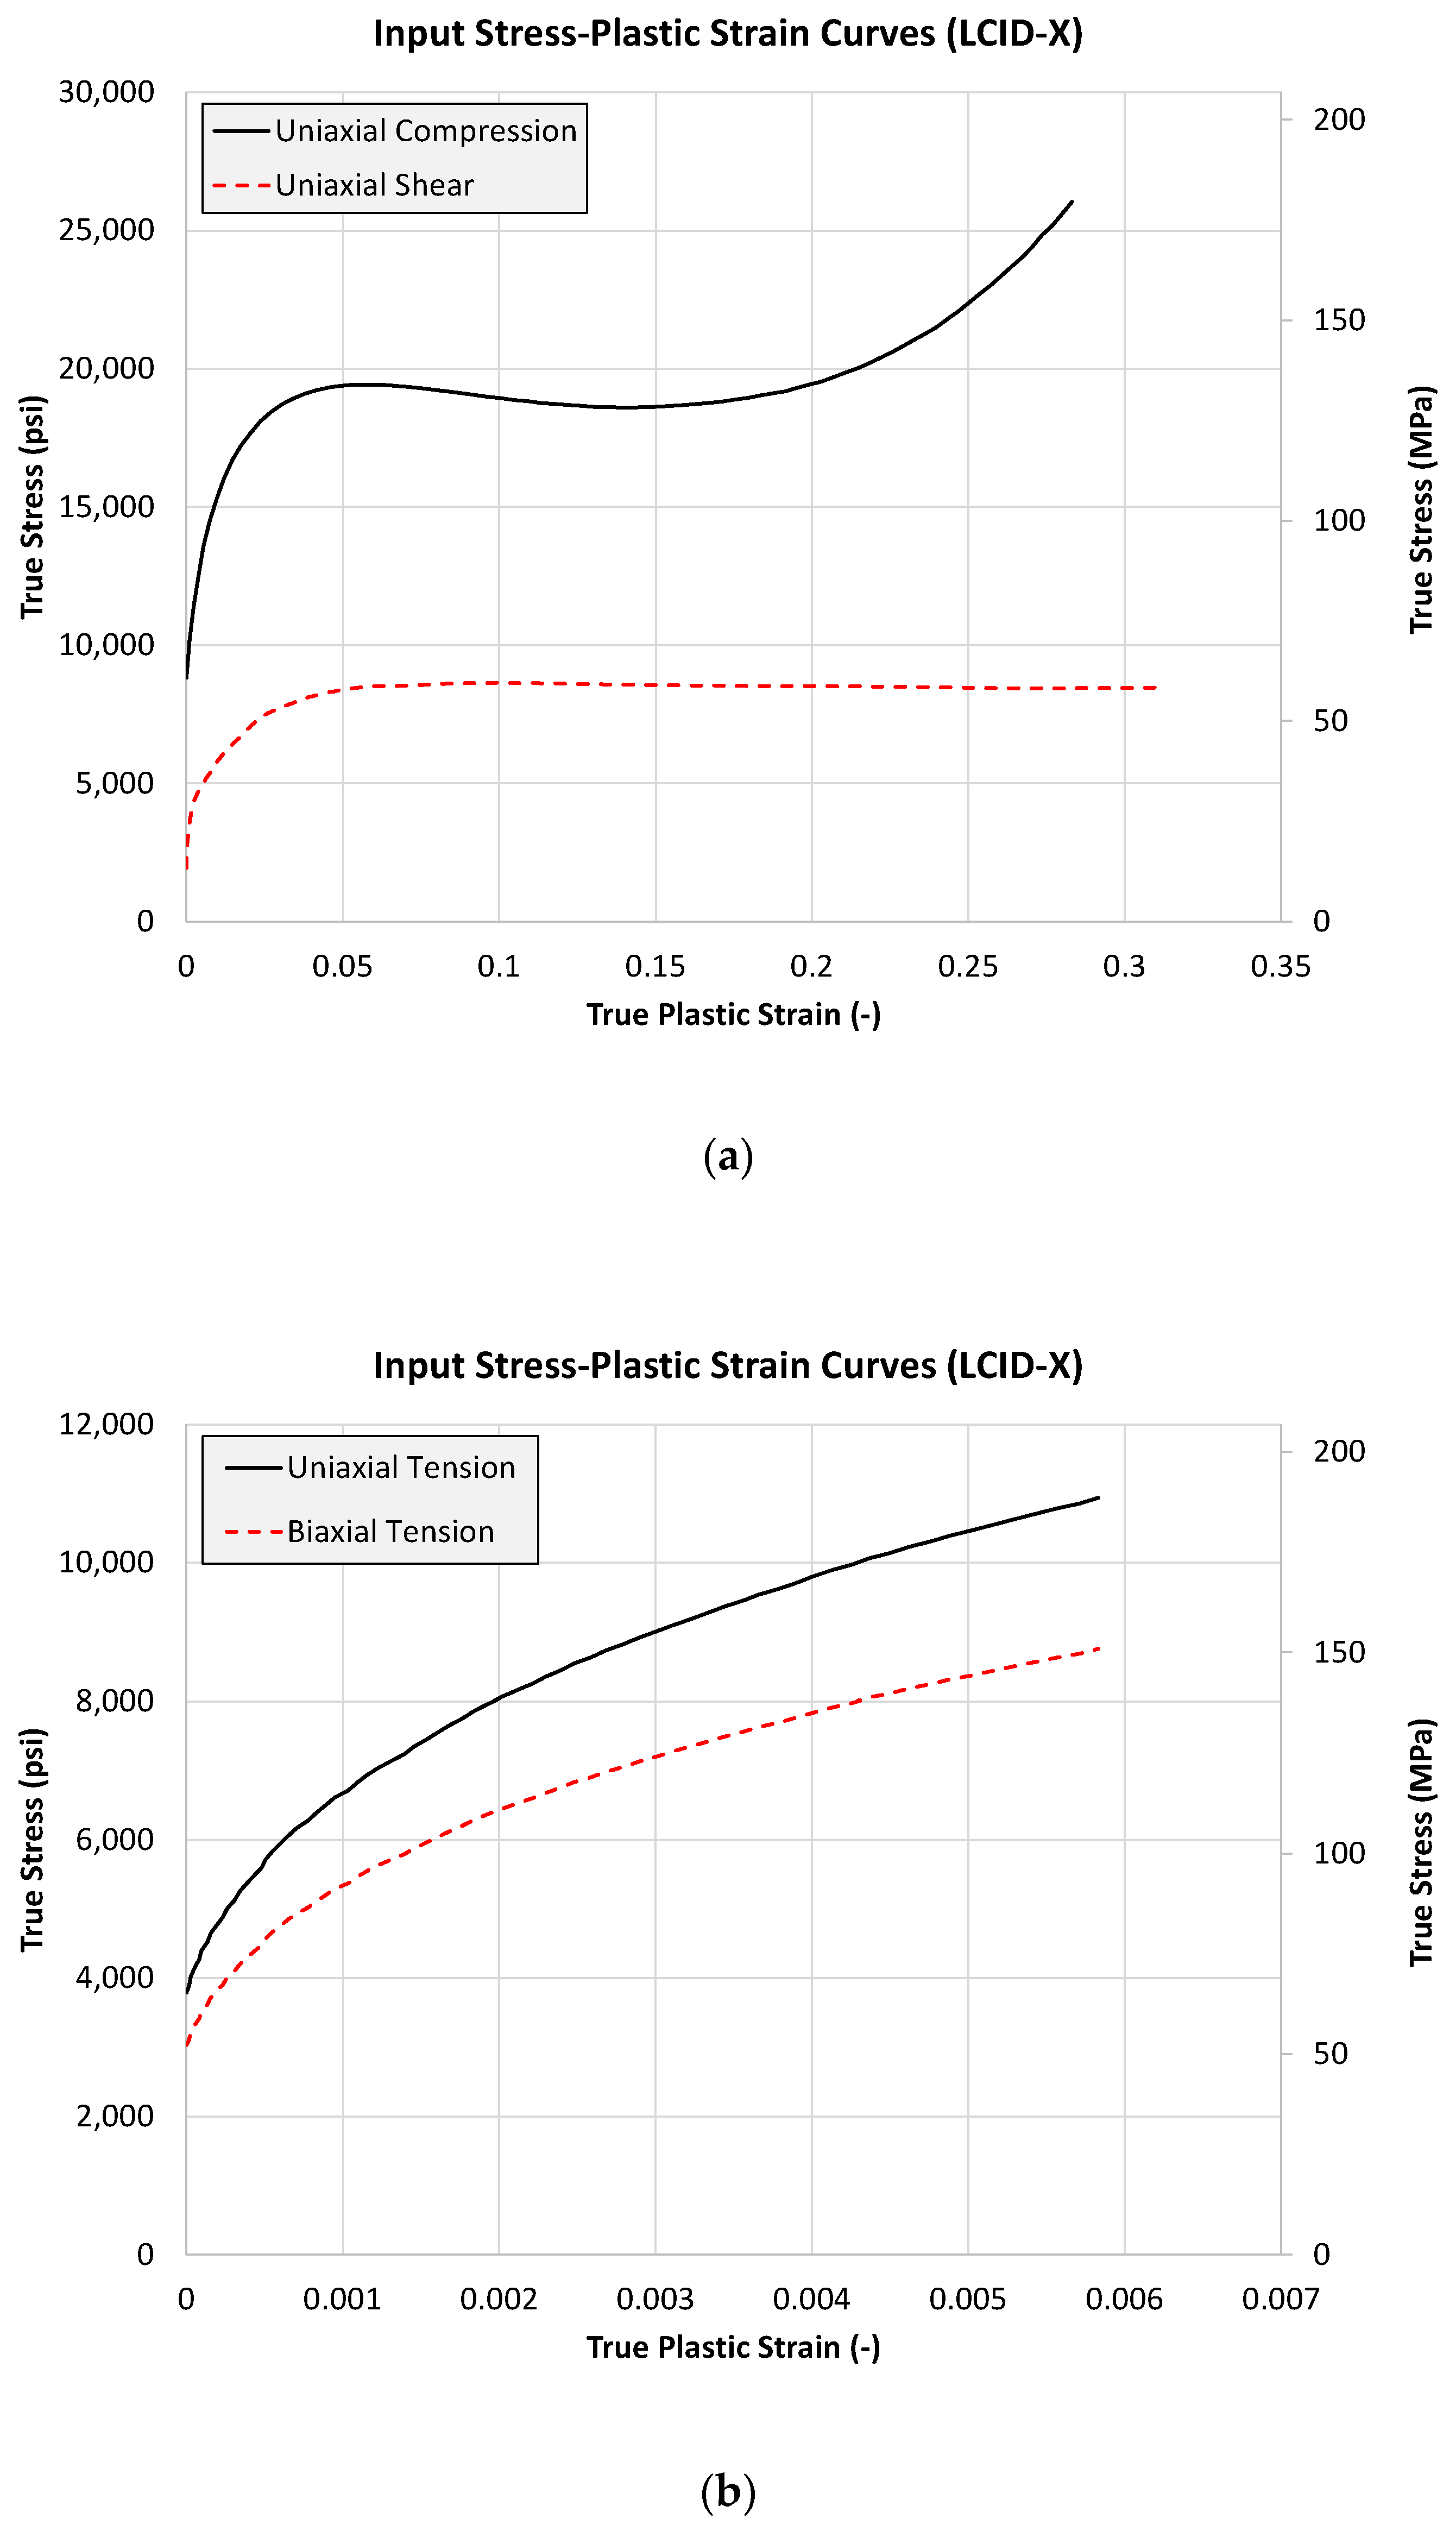
In addition to the stress-plastic strain curves, shown in the Appendix A, used to govern the yield and flow behavior of the material, several point properties are required as input to MAT_187. Table 2 shows a summary of the remaining properties that have been derived directly from the experimental data obtained earlier.

3. Finite Element Modeling of the Unidirectional Composite

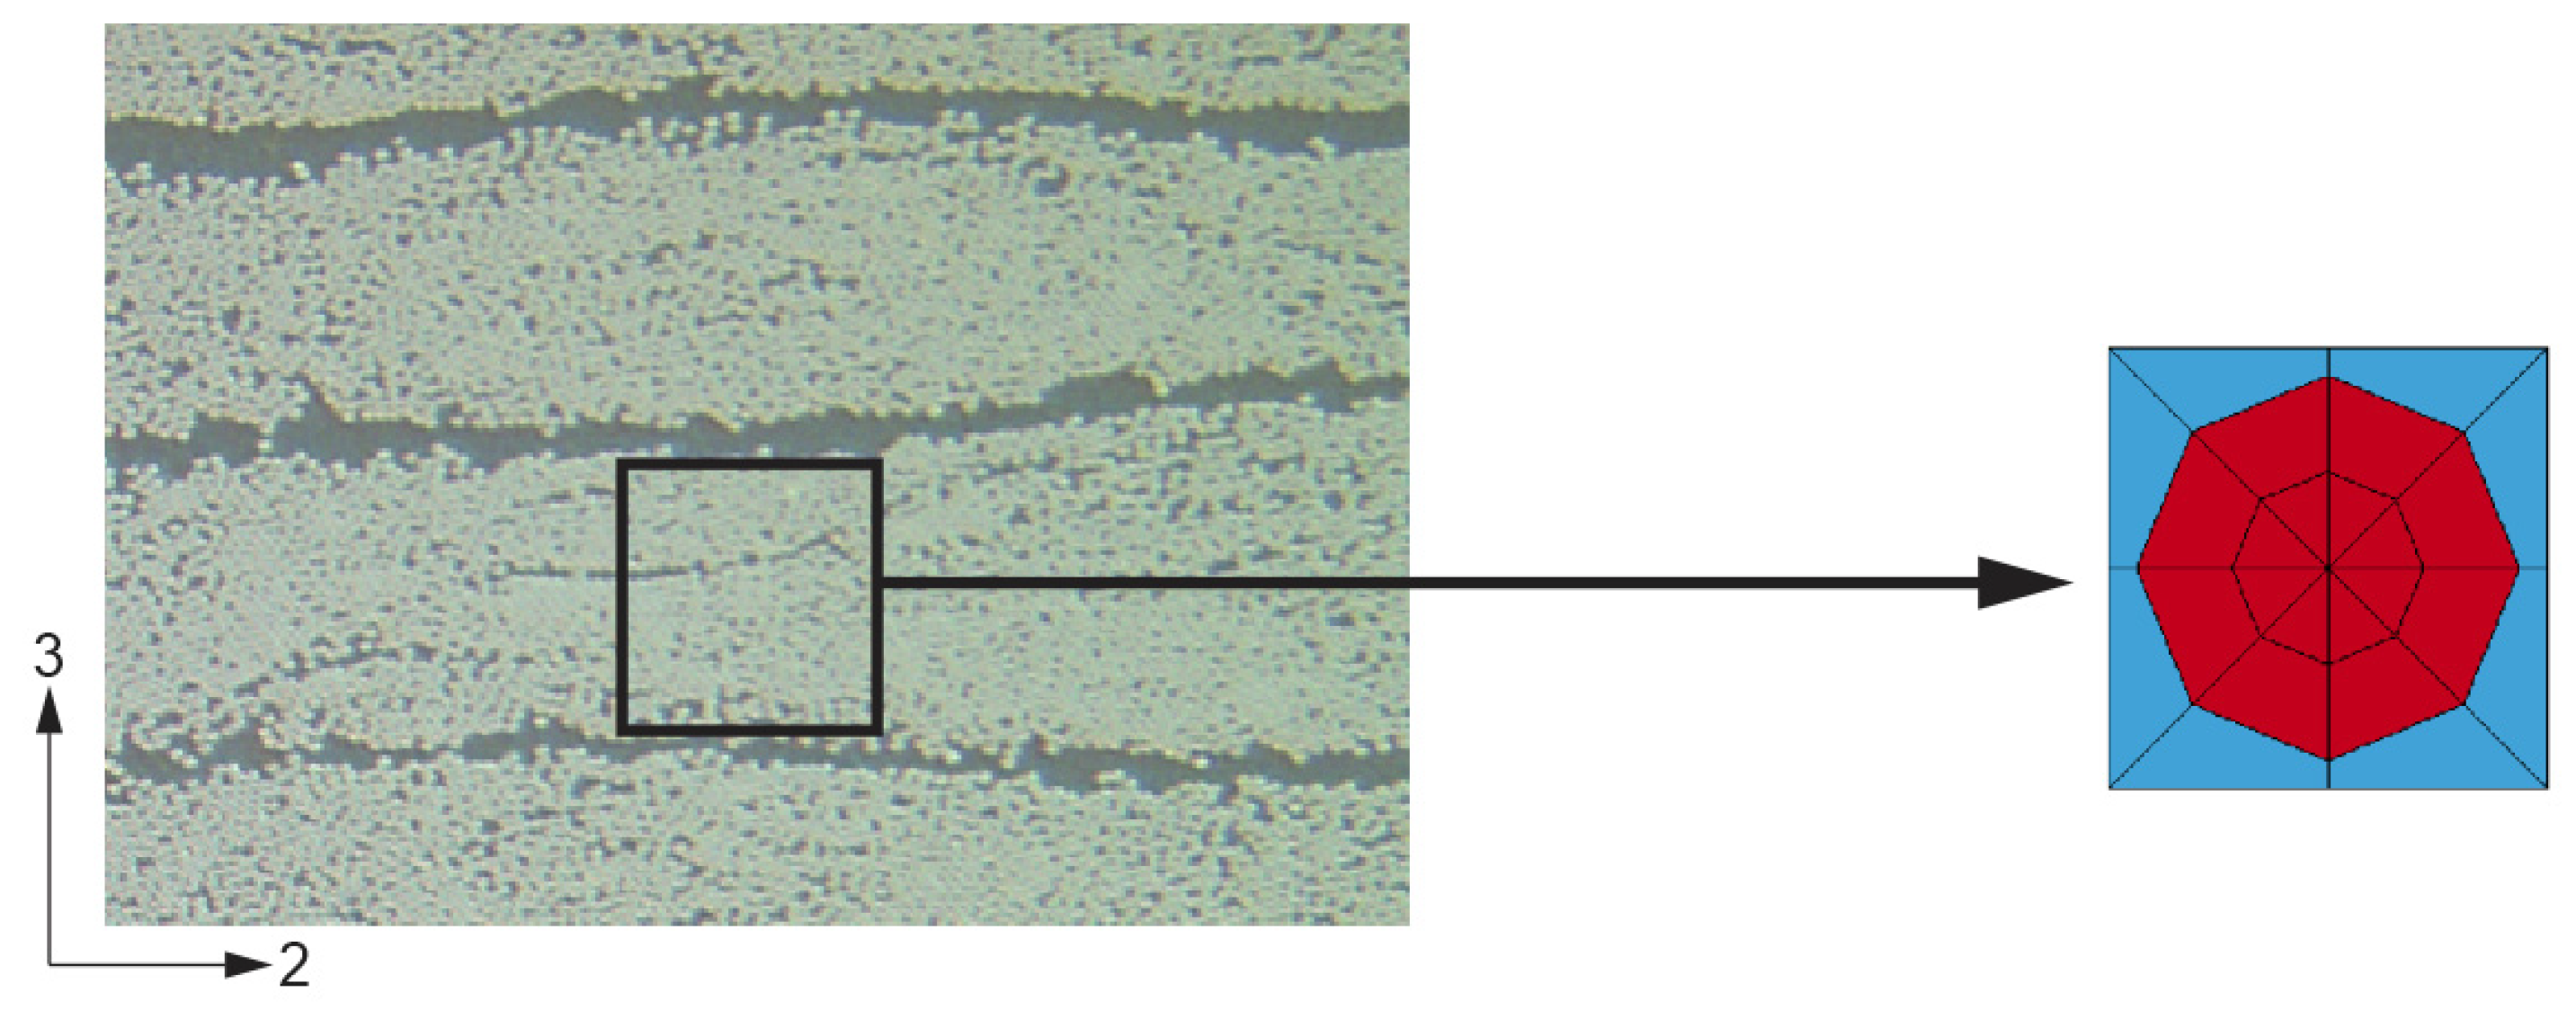
The Virtual Testing Software System (VTSS) developed in our previous research [4,33] is used both to generate the virtual test specimens and to process the finite element results. The software is used to generate specimens to match the experimental geometries used in 1-direction tension and compression, 2-direction tension and compression, and 1–2 plane shear from our earlier work [18] and generates the input file for LS-DYNA analysis. The basic building block is a representative unit cell (RUC). To generate computationally efficient models, the unidirectional composite is assumed to be comprised of an array of packed RUC. The RUC is used to represent a large collection of fiber and matrix zones within the composite that provides a mesoscale equivalent of the constituents. The RUC is meant to represent the behavior of a ply and does not account for resin-rich interlaminar zones. Delamination is not being considered in the current research, and its contribution to the response is inherently captured in the calibrated input parameters Figure 13 shows a typical RUC.
The unit cell is generated by specifying the geometric parameters related to its geometry, as shown in Figure 14a, and the composite fiber volume fraction is used to generate a consistent and accurate model. The virtual test specimen geometry is generated by replicating the unit cell in an array of rows and columns. The number of columns and number of rows are based on the dimensions of the virtual test specimen in 2 and 3 material directions, as shown in Figure 14b.
The fiber elements at the center of the unit cell are modeled using degenerate 8-noded hexahedral elements, while the remaining fiber elements and all matrix elements are modeled using 8-noded hexahedral elements with reduced integration. The specimen geometry generated by VTSS defines a distinct gage section away from the boundaries and is in the vicinity of the center of the virtual test specimen. The gage section is selected to minimize the boundary effects when post-processing the response and to remain consistent with the post-processing methods used in the experiments. The homogenized response of the composite is obtained using a volumetric average of the chosen response variable, e.g., stress and strain, in the fiber and matrix elements in the gage section [4,33].

Virtual Test Models

The virtual test specimens are geometrically equivalent to the experimental specimens, and the dimensions of the virtual test specimens are proportionally equal to the experimental specimen dimensions. The equivalent dimensions of the FE specimen are computed by keeping the proportion of [ 1 : L e n g t h T h i c k n e s s : W i d t h T h i c k n e s s ] consistent between experimental and virtual test specimens. Only the experimental gage section is used to build the virtual test models. Appropriate boundary conditions (BCs) are applied to maintain consistency between the experimental procedure and the virtual test procedure.
A convergence study was performed with each finite element model to refine the parameters used to construct the RUC. For example, with the 1-direction tension test, three models labeled Coarse Model (313,344 elements, 277,365 nodes), Medium Model (417,792 elements, 369,369 nodes), and Fine Model (625,152 elements, 552,024 nodes) were used to establish converging solutions. Only the results from the fine model are provided in this paper for all tests. The final parameters used are shown in Table 3 and are in reference to the terms provided in our previous work [4,33] and Figure 14.
An explicit time step integration scheme with mass scaling is used with the loading adjusted to keep the kinetic energy as small as possible in order to replicate a quasi-static test. Explicit analysis was used since some regions of the experimental data for the F3900 matrix exhibited negative material tangents, a potential cause for concern with an implicit solver. Several quantitative and qualitative metrics are used to compare the numerical predictions with the experimental results: the ability to predict the nonlinear stress-strain response, the ability to predict the stress and strain at failure, and the predicted failure pattern.

4. Virtual Test Results

In this section, the verification and validation of the developed framework are shown, starting with the calibration of the matrix material model and the fiber material model. This is followed by the validation tests of the composite using the material models of the matrix and the fiber.

4.1. Calibration and Verification of Matrix Data Using T800-F3900 Composite Data

The initial step in developing the modeling framework is to simulate the response of select experiments to calibrate a subset of the required material model input data. The material model parameters are calibrated by matching the virtual test and experimental responses. The following uniaxial stress tests have been chosen to perform the calibration: 1-direction tension, 1-direction compression, 2-direction tension, 2-direction compression, and 2–1 plane shear tests. The 1–2 plane shear test, where the fibers are rotated 90°, is not simulated for two reasons. First, the deformation mechanisms are largely dominated by the geometric nonlinearities that develop due to the excessive deformation of the specimen. Second, the specimen is not in a state of pure shear after the initial (small) deformations. Third, the failure is largely dictated by fiber/matrix debonding, which is not captured in the current modeling strategy. The nomenclature is in reference to the material axes shown in Figure 13 and Figure 14. All experimental curves shown are the average response of multiple replicates of the given physical experiment. The experimental results come from our previous work [18]. Table 4 shows the material model parameters that have been numerically calibrated.
The matrix properties in Table 4 were calibrated by matching the virtual testing results from the 2-direction tension, 2-direction compression, and 2-1 plane shear tests with the corresponding experimental results as these tests are largely dominated by the properties of the polymeric matrix. Using similar reasoning, the fiber properties in Table 4 were calibrated by matching the virtual testing results from the 1-direction tension and 1-direction compression tests with the corresponding experimental results.
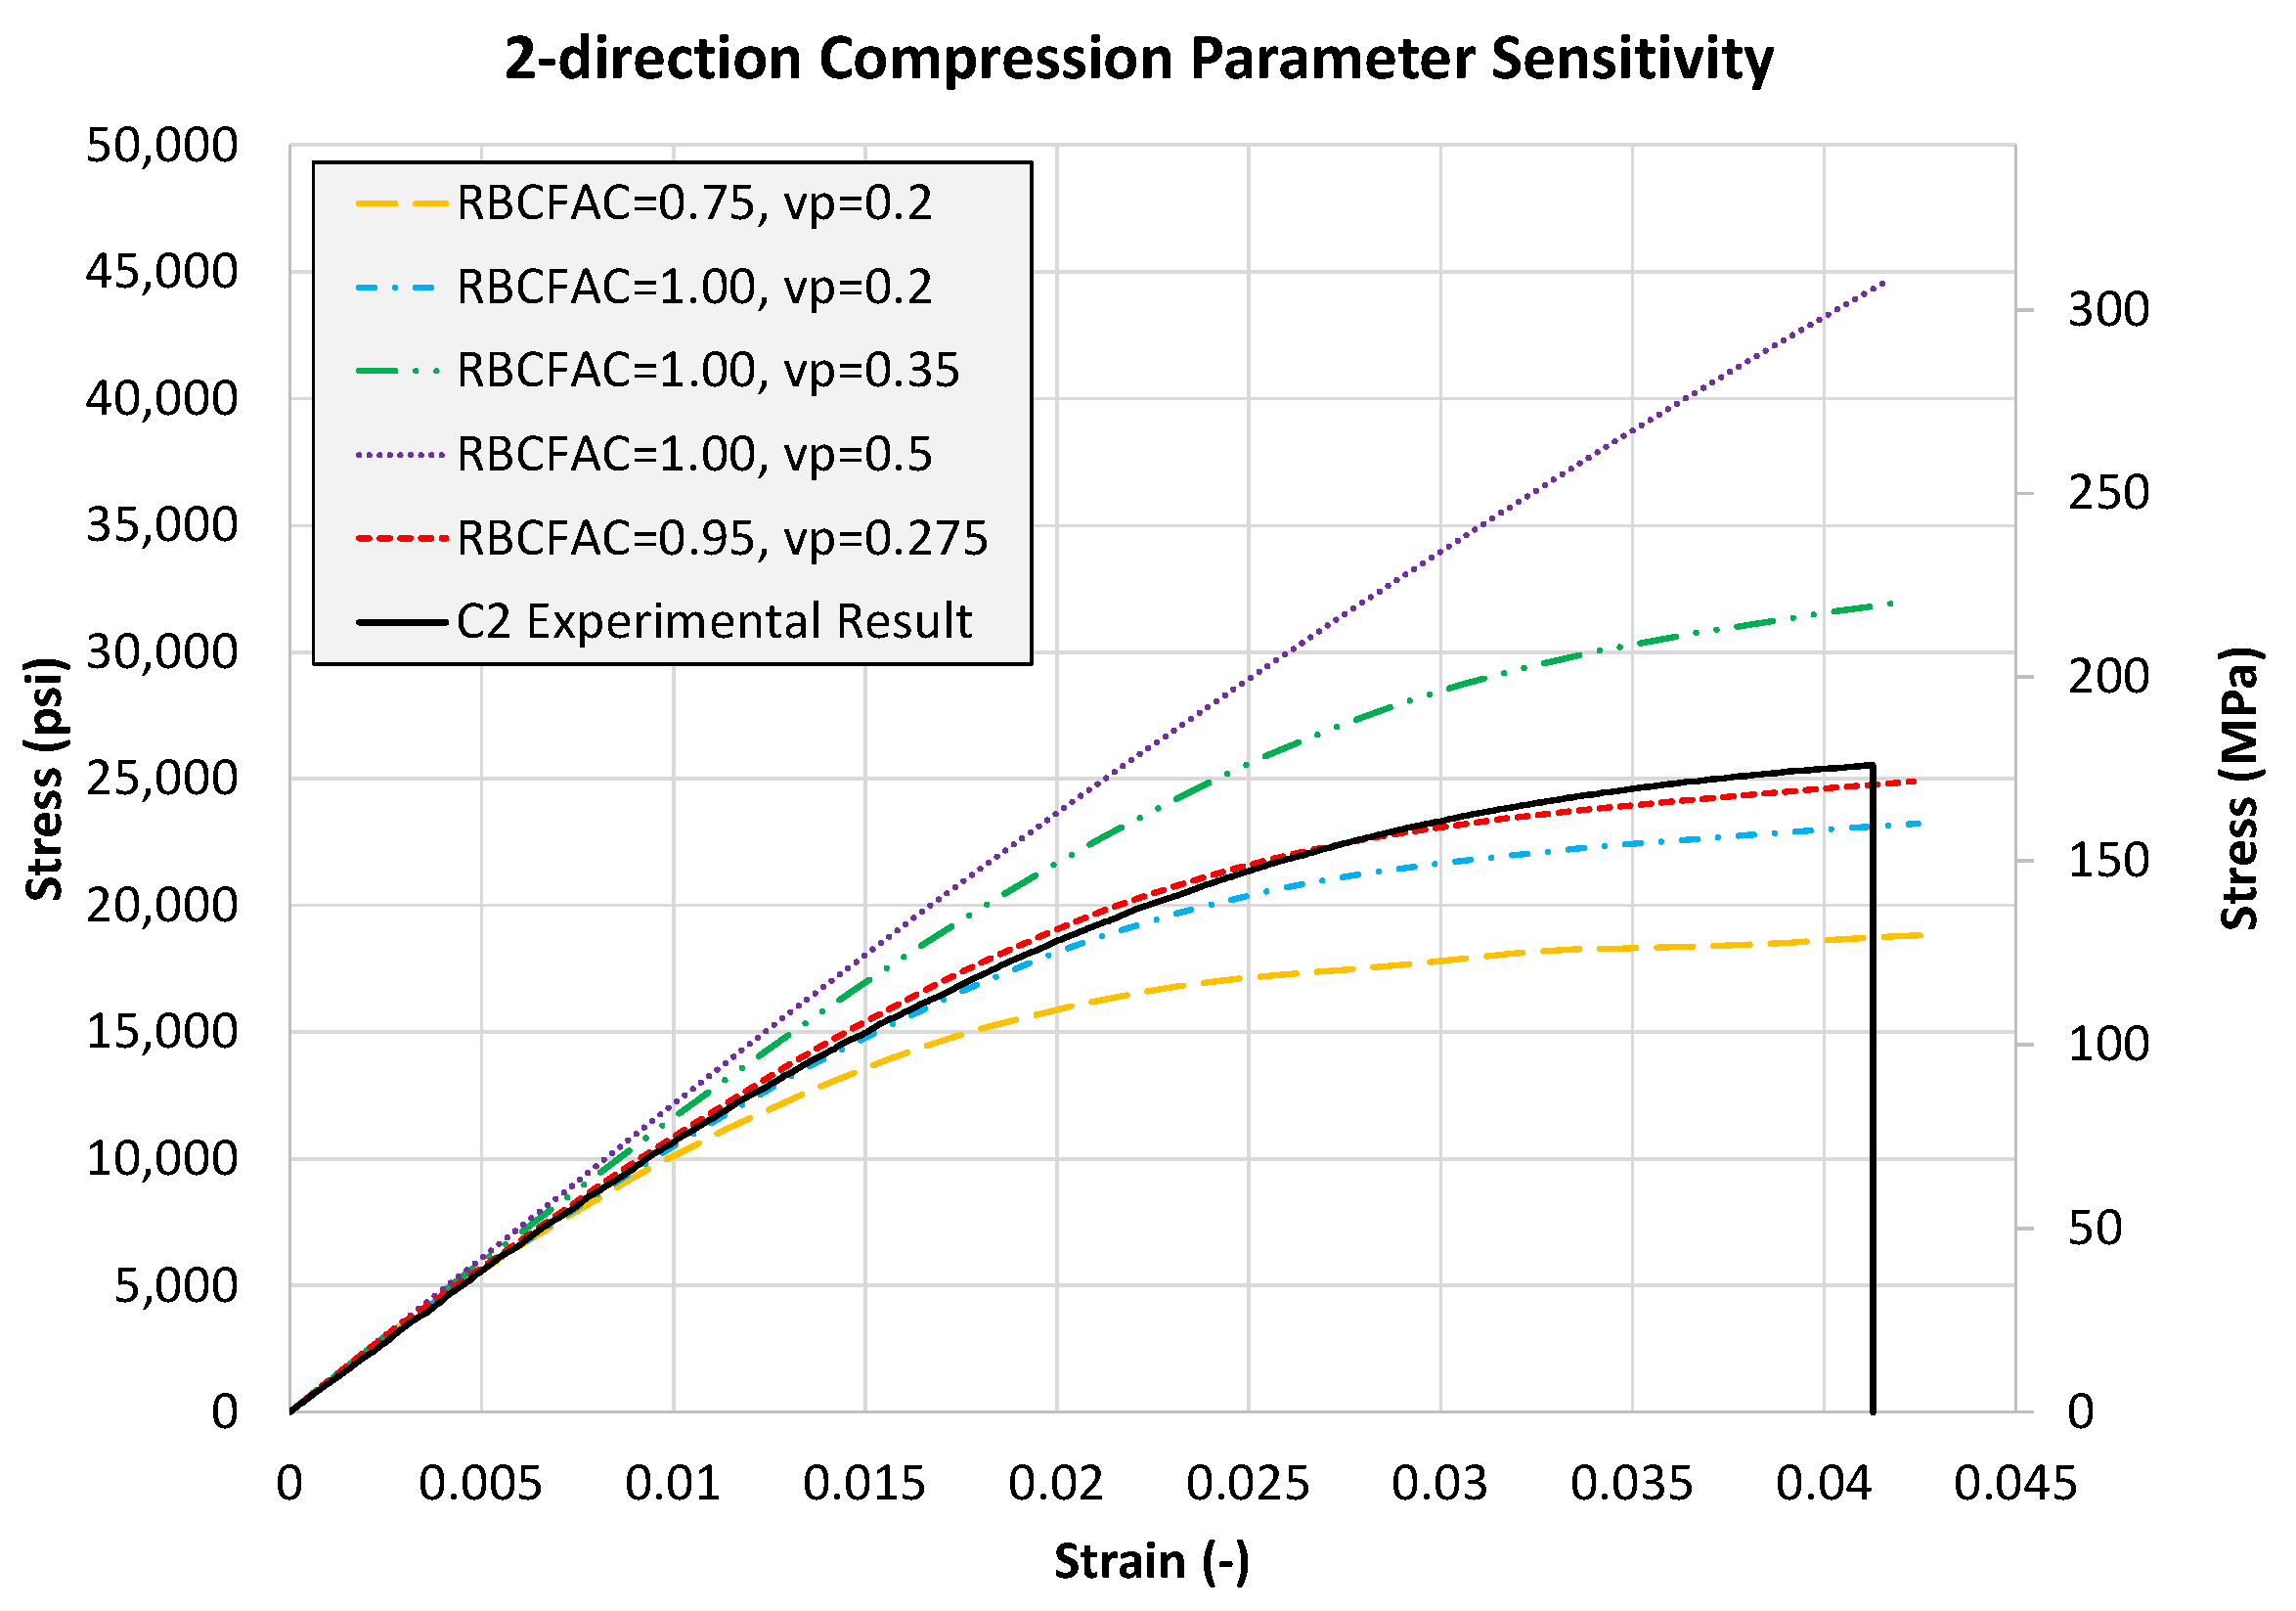
RBCFAC, NUEP, and LCID-B largely controlled the nonlinear stress-strain response of the composite material during virtual tests. The stress in the input curve for LCID-B was set to 80% of the uniaxial tension curve (LCID-T) based on a recommendation from one of the material model developers. The value ensures that the tabulated yield surface remains convex and closed. The result is a scaled version of the data presented in Figure 5. Various combinations of NUEP and RBCFAC were tested until the best match with the experimental data was achieved between each of the three tests mentioned. The value of NUEP is assumed to be a single constant value in this research. However, the value may vary under different loading conditions meaning it is not necessarily a material property and is challenging to obtain experimentally. MAT_187 has provisions to define NUEP as a function of triaxiality, and this functionality may be exercised in future work. LS-OPT [17] may have been used to make this process more efficient if VTSS was made to serve as an intermediary between the LS-DYNA output and the LS-OPT optimizer. In the future, this may be implemented to streamline any calibration process using VTSS. The 2-direction compression test was most sensitive to changes in these parameters. The final values of RBCFAC and NUEP are 0.95 and 0.275, respectively. Figure 15 shows a subset of the results of the calibration process using the 2-direction compression test as an example.
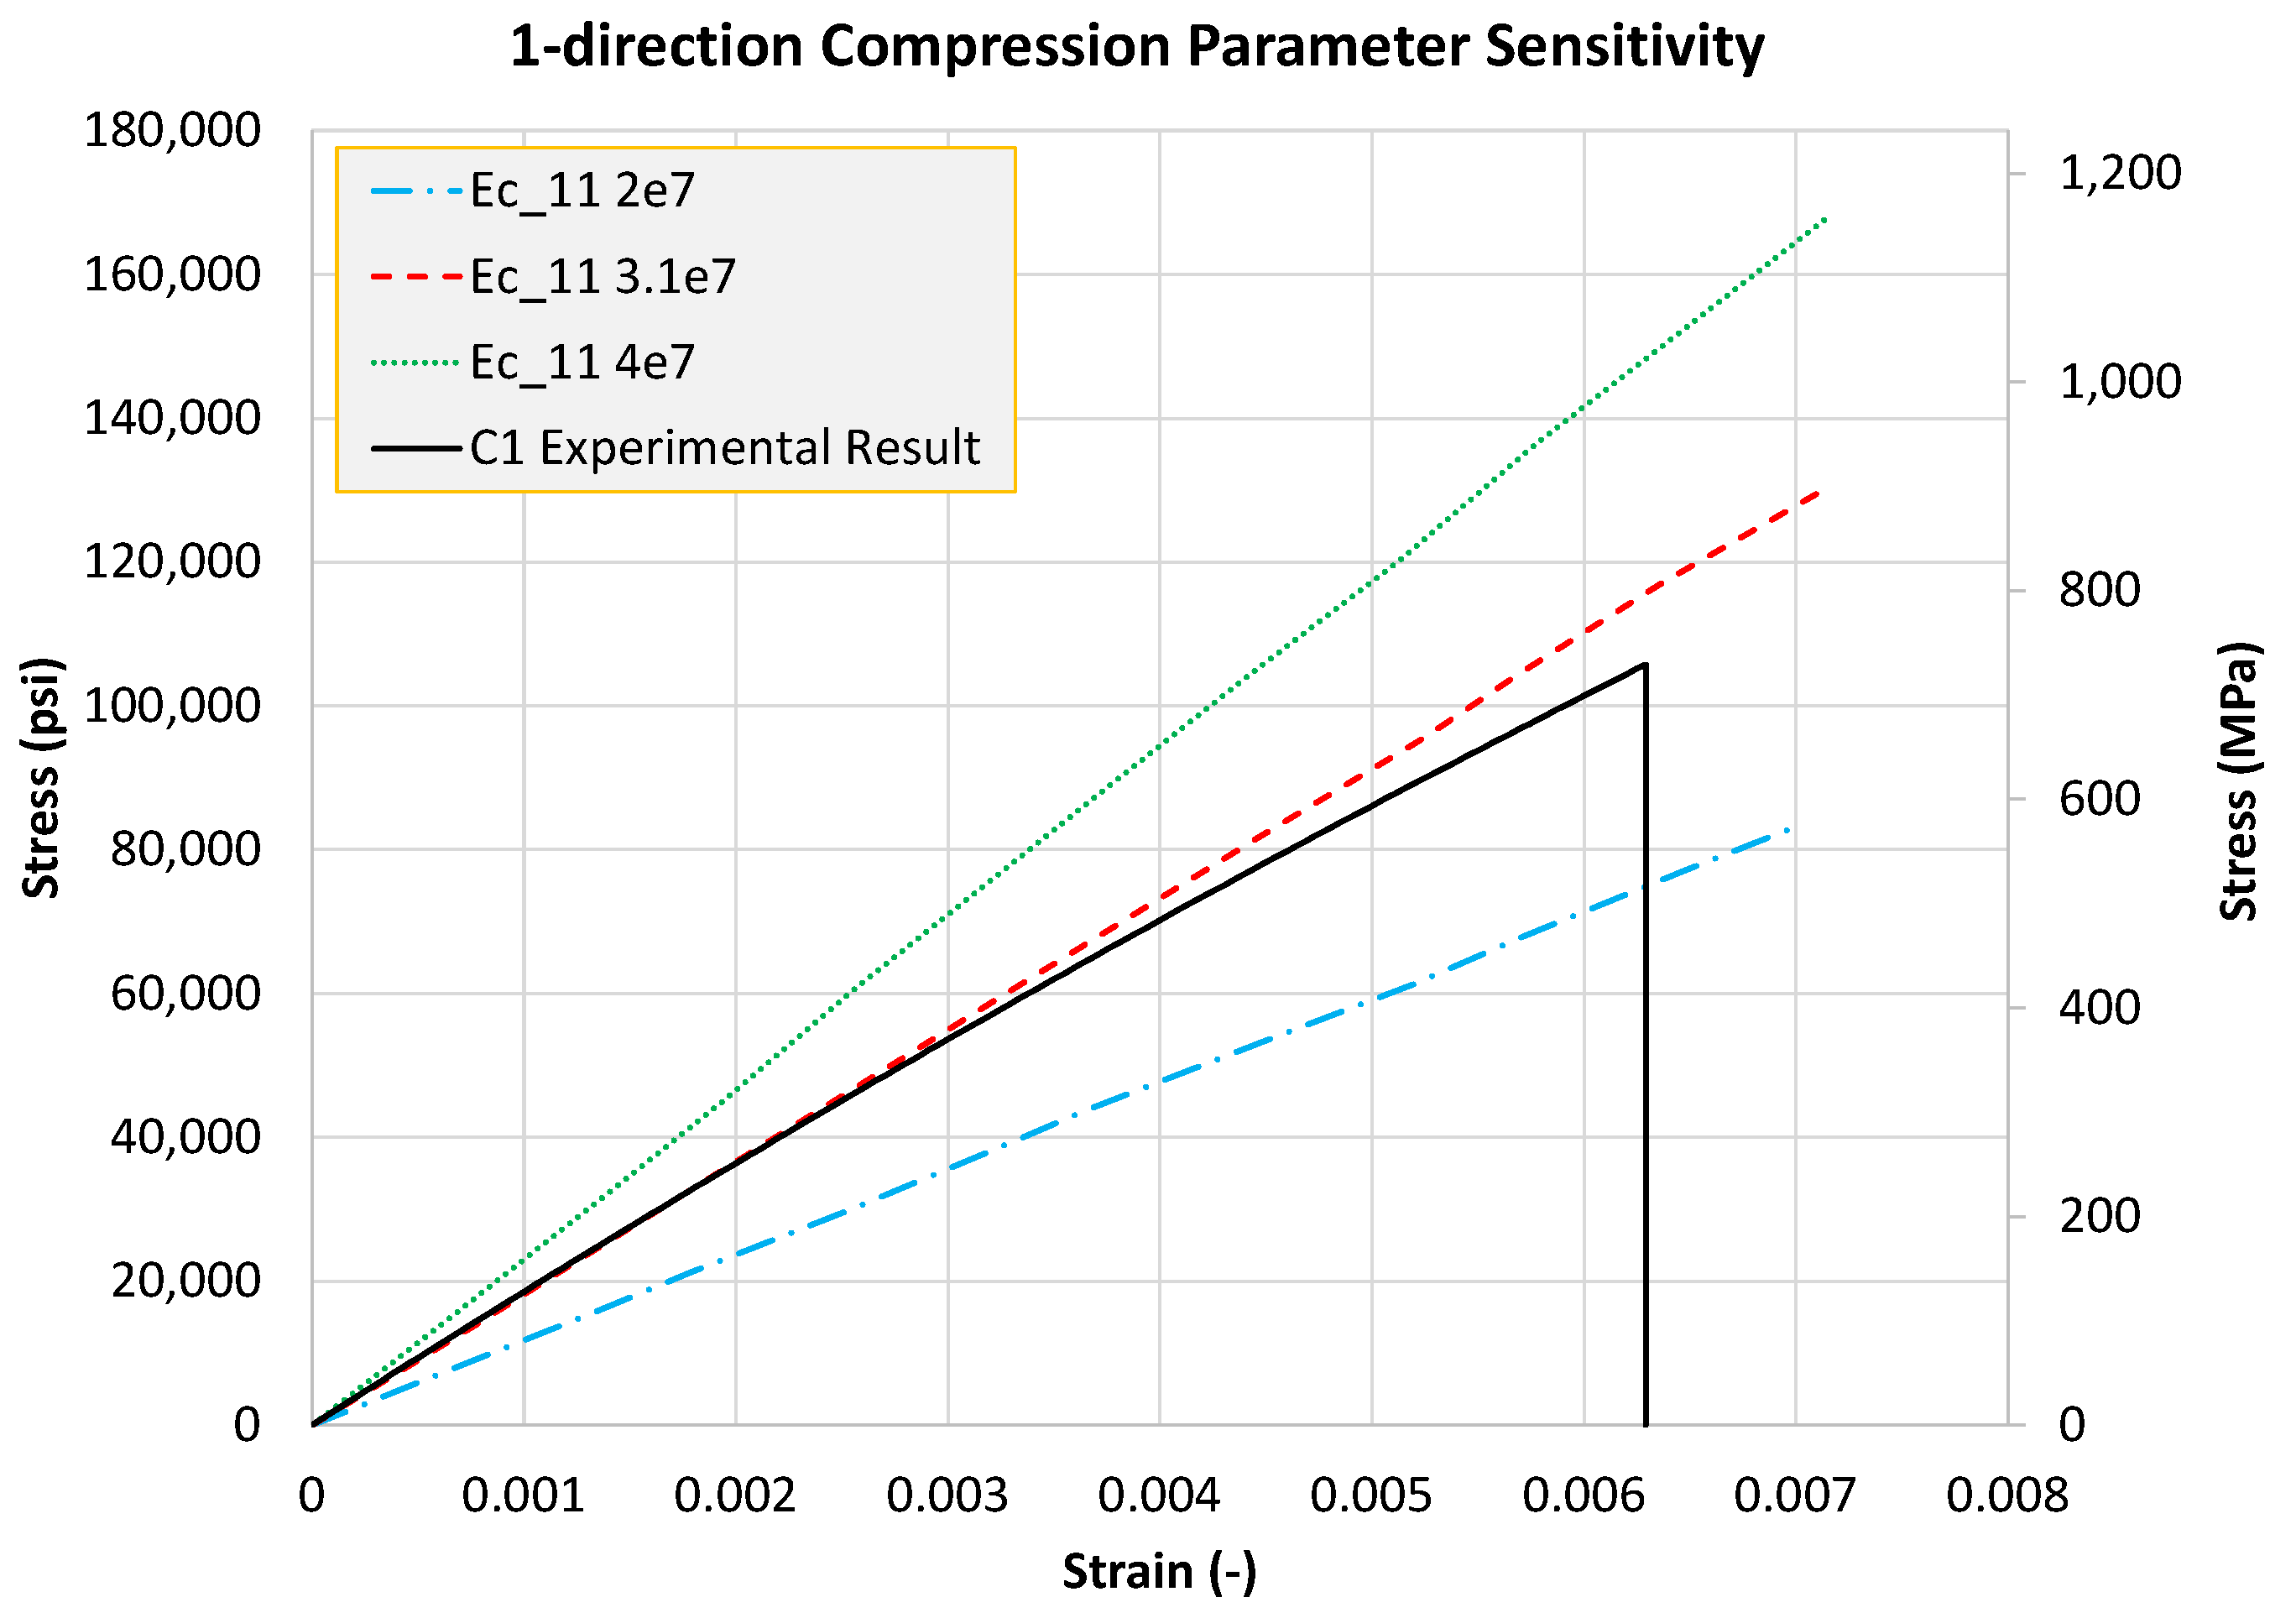
Initially, the longitudinal compression modulus ( E 11 C ) of the T800S fiber is assumed to be identical to the longitudinal tension modulus ( E 11 T ) , shown in Table 1. However, when using the assumed value, the response obtained from the 1-direction compression virtual test specimen is far stiffer than the experimental response. The in situ longitudinal compression modulus of the reinforcing fiber has been experimentally shown to be different from the longitudinal tension modulus [33]. MAT_213 has provisions for handling tension/compression asymmetry in the material response. The best match between virtual testing and the experimental data is obtained with a longitudinal compression modulus of 31 (10)6 psi (213.7 GPa). This value is approximately 78% of the tensile modulus. Figure 16 shows the results of the calibration study.
The onset of failure data provided as input to MAT_187 is in the form of effective plastic strain, ε ¯ p f , as a function of triaxiality, T = p σ v m . The curve was calibrated using the derived experimental data as a starting point. Failure at triaxialities beyond uniaxial tension, compression, and shear was required to properly define the matrix failure as the elements did not remain in a uniaxial state of stress during virtual testing of the composite. The value of EPFAIL was set to a value of 0.0065, corresponding to matrix failure under uniaxial tension. The strains at the remaining triaxialities were scaled up or down from EPFAIL with the scaling factor denoted as f ( p σ v m ) . Table 5 shows the final calibrated values used as input for MAT_187.

4.2. Calibration and Verification of Fiber Data

Finally, the longitudinal fiber failure strains under uniaxial tension and compression, ( ε 11 f ) T and ( ε 11 f ) T respectively, were calibrated for use with a principal material direction strain criterion within MAT_213. The final values are 0.0156 under tension and 0.0065 under compression. These values are taken directly from the experimental results of the 0-degree tension and compression tests of the T800/F3900 composite laminate, respectively. Since failure in these loading modes is nearly completely dominated by the linear elastic behavior of the carbon fiber, no additional calibration was performed. The final values of all (fiber and matrix) calibrated material model parameters are used to perform the final simulations presented in the following sections.

4.3. Validation of the Material Models

4.3.1. 1-Direction Tension Test

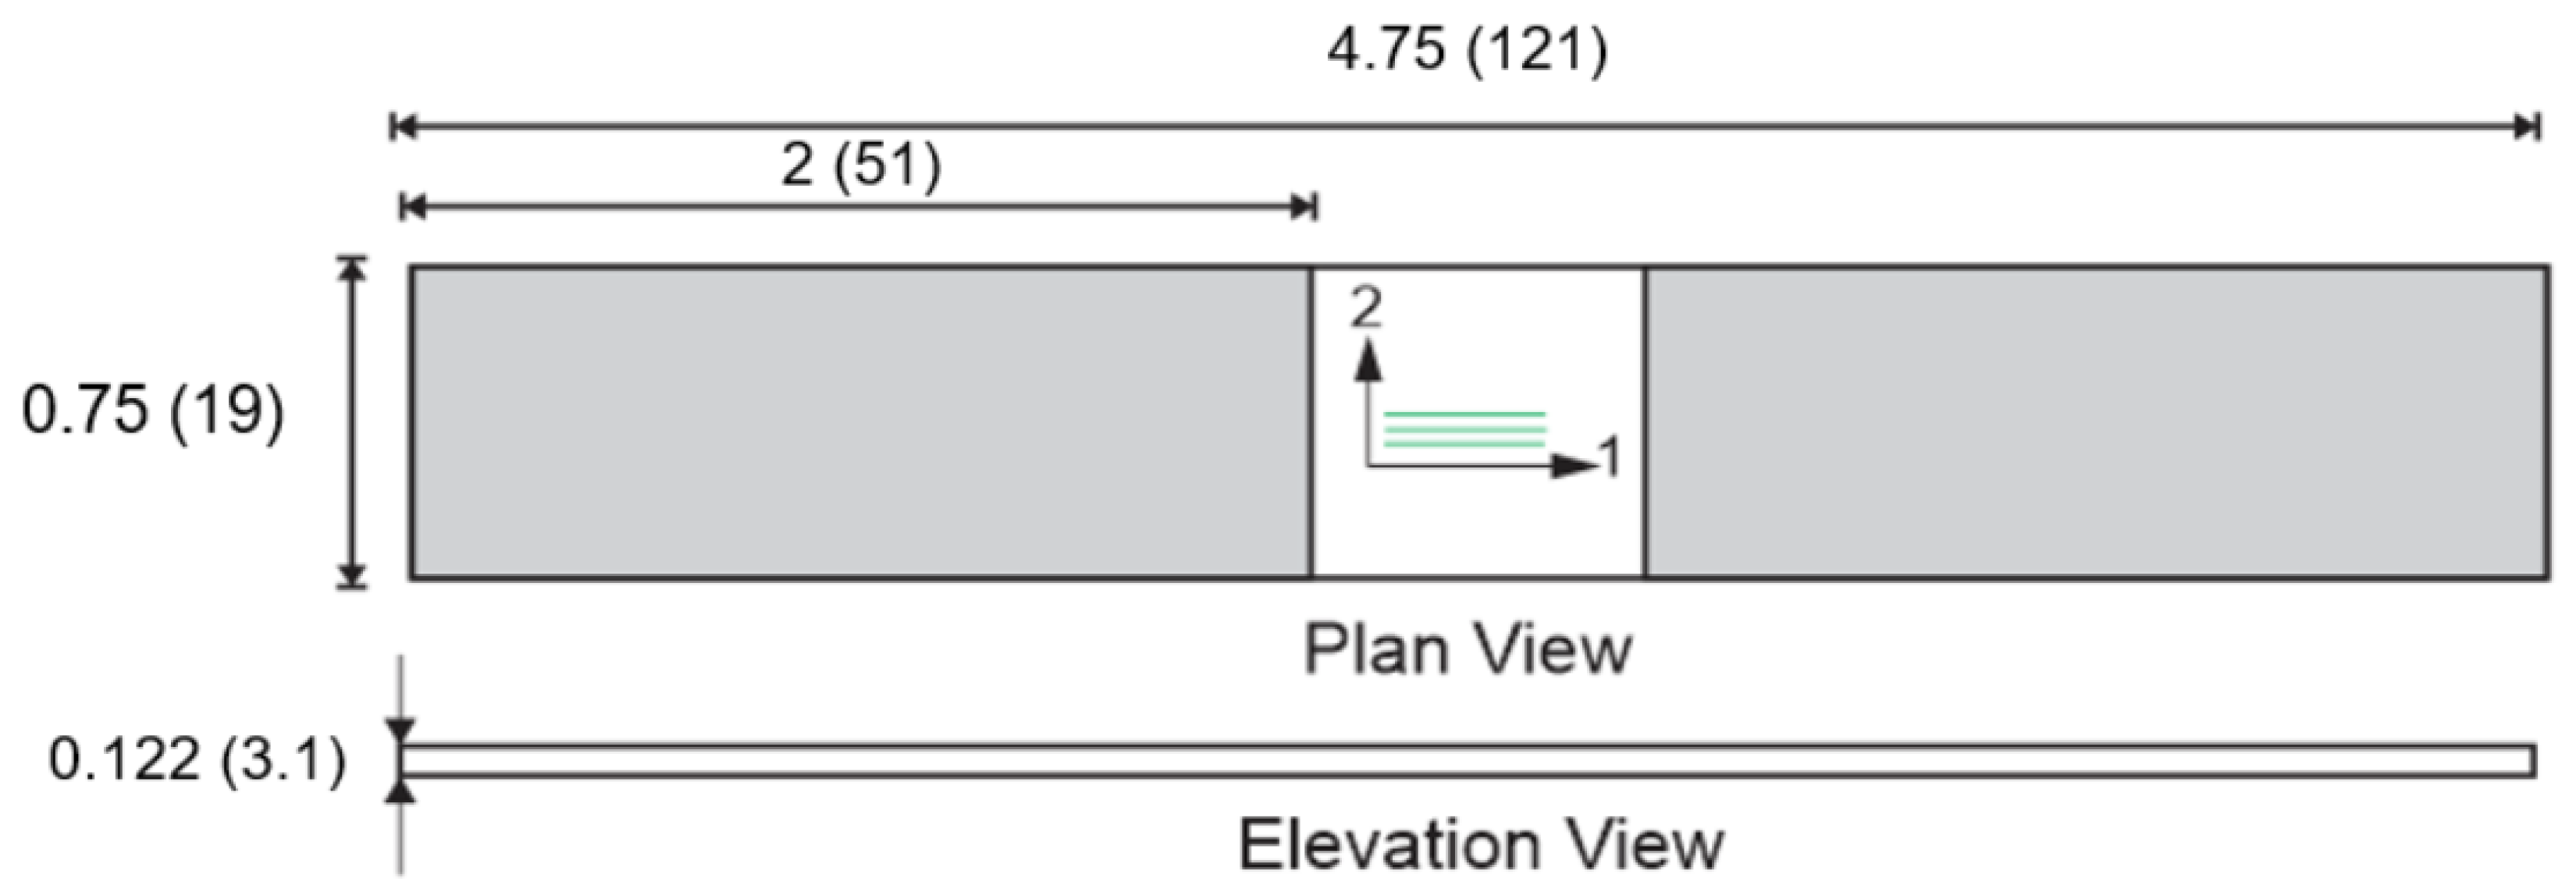
Experimental and Virtual Test Models: The experimental specimen is shown in Figure 17, with the shaded region representing the area where G10 fiberglass tabs are used. The experimental specimen used a through-thickness tapered geometry to promote failure in the gage section.
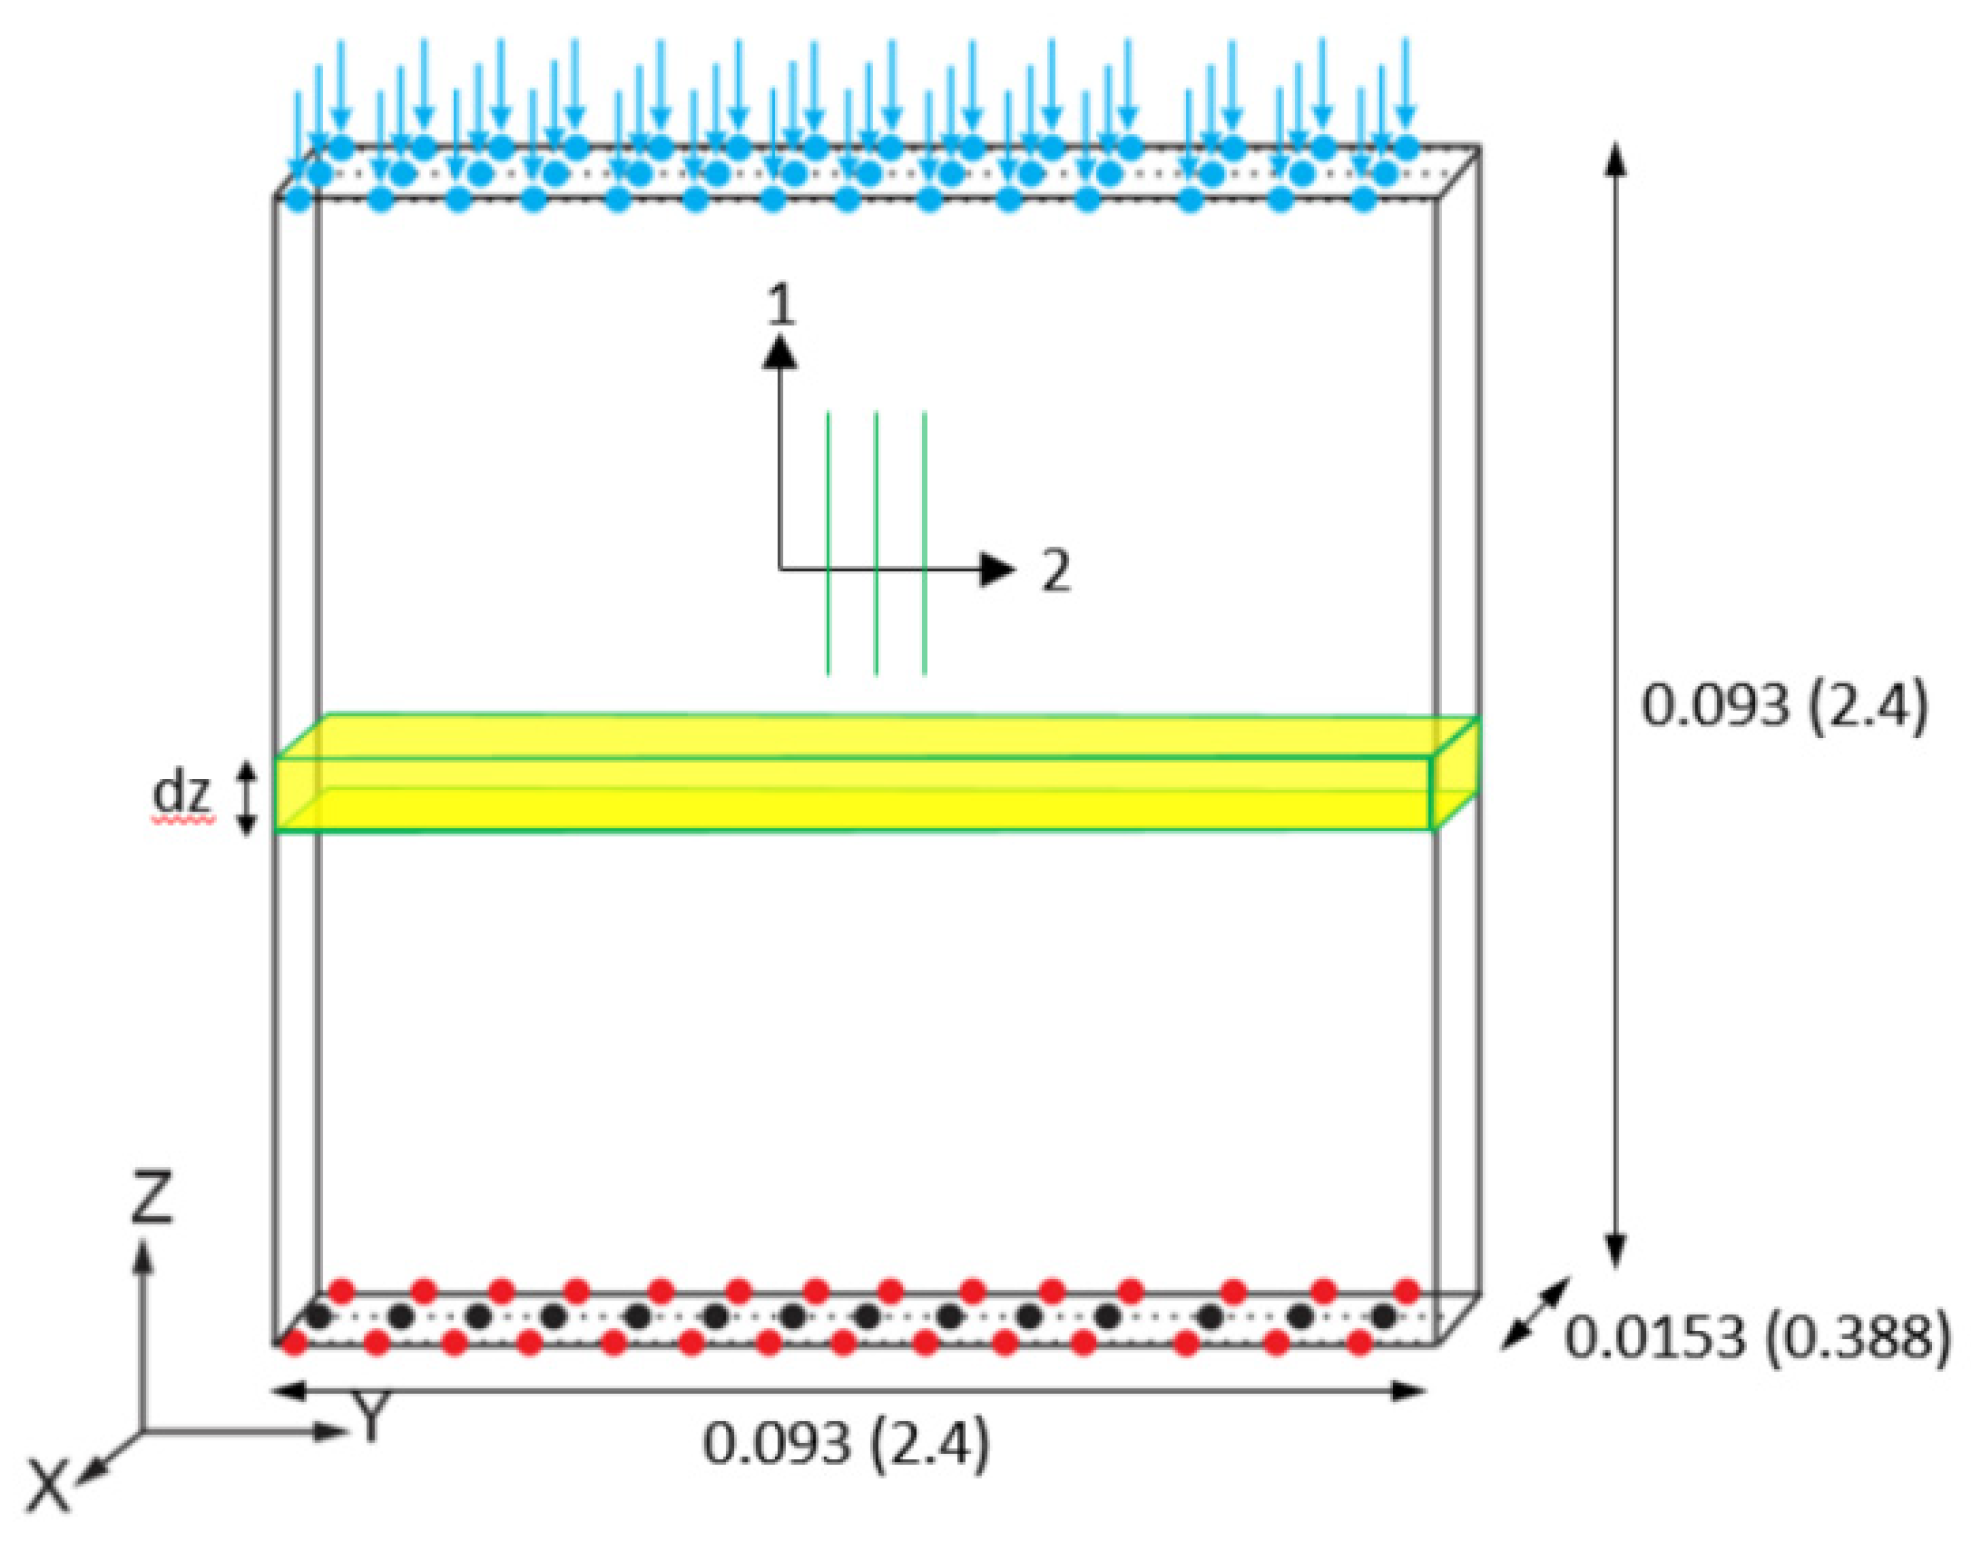
Figure 18 shows the geometrically equivalent virtual test specimen modeling only the gage section of the experimental specimen. The black-colored nodes in Figure 18 are restrained in the X, Y, and Z directions. The red-colored nodes are restrained in the Z direction. The blue-colored nodes have displacements applied in the positive Z direction to mimic a displacement-controlled test. There are 625,152 elements and 552,024 nodes in the FE model, with the maximum element aspect ratio as 3.3 and the minimum element aspect ratio as 2.6.
Figure 19 shows a typical cross-section of the virtual test specimens highlighting the fiber/matrix arrangement.
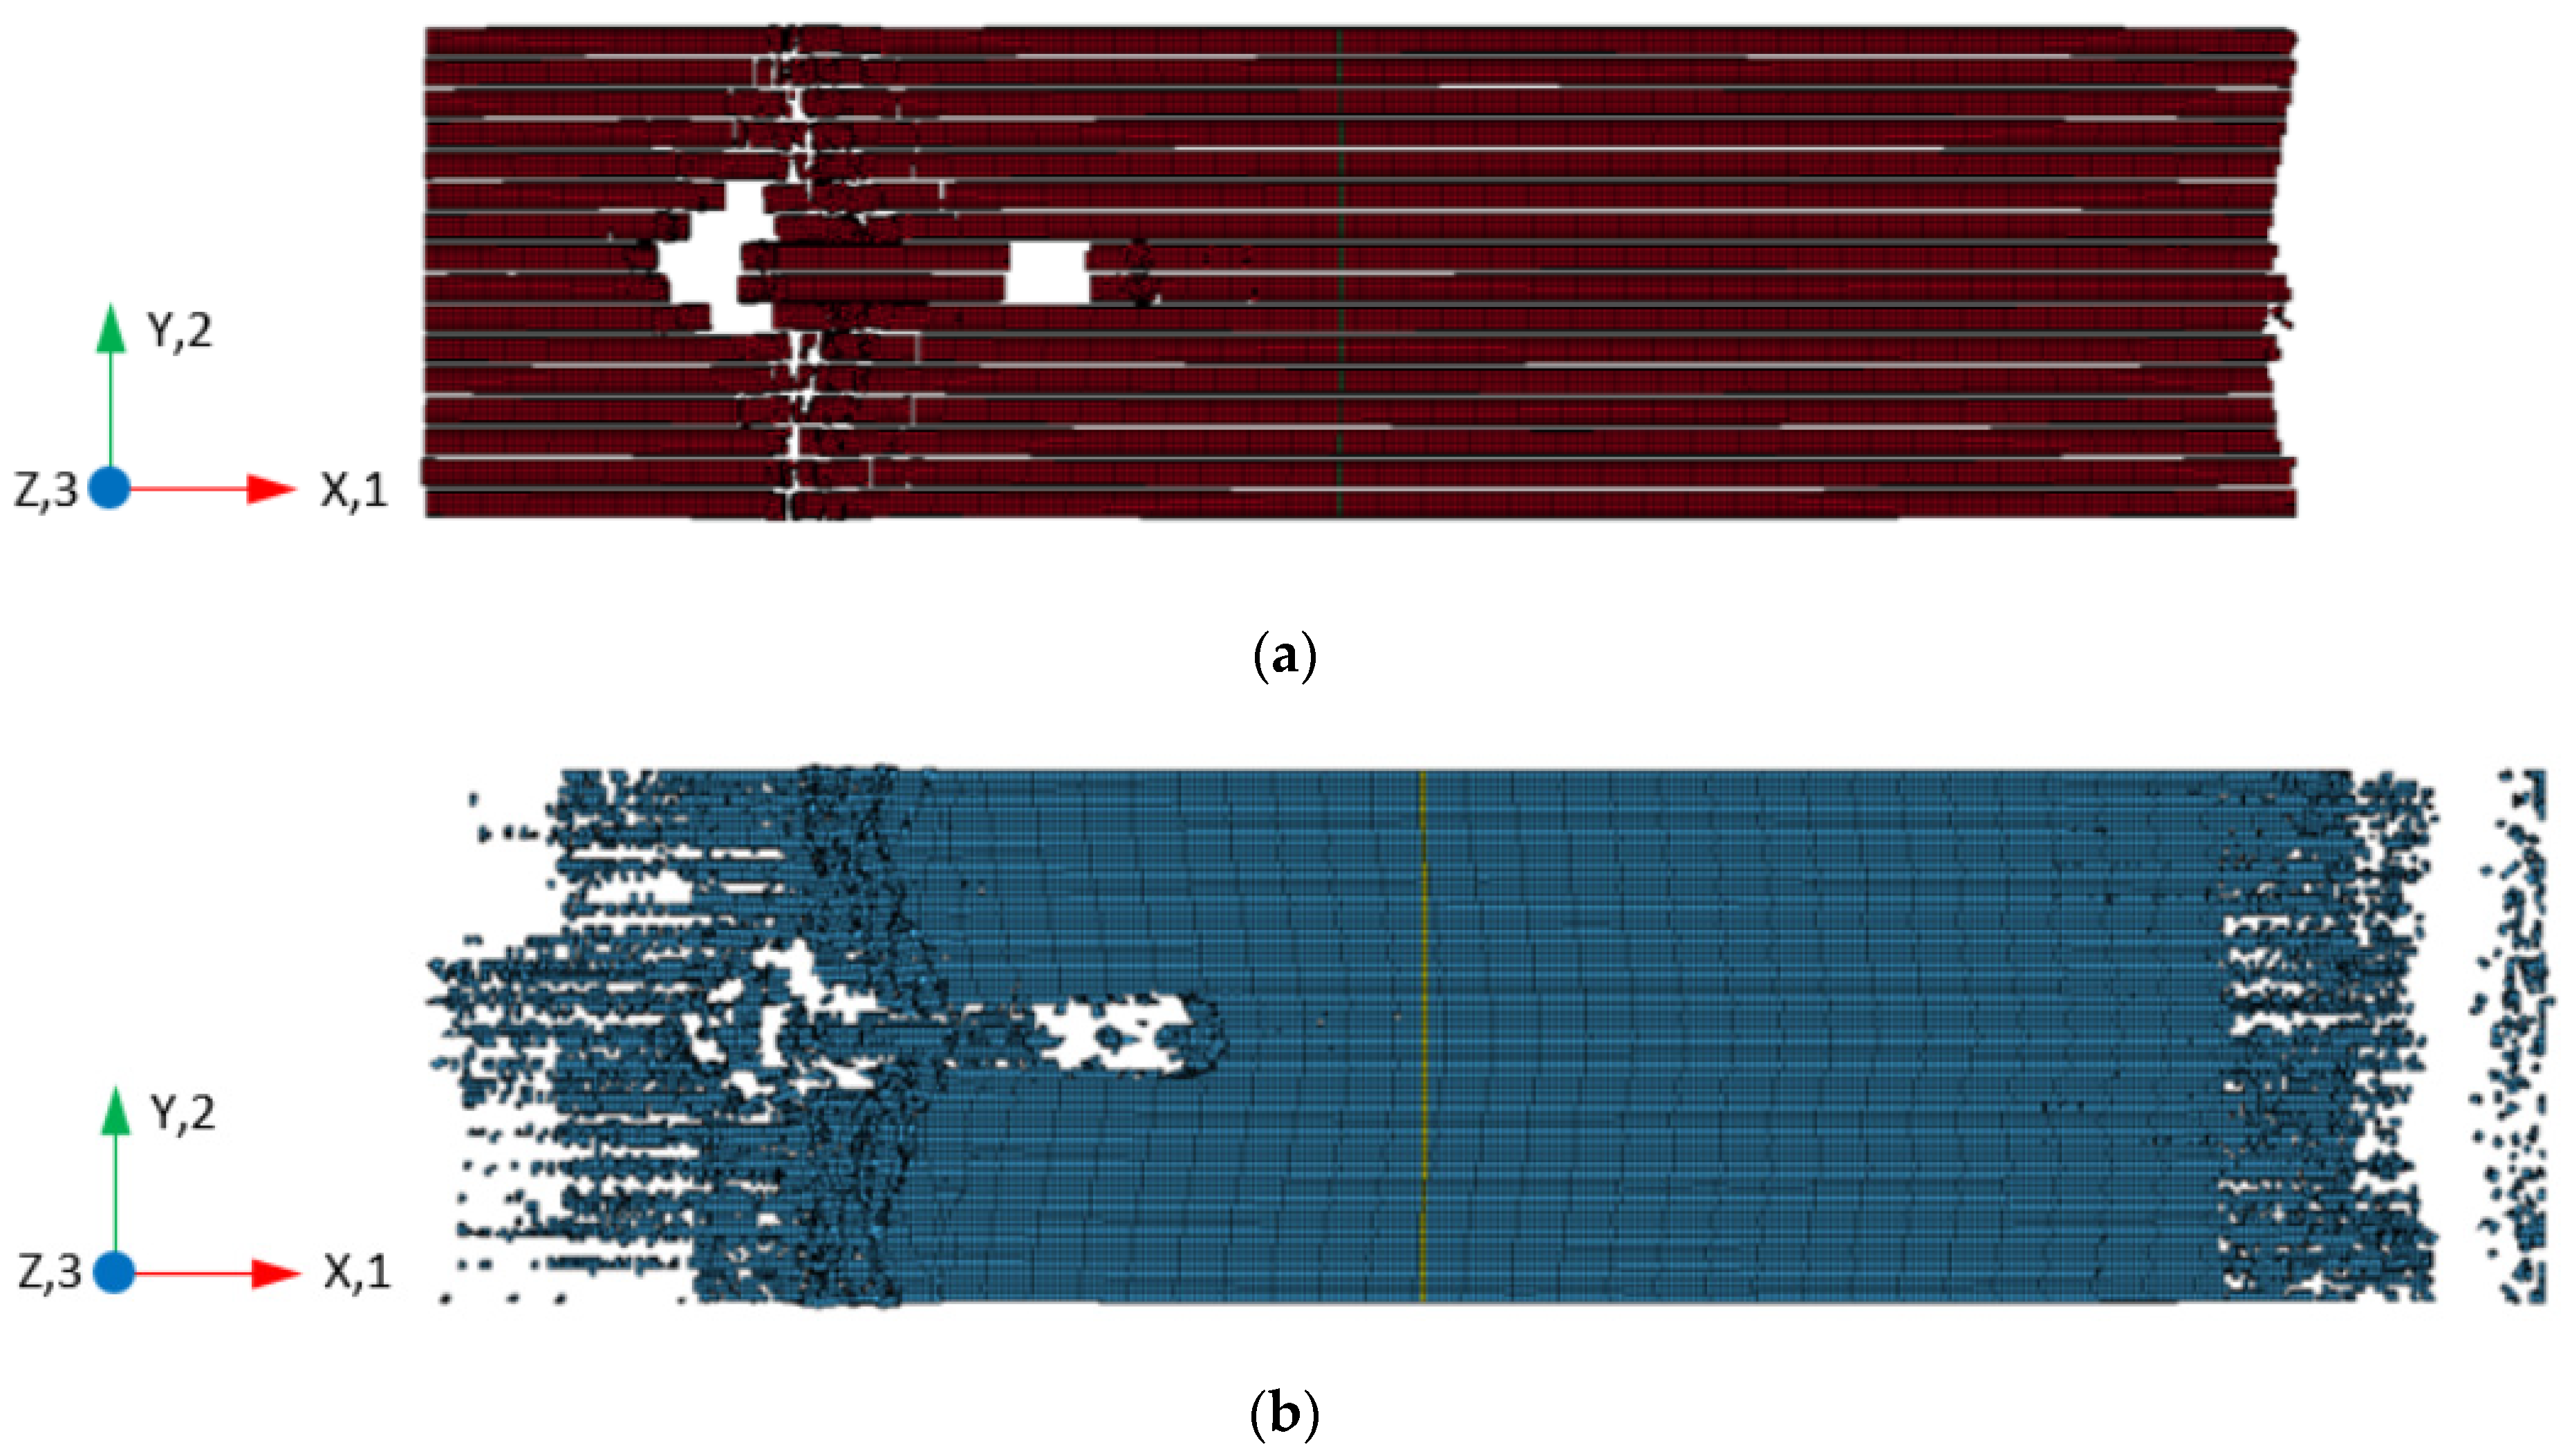
Virtual Test Results: Figure 20 shows the virtual test specimen after all load-carrying capacity has been lost in the finite element model. The failure initiates in the fiber elements near the fixed boundary, with subsequent failure taking place in the fiber element on the loading edge. Ultimately, failure also occurs in a region away from the boundaries as there is sudden redistribution of stresses in the neighboring elements.
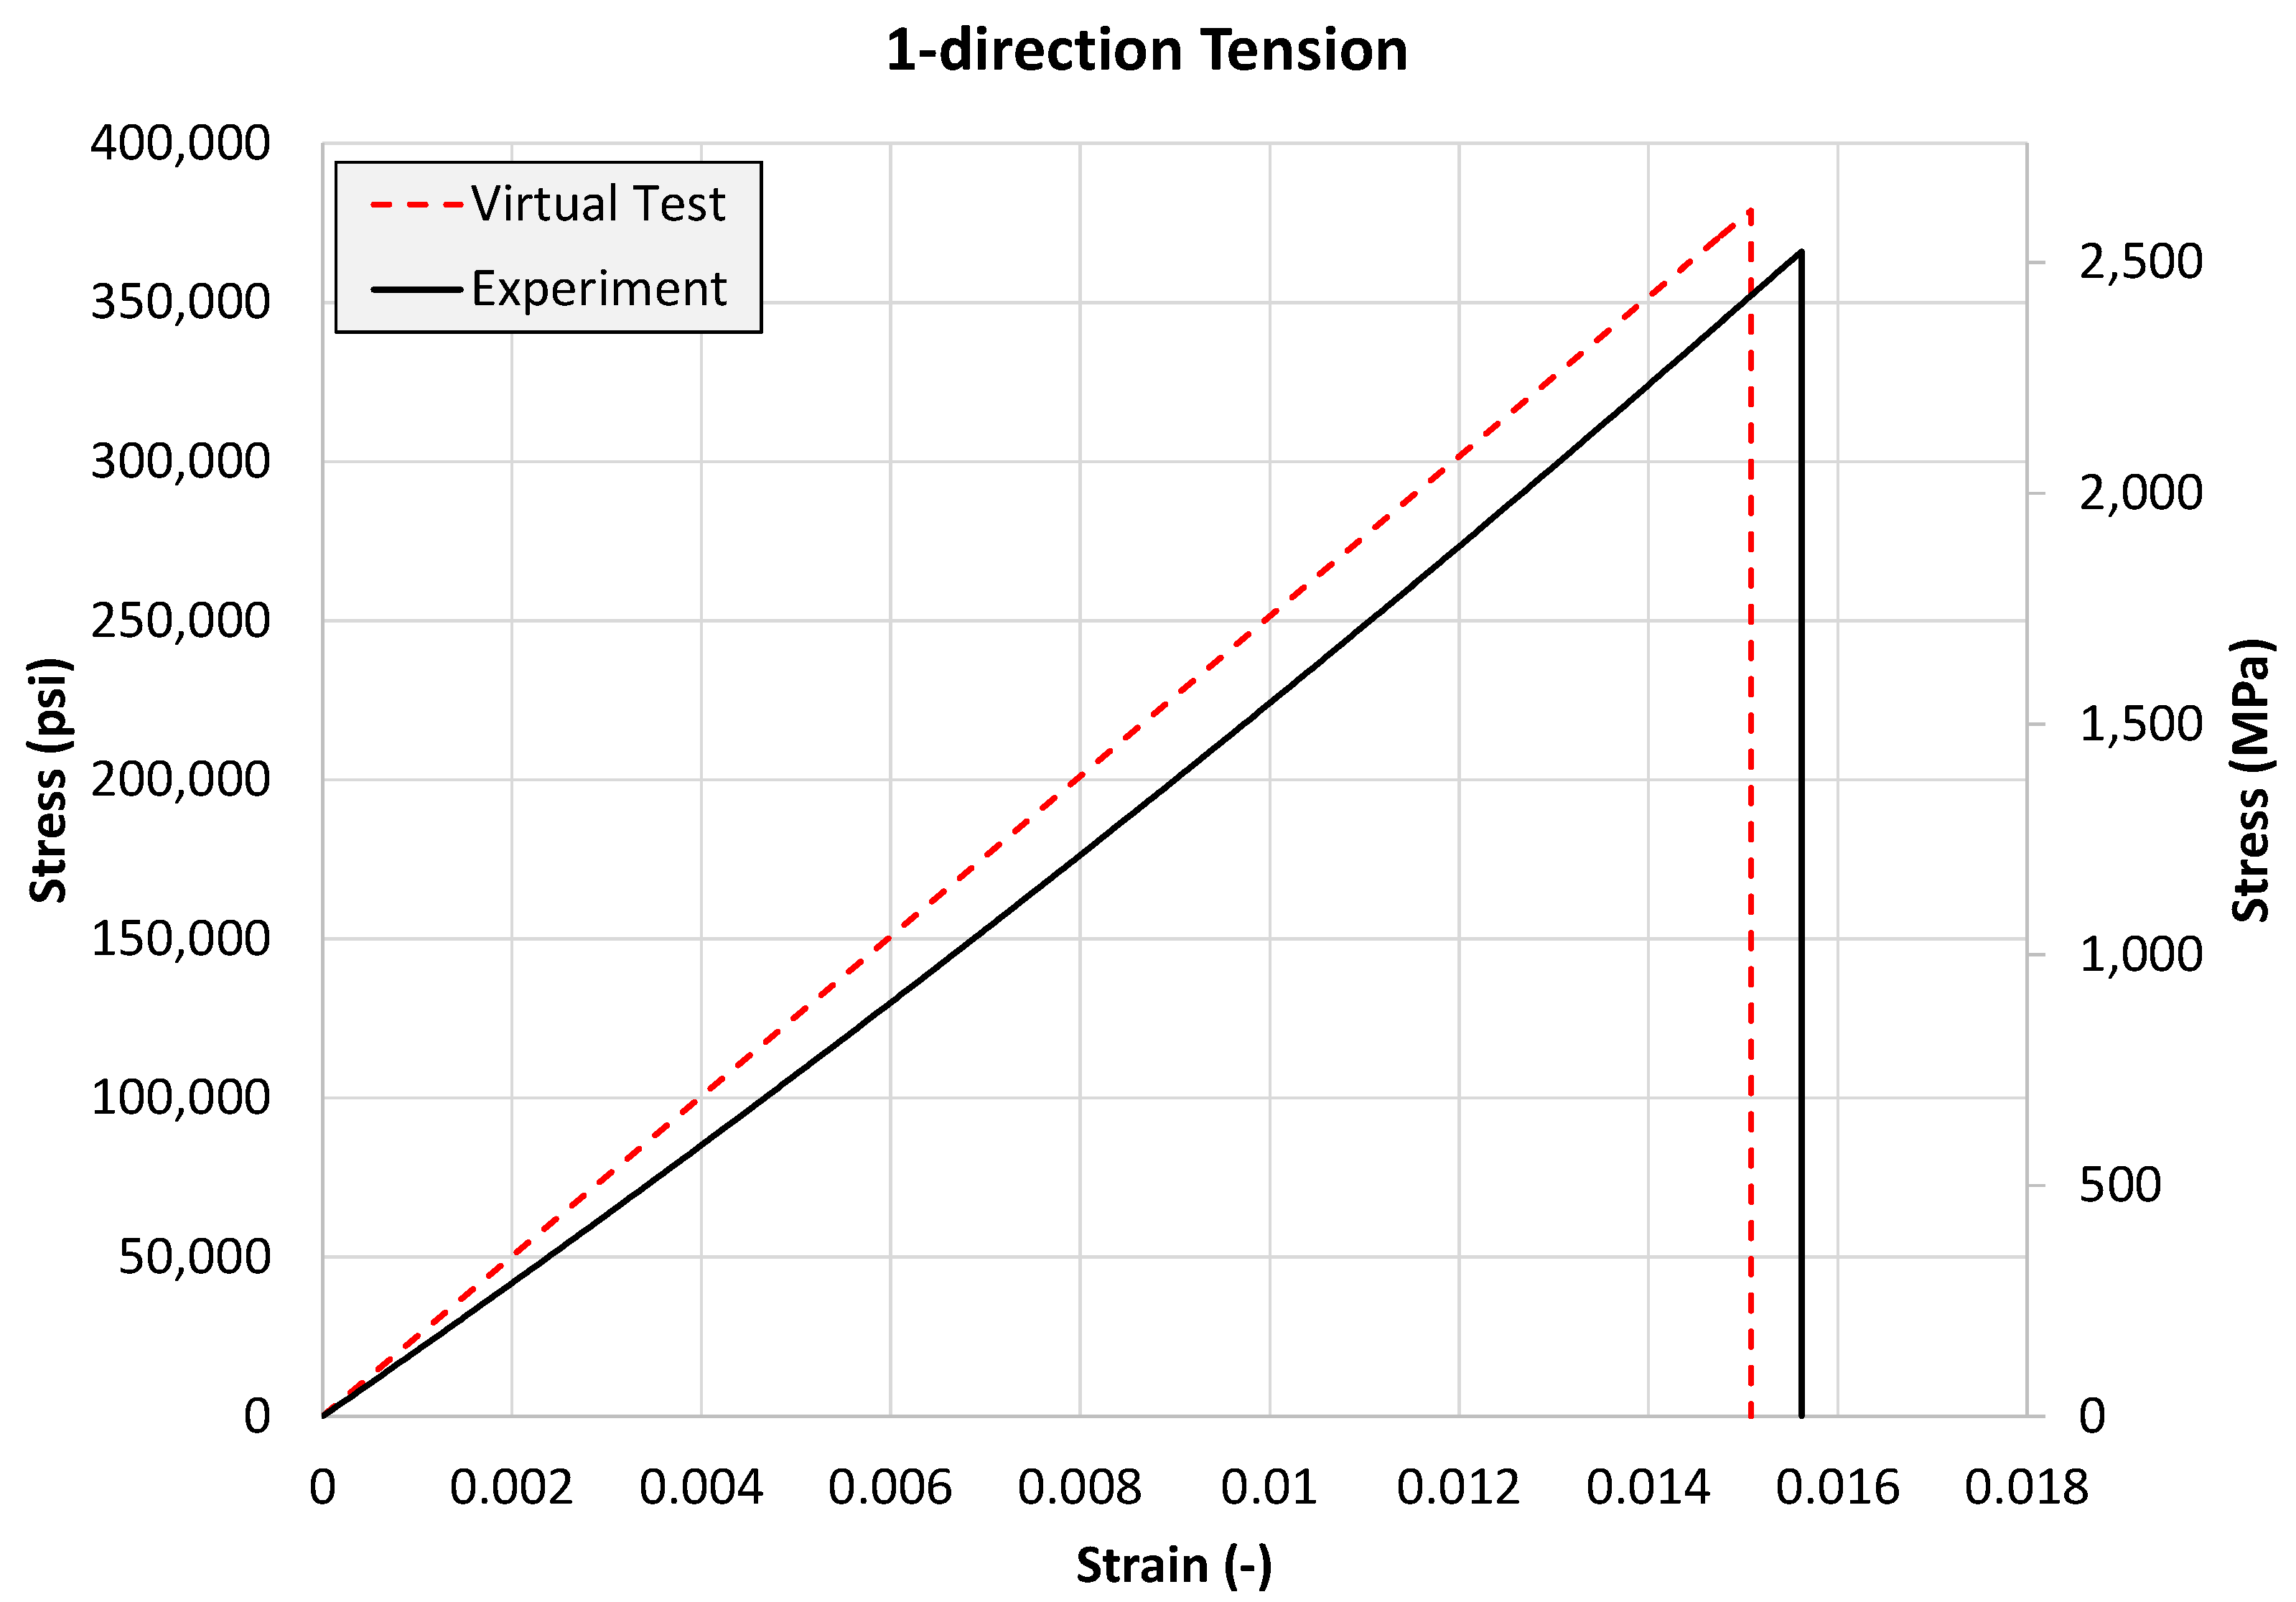
The predicted failure pattern in Figure 20 is likely due to small numerical artifacts present during execution of the finite element model, i.e., small variations in the stress field between neighboring elements. In an ideal situation, all elements representing a given constituent would fail simultaneously. The 1-direction tension test results are shown in Figure 21.
Discussions: The small differences of the peak stress and ultimate strain in Figure 21 are likely due to boundary effects. The small concavity exhibited in the experimental curve is not captured in the virtual tests since there appears to be an initial slack in the fibers, and the fibers do not engage in carrying the load until the slack is overcome. This is also the likely cause of the stiffness mismatch. In our opinion, the differences between the experiment and the virtual testing results are very small (less than 4% in peak stress and 3% in ultimate strain) and thus require no additional calibration.

4.3.2. 1-Direction Compression Test

Experimental and Virtual Test Models: The experimental specimen is shown in Figure 22, with the shaded region representing the gripping area.
Figure 23 shows the geometrically equivalent virtual test specimen modeling only the gage section of the experimental specimen. The black-colored nodes in Figure 23 are restrained in the X, Y, and Z directions. The red-colored nodes are restrained in the Z direction. The blue-colored nodes have displacements applied in the negative Z direction. The cross-section of the 1-direction compression model is similar to the 1-direction tension specimen shown in Figure 19. There are 98,592 elements and 88,080 nodes in the FE model, with the maximum element aspect ratio as 3.3 and the minimum element aspect ratio as 2.6.
Figure 24 shows the fine test specimen after all load-carrying capacity has been lost in the finite element model. Failure in the virtual test specimen occurs gradually before a complete loss of load-carrying capacity. The failure initiates in the fiber elements on the loading edge, with subsequent failure taking place in the neighboring matrix elements due to excessive stresses developing. This is followed by the failure of the fiber elements near the fixed edge.
Discussions: The 1-direction compression test results are shown in Figure 25. The slight nonlinearity exhibited in the experimental curve is not captured in the virtual tests and may be attributed to a variety of sources. The fibers are modeled using an idealized geometry. The fibers are assumed to be circular and straight throughout the length of the part. Introducing geometric variations in the fiber parts may help capture local structural failure mechanisms that may cause macroscopic nonlinearities. Fiber kinking has been experimentally shown to be a major contributing mechanism in the response of unidirectional composites under longitudinal compression [34,35]. To a lesser extent, (a) the true fiber/matrix interface properties are not captured in the virtual test model since a perfect bond is assumed, which could lead to a stiffer composite response, and (b) the carbon fiber is assumed to be linear elastic while experimental results from in situ single-fiber compression tests show at least a small degree of nonlinearity in the stress-strain or force-displacement response [36,37].

4.3.3. 2-Direction Tension Test

Experimental and Virtual Test Models: The experimental specimen is shown in Figure 26, with the shaded region representing the gripping area.
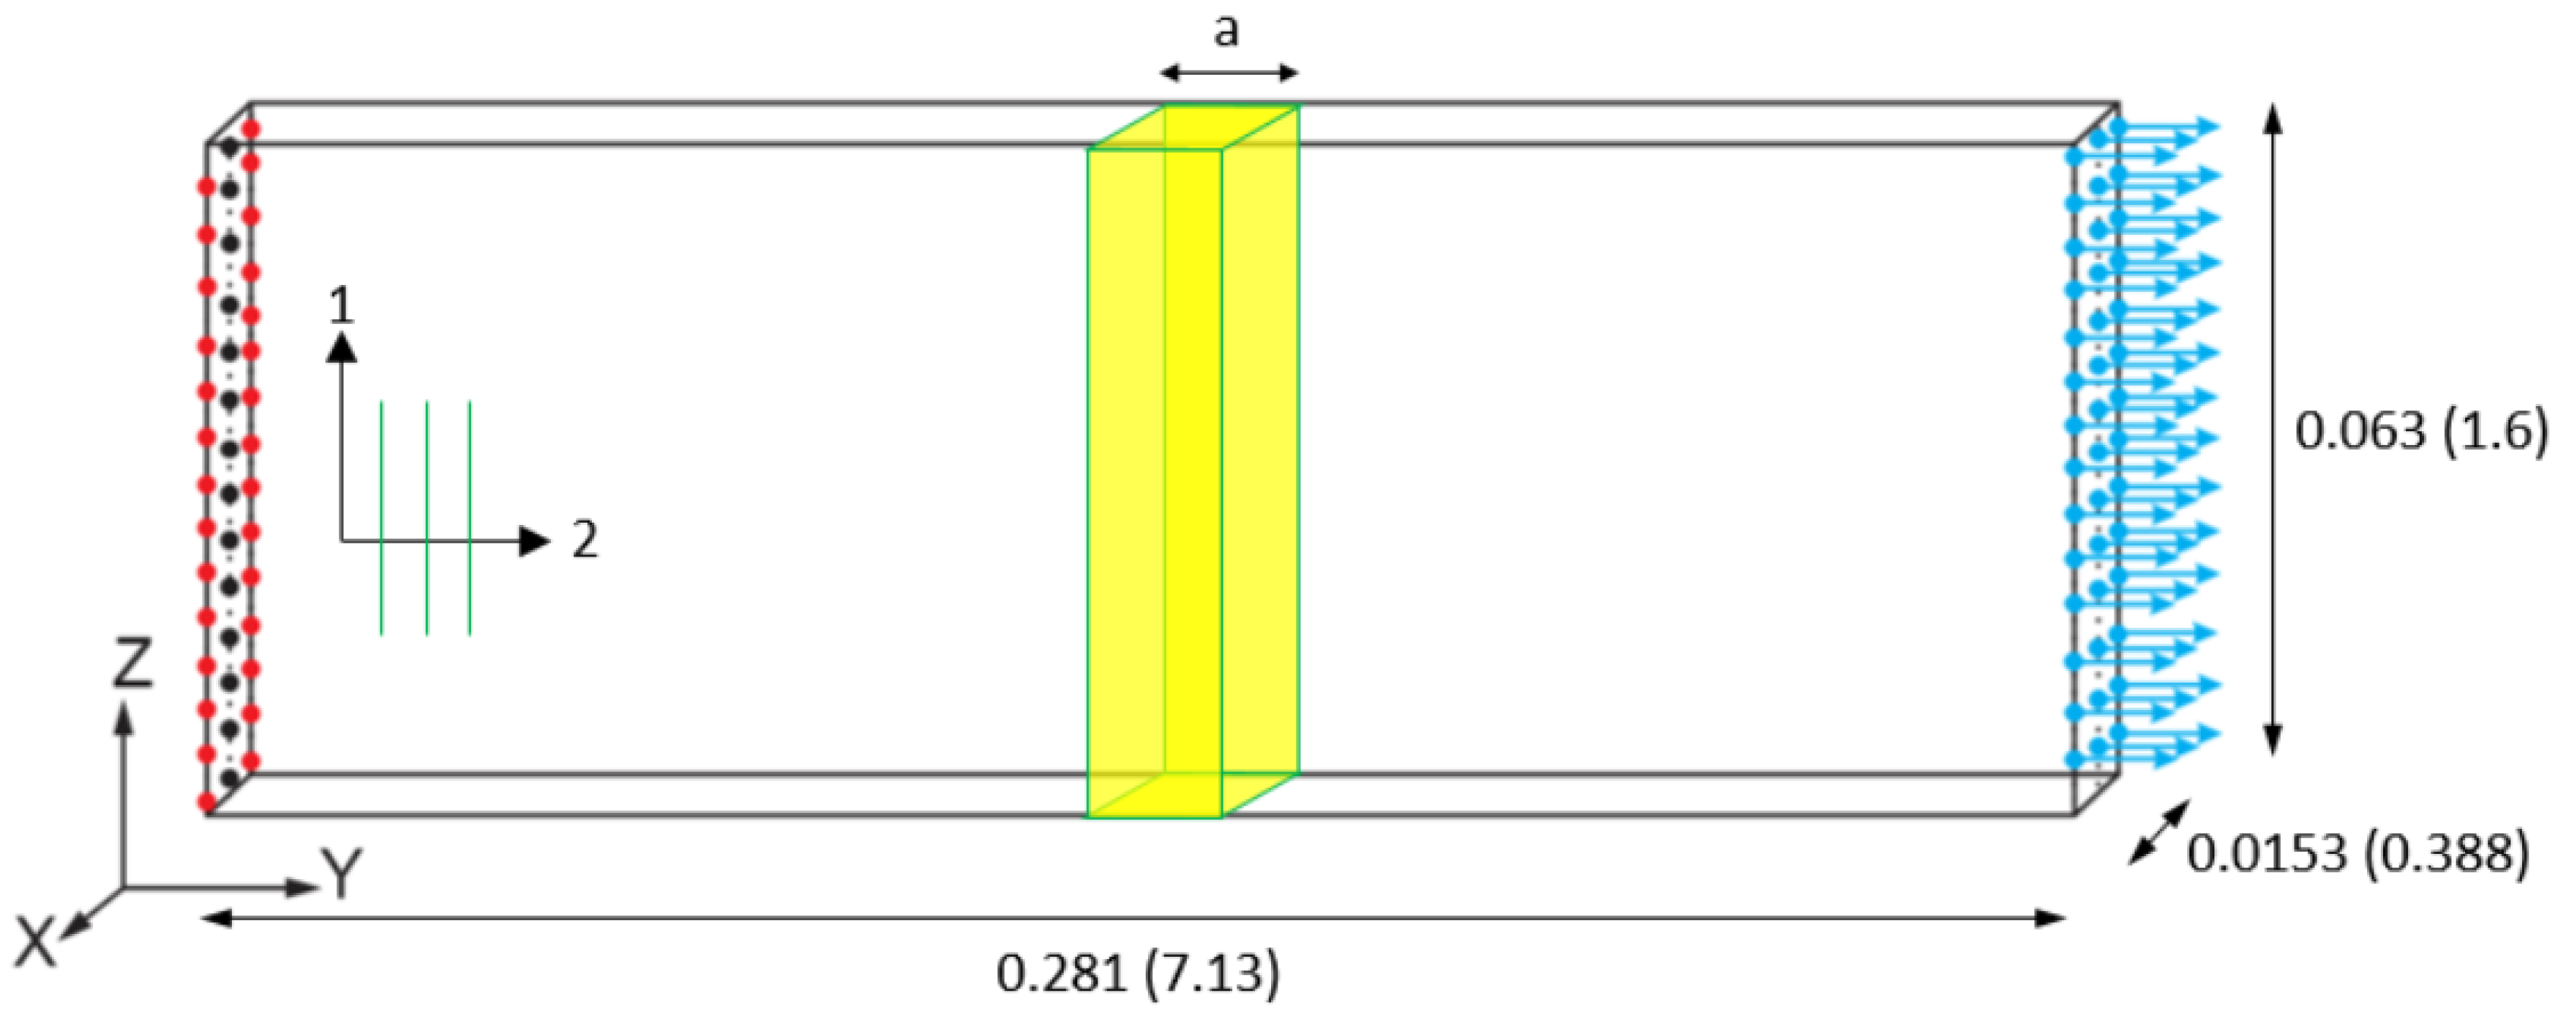
Figure 27 shows the geometrically equivalent virtual test specimen modeling only the gage section of the experimental specimen. The black-colored nodes in Figure 27 are restrained in the X, Y, and Z directions. The red-colored nodes are restrained in the Z direction. The blue-colored nodes have displacements applied in the negative Z direction. There are 188,256 elements and 168,318 nodes in the FE model, with the maximum element aspect ratio as 3.3 and the minimum element aspect ratio as 2.6.
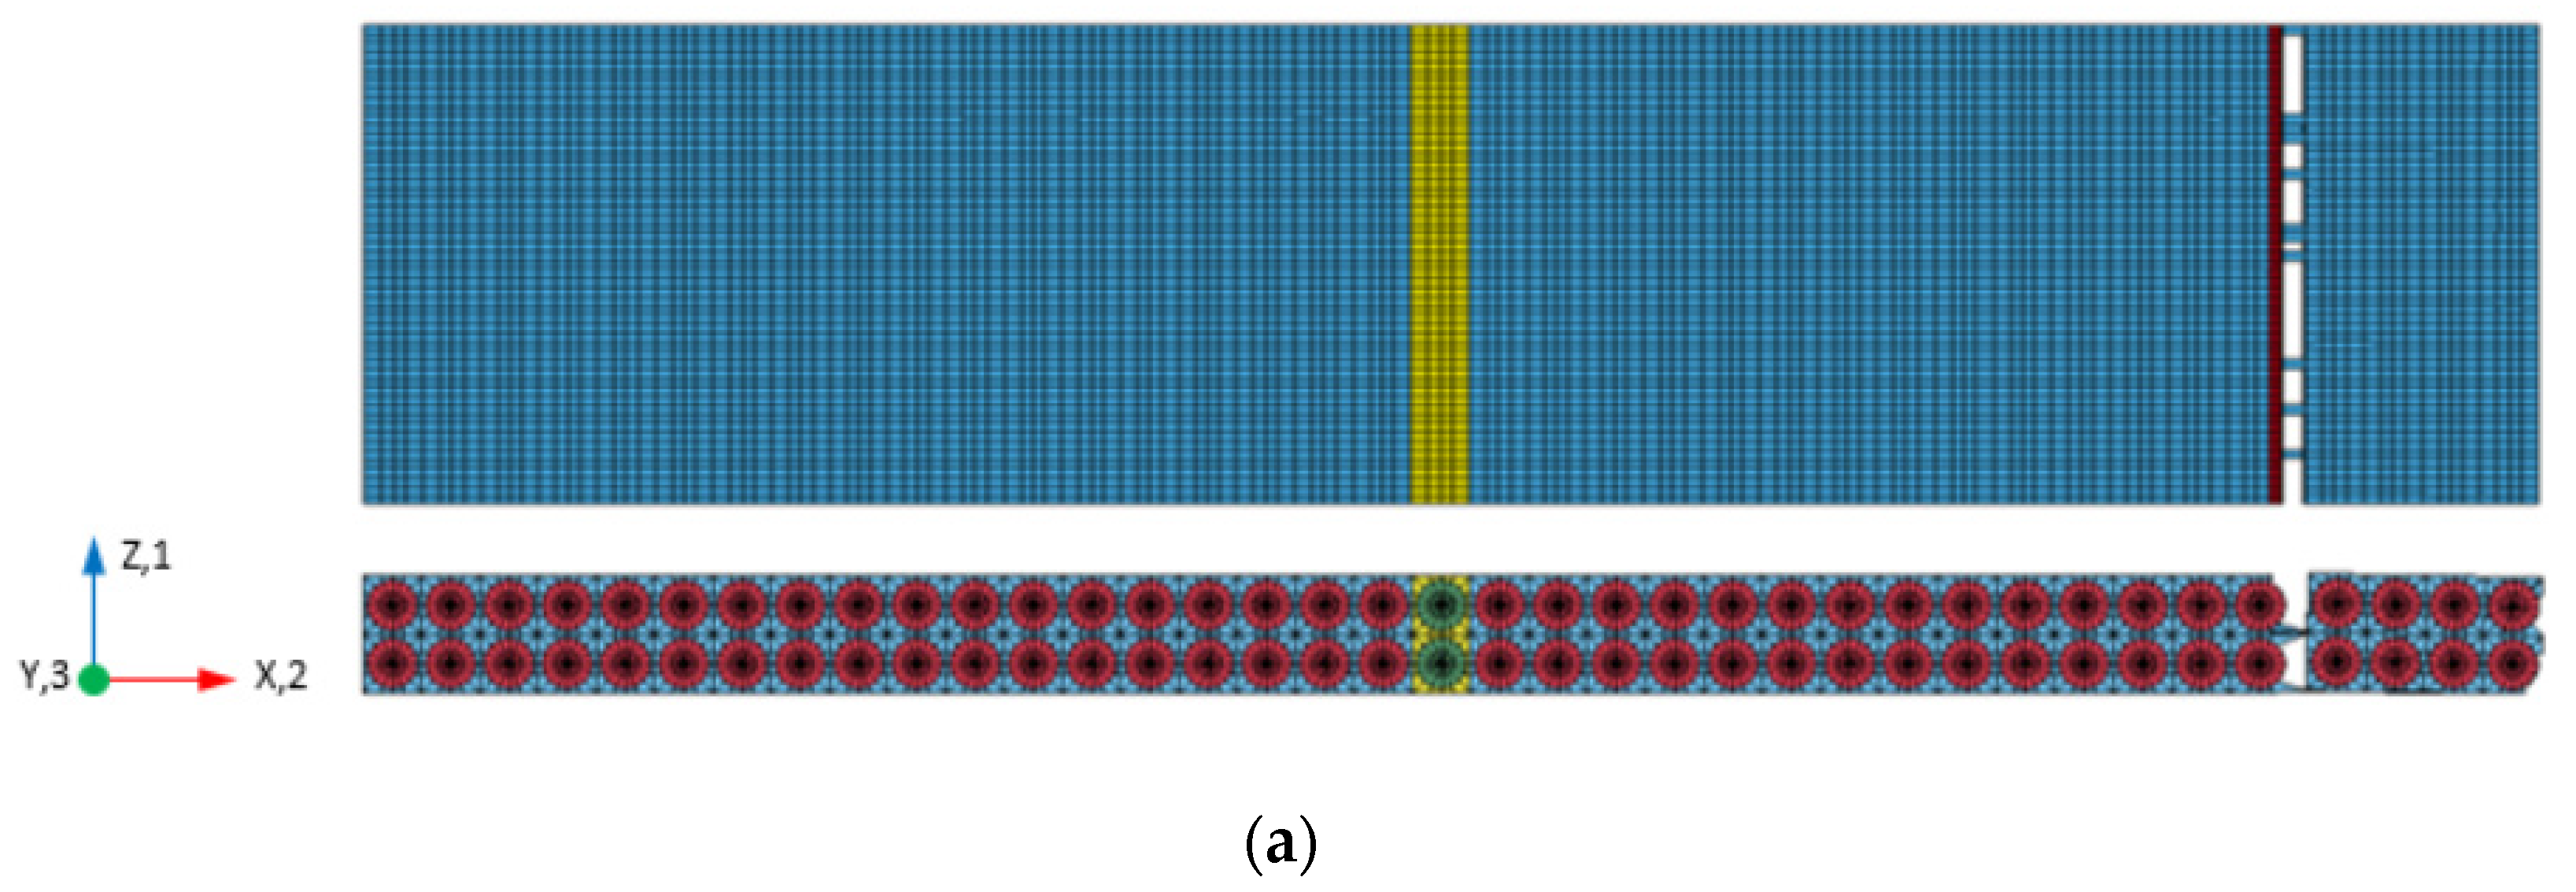
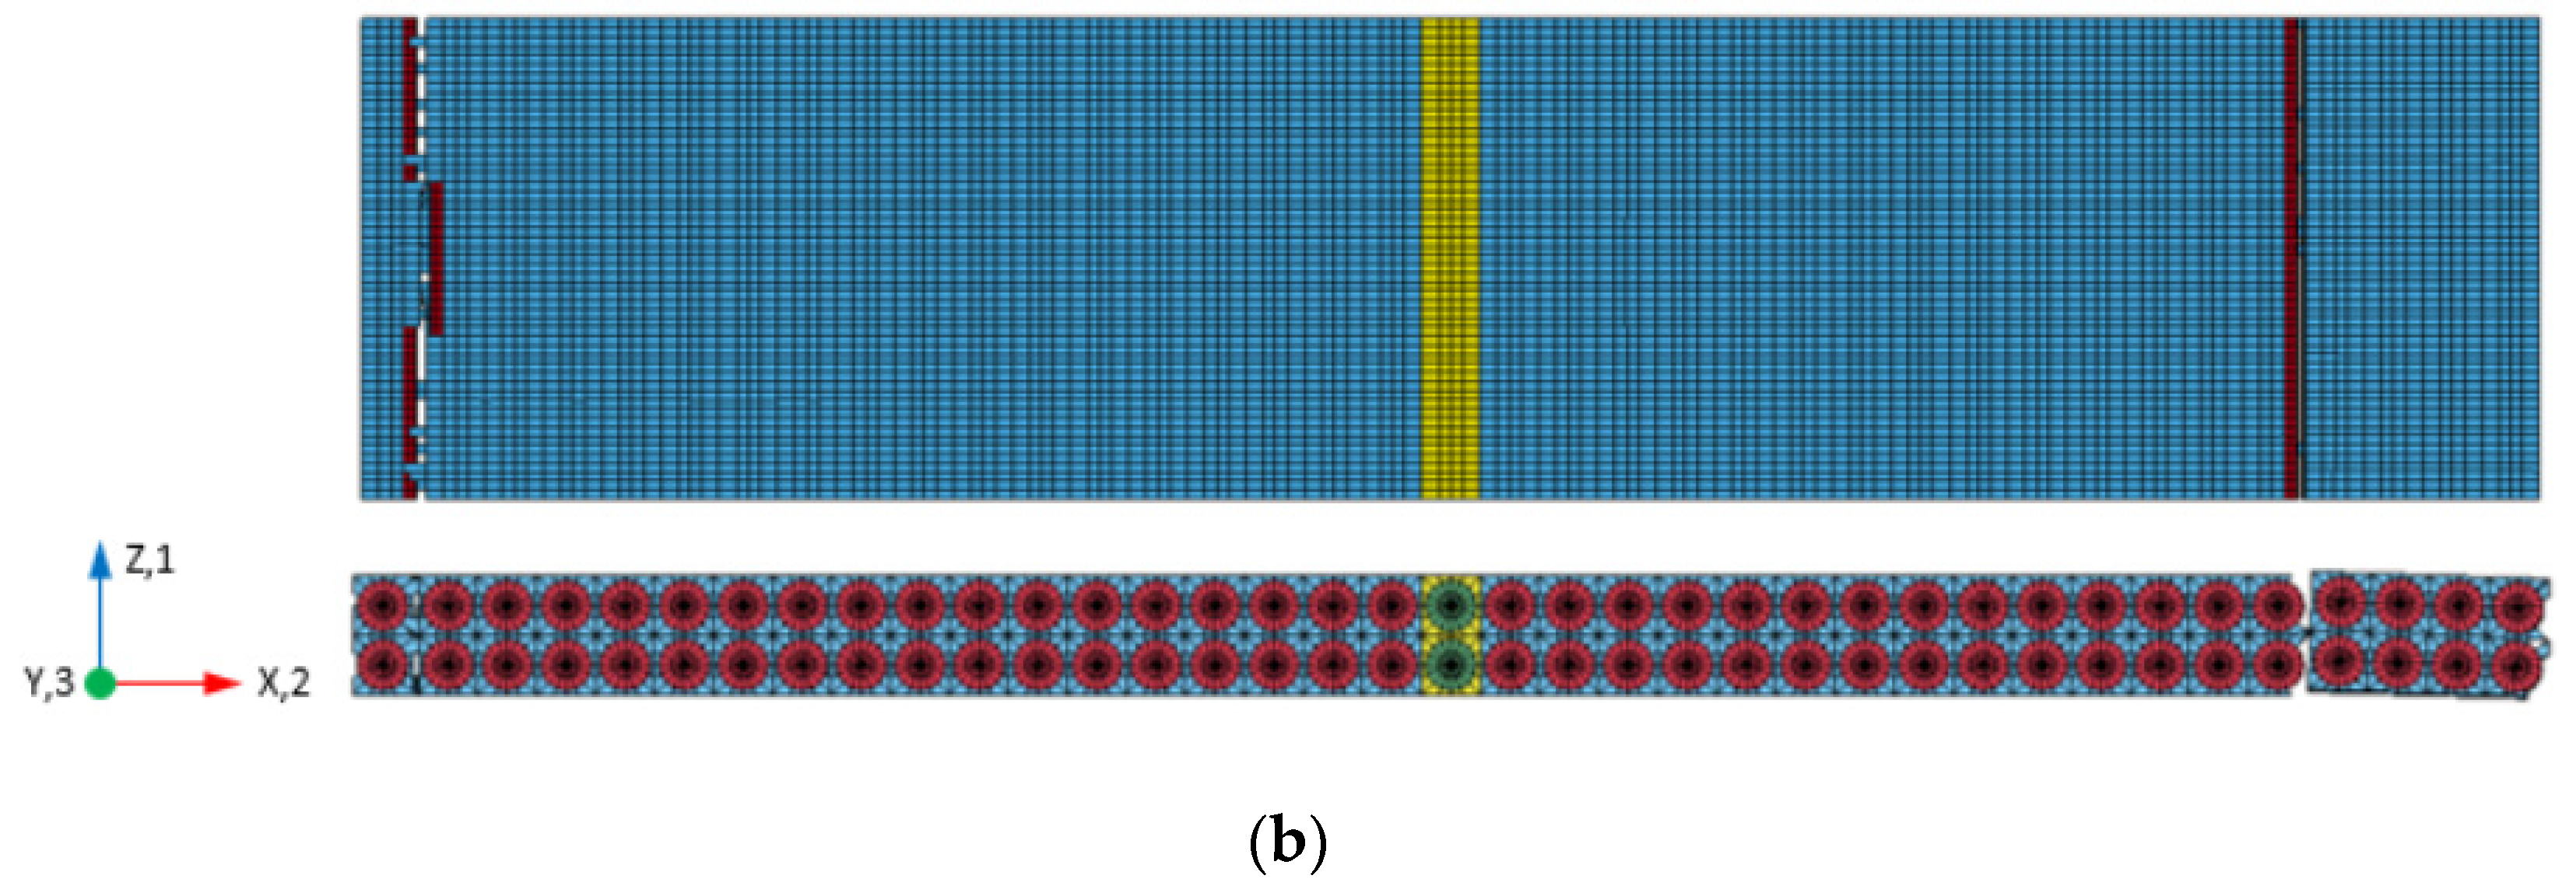
Virtual Test Results: Figure 28 shows that failure of the specimen initiates on a plane perpendicular to the direction of loading (X direction). The failure occurs in the matrix elements that reside on that plane, consistent with experimental observations of the T800S/F3900 composite [38].
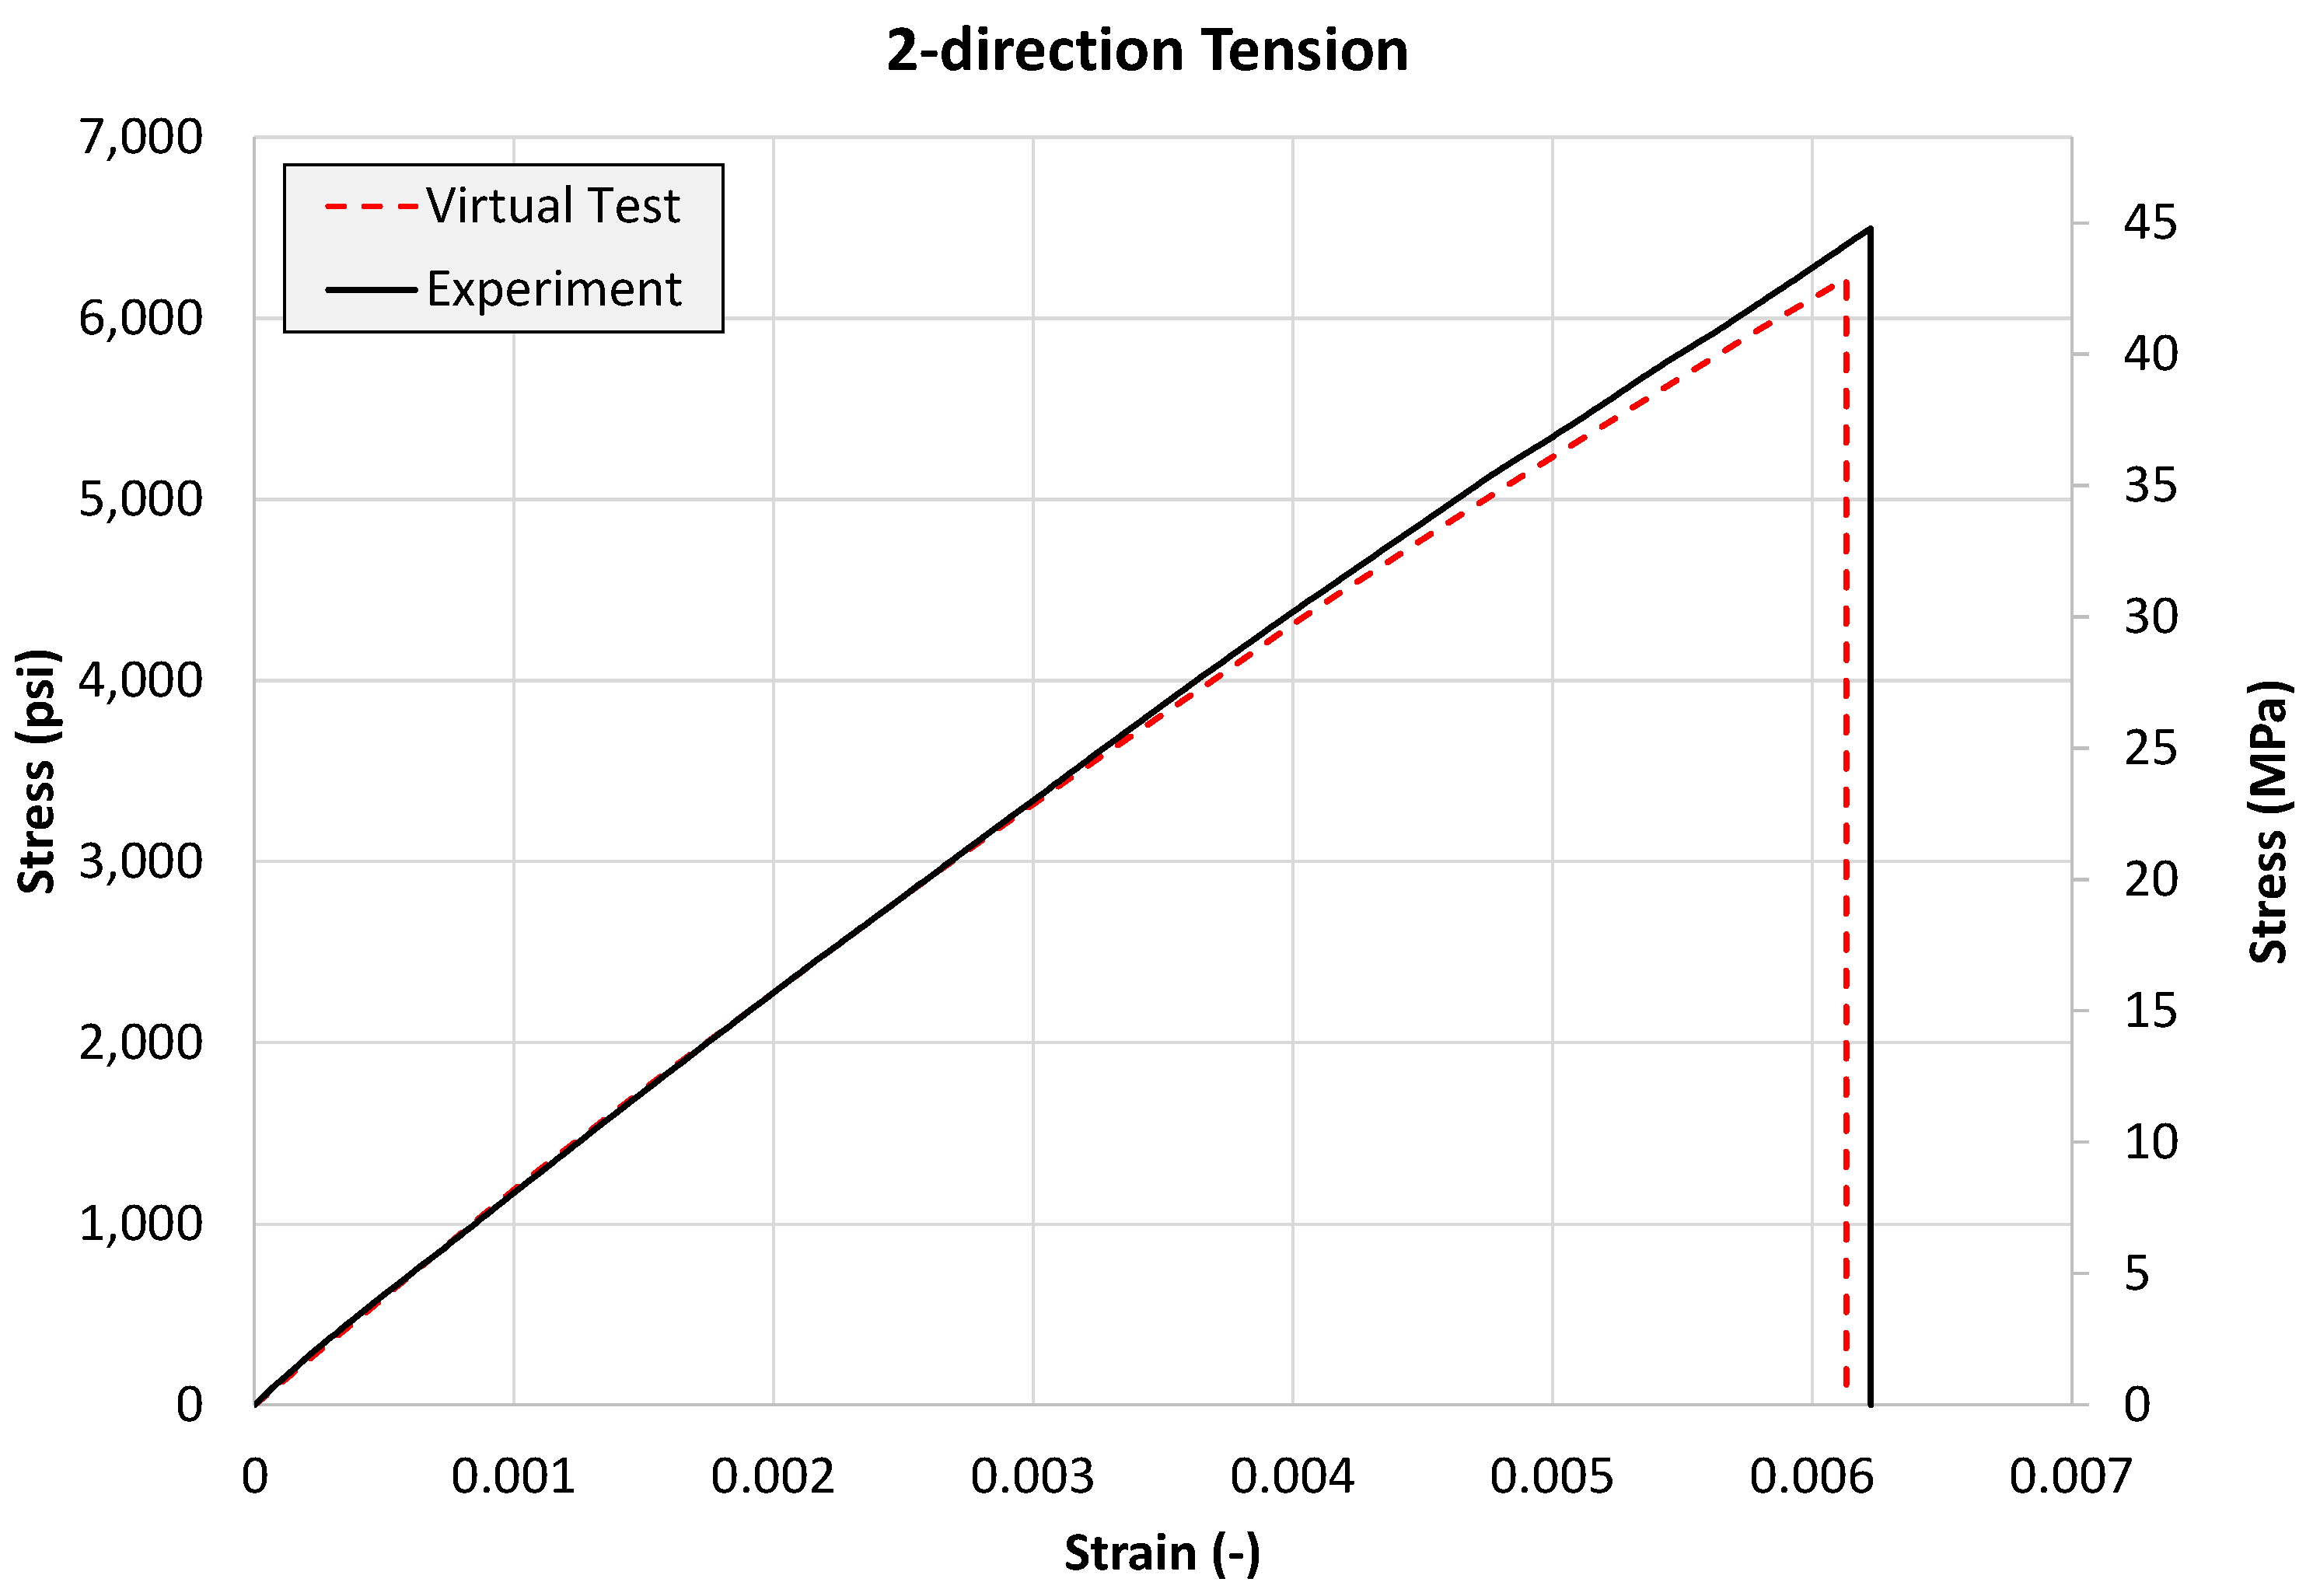
Discussions: The 2-direction tension test results are shown in Figure 29. The failure mechanisms and ultimate response appear to have been captured adequately.

4.3.4. 2-Direction Compression Test

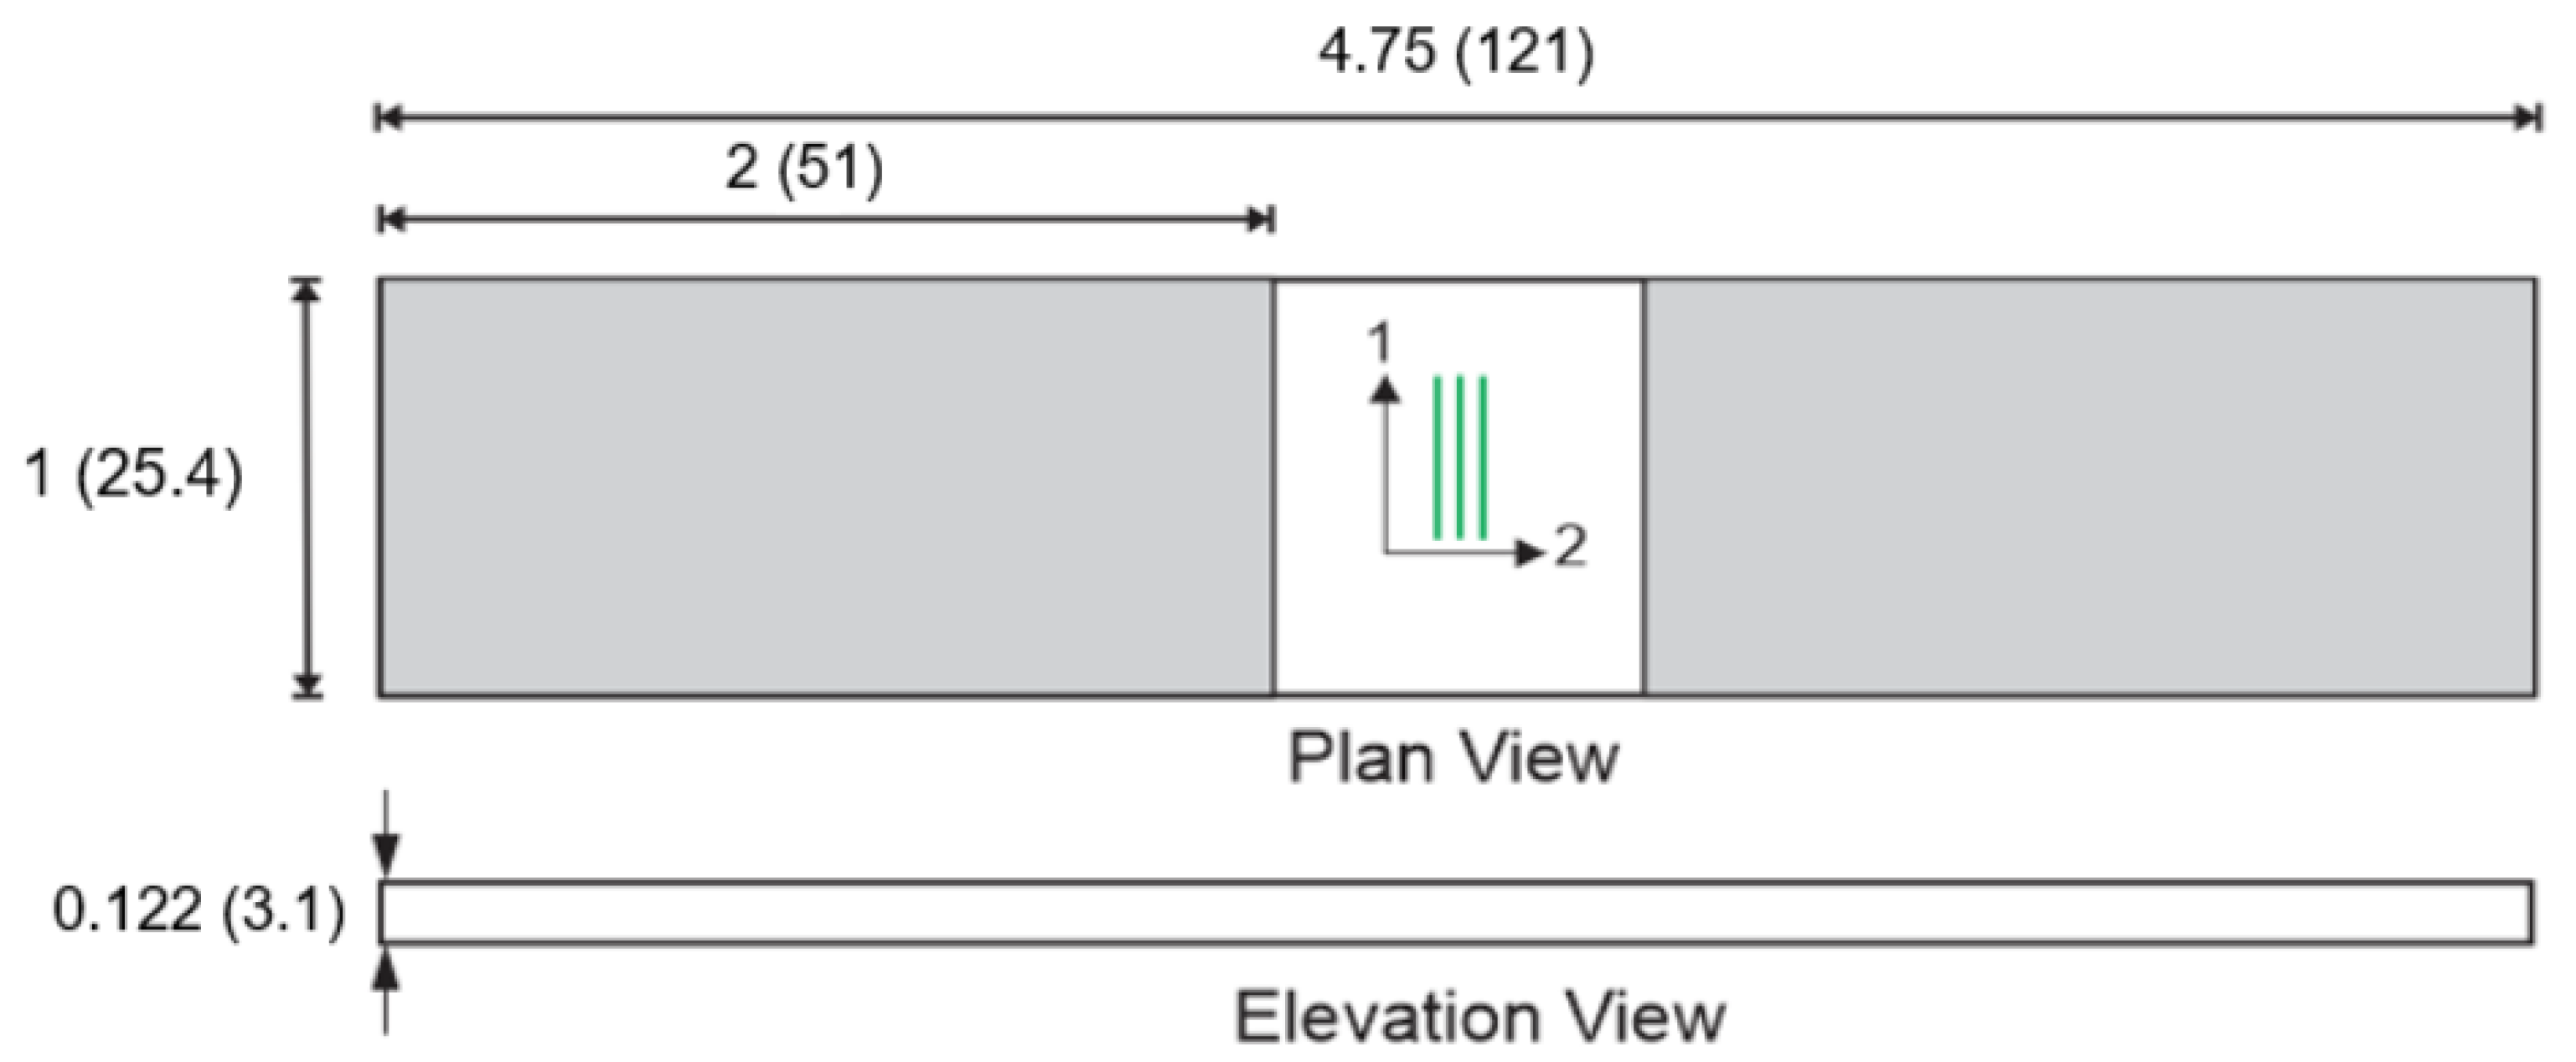
Experimental and Virtual Test Models: The experimental specimen is shown in Figure 30, with the shaded region representing the gripping area.
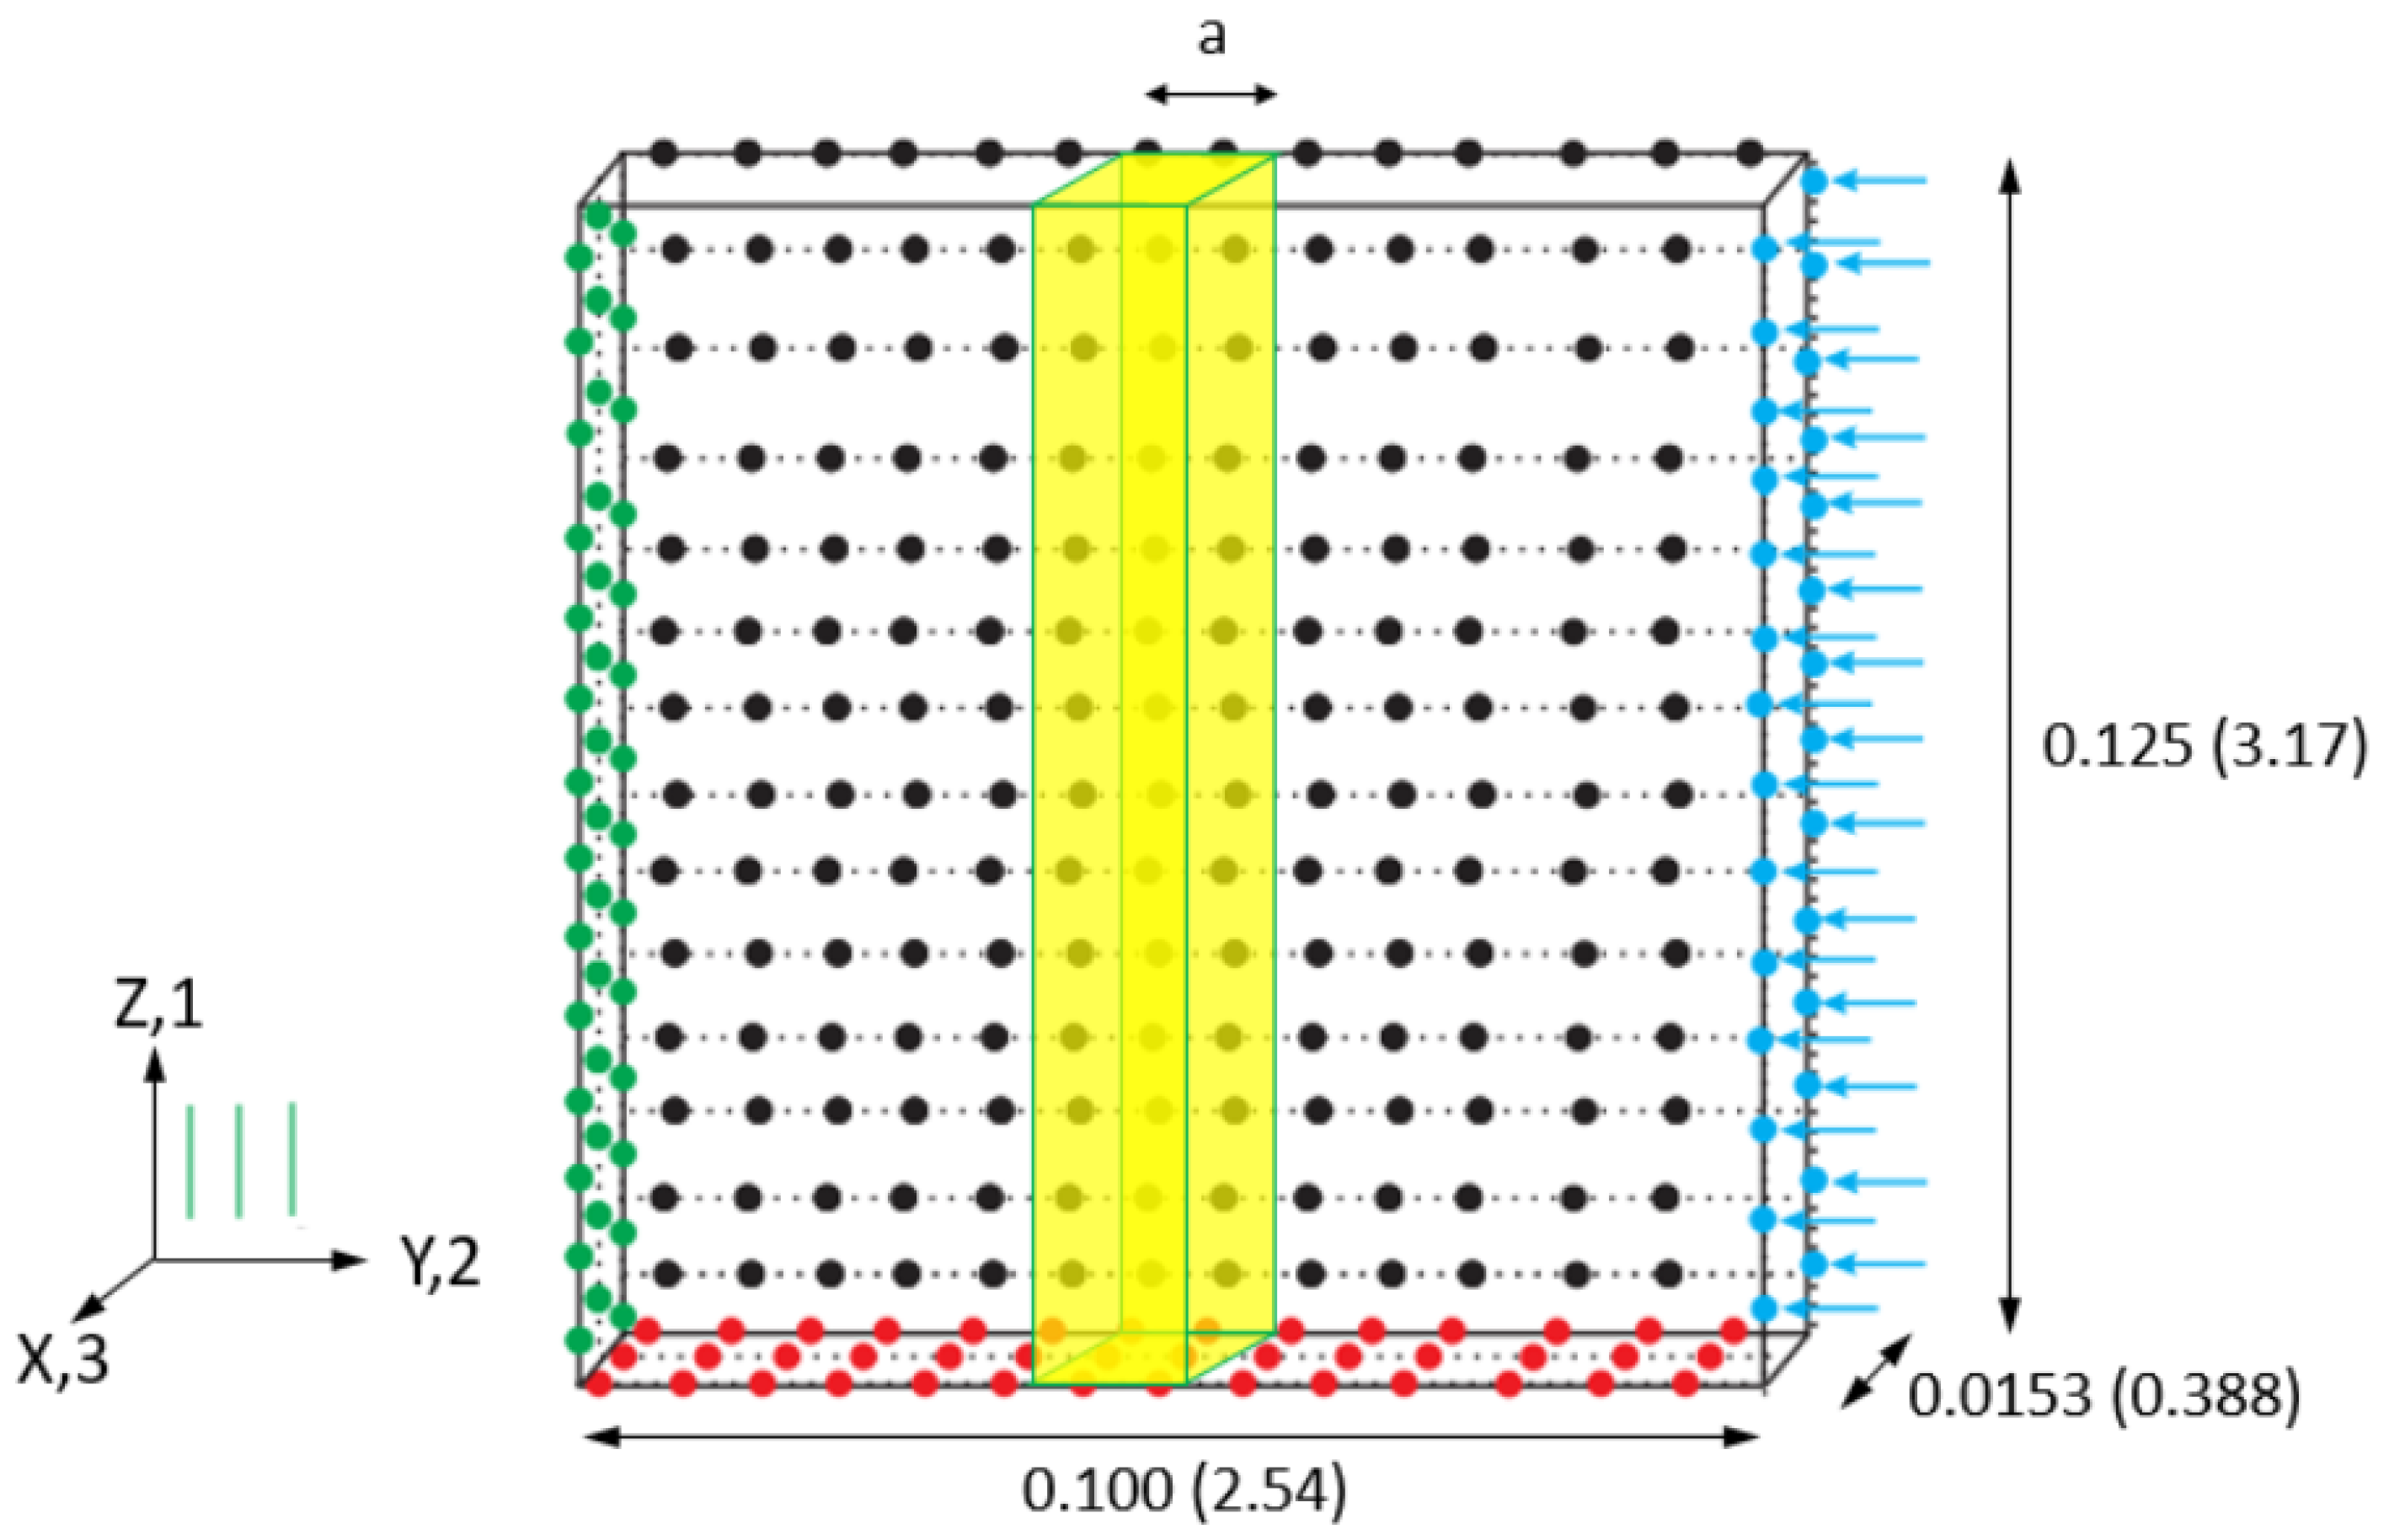
Figure 31 shows the geometrically equivalent virtual test specimen modeling only the gage section of the experimental specimen. The black-colored nodes in Figure 31 are restrained in the X directions. The red-colored nodes are restrained in the Z direction. The green-colored nodes are restrained in the Y direction. The blue-colored nodes have displacements applied in the negative Y direction. This set of boundary conditions provides a symmetric model and improves computational efficiency. There are 131,040 elements and 116,706 nodes in the FE model, with the maximum element aspect ratio as 3.3 and the minimum element aspect ratio as 2.6.
Virtual Test Results: Figure 32 shows the virtual test specimen after all load-carrying capacity has been lost in the finite element model. Failure only takes place in the matrix elements with the fracture angle change along the width of the model (Z direction). The bottom view shows a measured fracture angle of approximately 50°, which is consistent with experimental observations of unidirectional composites subjected to transverse compression loading as the response of the material is dominated by shear mechanisms in the epoxy resin [39,40]. The fracture plane on the top of the specimen is perpendicular to the loading direction.
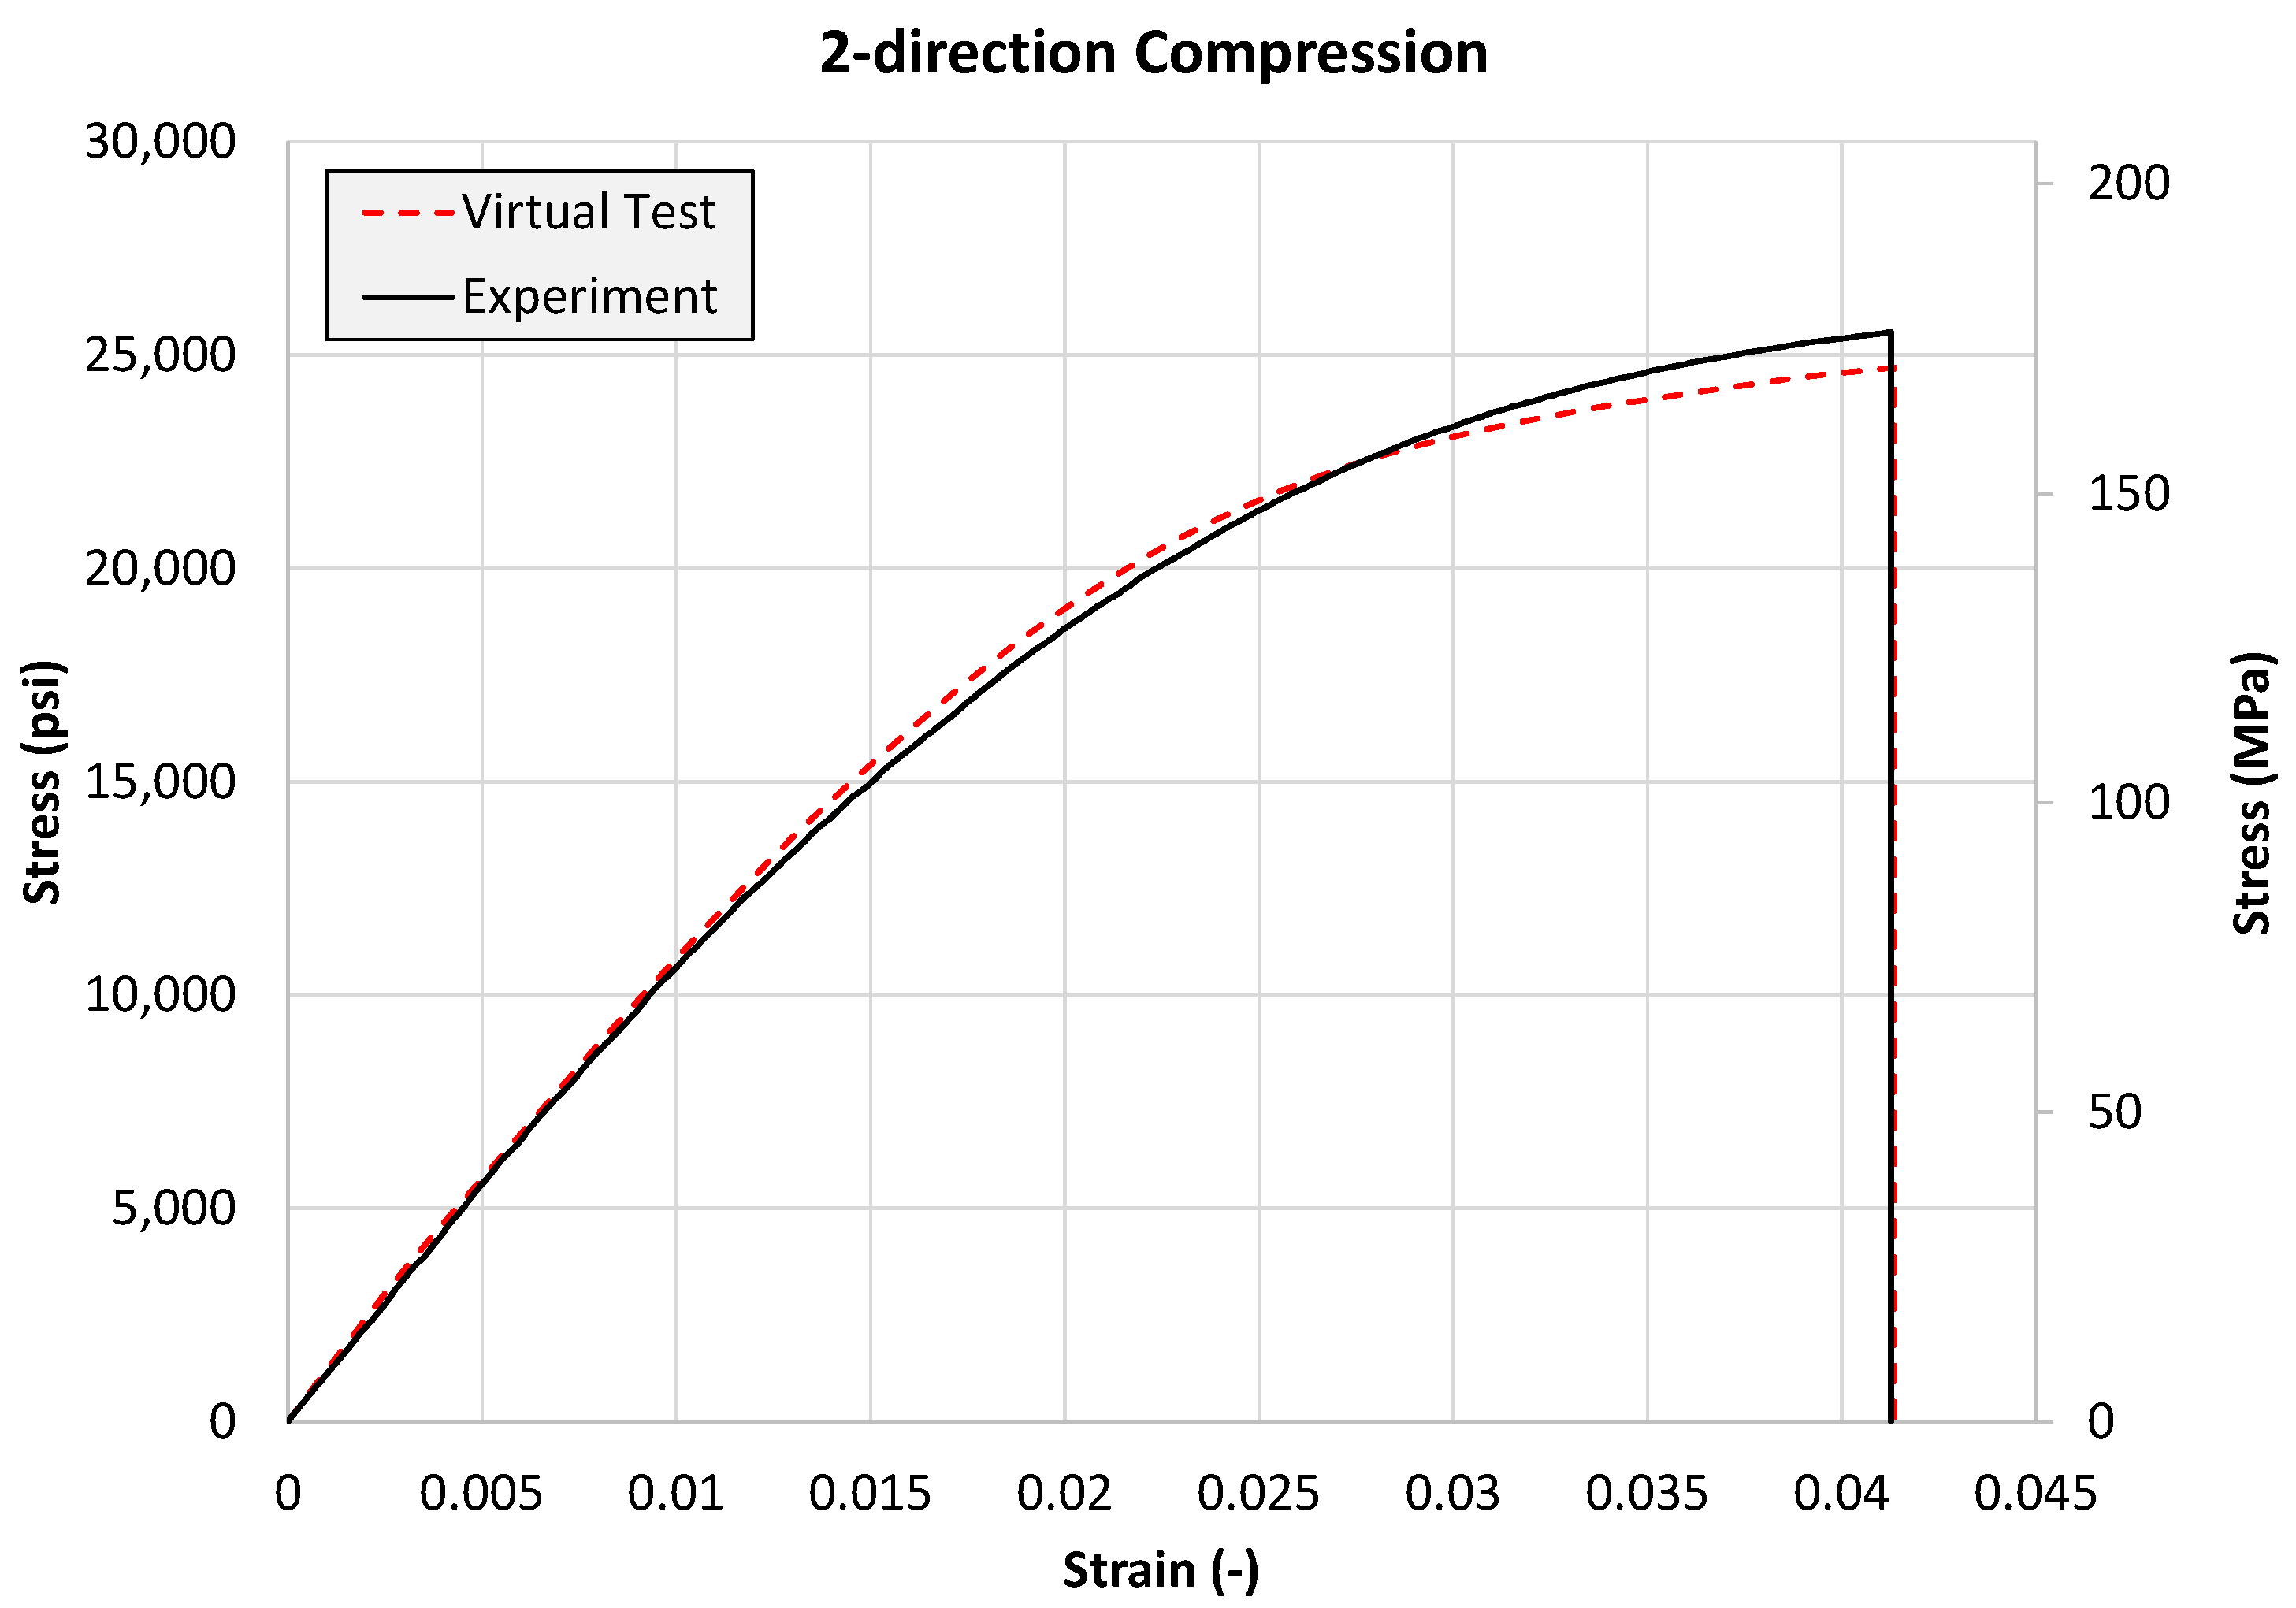
Discussions: The 2-direction compression test results are shown in Figure 33. The failure mechanisms and ultimate response appear to have been captured adequately.

4.3.5. 2-1 Plane Shear Test

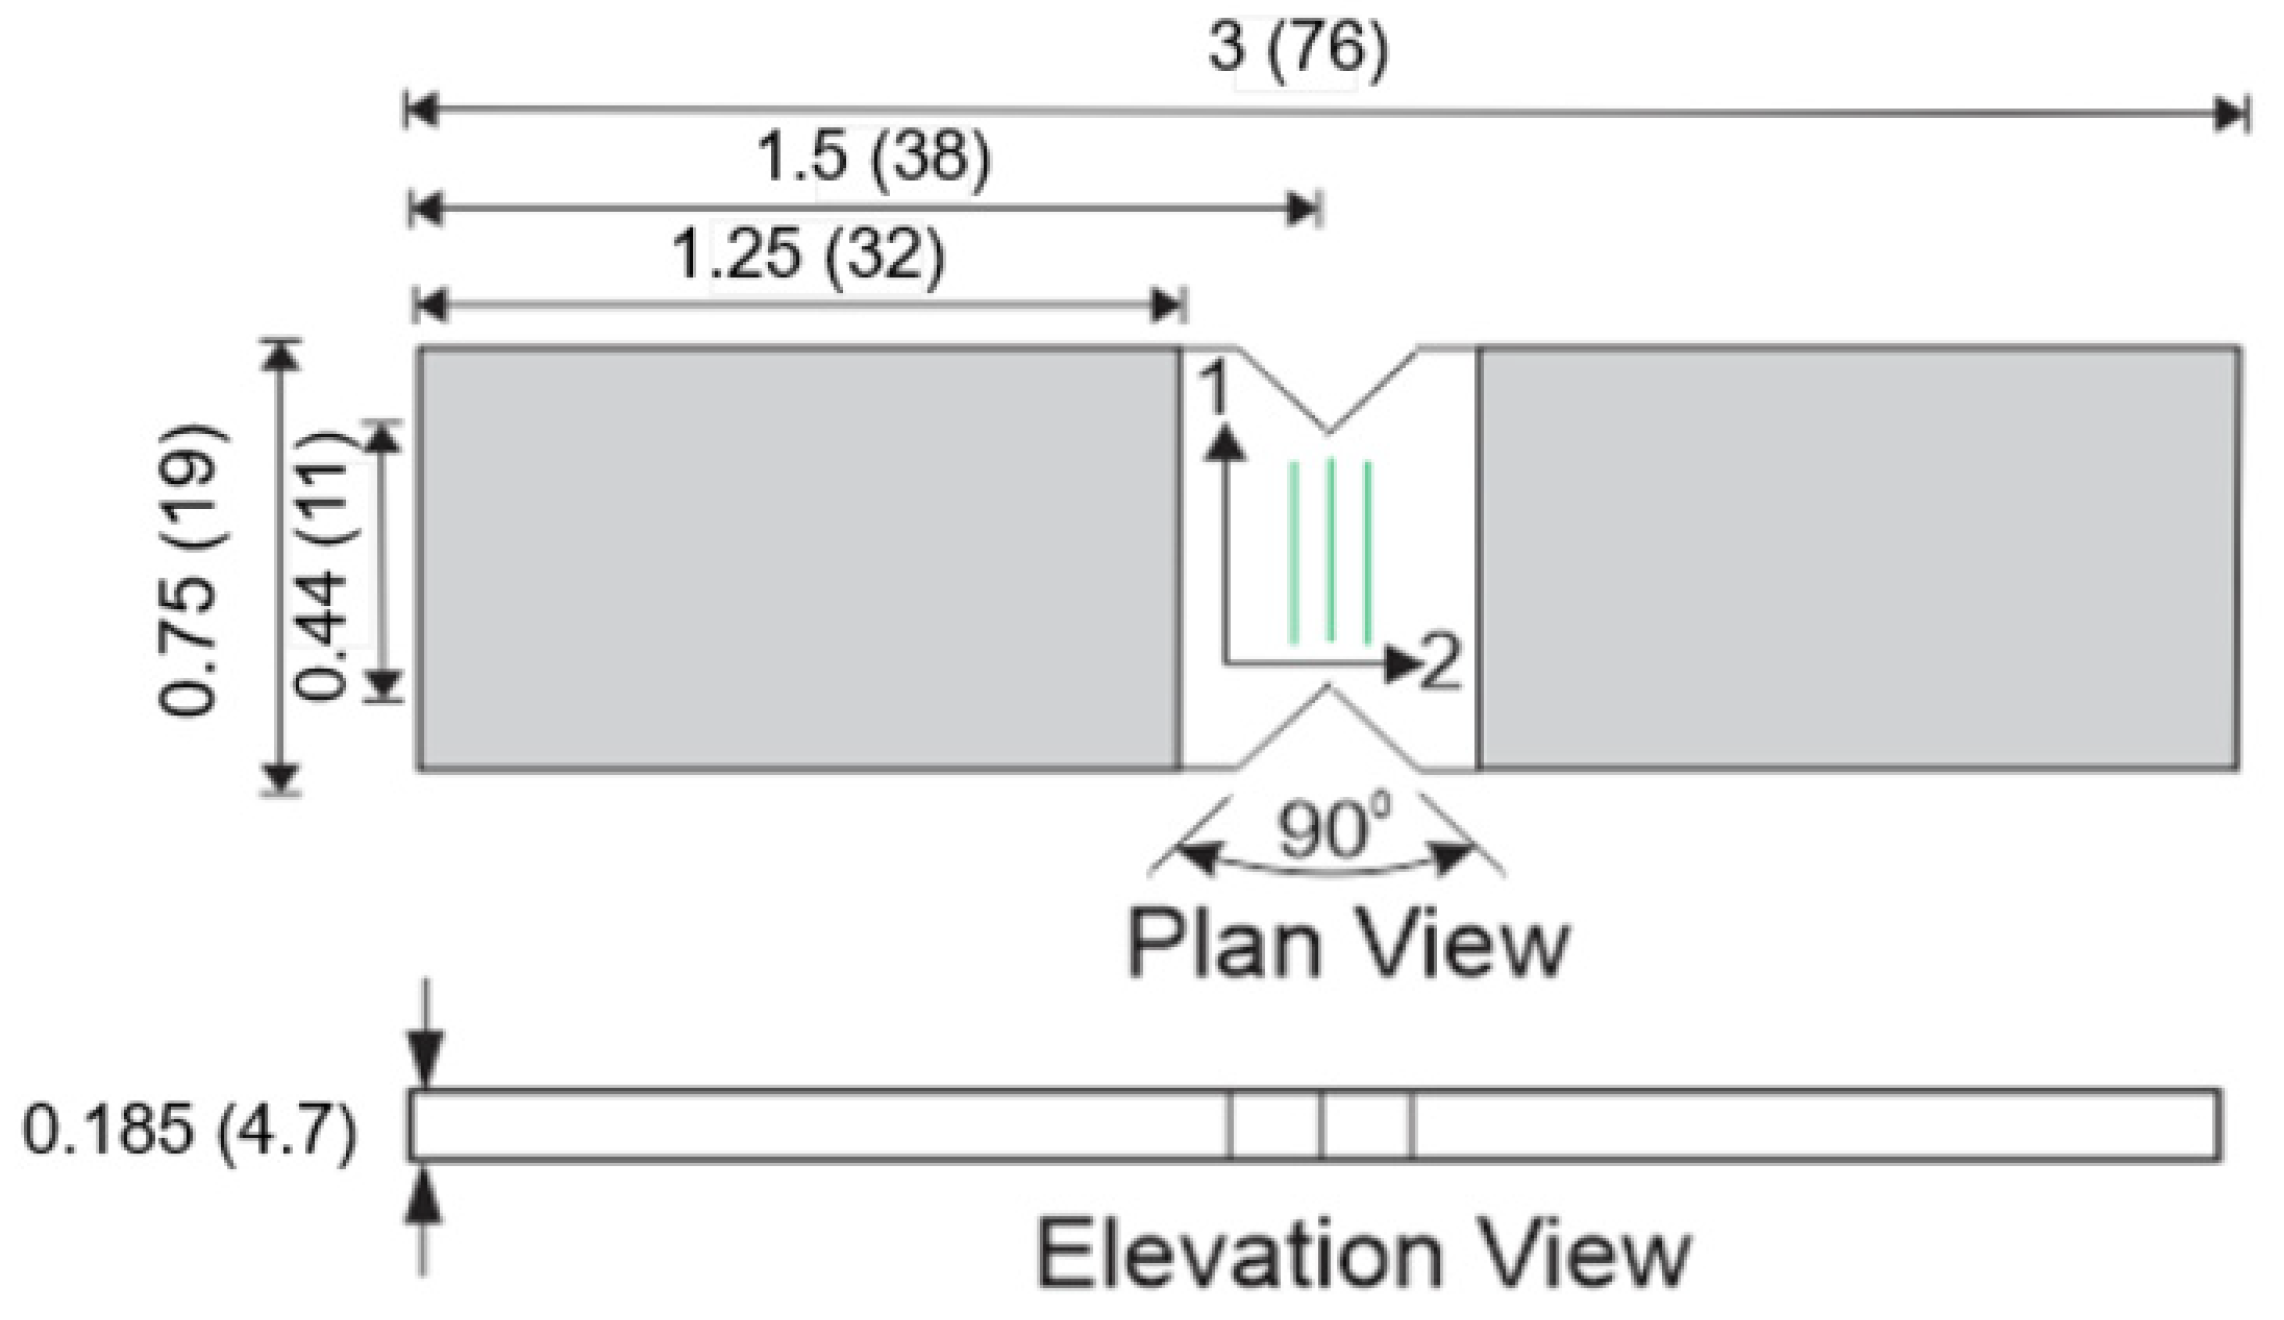
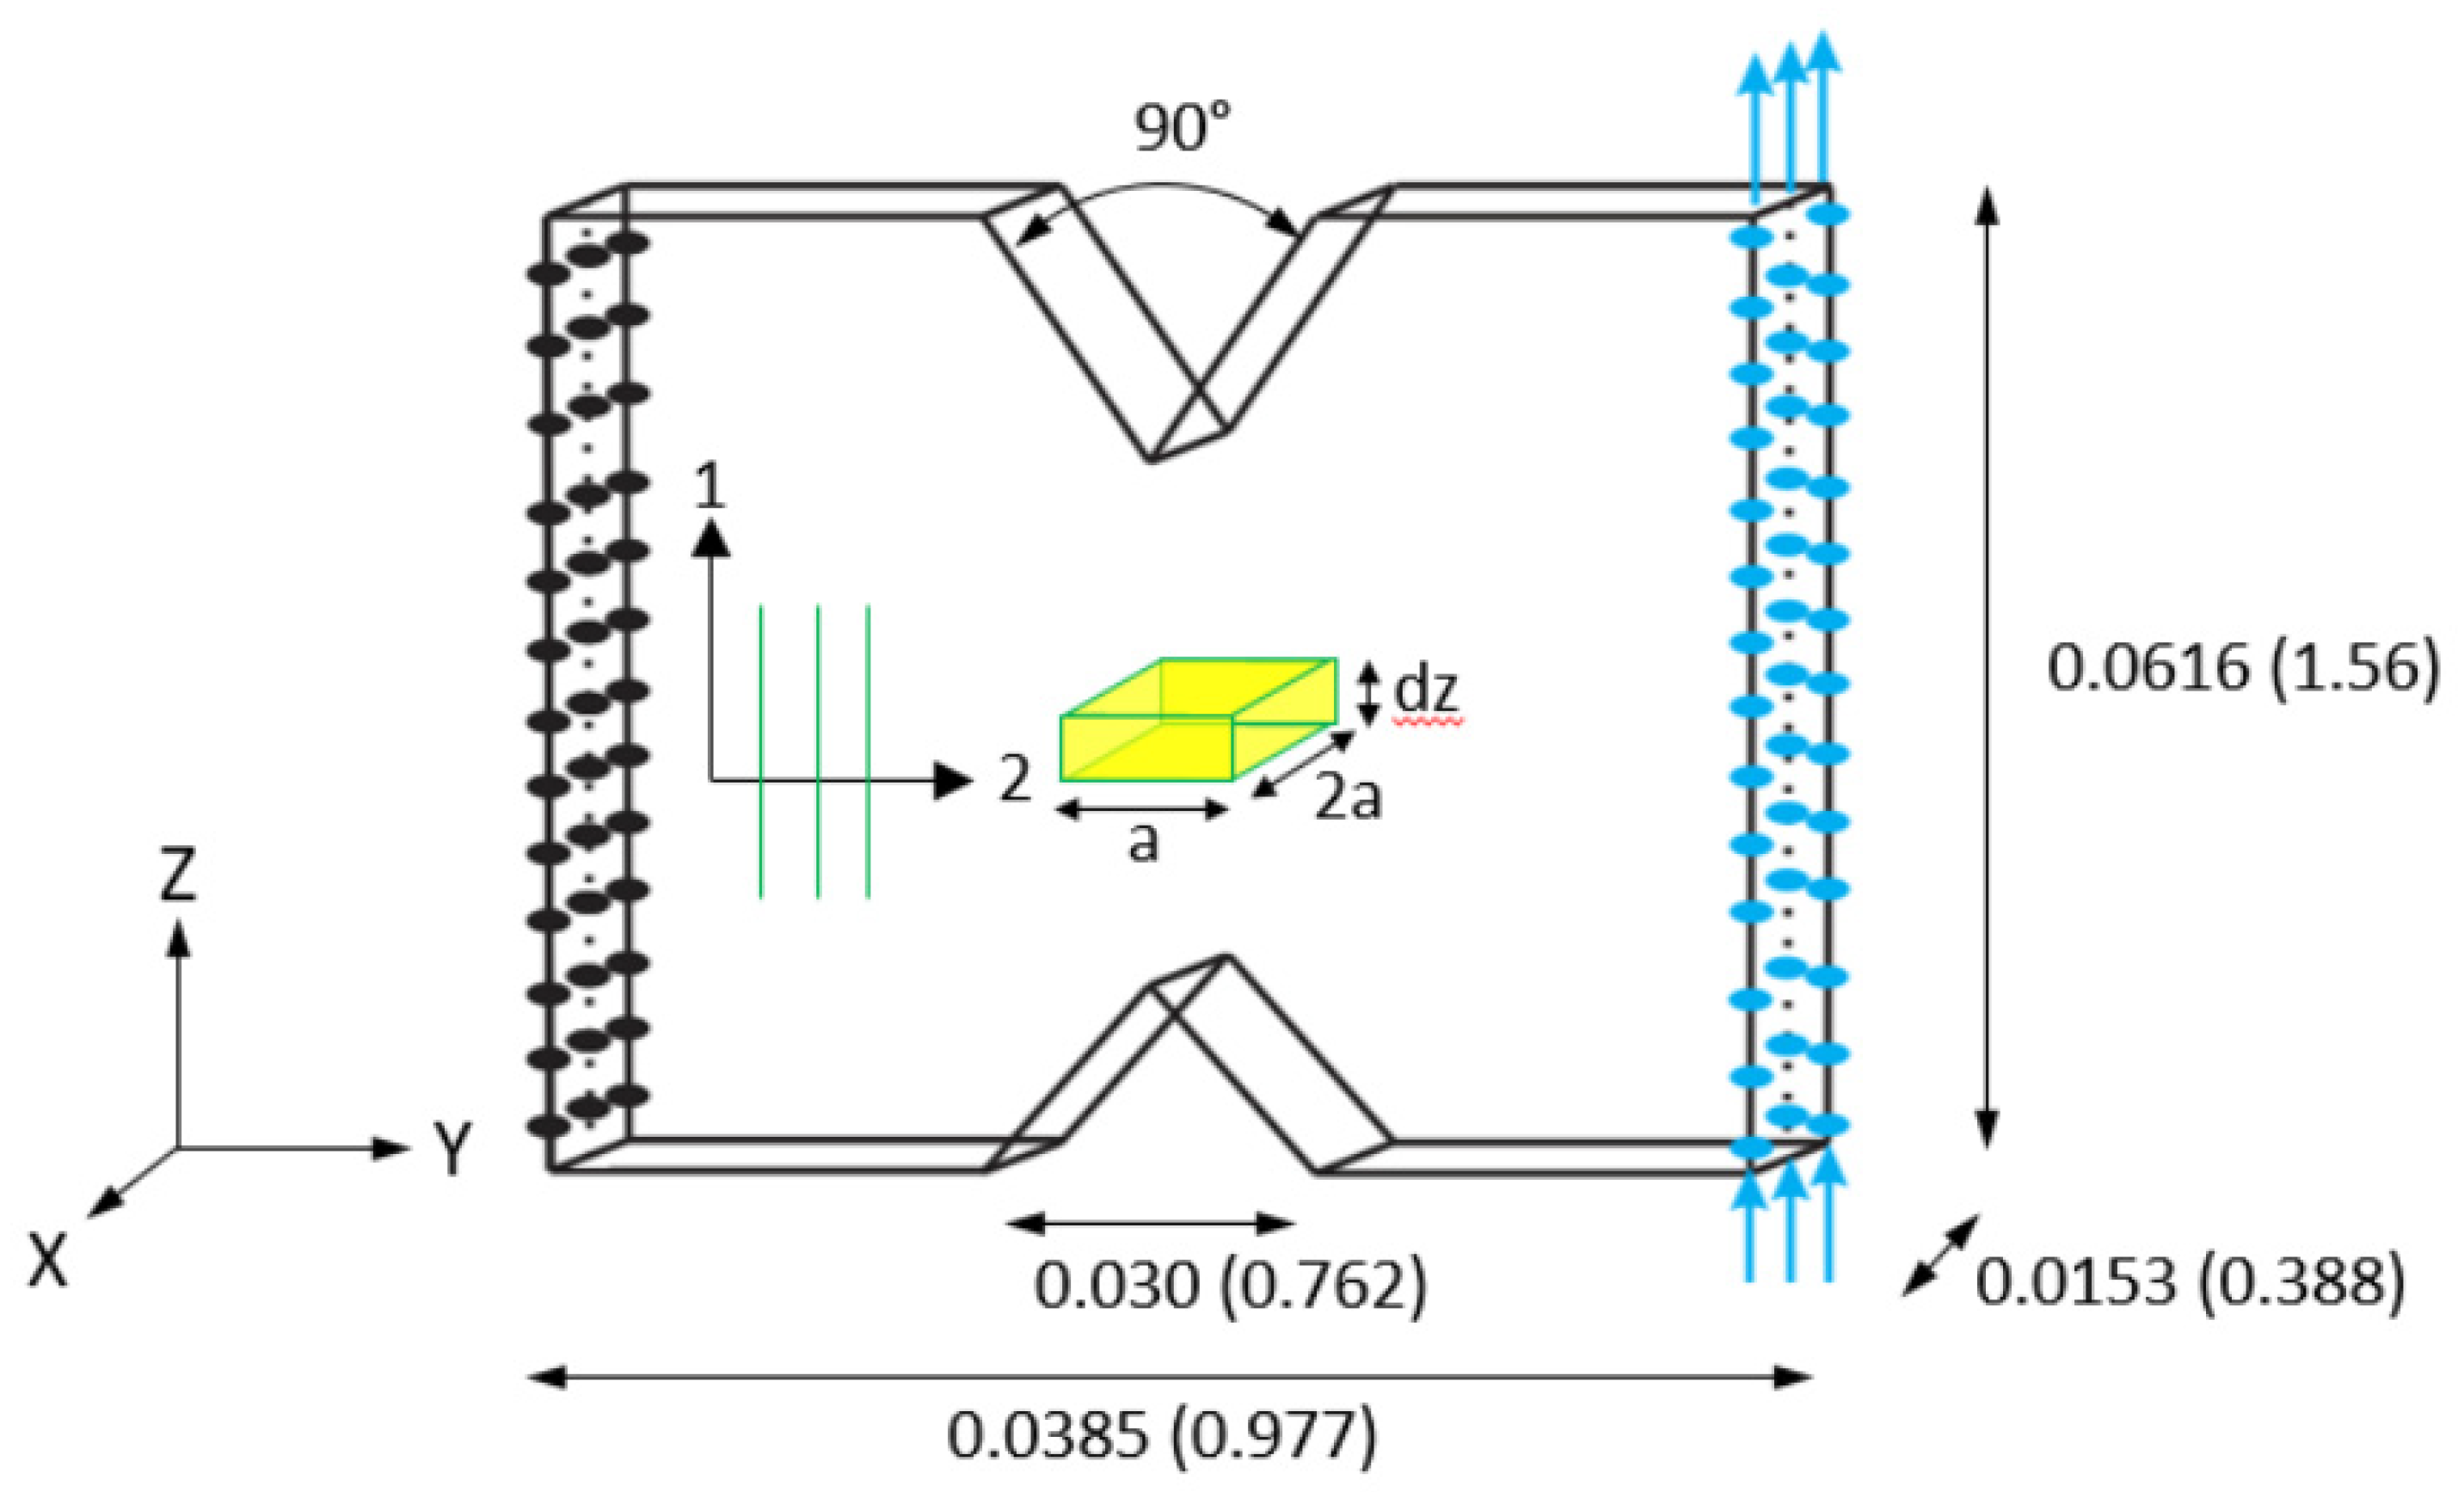
Experimental and Virtual Test Models: The experimental specimen is shown in Figure 34, with the shaded region representing the gripping area.
Figure 35 shows the geometrically equivalent virtual test specimen modeling only the gage section of the experimental specimen. The black-colored nodes in Figure 35 are restrained in the X, Y, and Z directions. The blue-colored nodes have displacements applied in the positive Z direction. There are 19,824 elements and 18,604 nodes in the FE model, with the maximum element aspect ratio as 3.3 and the minimum element aspect ratio as 2.6.
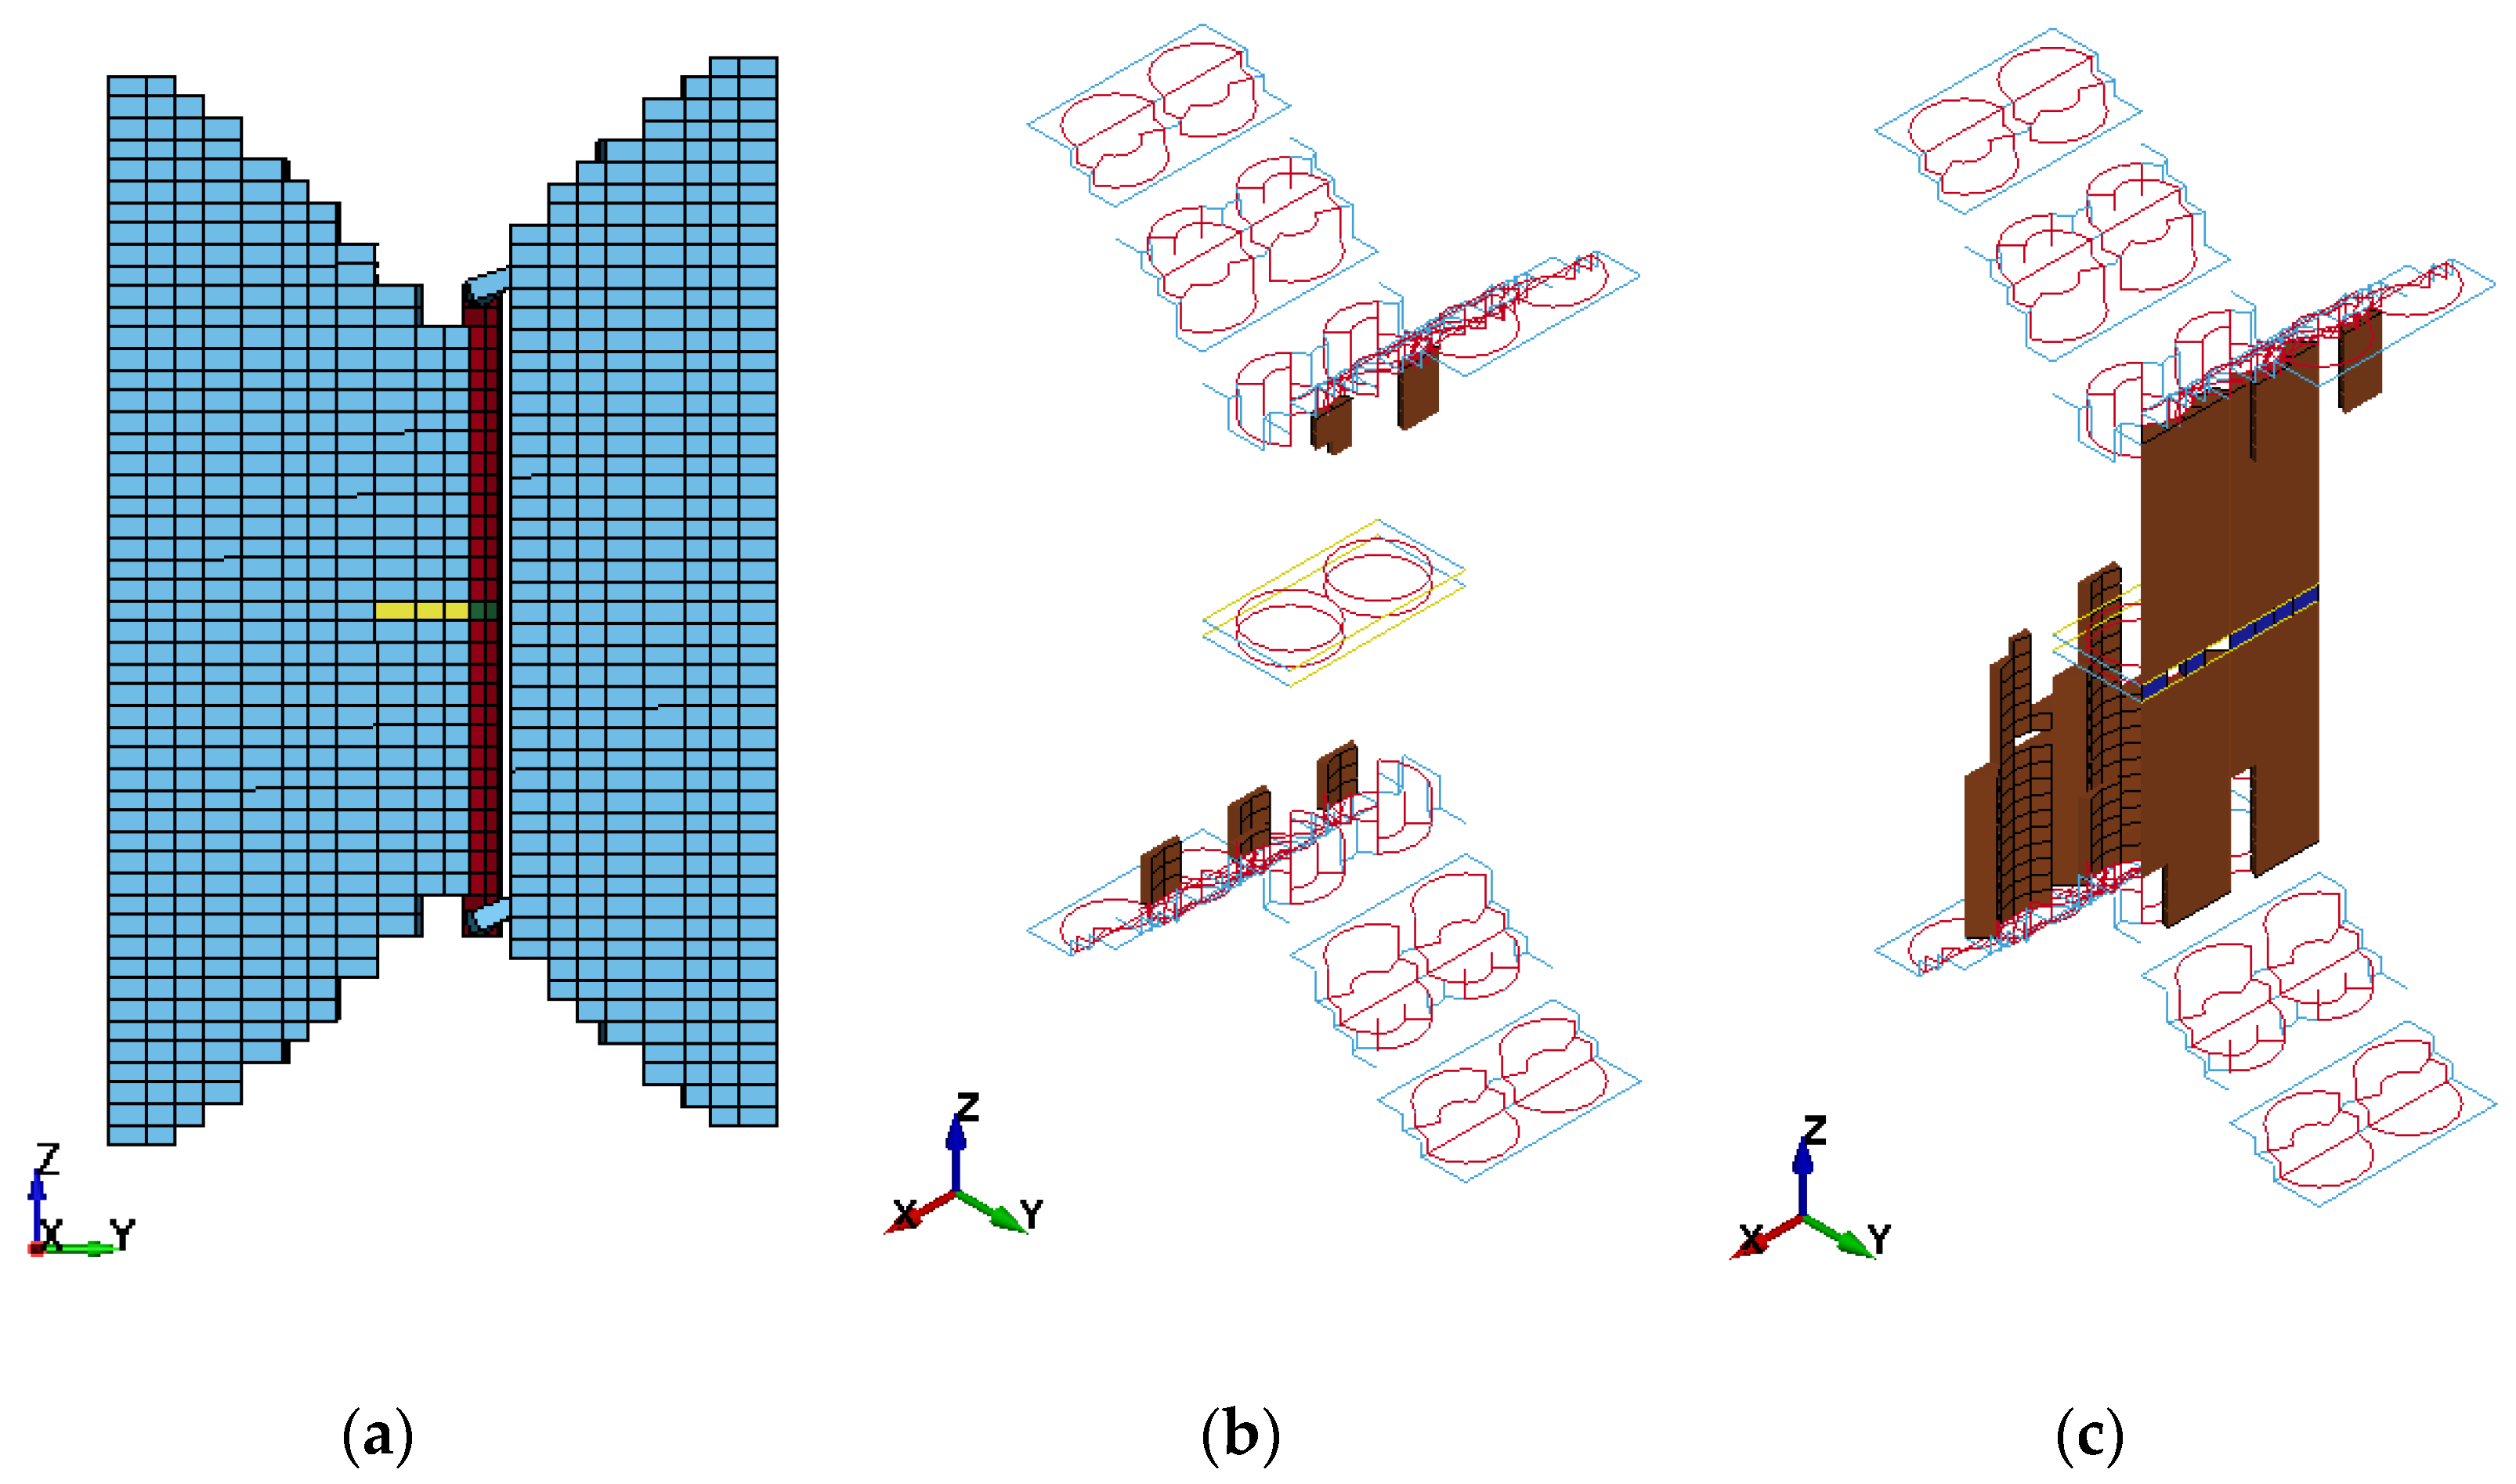
Virtual Test Results: Figure 36 shows the progression of failure in the virtual test model. Failure completely takes place in the matrix elements surrounding the carbon fibers beginning in the elements at the notch roots and progressing in a plane parallel to the direction of loading (Z direction). Ultimate failure takes place in a single plane, resembling the pattern observed in the experimental specimens [18].
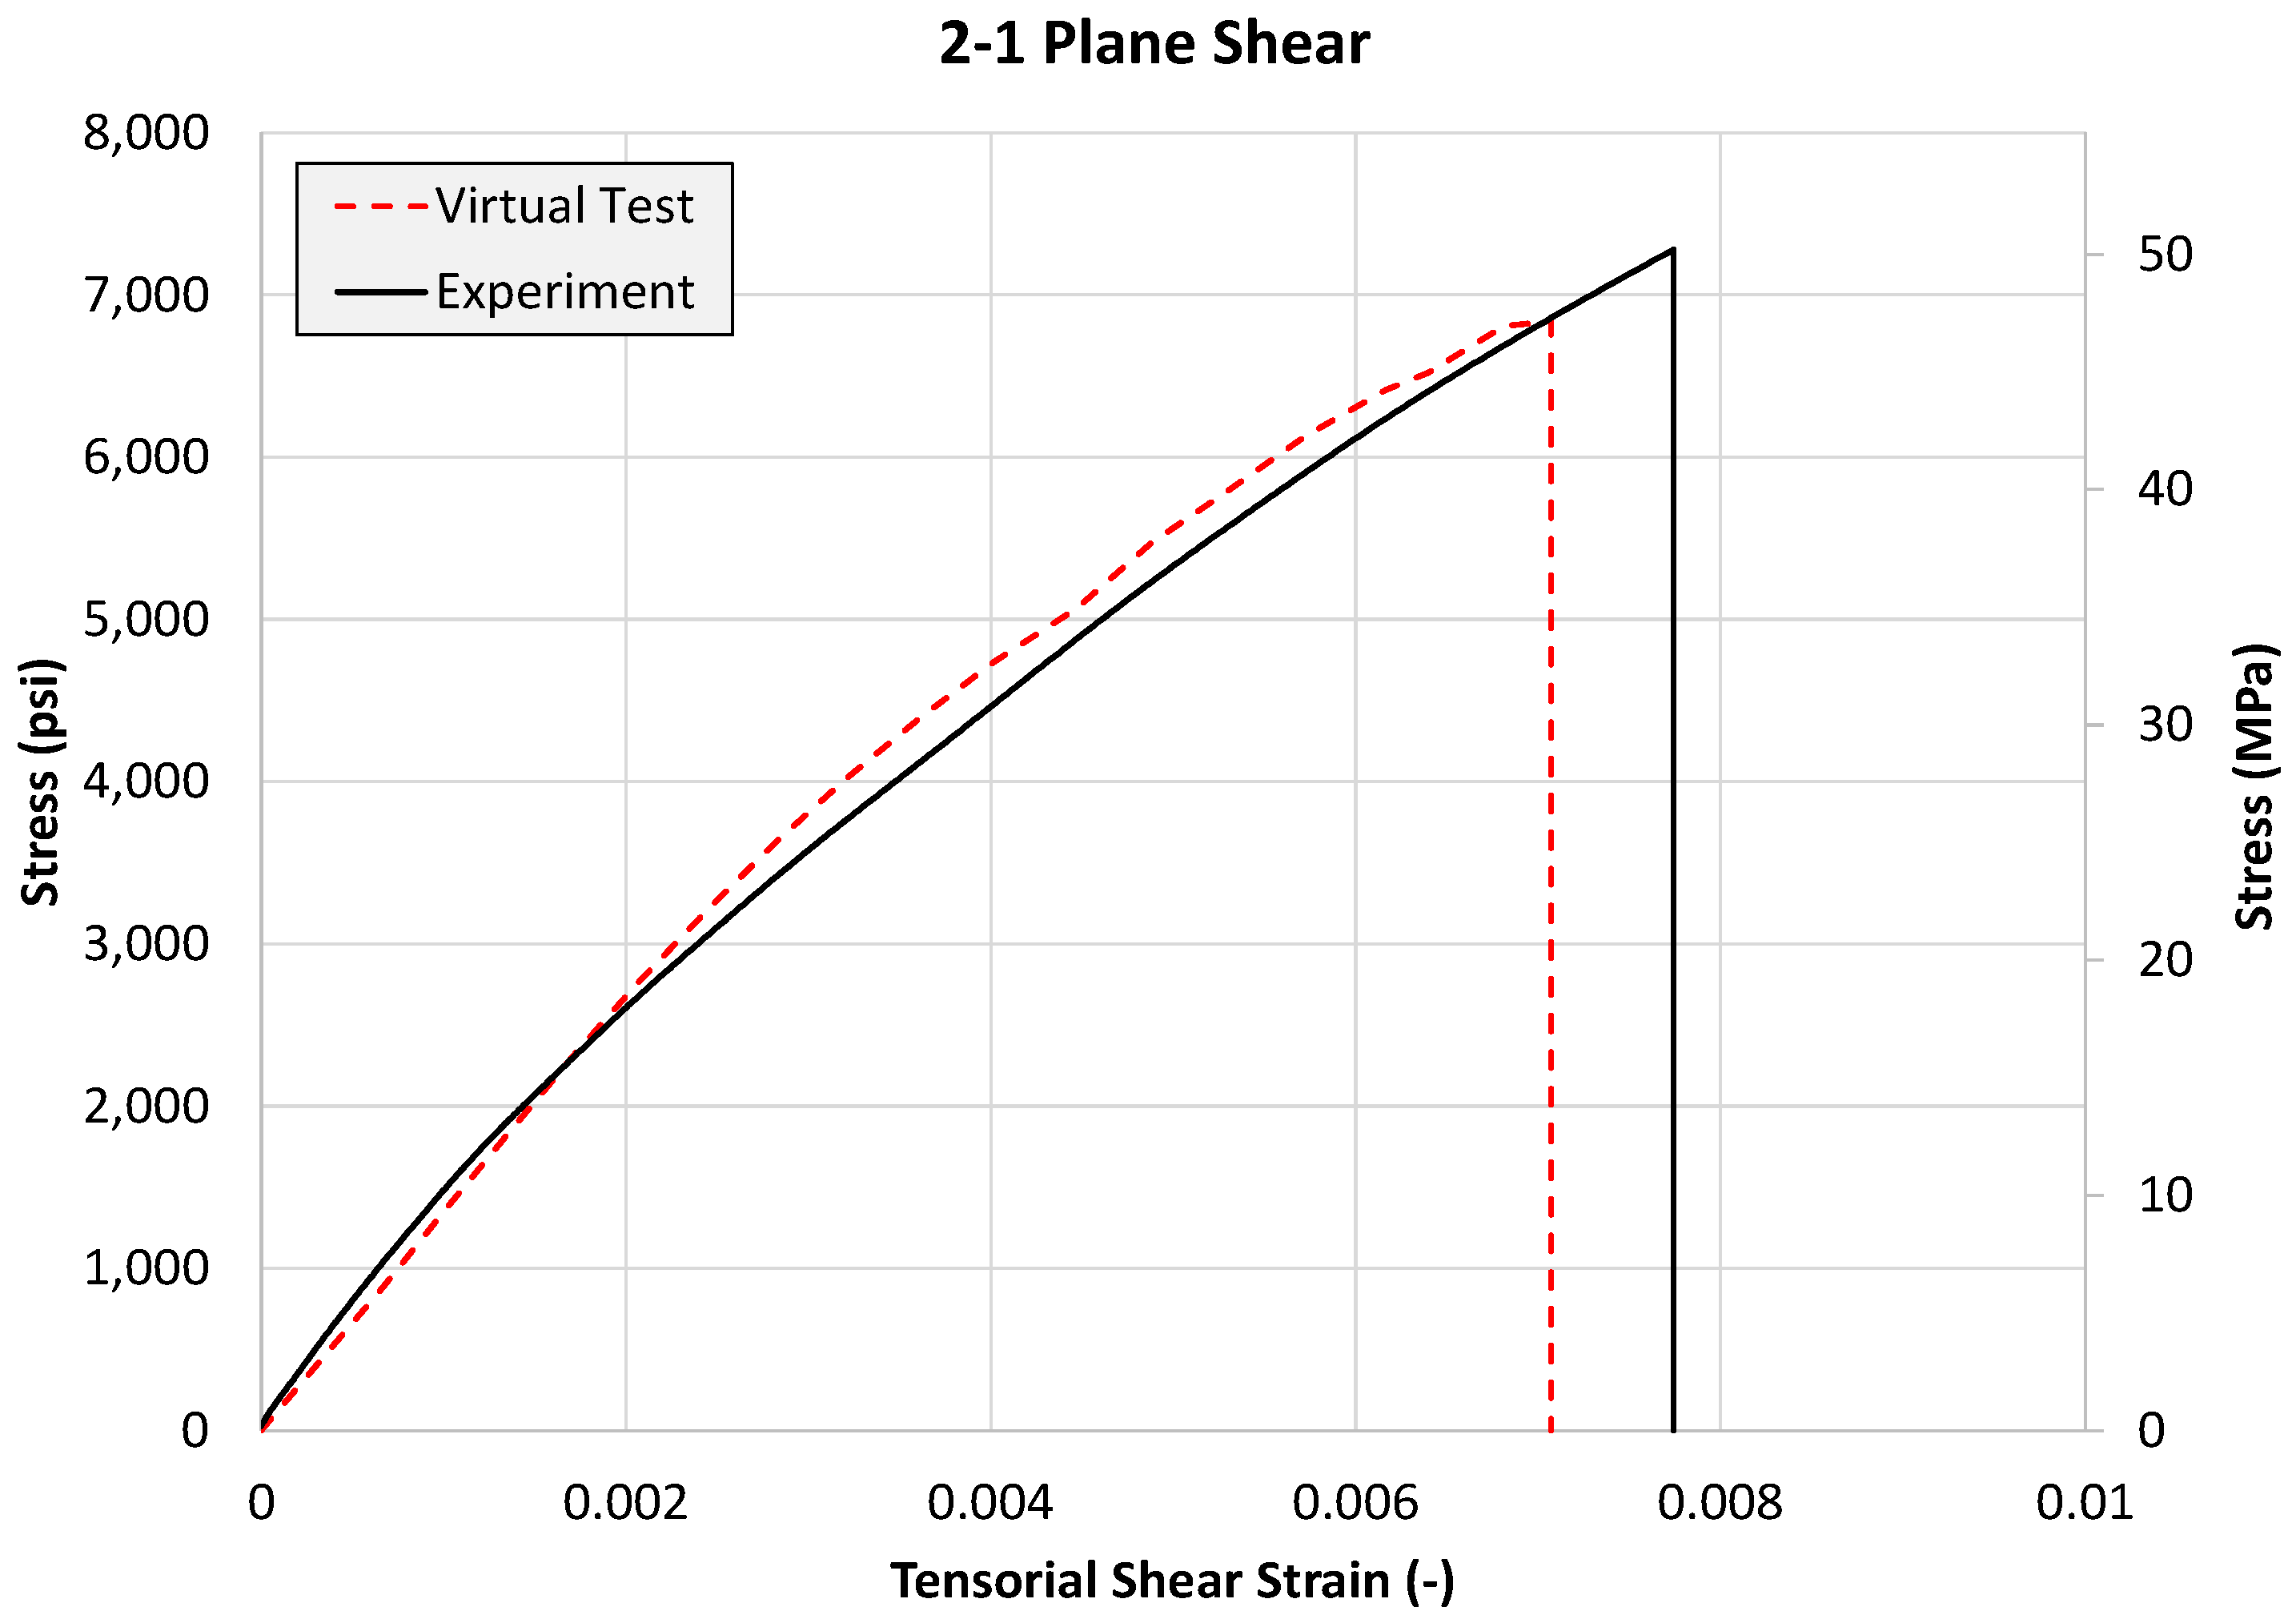
Discussions: The 2-1 plane shear test results are shown in Figure 37. The nonlinear response is captured accurately with a slight underprediction of the peak stress and the ultimate strain.

5. Concluding Remarks

In this research, a computational framework has been developed to carry out and validate the generation of the in-planar, stress-strain curves that include deformation, damage, and failure. The stress-strain curves in 1-direction tension and compression, 2-direction tension and compression, and 2–1 plane shear directions have been constructed by (a) characterizing the orthotropic, asymmetric linear behavior of the carbon fibers, and the isotropic, elasto-plastic behavior of the matrix, and (b) using the appropriate constitutive model for the two constituents to obtain the homogenized behavior of the composite via virtual testing.
There are several reasons why this approach is the preferred approach to modeling composites. First, carrying out laboratory testing of various composite constituents is sometimes extremely challenging. Specifically, for this composite, finding the elastic properties of the carbon fibers is not only difficult but yields inconsistent results [24,25,36,37]. Second, a majority of these tests are conducted in the principal material directions, thus leading to a material behavior characterization in a small region of the entire stress-strain space that the composite material is subjected to in practice. Results from exercising the developed framework show that a very suitable match is obtained when comparing the virtual testing results to experimentally obtained values.
An aspect that has not been used in the current work is modeling the fiber-matrix interface. The properties of the interface dictate the mechanisms that ultimately cause the total failure of the composite system [41]. Experimental methods such as the microbond test [42] and the single-fiber push-out test [43] can be employed to characterize the interface. However, it should be noted that the data from these experiments are often not indicative of in situ properties, and, in the context of computational modeling, numerical calibration may still be necessary to obtain valid data that can be used in a homogenized model at the continuum/structural scale.
The research presented here represents a first step toward developing a failure modeling methodology as an alternative to analytical composite failure models, e.g., such as Hashin, Tsai-Hill, etc., and the more recent ones used in the world-wide failure exercises, e.g., Puck. Rigorously calibrating and validating the constituent material models against results from physical experiments helps build confidence in the material data that has been generated. Although only results corresponding to uniaxial states of stress have been presented, the confidence derived from these results will help in simulating more complex states of stress in future work. The next step is to use the developed framework and subject the virtual test specimens to various loading combinations so as to generate a rich set of data for defining the in-planar failure surface (Figure 1a). This will be followed by using VTSS to generate the through-thickness virtual test models (Figure 1b) and validate them as best as possible using previously generated experimental results [18], then subject the virtual test specimens to various loading combinations so as to generate a rich set of data for defining the through-thickness (or, out-of-plane) failure surface.

Author Contributions

The lead author, B.K., conducted the experiments and wrote the initial draft of the paper. J.R. assisted with the experiments dealing with the F3900 matrix and developed the LS-DYNA models for the matrix using MAT_187 as a major part of his master’s dissertation work. Y.P. developed the finite element models for the composite as a major part of his master’s dissertation work. L.S. assisted with the calibration of the LS-DYNA models. S.D.R. wrote the paper. All authors have read and agreed to the published version of the manuscript.

Funding

This research was funded by the Federal Aviation Administration through Grant #12-G-001 titled “Composite Material Model for Impact Analysis” and #17-G-005 titled “Enhancing the Capabilities of MAT213 for Impact Analysis”.

Informed Consent Statement

Not applicable.

Data Availability Statement

Experimental data available from the corresponding author upon request.

Acknowledgments

Authors Khaled, Shyamsunder, Robbins, Parakhiya, and Rajan gratefully acknowledge the support of the Federal Aviation Administration. William Emmerling and Dan Cordasco, were the Technical Monitors for the grants.

Conflicts of Interest

The authors declare no conflict of interest.

Appendix A

Figure A1 shows the input stress-plastic strain curves, LCID-X, used to drive MAT_187 in this research.
Figure A1. Stress-plastic strain curves used as input to MAT_187 (a) uniaxial compression and uniaxial shear and (b) uniaxial tension and biaxial tension.
Fibers 09 00050 g0a1

References

  1. Hinton, M.; Kaddour, A. The background to the Second World-Wide Failure Exercise. J. Compos. Mater. 2012, 46, 2283–2294. [Google Scholar] [CrossRef]
  2. Kaddour, A.S.; Hinton, M. Failure Criteria for Composites. In Reference Module in Materials Science and Materials Engineering; Elsevier: Amsterdam, The Netherlands, 2017. [Google Scholar] [CrossRef]
  3. Midani, M.; Seyam, A.; Pankow, M. A Generalized Analytical Model for Predicting the Tensile Behavior of 3D Orthogonal Woven Composites Using Finite Deformation Approach. J. Text. Inst. 2018, 109, 1465–1476. [Google Scholar] [CrossRef]
  4. Harrington, J.; Hoffarth, C.; Rajan, S.D.; Goldberg, R.K.; Carney, K.S.; Dubois, P.; Blankenhorn, G. Using Virtual Tests to Complete the Description of a Three-Dimensional Orthotropic Material. J. Aerosp. Eng. 2017, 30, 04017025. [Google Scholar] [CrossRef]
  5. Vogler, T.; Kyriakides, S. Inelastic behavior of an AS4/PEEK composite under combined transverse compression and shear. Part I: Experiments. Int. J. Plast. 1999, 15, 783–806. [Google Scholar] [CrossRef]
  6. Zinoviev, P.A.; Tsvetkov, S.V.; Kulish, G.G.; van den Berg, R.W.; Van Schepdael, L.J.M.M. The behavior of high-strength unidirectional composites under tension with superposed hydrostatic pressure. Compos. Sci. Technol. 2001, 61, 1151–1161. [Google Scholar] [CrossRef]
  7. Hine, P.; Duckett, R.; Kaddour, A.; Hinton, M.; Wells, G. The effect of hydrostatic pressure on the mechanical properties of glass fibre/epoxy unidirectional composites. Compos. Part A Appl. Sci. Manuf. 2005, 36, 279–289. [Google Scholar] [CrossRef]
  8. Cai, D.; Zhou, G.; Silberschmidt, V.V. Effect of through-thickness compression on in-plane tensile strength of glass/epoxy composites: Experimental study. Polym. Test. 2016, 49, 1–7. [Google Scholar] [CrossRef] [Green Version]
  9. Daniel, I.M.; Luo, J.-J.; Schubel, P.M.; Werner, B.T. Interfiber/interlaminar failure of composites under multi-axial states of stress. Compos. Sci. Technol. 2009, 69, 764–771. [Google Scholar] [CrossRef]
  10. Canal, L.P.; Segurado, J.; LLorca, J. Failure surface of epoxy-modified fiber-reinforced composites under transverse tension and out-of-plane shear. Int. J. Solids Struct. 2009, 46, 2265–2274. [Google Scholar] [CrossRef] [Green Version]
  11. Melro, A.; Camanho, P.; Pires, F.; Pinho, S. Micromechanical analysis of polymer composites reinforced by unidirectional fibres: Part II—Micromechanical analyses. Int. J. Solids Struct. 2013, 50, 1906–1915. [Google Scholar] [CrossRef] [Green Version]
  12. Melro, A.R.; Camanho, P.P.; Andrade Pires, F.M.; Pinho, S.T. Micromechanical analysis of polymer composites reinforced by unidirectional fibres: Part I—Constitutive modelling. Int. J. Solids Struct. 2013, 50, 1897–1905. [Google Scholar] [CrossRef] [Green Version]
  13. Totry, E.; González, C.; LLorca, J. Prediction of the failure locus of C/PEEK composites under transverse compression and longitudinal shear through computational micromechanics. Compos. Sci. Technol. 2008, 68, 3128–3136. [Google Scholar] [CrossRef] [Green Version]
  14. Vaughan, T.J. Micromechanical Modelling of Damage and Failure in Fibre Reinforced Composites under Loading in the Transverse Plane. Ph.D. Dissertation, University of Limerick, Limerick, Ireland, 2011. [Google Scholar]
  15. Goldberg, R.K.; Carney, K.S.; DuBois, P.; Hoffarth, C.; Khaled, B.; Shyamsunder, L.; Rajan, S.D.; Blankenhorn, G. Implementation of a tabulated failure model into a generalized composite material model. J. Compos. Mater. 2018, 52, 3445–3460. [Google Scholar] [CrossRef]
  16. Shyamsunder, L.; Khaled, B.; Rajan, S.D.; Blankenhorn, G. Improving failure sub-models in an orthotropic plasticity-based material model. J. Compos. Mater. 2020. [Google Scholar] [CrossRef]
  17. Ansys-LST. Available online: http://lstc.com/ (accessed on 16 October 2020).
  18. Khaled, B.; Shyamsunder, L.; Hoffarth, C.; Rajan, S.D.; Goldberg, R.K.; Carney, K.S.; DuBois, P.; Blankenhorn, G. Experimental characterization of composites to support an orthotropic plasticity material model. J. Compos. Mater. 2018, 52, 1847–1872. [Google Scholar] [CrossRef]
  19. Achstetter, T. Development of A Composite Shell-Element Model for Impact Applications. Ph.D. Dissertation, George Mason University, Fairfax, VA, USA, 2019. [Google Scholar]
  20. Hoffarth, C. A Generalized Orthotropic Elasto-Plastic Material Model for Impact Analysis. Ph.D. Dissertation, Arizona State University, Tempe, AZ, USA, 2016. [Google Scholar]
  21. Hoffarth, C.; Rajan, S.D.; Goldberg, R.K.; Revilock, D.; Carney, K.S.; DuBois, P.; Blankenhorn, G. Implementation and validation of a three-dimensional plasticity-based deformation model for orthotropic composites. Compos. Part A Appl. Sci. Manuf. 2016, 91, 336–350. [Google Scholar] [CrossRef]
  22. Khaled, B. Experimental Characterization and Finite Element Modeling of Composites to Support a Generalized Orthotropic Elasto-Plastic Damage Material Model for Impact Analysis. Ph.D. Dissertation, Arizona State University, Tempe, AZ, USA, 2019. [Google Scholar]
  23. Shyamsunder, L.; Khaled, B.; Rajan, S.D.; Goldberg, R.K.; Carney, K.S.; DuBois, P.; Blankenhorn, G. Implementing deformation, damage, and failure in an orthotropic plastic material model. J. Compos. Mater. 2020, 54, 463–484. [Google Scholar] [CrossRef]
  24. Waterbury, M.C.; Drzal, L.T. On the Determination of Fiber Strengths by ln-Situ Fiber Strength Testing. J. Compos. Technol. Res. 1991, 13, 22–28. [Google Scholar]
  25. Thomason, J.L.; Kalinka, G. A technique for the measurement of reinforcement fibre tensile strength at sub-millimetre gauge lengths. Compos. Part A Appl. Sci. Manuf. 2001, 32, 85–90. [Google Scholar] [CrossRef] [Green Version]
  26. DuBois, P.; Feucht, M.; Haufe, A.; Kolling, S. A Generalized Damage and Failure Formulation for SAMP; Keynote: Ulm, Germany, 2006. [Google Scholar]
  27. Kolling, S.; Haufe, A.; Feucht, M.; DuBois, P. SAMP-1: A Semi-Analytical Model for the Simulation of Polymers; LS-DYNA User Forum: Bamberg, Germany, 2005; p. 27. Available online: https://www.dynamore.de/en/downloads/papers/dynamore/de/download/papers/forum05/samp-1-a-semi-analytical-model-for-the-simulation (accessed on 20 July 2021).
  28. Robbins, J. Experimental Characterization of the Constituent Materials of a Composite for Use in a Finite Element Model. Master’s Thesis, Arizona State University, Tempe, AZ, USA, 2019. [Google Scholar]
  29. ASTM D20 Committee. Test. Method for Tensile Properties of Plastics; ASTM International: West Conshohocken, PA, USA, 2014. [Google Scholar]
  30. ASTM D30 Committee. Test. Method for Compressive Properties of Polymer Matrix Composite Materials Using a Combined Loading Compression (CLC) Test. Fixture; ASTM International: West Conshohocken, PA, USA, 2016. [Google Scholar]
  31. Littell, J. The Experimental and Analytical Characterization of the Mechanical Response for Triaxial Braided Composite Materials. Ph.D. Dissertation, University of Akron, Akron, OH, USA, 2008. [Google Scholar]
  32. Vic-3D v7.2.6; Correlated Solutions, Inc.: Irmo, SC, USA, 2016.
  33. Parakhiya, Y. Framework for Generating Failure Surface through Virtual Testing of Unidirectional Polymeric Composite. Master’s Thesis, Arizona State University, Tempe, AZ, USA, 2020. [Google Scholar]
  34. Ataabadi, A.K.; Hosseini-Toudeshky, H.; Rad, A.Z. Experimental and analytical study on fiber-kinking failure mode of laminated composites. Compos. Part B 2014, 61, 84–93. [Google Scholar] [CrossRef]
  35. Schultheisz, C.R.; Waas, A.M. Compressive failure of composites, part I: Testing and micromechanical theories. Prog. Aerosp. Sci. 1996, 32, 1–42. [Google Scholar] [CrossRef]
  36. Herrάez, M.; Bergan, A.; Gonzalez, C.; Lopes, C. Modeling Fiber Kinking at the Microscale and Mesoscale; NASA Technical Publication: Washington, DC, USA, 2018. [Google Scholar]
  37. Ueda, M.; Saito, W.; Imahori, R.; Kanazawa, D.; Jeong, T.-K. Longitudinal direct compression test of a single carbon fiber in a scanning electron microscope. Compos. Part A Appl. Sci. Manuf. 2014, 67, 96–101. [Google Scholar] [CrossRef]
  38. Holt, N. Experimental and Simulation Validation Tests for MAT 213. Master’s Thesis, Arizona State University, Tempe, AZ, USA, 2018. [Google Scholar]
  39. Gonzalez, C.; Llorca, J. Mechanical behavior of unidirectional fiber-reinforced polymers under transverse compression: Microscopic mechanisms and modeling. Compos. Sci. Technol. 2007, 67, 2795–2806. [Google Scholar] [CrossRef]
  40. Hu, Y.; Kar, N.; Nutt, S. Transverse compression failure of unidirectional composites. Polym. Compos. 2015, 36, 756–766. [Google Scholar] [CrossRef]
  41. Totry, E.; González, C.; LLorca, J. Failure locus of fiber-reinforced composites under transverse compression and out-of-plane shear. Compos. Sci. Technol. 2008, 68, 829–839. [Google Scholar] [CrossRef] [Green Version]
  42. Sockalingam, S.; Nilakantan, G. Fiber-Matrix Interface Characterization through the Microbond Test. Int. J. Aeronaut. Space Sci. 2012, 13, 282–295. [Google Scholar] [CrossRef] [Green Version]
  43. Zhang, L.; Ren, C.; Zhou, C.; Xu, H.; Jin, X. Single fiber push-out characterization of interfacial mechanical properties in unidirectional CVI-C/SiC composites by the nano-indentation technique. Appl. Surf. Sci. 2015, 357, 1427–1433. [Google Scholar] [CrossRef]
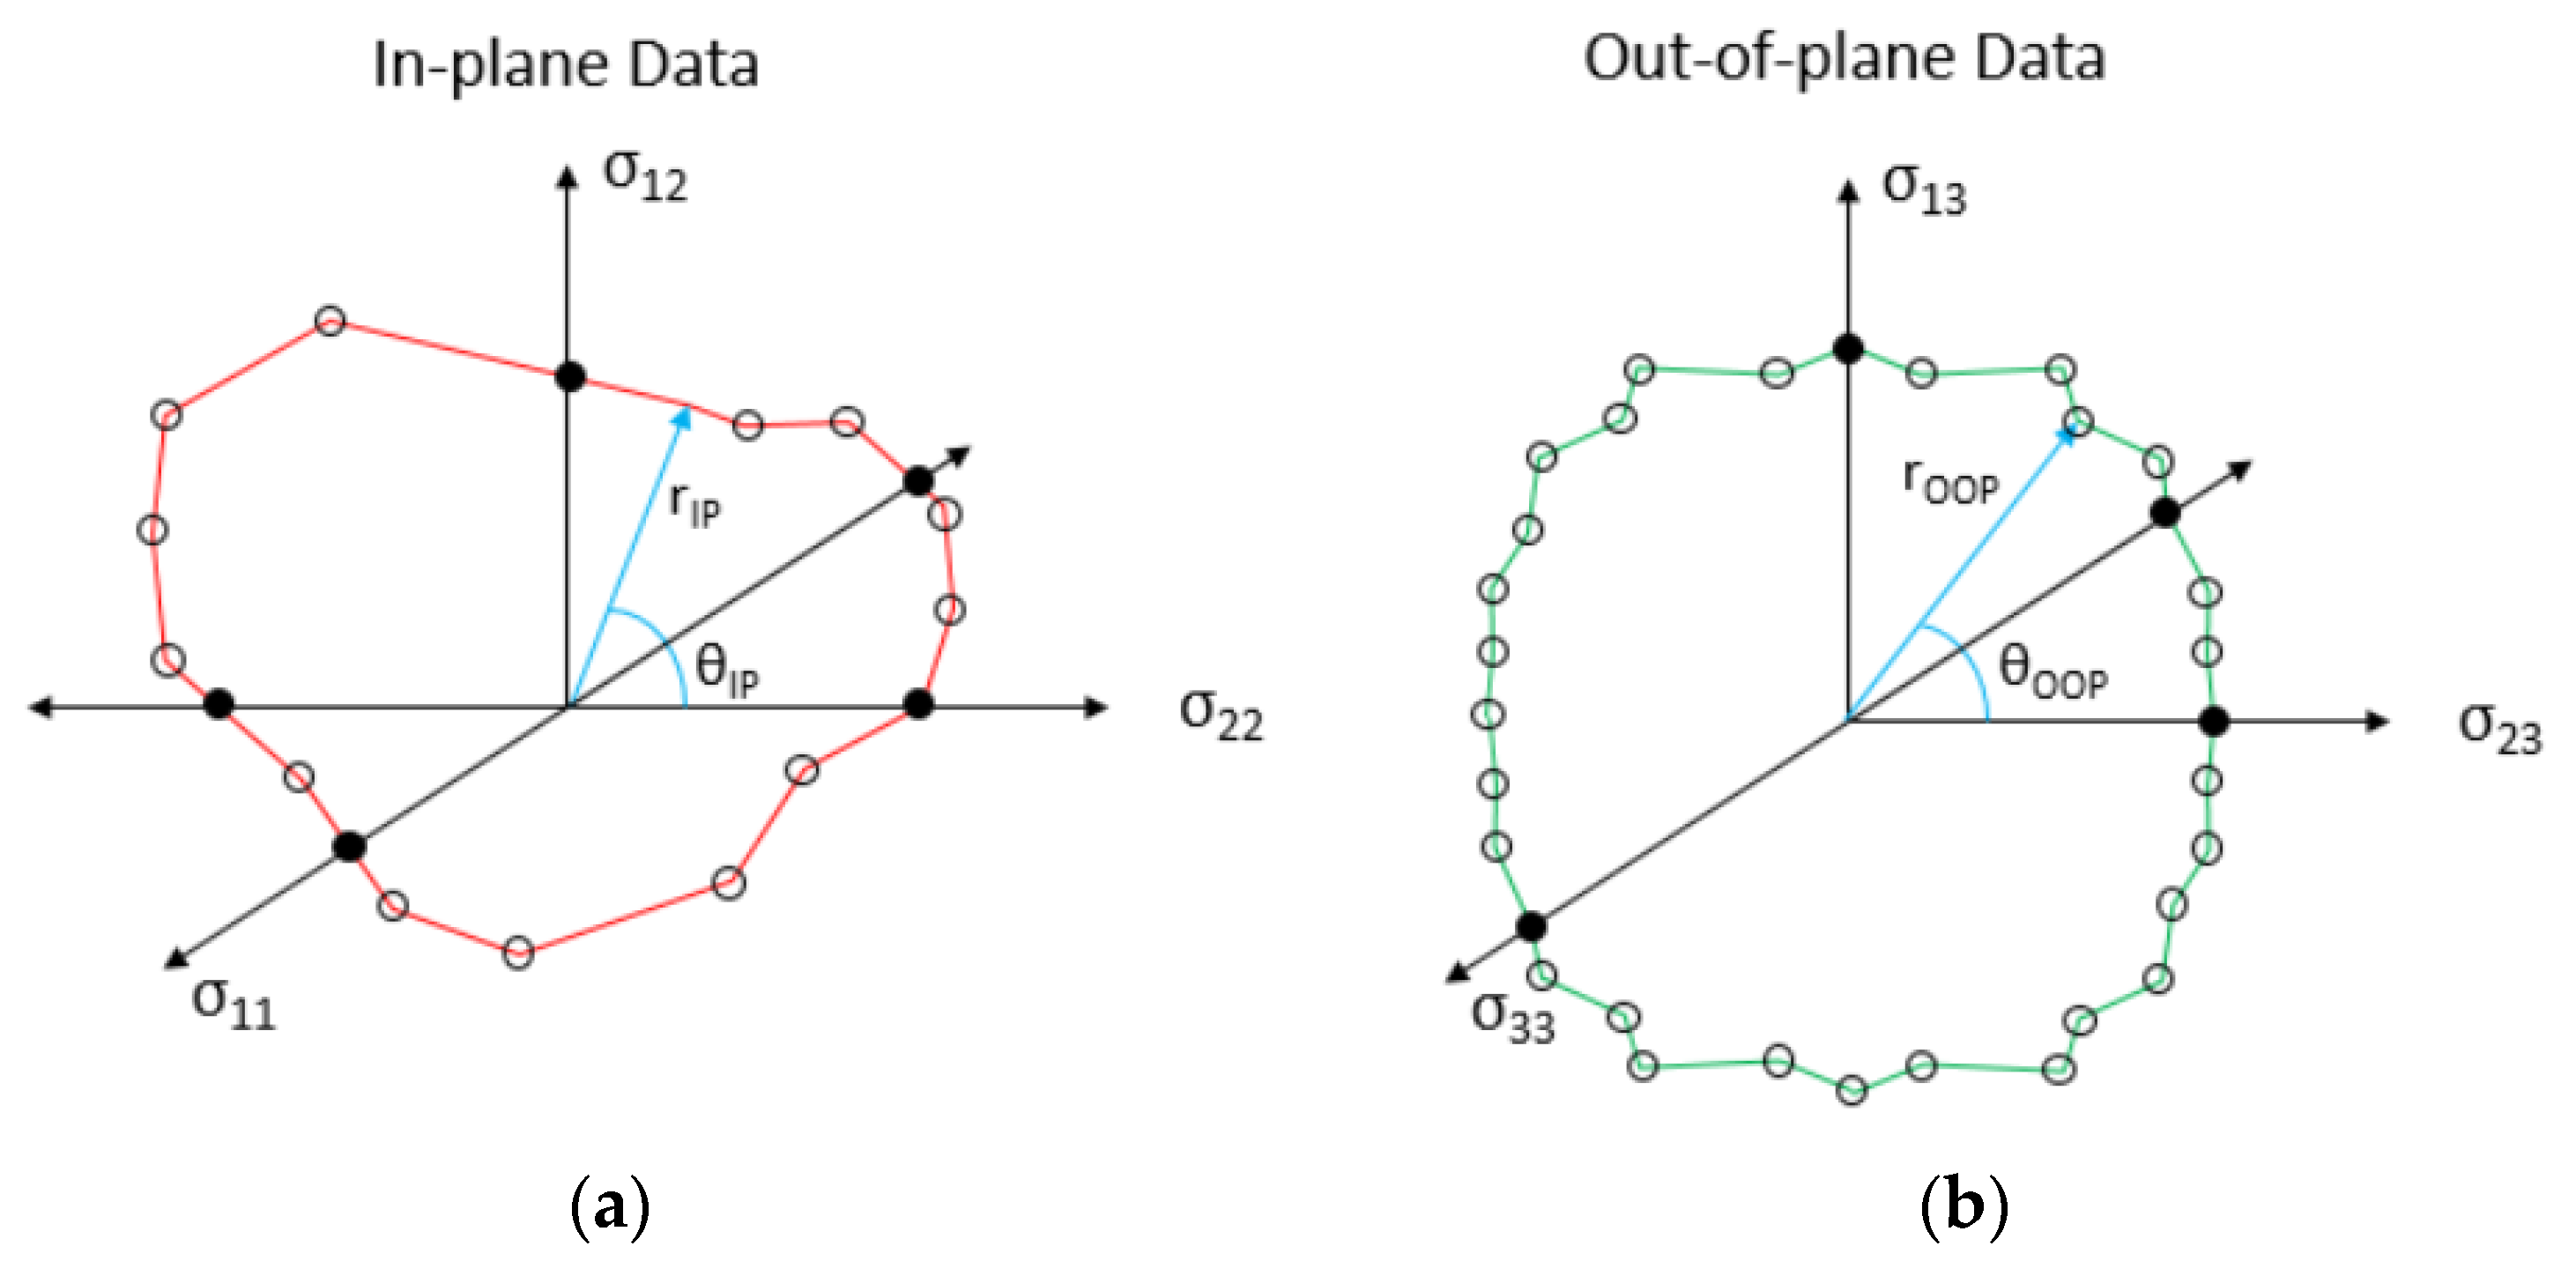
Figure 1. Point cloud schematic representation of (a) in-plane and (b) out-of-plane failure surfaces.
Fibers 09 00050 g001
Figure 2. Cross-section of the T800/F3900 composite panel (a) optical microscope image (b) SEM image. Computed volume fraction is 60%.
Fibers 09 00050 g002
Figure 3. Typical uniaxial tension specimen geometry and layout. Dimensions provided in inches (millimeters). Specimens had a nominal thickness of 0.147 in (3.73 mm).
Fibers 09 00050 g003
Figure 4. Typical failed uniaxial tension sample.
Fibers 09 00050 g004
Figure 5. True stress-strain data from multiple replicates of the uniaxial tension tests.
Fibers 09 00050 g005
Figure 6. (a) Typical specimen geometry and layout for uniaxial compression specimens and (b) CLC test fixture in between compression platens. Dimensions provided in inches (millimeters). Specimens had a nominal thickness of 0.147 in (3.73 mm).
Fibers 09 00050 g006
Figure 7. Typical failed uniaxial compression specimen showing significant crazing and permanent deformation in the gage section.
Fibers 09 00050 g007
Figure 8. Evolution of longitudinal strain field ( ε y y ) from typical uniaxial compression test.
Fibers 09 00050 g008
Figure 9. True stress-strain data from multiple replicates of the uniaxial compression tests.
Fibers 09 00050 g009
Figure 10. (a)Typical specimen geometry and layout for torsion specimens. Dimensions provided in inches (millimeters), (b) speckled specimen epoxied inside of stainless-steel collars, and (c) specimen inside of test frame mechanically gripped using set screws.
Fibers 09 00050 g010
Figure 11. Evolution of the shear strain field ( ε x y ) from typical torsion test, including failure of specimen.
Fibers 09 00050 g011
Figure 12. Stress-strain data from two replicates of the torsion tests.
Fibers 09 00050 g012
Figure 13. (Left): optical micrograph of the T800/F3900 unidirectional composite showing multiple laminae. (Right): RUC where red elements represent the T800 fiber and blue elements represent the F3900 matrix.
Fibers 09 00050 g013
Figure 14. VTSS model terminology (a) RUC geometric parameters and (b) stacking of multiple RUC.
Fibers 09 00050 g014
Figure 15. Results of calibration process used to calibrate best values of RBCFAC and NUEP using 2-direction compression test.
Fibers 09 00050 g015
Figure 16. Results of numerical calibration to obtain longitudinal compression modulus of T800S carbon fiber.
Fibers 09 00050 g016
Figure 17. T800S/F3900 1-direction tension experimental test specimen. Dimensions provided in inches (millimeters).
Fibers 09 00050 g017
Figure 18. T800S/F3900 1-direction tension virtual test specimen schematic. Dimensions provided in inches (millimeters).
Fibers 09 00050 g018
Figure 19. Typical cross-section of 1-direction tension virtual test specimen with spatial axes and corresponding material axes. Dimensions provided in inches (millimeters).
Fibers 09 00050 g019
Figure 20. The 1-direction tension virtual test specimen at the end of simulation (a) failure of fiber elements and (b) failure of matrix elements. “Loading” edge is the right side, while “fixed” edge is the left side.
Fibers 09 00050 g020
Figure 21. Stress-strain response from virtual test specimens compared with experimental response.
Fibers 09 00050 g021
Figure 22. T800S/F3900 1-direction compression experimental test specimen. Dimensions provided in inches (millimeters).
Fibers 09 00050 g022
Figure 23. T800S/F3900 1-direction compression virtual test specimen schematic. Dimensions provided in inches (millimeters).
Fibers 09 00050 g023
Figure 24. The 1-direction compression virtual test specimen at the end of simulation (a) failure of the full model, (b) failure of fiber elements, and (c) failure of matrix elements. “Loading” edge is the top side, while “fixed” edge is the bottom side.
Fibers 09 00050 g024
Figure 25. Stress-strain response from virtual test specimens compared with experimental response.
Fibers 09 00050 g025
Figure 26. T800S/F3900 2-direction tension experimental test specimen. Dimensions provided in inches (millimeters).
Fibers 09 00050 g026
Figure 27. T800S/F3900 2-direction tension virtual test specimen schematic. Dimensions provided in inches (millimeters).
Fibers 09 00050 g027
Figure 28. The 2-direction tension virtual test specimen (a) initiation of failure in the matrix surrounding fiber and (b) ultimate failure of the virtual test specimen.
Fibers 09 00050 g028aFibers 09 00050 g028b
Figure 29. Stress-strain response from virtual test specimens compared with experimental response.
Fibers 09 00050 g029
Figure 30. T800S/F3900 2-direction compression experimental test specimen. Dimensions provided in inches (millimeters).
Fibers 09 00050 g030
Figure 31. T800S/F3900 2-direction compression virtual test specimen schematic. Dimensions provided in inches (millimeters).
Fibers 09 00050 g031
Figure 32. The 2-direction compression virtual test specimen at failure showing the front plane as well as cross-sections.
Fibers 09 00050 g032
Figure 33. Stress-strain response from virtual test specimens compared with experimental response.
Fibers 09 00050 g033
Figure 34. T800S/F3900 2-1 plane shear experimental test specimen. Dimensions provided in inches (millimeters).
Fibers 09 00050 g034
Figure 35. T800S/F3900 2-1 plane shear virtual test specimen schematic. Dimensions provided in inches (millimeters).
Fibers 09 00050 g035
Figure 36. The 2-1 plane shear virtual test specimen at failure (a) front plane, (b) isometric view showing failure initiation site in matrix elements, and (c) isometric view showing final failed state of matrix elements.
Fibers 09 00050 g036
Figure 37. Stress-strain response from virtual test specimens compared with experimental response.
Fibers 09 00050 g037
Table 1. Carbon fiber elastic constants.
ParameterValue
E 11 T = E 11 C 4.0 (107) psi (275 GPa)
E 22 = E 33 2.25 (106) psi (15 GPa)
G 12 = G 13 1.5 (107) psi (103 GPa)
G 23 1.5 (107) psi (103 GPa)
ν 31 = ν 21 0.01125
ν 23 0.25
Table 2. Elasto-plastic properties derived from experimental data.
Input ParameterDescriptionValue
BULKBulk modulus of the material (K)6.02 (105) psi (4.15 GPa)
GMODShear modulus of the material (G)1.47 (105) psi (1.01 GPa)
EMODYoung’s modulus of the material (E)4.09 (105) psi (2.82 GPa)
NUEElastic Poisson’s ratio (ν)0.387
Table 3. VTSS geometric parameters used to construct the RUC.
a (in (mm))r ((mm))αdxy (in (mm))dz (in (mm))
0.0077 (0.196)0.0033 (0.0846)22.50.0017 (0.0422)0.0012 (0.0305)
Table 4. Calibrated material model parameters.
Material ModelParameterRemarksCalibrated Value
MAT_187 (Matrix)RBCFACRatio of yield stress in equibiaxial compression to yield stress under pure compression.0.95
NUEP ( ν p ) Plastic Poisson’s ratio (νp). Defines relationship between transverse and longitudinal plastic strains.0.275
LCID-BInput stress-plastic strain curve defining yield behavior under equibiaxial tension.Taken as 80% of the stress-plastic strain response in uniaxial tension
EPFAIL ( ε ¯ p f ) Equivalent plastic strain value at onset of failure from uniaxial tension test.0.0065
LCID-TRICurve that defines equivalent plastic failure strain ( ε ¯ p f ) as a function of triaxiality. Ordinate values normalized based on value of EPFAIL.Data shown in Table 5
MAT_213 (Fiber) E 11 C Young’s modulus of orthotropic fiber under longitudinal uniaxial compressive stress.31 (10)6 psi (213.7 GPa)
( ε 11 f ) C Failure strain of the orthotropic fiber in 1-direction compression.0.0156
( ε 11 f ) T Failure strain of the orthotropic fiber in 1-direction tension.0.0065
Table 5. Equivalent plastic strain at onset of failure for various levels of triaxiality.
Condition p σ v m Equivalent Plastic Strain at Failure f ( p σ v m )
Minimum Triaxiality−0.8900.00400.615
Uniaxial Tension−0.3330.00651.000
Iosipescu Shear0.0000.03505.385
Uniaxial Compression0.3330.087513.46
Maximum Triaxiality0.8900.210032.31
Publisher’s Note: MDPI stays neutral with regard to jurisdictional claims in published maps and institutional affiliations.