Abstract
Fibre-reinforced cementitious matrix (FRCM) composites have been effectively used during the last ten years for the strengthening of existing concrete and masonry structures. These composite materials are made of medium- and high-strength fibre meshes embedded in inorganic matrices. Synthetic fibres are the ones that are currently the most used; however, natural fibres, such as basalt fibres, have recently been receiving growing attention. This work presents an extensive experimental study on the mechanical characterisation of a primed basalt fibre bidirectional grid. Fifty monotonic tensile tests on basalt grid strips were performed by varying different parameters, such as the dimension of the specimens, the clamping system, the measurement system and the test rate. Some of the tests were carried out using a video-extensometer to measure each specimen’s strain. The aim of the study was to find the most suitable setup for the tensile characterisation of basalt textiles, in particular, to prevent slippage of the samples at the gripping area and fully exploit the tensile capacity of the grid.
1. Introduction
The use of composite materials for strengthening purposes has become common during the last few decades. Among the most widespread composites in the field of civil engineering are fibre-reinforced polymer (FRP) materials, which are made of an epoxy matrix combined with different types of fabrics and are used for strengthening concrete [1,2] and masonry structures [3,4,5,6]. Several studies have investigated the use of FRP materials in the field of civil engineering for the strengthening of existing reinforced concrete structural members, especially against shear via transverse reinforcements; recent applications can be found in [7]. Although FRP composites can guarantee a high strength-to-weight ratio, good corrosion resistance and ease of application, several issues are involved with this technique, particularly in the case of masonry: lack of breathability and compatibility, sensitivity to debonding phenomena at the interface and low resistance to fire and high temperatures. Aiming to overcome these drawbacks, fibre-reinforced cementitious matrix (FRCM) composites have started to be adopted during the last few years and have proved to be suitable for the strengthening of masonry [8,9,10,11,12] and reinforced concrete structures [13,14]. FRCM composites are made using a cementitious matrix combined with different types of fabric meshes with different geometries (one-, bi- and multi-directional; woven; knitted; welded; variable grid spacing; coated/uncoated). The most common materials used for the fabric are glass [15], steel [16], PBO [17] and carbon [18,19], and a considerable number of studies are available in the literature on the investigation of their mechanical properties. Increasing attention has recently been paid to the application of natural fibres, such as basalt fibres [20,21], which are deemed to be more sustainable and less expensive. However, limited work has been performed so far on the applications of basalt fibres. The physical and mechanical characteristics of the mesh have a great influence on the tensile performance of FRCM composites [22], and for this reason, investigating the tensile performance of the grids is of paramount importance. Moreover, it has been shown that the tensile response of FRCM materials is influenced by the test setup used to carry out the tests [23]. In particular, the clamping method plays a fundamental role in guaranteeing a uniform load distribution and may considerably influence the stress–strain response of composite samples, depending on whether a clevis-type or the clamping grip clamping mechanism is used [24,25].
Interesting results regarding the influence of the test setup on the tensile response of basalt FRCM composites were provided by [26], who presented the outcomes of a round-robin test involving ten European laboratories. Fifty-two coupons were prepared with different dimensions and provided with tabs made of different materials, i.e., glass or carbon FRP, aluminium or steel. In all the clamping systems, the two extremities of the samples were under constant pressure that was exerted either by mechanical or hydraulic means. Specimen elongation was evaluated with different types of displacement transducers, while in some cases, global measurements were gauged using machine head displacements. Different load rates were also adopted. The outcomes showed that the tabs did not have a significant impact on the outcomes of the tensile tests. The strains evaluated by means of different instruments and gauge lengths yielded some inconsistencies between laboratories. The reasons for these differences were not only limited to the instrumentation but also included the gripping methods or the setup in general. Moreover, in the cases where machine displacements were used, the global performance, in terms of deformability, was similar to that obtained using the LVDT (linear variable differential transformer) in the middle of the FRCM coupon. The load rate seemed to also have a reduced impact in terms of strength exploitation.
While the FRCM test setup was the focus of the round-robin test discussed above, there is a lack of published technical papers on the testing of FRCM reinforcement, and in particular, grids. However, with the geometry and gripping conditions being quite different from those of composite samples, the test setup needs to be investigated and validated to lead to meaningful results. This study, which is part of a larger study on the tensile response of basalt FRCM composites [20,27], aimed to fill this gap and involved an extensive experimental investigation of the mechanical characterisation of a primed basalt fibre bidirectional grid. Fifty basalt grid strips were tested under tension by varying different parameters, namely the dimension of the samples, the clamping method, the test rate and the strain-measuring system. A video-extensometer supported by digital image correlation (DIC) software (VideoXtens software, Laborgeräteges.m.b.H., Altenmarkt 180, A-8280 Fürstenfeld, Austria)was adopted to carry out the strain measurements of some of the tests. The tests showed that the different test setup parameters affected the results, which were particularly affected by the slip at the gripping zones and by the elongation rate. The goal of the study was to find the most suitable configuration for characterisation tests on basalt mesh, i.e., to prevent slipping of the strips at the gripping area before the tensile capacity of the mesh was reached.
2. Experimental Program
The experimental programme was designed to determine the mechanical characteristics of a total of fifty basalt grid, dry textile specimens that were tested in accordance with ISO 13934-1:2013 [28]. The tests were divided into two series. The first series was designed in order to study the most suitable configuration of the test by investigating the effects of the geometry, the elongation rate and the clamping materials (rough paper, leather or aluminium tabs) adopted to prevent slippage of the basalt strips at the gripping area. The second series of tests was aimed at evaluating the influence of the measurement system on the experimental strain.
Table 1 summarises the variable values of the first series of tests. Specimens were named following the designation NML-WiSi, where N is used to number samples of the same type, M refers to the tab material (P for paper, L for leather, A for aluminium), L indicates the specimen gauge length, Wi gives the width value (i equal to 1, 3 and 4 are used for 13.5, 33.5 and 47.5 mm thick specimens) and Si gives the displacement rate (1, 2, 3 or 4 mm/min). The underscore is added to specimens tested using the video-extensometer.

Table 1.
Tests on basalt fabric strips.
2.1. Basalt Textile Grid
The adopted mesh was a primed alkali-resistant basalt fibre bidirectional grid. The yarns of the mesh along the warp and weft were woven and fixed at their intersection with nylon fibres. Based on the technical sheet, the grid had a nominal cell size of 6 × 6 mm (Figure 1, a unit weight equal to 250 g/m2, the density of the fibre was 2.75 g/cm3 and the equivalent thickness was 0.039 mm. The nominal values of the tensile strength, ultimate strain and Young’s modulus provided by the manufacturer were ffu = 60 kN/m, εu = 1.8% and Ef = 89 GPa, respectively. Table 2 summarises the mechanical characteristics of the mesh provided by the manufacturer.
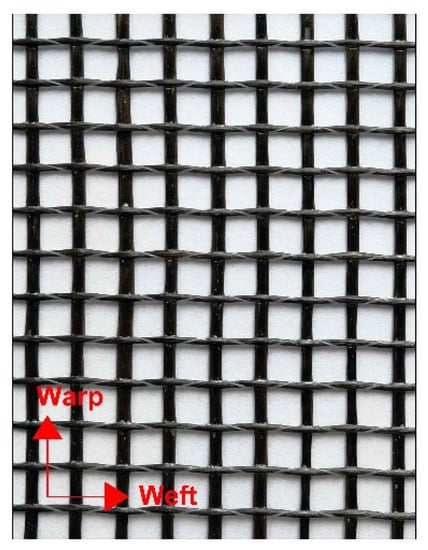
Figure 1.
Basalt grid photo.
Table 2.
Mechanical properties of the basalt grid (manufacturer data).
2.2. Geometry of the Grid Strips and Clamping Solutions
To find the most appropriate test configuration among those provided by the ISO 13934-1:2013 standard [28] and to prevent the slippage of the strips at the gripping area, the grid strips were prepared using different geometries (lengths and widths) and different tab materials, as reported in Table 1.
The strip free length was either 100 or 200 mm, while the specimen width was either 13.5, 33.5 or 47.5 mm. The adopted clamping solutions are discussed in the following.
2.2.1. Paper and Leather Tabs
To avoid slippage of the sample ends while performing the test, pieces (tabs) of either rough paper or leather were positioned between the machine grips and the specimen extremities. The tabs, which were 50 mm long and the same width as the strips, were put at the top and bottom of the extremities of the basalt grid strip without any glue. Then, the specimen was positioned inside the jaws of the machine, gripping the extremities over a length of 50 mm.
2.2.2. Aluminium Tabs
An alternative solution that is usually adopted in the literature to guarantee a uniform load distribution during tensile tests is to provide aluminium/steel tabs at the ends of the strips. In this study, aluminium tabs with dimensions of 80 × 30 × 2 mm were used. Aluminium was used instead of steel because of its higher deformability, allowing for better stress transfer.
Fifteen specimens, each with a total length of 260 mm and width of 13.5 mm, were prepared and two couples of aluminium tabs were provided at the ends. The tabs were marked with a central longitudinal line to guarantee a good alignment with the basalt grid, and were then glued using a fast-setting bi-component epoxy; the strip ends were set to cure between the two glass plates for two hours with a heavy and uniform weight on top of the plates to attain the full strength before handling.
Figure 2 shows one grid strip during curing, while Figure 3 presents some specimens ready to be tested.
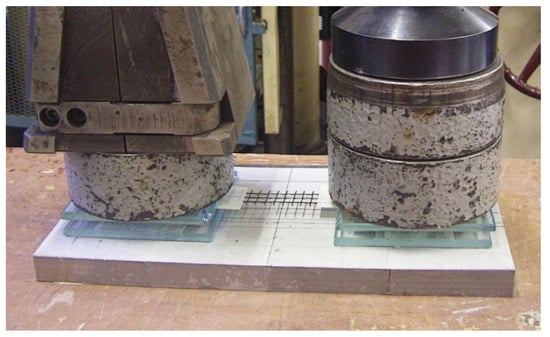
Figure 2.
Preparation of the basalt fabric strips.
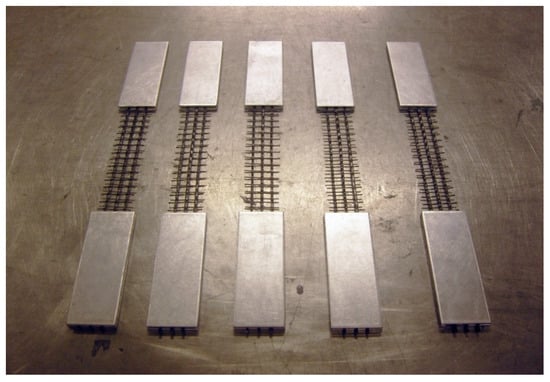
Figure 3.
Basalt samples equipped with aluminium tabs.
The strips were gripped in the machine for a length of 50 mm along the tabs to allow for a gradual transition between the gripped end and the remaining part of the strip (Figure 4).
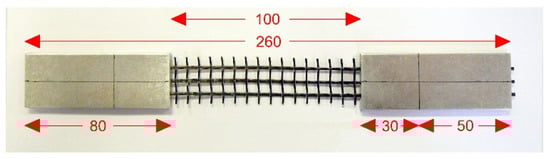
Figure 4.
Basalt textile sample before testing.
2.3. Test Setup and Measuring Instrumentation
The tests were performed under displacement control using a universal testing machine with a bearing capacity of 110 kN. The first phase of the investigation was carried out to assess (1) the suitability of different tab materials for clamping the strips and (2) the influence of the displacement rate on the results and (3) the geometry of the samples. The second phase of the testing aimed at (4) obtaining the experimental stress–strain curves that were representative of the grid’s mechanical behaviour.
The tests were carried out under displacement control with displacement rates of 1, 2, 3 or 4 mm/min.
In the preparatory phase, the strains were measured using the crosshead travel (machine built-in system). It is well known that strains obtained using the displacement of the machine crosshead hardly correspond to the ones measured over the gauge length of the specimen as they are affected by the machine compliance errors and slippage at the grips and within the tabs. Therefore, in the second phase of the investigation, the strains were measured using a video-extensometer and the DIC technique.
The video-extensometer is a contact-free measurement system for high-resolution bending and tensile strain tests for almost all types of materials. This device can measure displacements or strains between two or more assigned markers. The apparatus was connected to a computer, which stored and analysed the data using suitable software. The images acquired by the video-extensometer were processed directly during testing, based on the DIC software [29] provided with the instrument.
The video-extensometer must be supported by an illumination source, either on the front or the back of the specimen (frontlight or a backlight method) and by markers placed on the sample. Different kinds of markers can be used to achieve an intense light–dark contrast and therefore increase the accuracy and reduce the signal noise. In general, the greater the contrast, the more consistent the results that are obtained. In this study, both the frontlight method (with dots or linear targets) (Figure 5) and the backlight method (with linear markers) (Figure 6) were tried.
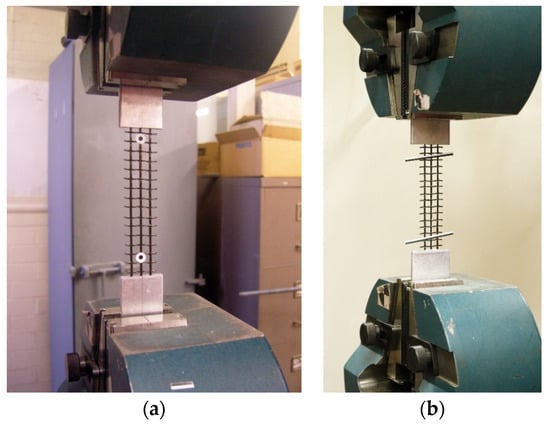
Figure 5.
Markers for the displacement tracking: (a) dot markers and (b) line markers.
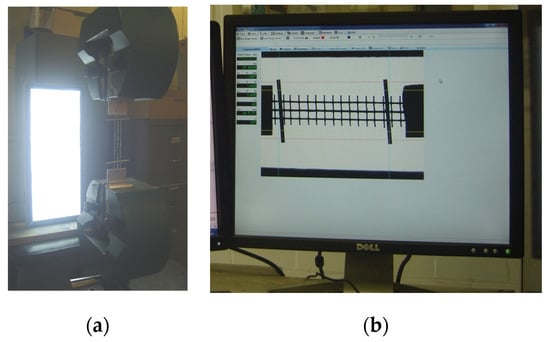
Figure 6.
Test of a basalt grid strip using the backlight method: (a) specimen during testing and (b) software screen view.
The most reliable results were obtained using the linear markers and the rear illumination method, as depicted in Figure 6 Target strips were placed on the specimen at a distance (gauge length) of 80 mm. The strips, which were longer than the specimen width, provided overhanging projections. As suggested by the manual [30], the strips were applied at a small angle (about 2–5° from the perpendicular to the specimen axis) (Figure 5b). A retro light was set up behind the specimens (Figure 6a), mounted opposite to the video-extensometer, to obtain a high-contrast transition at the specimen vertical edges. The ends of the paper strips (markers), which appeared as black lines due to the backlight, were selected as targets using the video-extensometer software (Figure 6b). The grey-level diagram resulting from the image contrast was carefully tuned to achieve very steep target edges [30].
The images were recorded at a frequency of three photos per second. Figure 7 shows the overall test setup.
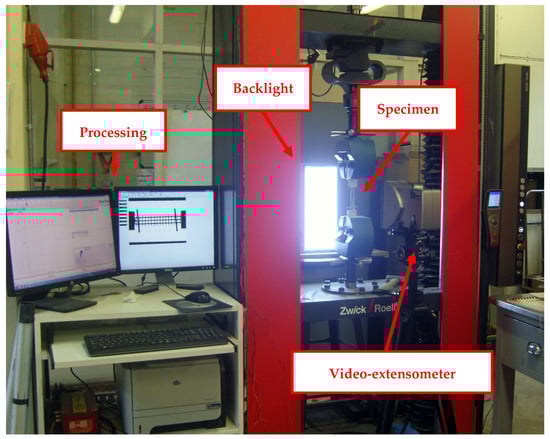
Figure 7.
Test setup for the tensile tests on the basalt fabric.
3. Experimental Results
In this section, the tensile stress–strain curves and the failure modes of the basalt grid strips are presented and discussed. Given the discrete distribution of the yarns along the width of the samples, the cross-sectional area of the grid was evaluated as the equivalent thickness provided by the manufacturer multiplied by the width calculated as the number of yarn spacings in the strip. For the tests carried out with the video-extensometer, the strain was calculated over the distance between the linear targets (for the gauge lengths, see Table 1. In the case of tests carried out without the video-extensometer, the strain values were obtained by dividing the machine crosshead displacement by the specimen length between the grips (Table 1).
3.1. Paper Tabs
The stress–strain curves of tests that were carried out using paper tabs are plotted in Figure 8. The first three plots (Figure 8a–c) show the curves obtained for different strain rates (1, 2 and 3 mm/min) of strips with the same width, while Figure 8d–f present the same results as a comparison between the different sample widths. The tensile strengths corresponding to the recorded loads and displacements were between 1031 MPa and 1547 MPa. Table 3 reports the peak stresses and strains, not including the failure modes.
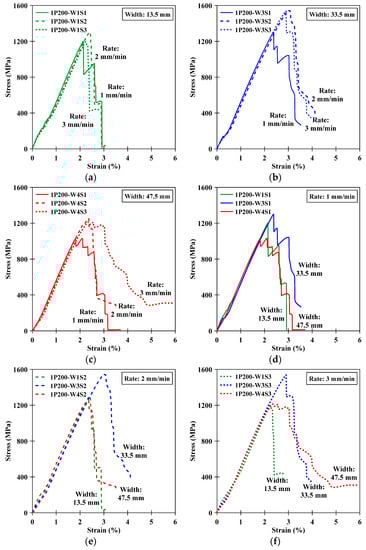
Figure 8.
Stress–strain results of the 200 mm long specimens that were clamped using rough paper: (a–c) comparison between different displacement rates and (d–f) comparison between strips with different widths.
Table 3.
Results of the basalt grid strips tested without the video-extensometer.
No significant differences were found in the 13.5 mm wide strips tested at 1, 2 or 4 mm/min. In wider strips (33.5 and 47.5 mm), lower failure loads were obtained in tests carried out at a 1 mm/min displacement rate compared to the other rates. Tests carried out at 2 mm/min and 3 mm/min showed similar results.
For the same displacement rate (Figure 8d–f) the highest peak stress values were obtained when a width equal to 33.5 mm was used.
All the curves showed the same trend up to the peak stress. Despite a lower stiffness in the very first part of the curves, which was related to the progressive load transfer to the whole specimen, the results presented a linear elastic trend, followed by brittle failure. The post-peak curves were characterised by several load drops, which were related to the progressive failure of the yarns. One sample with a width equal to 47.5 mm (1P200-W4S3) showed a smooth post-peak curve, which evidenced slipping.
Figure 9 shows the basalt textile strips after being tested with the paper clamping method. All the specimens failed close to the gripping area. As can be seen in the photos, the external yarns on one side experienced a higher deformation and consequent rupture, which was probably due to an irregular stress distribution along the width.
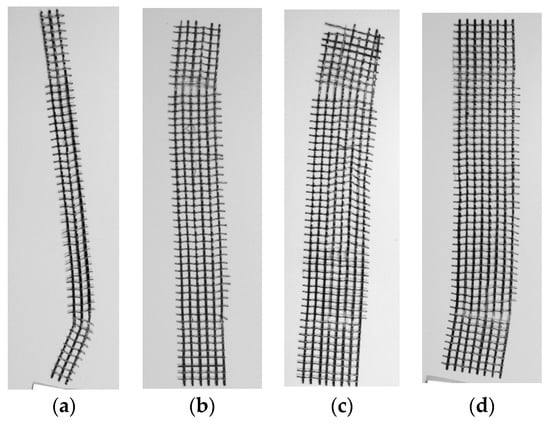
Figure 9.
Failure modes of basalt textile strips tested using rough paper in the gripping area: (a) 13.5 mm wide specimen, (b) 33.5 mm wide specimen and (c,d) 47.5 mm wide specimens.
3.2. Leather Tabs
Figure 10 shows the stress–strain curves of specimens clamped using leather tabs. Similarly to the previous case, the curves were compared in terms of the displacement rates (1, 2 and 4 mm/min) in Figure 10a–c and in terms of the different strip widths (13.5, 33.5 and 47.5 mm) in Figure 10d–f. Table 3 gives the values of the tensile strength and strain at the peak stress and failure modes.
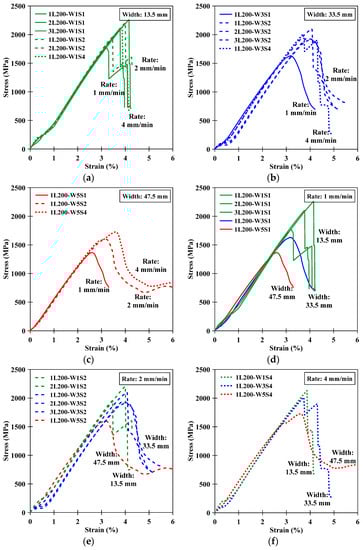
Figure 10.
Stress-strain results of 200 mm long specimens, clamped using leather: (a–c) set width and variable displacement rate and (d–f) set displacement rate and variable width.
As previously noted, apart from a small initial branch, the curves had a linear trend up to the peak. The curves showed higher values of strength (values between 1365 MPa and 2215 MPa) compared to the specimens tested with rough paper (values between 1031 MPa and 1547 MPa).
As for the samples tested using paper, the displacement rate of 1 mm/min gave lower strength values in the case of strips of 33.5 mm and 47.5 mm widths. No noticeable difference was observed for the 13.5 mm wide samples. The strength values for the displacement rates of 2 mm/min and 4 mm/min were quite similar for the 33.5 mm and 47.5 mm wide specimens, respectively.
Comparing curves with the same displacement rate, the highest values of strength were obtained for strips that were 13.5 mm and 33.5 mm in width. For the displacement rate of 1 mm/min, the smallest width gave the highest strength. However, these results should be further investigated due to the small and different numbers of samples tested.
Most of the 33.5 and 47.5 mm wide specimens presented slipping during the test; this can be noticed from the smooth post-peak load drops of the stress–strain curves.
Observing Figure 11a,b, it was noted that the 33.5 mm and 47.5 mm wide strips experienced localised deformation, followed by rupture of the yarns close to the gripping area. The failure mode of the 13.5 mm wide specimens was characterised by the tensile rupture of the mesh in the middle of the strips or close to the gripping area (Figure 11).
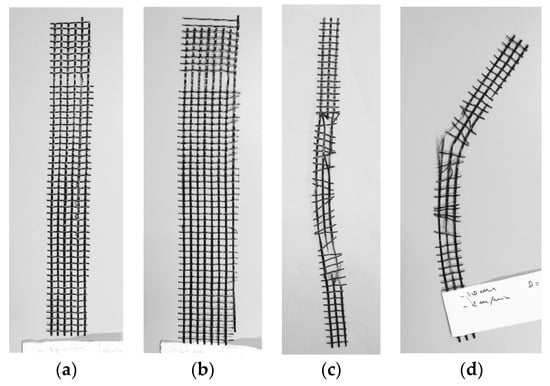
Figure 11.
Failure modes of the basalt textile strips tested using leather in the gripping area: (a) specimen with dimensions of 33.5 × 200 mm, (b) specimen with dimensions of 47.5 × 200 mm, (c) specimen with dimensions of 13.5 × 200 mm and (d) specimen with dimensions of 13.5 × 150 mm.
In addition, three samples were tested using a gauge length of 150 mm instead of 200 mm. The specimens were 13.5 mm wide, one of them was tested at a 1 mm/min rate, while the other two were tested using a rate of 2 mm/min. In Figure 12a, the stress–strain curves of the samples are presented. The outcomes confirmed that the lowest strength values were related to the lowest rate. In Figure 12b, the curves are compared to those obtained from samples having the same width but different length (200 mm long). The plot shows that the specimens with a smaller length did not present the reduced initial slope of the other curves. Figure 11d depicts the failure mode of one of the samples after its test.
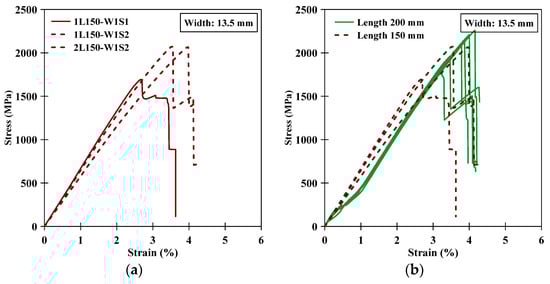
Figure 12.
(a) Stress–strain curves of the 150 mm long specimens that were clamped using leather for different displacement rates and (b) comparison between the 200 and 150 mm long specimens and different displacement rates.
Figure 13 compares the results of the 200 mm long samples tested with paper or leather tabs. The plot clearly shows that, independently from the strip width, the leather tabs prevented the premature failure shown by the tests carried out using paper tabs.
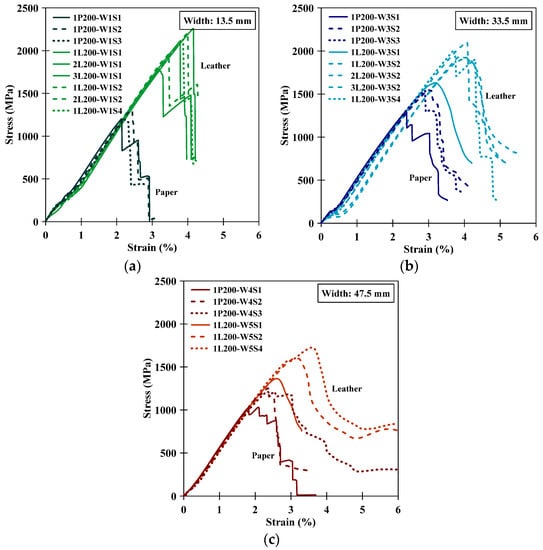
Figure 13.
Comparison of the stress–strain results obtained from the 200 mm long specimens clamped using rough paper or leather tabs for different sample widths: (a) 13.5 mm, (b) 33.5 mm and (c) 47.5 mm.
3.3. Aluminium Tabs
Figure 14a presents the stress–strain curves of three basalt grid specimens, where one was tested at a 1 mm/min displacement rate, while the other two were tested at 2 mm/min. The plot confirmed that the rate of 2 mm/min allowed for reaching failure at higher stress than was observed for the previous tests. The test setup was the same as that of the leather and paper tests, i.e., the displacements were measured with the built-in crosshead monitor. Table 3 reports the tensile strengths and strains at the peak stress and failure modes. The tensile strength corresponding to the recorded loads and displacements were between 1694 MPa and 2072 MPa. These values were comparable to those recorded for the leather tab tests.
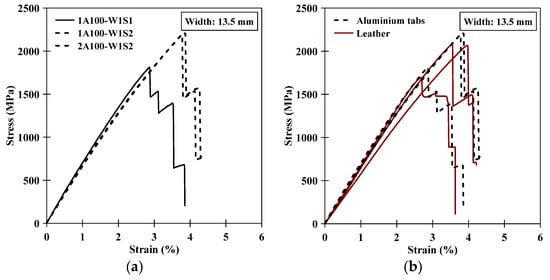
Figure 14.
Stress–strain results of the specimens equipped with aluminium tabs at the ends: (a) set width and variable displacement rate and (b) comparison between the results of the strips equipped with aluminium tabs and leather pieces.
The curves obtained from the tests carried out using aluminium and leather are compared in Figure 14b. Except for one curve, which presented a slightly lower Young’s modulus, the curves were consistent in terms of both the stiffness and strength. The failure of the specimens was characterised by a progressive tensile rupture of the basalt yarns in the middle of the strips; slipping was not observed.
Based on these sets of results, it is possible to conclude that the test setup with aluminium tabs and a displacement rate of 2 mm/min and width equal to 13.5 mm allowed for obtaining the most reliable results in terms of the strength and expected failure mode. This setup was therefore used to perform the grid characterisation tests presented in the following section.
3.4. Tests with the Video-Extensometer
The tests reported in this section were carried out using a video-extensometer to measure the strain of the samples over the gauge length reported in Table 1. A total of twelve strips, made with three yarns (13.5 mm), were tested using a displacement rate of 2 mm/min. The magnitude of the error due to the measure of the crosshead displacement was estimated by comparing the average curve of these tests with the curves already plotted in Figure 14a, which were the results from the same geometry and displacement rate (Figure 15). The comparison showed that the curve obtained using the video-extensometer was stiffer compared to those plotted using the machine crosshead displacement, with the latter being influenced by the rigidity of the system.
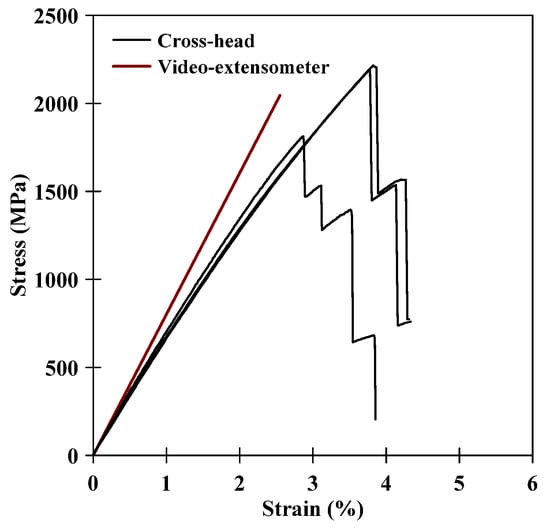
Figure 15.
Comparison between the stress–strain curves of the basalt textile obtained from the video-extensometer (average curve) and the machine crosshead.
The stress–strain curves of the twelve basalt strips are shown in Figure 16.
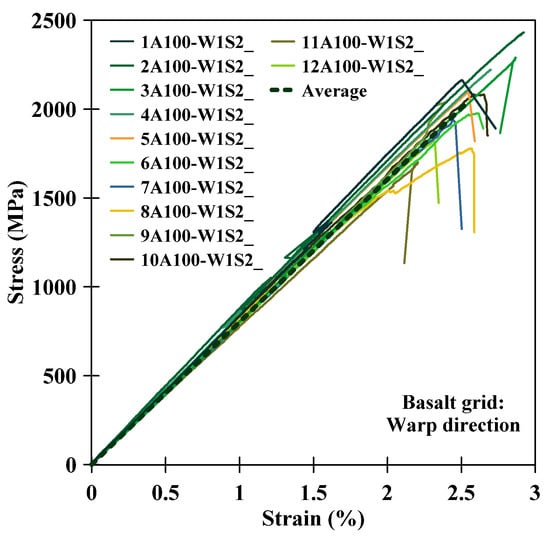
Figure 16.
Stress–strain curves of basalt textile obtained using the video-extensometer.
Table 4 gives the tensile strengths, strains and elastic moduli, as well as the corresponding average values and coefficients of variation (COVs). Figure 17 shows photos of some basalt specimens after failure. In nine out of twelve specimens, the failure occurred in the central area of the strip. Slipping phenomena inside the gripping area were not detected.
Table 4.
Results of the basalt grid strips tested with a video-extensometer.
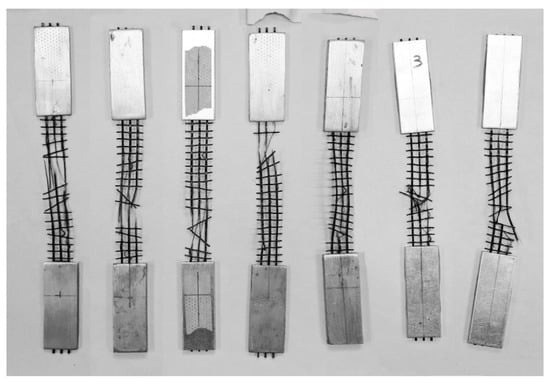
Figure 17.
Basalt textile strips after failure.
The average peak stress and strain obtained from the twelve specimens tested were 2045 MPa and 2.55%, respectively, which were both higher than the values provided by the manufacturer (see Table 4. It is important to note that the tensile strength value provided by the manufacturer (1542 MPa) and presented in Table 4 was obtained after considering the load-resistant area per unit of width (38.91 mm2/m). The experimental average elastic modulus was equal to 81.91 GPa, which was slightly lower than the value provided by the manufacturer.
4. Discussion
On the one hand, the above results show the importance of the measurement method (local versus global strain measurement), and on the other hand, the effect of the test set up on the experimental results. While the sample dimensions are normally indicated in the testing method codes, the details of the gripping system and the monitoring of the deformation outside the gauge length are not standardised. Often, the validation of the test setup can be quite time consuming, especially for materials that are relatively new, such as the one presented in this study. An assessment of the effects of the test setup conditions on the reinforcement materials of FRCM composites is contained in [16]; however, the discussion is limited to stainless steel and galvanised steel cords. In the study, the authors remarked that the failure modes of the same textiles texted in different laboratories were not always consistent, probably due to a non-uniform load distribution across the section. In particular, it was found that the mechanical properties of the three textiles investigated within this round robin were significantly different.
It is also often found that the strengths and stiffnesses of the reinforcements can differ from the values provided by the manufacturers. Details of the testing procedure followed by manufacturers are normally not available in the technical sheets and this makes it difficult to compare experimental results.
A significant difference between the measured textiles tensile strength and the values provided by the manufacturer was reported by Caggegi et al. [17] for PBO and aramid reinforcements. The authors found that the datasheet values for PBO were almost double those that were experimentally measured; however, the datasheet most probably referred to single-filament results. Regarding aramid, the low experimental values reported by the authors were due to a non-uniform distribution of the tensile stress among the fibers, as shown by the failure modes. This is not necessarily a setup issue and is most probably due to the geometrical irregularity of the commercially available textiles, as was also shown by the experimental results reported in this paper regarding the basalt grid specimens.
Finally, it should be remarked that the understanding of the mechanical behaviour of the reinforcement is of key importance for the appreciation of the textile-to-mortar bond behaviour of TRM composites [25]. Therefore, a clear appreciation of the factors affecting a fabric’s mechanical properties is needed to ensure that suitable constitutive laws of the constituent materials needed for numerical models are established.
5. Conclusions
This paper presented an experimental study on the effects of different experimental variables on the tensile behaviour of a bidirectional basalt grid. Different variables were investigated, such as the geometry of the specimens (width and length), the elongation rate and the gripping method. On the basis of the results discussed in the previous sections that were found for the range of variables investigated, the following conclusions can be drawn:
- In samples with the same width tested using paper tabs, the lowest strength was obtained with a 1 mm/min displacement rate. The strength values were obtained with speeds of 2 mm/min and 3 mm/min were similar. In samples tested with the same displacement rate, the highest strength was obtained for a width of 33.5 mm. The failure of samples with a smaller width was characterised by yarn failure close to the gripping area.
- The curves obtained with leather tabs reached higher peak loads compared to the ones with paper tabs. As for paper tabs, the highest strength was obtained for 2 mm/min and 4 mm/min displacement rates. In samples tested with the same displacement rate, greater strength values were obtained for a width of 13.5 mm. Most of the 33.5 and 47.5 mm wide specimens experienced slippage during testing, while the failure mode of the 13.5 mm wide strips was via tensile rupture of the grid in the central area of the strip.
- In samples tested using leather tabs, the shortest strips showed a more marked linear trend and a faster load transfer to the whole specimen for low load values.
- Strips tested using aluminium tabs showed slightly greater strength than samples tested with leather. The failure of the samples was characterised by the tensile rupture of the basalt yarns in the middle of the strips.
- Strains measured using a video-extensometer and gauge length in the central part of the samples were significantly lower than those obtained using the displacement of the machine crosshead.
- Based on the previous results, the mechanical characterisation of the basalt grid was carried out on 13.5 mm wide strips at a 2 mm/min displacement rate and using the video-extensometer to measure the strains. The average strength and strain at peak and Young’s modulus obtained for these tests were 2045 MPa, 2.55% and 81.91 GPa, respectively, with a COV lower than 11%.
Author Contributions
J.D. performed the experimental activity, analyzed the data, wrote parts of the paper; G.A. contributed to the design the experimental programme, partially funded the research, analyzed the data, revised the paper; J.C. supervised the research, G.M. performed the conceptualization of the research, wrote parts of the paper, analyzed the data; L.L.M. supervised the research, contributed to the conceptualization of the research. All authors have read and agreed to the published version of the manuscript.
Funding
This research was developed among the Project ReLUIS “Progetto Esecutivo Accordo DPC/ReLUIS 2019–2021, WP14-Contributi normativi per Materiali Innovativi per Interventi su Costruzioni Esistenti”.
Conflicts of Interest
The authors declare no conflict of interest.
References
- He, W.; Wang, X.; Wu, Z. Flexural behavior of RC beams strengthened with prestressed and non-prestressed BFRP grids. Compos. Struct. 2020, 246, 112381. [Google Scholar] [CrossRef]
- Zhou, Y.; Zhang, J.; Li, W.; Hu, B.; Huang, X. Reliability-based design analysis of FRP shear strengthened reinforced concrete beams considering different FRP configurations. Compos. Struct. 2020, 237, 111957. [Google Scholar] [CrossRef]
- Minafò, G.; Monaco, A.; D’Anna, J.; La Mendola, L. Compressive behaviour of eccentrically loaded slender masonry columns confined by FRP. Eng. Struct. 2018, 172, 214–227. [Google Scholar] [CrossRef]
- D’Anna, J.; Amato, G.; Chen, J.F.; La Mendola, L.; Minafò, G. BFRP grid confined clay brick masonry cylinders under axial compression: Experimental results. In Proceedings of the 9th International Conference on Fibre-Reinforced Polymer (FRP) Composites in Civil Engineering (CICE 2018), Paris, France, 17–19 July 2018; No. Part 2. pp. 123–129. [Google Scholar]
- D’Anna, J.; Amato, G.; Chen, J.F.; Minafò, G.; La Mendola, L. Effectiveness of BFRP confinement on the compressive behaviour of clay brick masonry cylinders. Compos. Struct. 2020, 249, 112558. [Google Scholar] [CrossRef]
- Capozucca, R.; Magagnini, E. Experimental response of masonry walls in-plane loading strengthened with GFRP strips. Compos. Struct. 2020, 235, 111735. [Google Scholar] [CrossRef]
- Chalioris, C.E.; Kosmidou, P.; Papadopoulos, N.A. Investigation of a New Strengthening Technique for RC Deep Beams Using Carbon FRP Ropes as Transverse Reinforcements. Fibers 2018, 6, 52. [Google Scholar] [CrossRef]
- Chalioris, C.E.; Zapris, A.G.; Karayannis, C.G.G. U-Jacketing Applications of Fiber-Reinforced Polymers in Reinforced Concrete T-Beams against Shear—Tests and Design. Fibers 2020, 8, 13. [Google Scholar] [CrossRef]
- Fossetti, M.; Minafò, G. Strengthening of masonry columns with BFRCM or with steel wires: An experimental study. Fibers 2016, 4, 15. [Google Scholar] [CrossRef]
- Minafò, G.; La Mendola, L. Experimental investigation on the effect of mortar grade on the compressive behaviour of FRCM confined masonry columns. Compos. Part B-Eng. 2018, 146, 1–12. [Google Scholar] [CrossRef]
- Meriggi, P.; de Felice, G.; De Santis, S. Design of the out-of-plane strengthening of masonry walls with Fabric Reinforced Cementitious Matrix composites. Constr. Build. Mater. 2020, 240, 117946. [Google Scholar] [CrossRef]
- D’Anna, J.; Amato, G.; Chen, J.F.; Minafò, G.; La Mendola, L. Performance assessment of basalt FRCM for the confinement of clay brick masonry cylinders. In Proceedings of the 12th International Conference on Structural Analysis of Historical Constructions (SAHC 2020), Barcelona, Spain, 29 September–1 October 2021. [Google Scholar]
- Brückner, A.; Ortlepp, R.; Curbach, M. Textile reinforced concrete for strengthening in bending and shear. Mater. Struct. 2006, 39, 741–748. [Google Scholar] [CrossRef]
- Al-Salloum, Y.A.; Elsanadedy, H.M.; Alsayed, S.H.; Iqbal, R.A. Experimental and Numerical Study for the Shear Strengthening of Reinforced Concrete Beams Using Textile-Reinforced Mortar. J. Compos. Constr. 2012, 16, 74–90. [Google Scholar] [CrossRef]
- Leone, M.; Aiello, M.A.; Balsamo, A.; Carozzi, F.G.; Ceroni, F.; Corradi, M.; Gams, M.; Garbin, E.; Gattesco, N.; Krajewski, P.; et al. Glass fabric reinforced cementitious matrix: Tensile properties and bond performance on masonry substrate. Compos. Part B-Eng. 2017, 127, 196–214. [Google Scholar] [CrossRef]
- De Santis, S.; Ceroni, F.; De Felice, G.; Fagone, M.; Ghiassi, B.; Kwiecień, A.; Lignola, G.P.; Morganti, M.; Santandrea, M.; Valluzzi, M.R.; et al. Round Robin Test on tensile and bond behaviour of Steel Reinforced Grout systems. Compos. Part B-Eng. 2017, 127, 100–120. [Google Scholar] [CrossRef]
- Caggegi, C.; Carozzi, F.G.; De Santis, S.; Fabbrocino, F.; Focacci, F.; Hojdys, Ł.; Lanoye, E.; Zuccarino, L. Experimental analysis on tensile and bond properties of PBO and aramid fabric reinforced cementitious matrix for strengthening masonry structures. Compos. Part B-Eng. 2017, 127, 175–195. [Google Scholar] [CrossRef]
- Carozzi, F.G.; Bellini, A.; D’Antino, T.; De Felice, G.; Focacci, F.; Hojdys, Ł.; Laghi, L.; Lanoye, E.; Micelli, F.; Panizza, M.; et al. Experimental investigation of tensile and bond properties of Carbon-FRCM composites for strengthening masonry elements. Compos. Part B-Eng. 2017, 128, 100–119. [Google Scholar] [CrossRef]
- Ombres, L.; Mancuso, N.; Mazzuca, S.; Verre, S. Bond between Carbon Fabric-Reinforced Cementitious Matrix and Masonry Substrate. J. Mater. Civ. Eng. 2019, 31, 04018356. [Google Scholar] [CrossRef]
- D’Anna, J.; Amato, G.; Chen, J.F.; Minafò, G.; La Mendola, L. On the Use of Digital Image Correlation (DIC) for Evaluating the Tensile Behaviour of BFRCM Strips. Key Eng. Mater. 2019, 817, 377–384. [Google Scholar] [CrossRef]
- Caggegi, C.; Lanoye, E.; Djama, K.; Bassil, A.; Gabor, A. Tensile behaviour of a basalt TRM strengthening system: Influence of mortar and reinforcing textile ratios. Compos. Part B-Eng. 2017, 130, 90–102. [Google Scholar] [CrossRef]
- D’Antino, T.; Papanicolaou, C. Mechanical characterization of textile reinforced inorganic-matrix composites. Compos. Part. B-Eng. 2017, 127, 78–91. [Google Scholar] [CrossRef]
- D’Antino, T.; Papanicolaou, C.C. Comparison between different tensile test set-ups for the mechanical characterization of inorganic-matrix composites. Constr. Build. Mater. 2018, 171, 140–151. [Google Scholar] [CrossRef]
- Arboleda, D.; Carozzi, F.G.; Nanni, A.; Poggi, C. Testing procedures for the uniaxial tensile characterization of fabric-reinforced cementitious matrix composites. J. Compos. Constr. 2015, 20, 04015063. [Google Scholar] [CrossRef]
- Ghiassi, B. Mechanics and durability of textile reinforced mortars: A review of recent advances and open issues. RILEM Tech. Lett. 2019, 4, 130–137. [Google Scholar] [CrossRef]
- Lignola, G.; Caggegi, C.; Ceroni, F.; De Santis, S.; Krajewski, P.; Lourenço, P.B.; Morganti, M.; Papanicolaou, C. (Corina); Pellegrino, C.; Prota, A.; et al. Performance assessment of basalt FRCM for retrofit applications on masonry. Compos. Part. B-Eng. 2017, 128, 1–18. [Google Scholar] [CrossRef]
- D’Anna, J. Experimental Investigation on the Effectiveness of Basalt-Fibre Strengthening Systems for Confining Masonry Elements. Ph.D. Thesis, University of Palermo, Palermo, Italy, 2019. [Google Scholar]
- ISO 13934-1 Textiles—Tensile Properties of Fabrics—Part. 1: Determination of Maximum Force and Elongation at Maximum Force Using the Strip Method. 2013. Available online: https://www.iso.org/standard/60676.html (accessed on 15 September 2020).
- GOM GmbH. GOM Testing—Technical Documentation as of V8 SR1, Digital Image Correlation and Strain Computation Basics; GOM mbH: Braunschweig, Germany, 2016. [Google Scholar]
- Zwick/Roell Group, Germany—Austria. Zwick/Roell VideoXtens, Manual No. 255. 2015. Available online: https://www.zwickroell.com/en/extensometers (accessed on 15 September 2020).
Publisher’s Note: MDPI stays neutral with regard to jurisdictional claims in published maps and institutional affiliations. |
© 2020 by the authors. Licensee MDPI, Basel, Switzerland. This article is an open access article distributed under the terms and conditions of the Creative Commons Attribution (CC BY) license (http://creativecommons.org/licenses/by/4.0/).