A New Method for Measuring Fabric Drape with a Novel Parameter for Classifying Fabrics


Abstract
:1. Introduction
- Poor reproducibility, i.e., multiple tests of the same sample often do not yield reasonably close results, and Chu thus recommended for more test replicas: “Five in each direction, warp and filling, is a reasonable number” [2]. Knowing fabrics are anisotropic, one may argue why not in other directions?
- Low sensitivity—only significant difference in fabric drape can be detected [34].
- It has a slow and cumbersome test process [35].
- Many fabrics tend to curl and twist when cut into specimens, which further affects the reproducibility, and even the physical meaning of the test results [4].
- A large size sample size is required: 30 cm in diameter [36]. If five each are required in both warp and filling directions, that is too much fabric to ask for in many cases.
2. A New Criterion for Fabric Classification
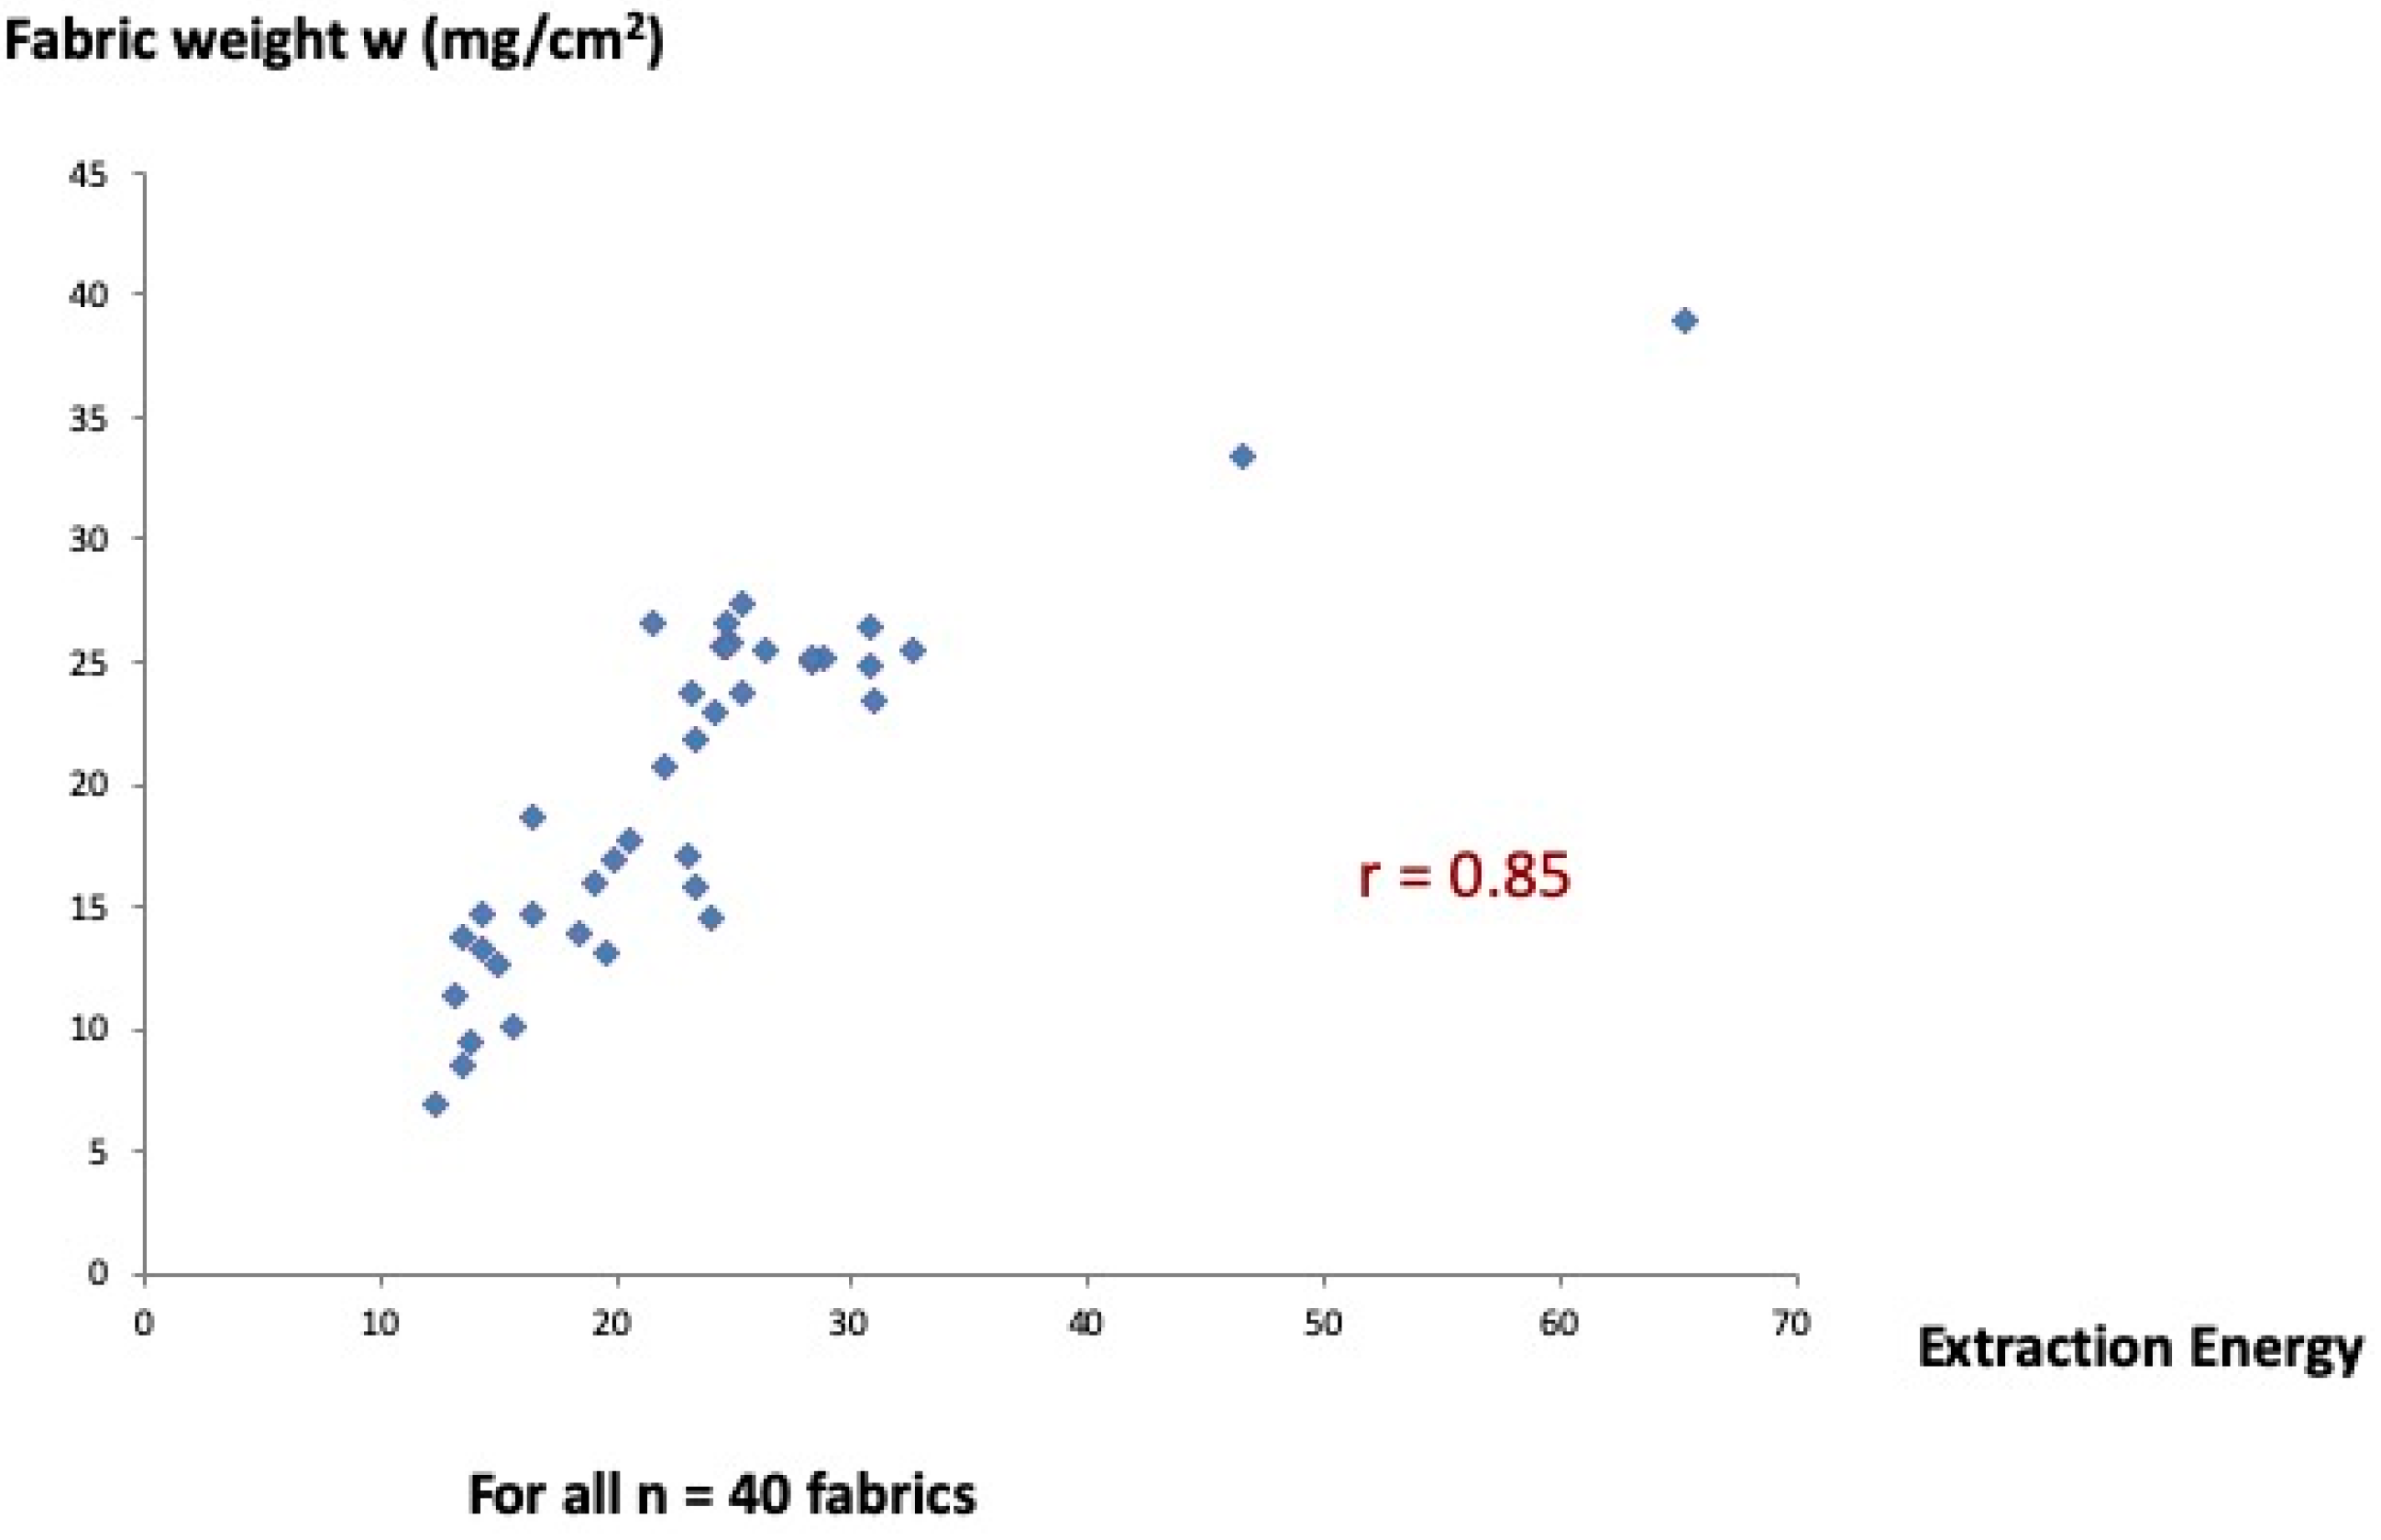
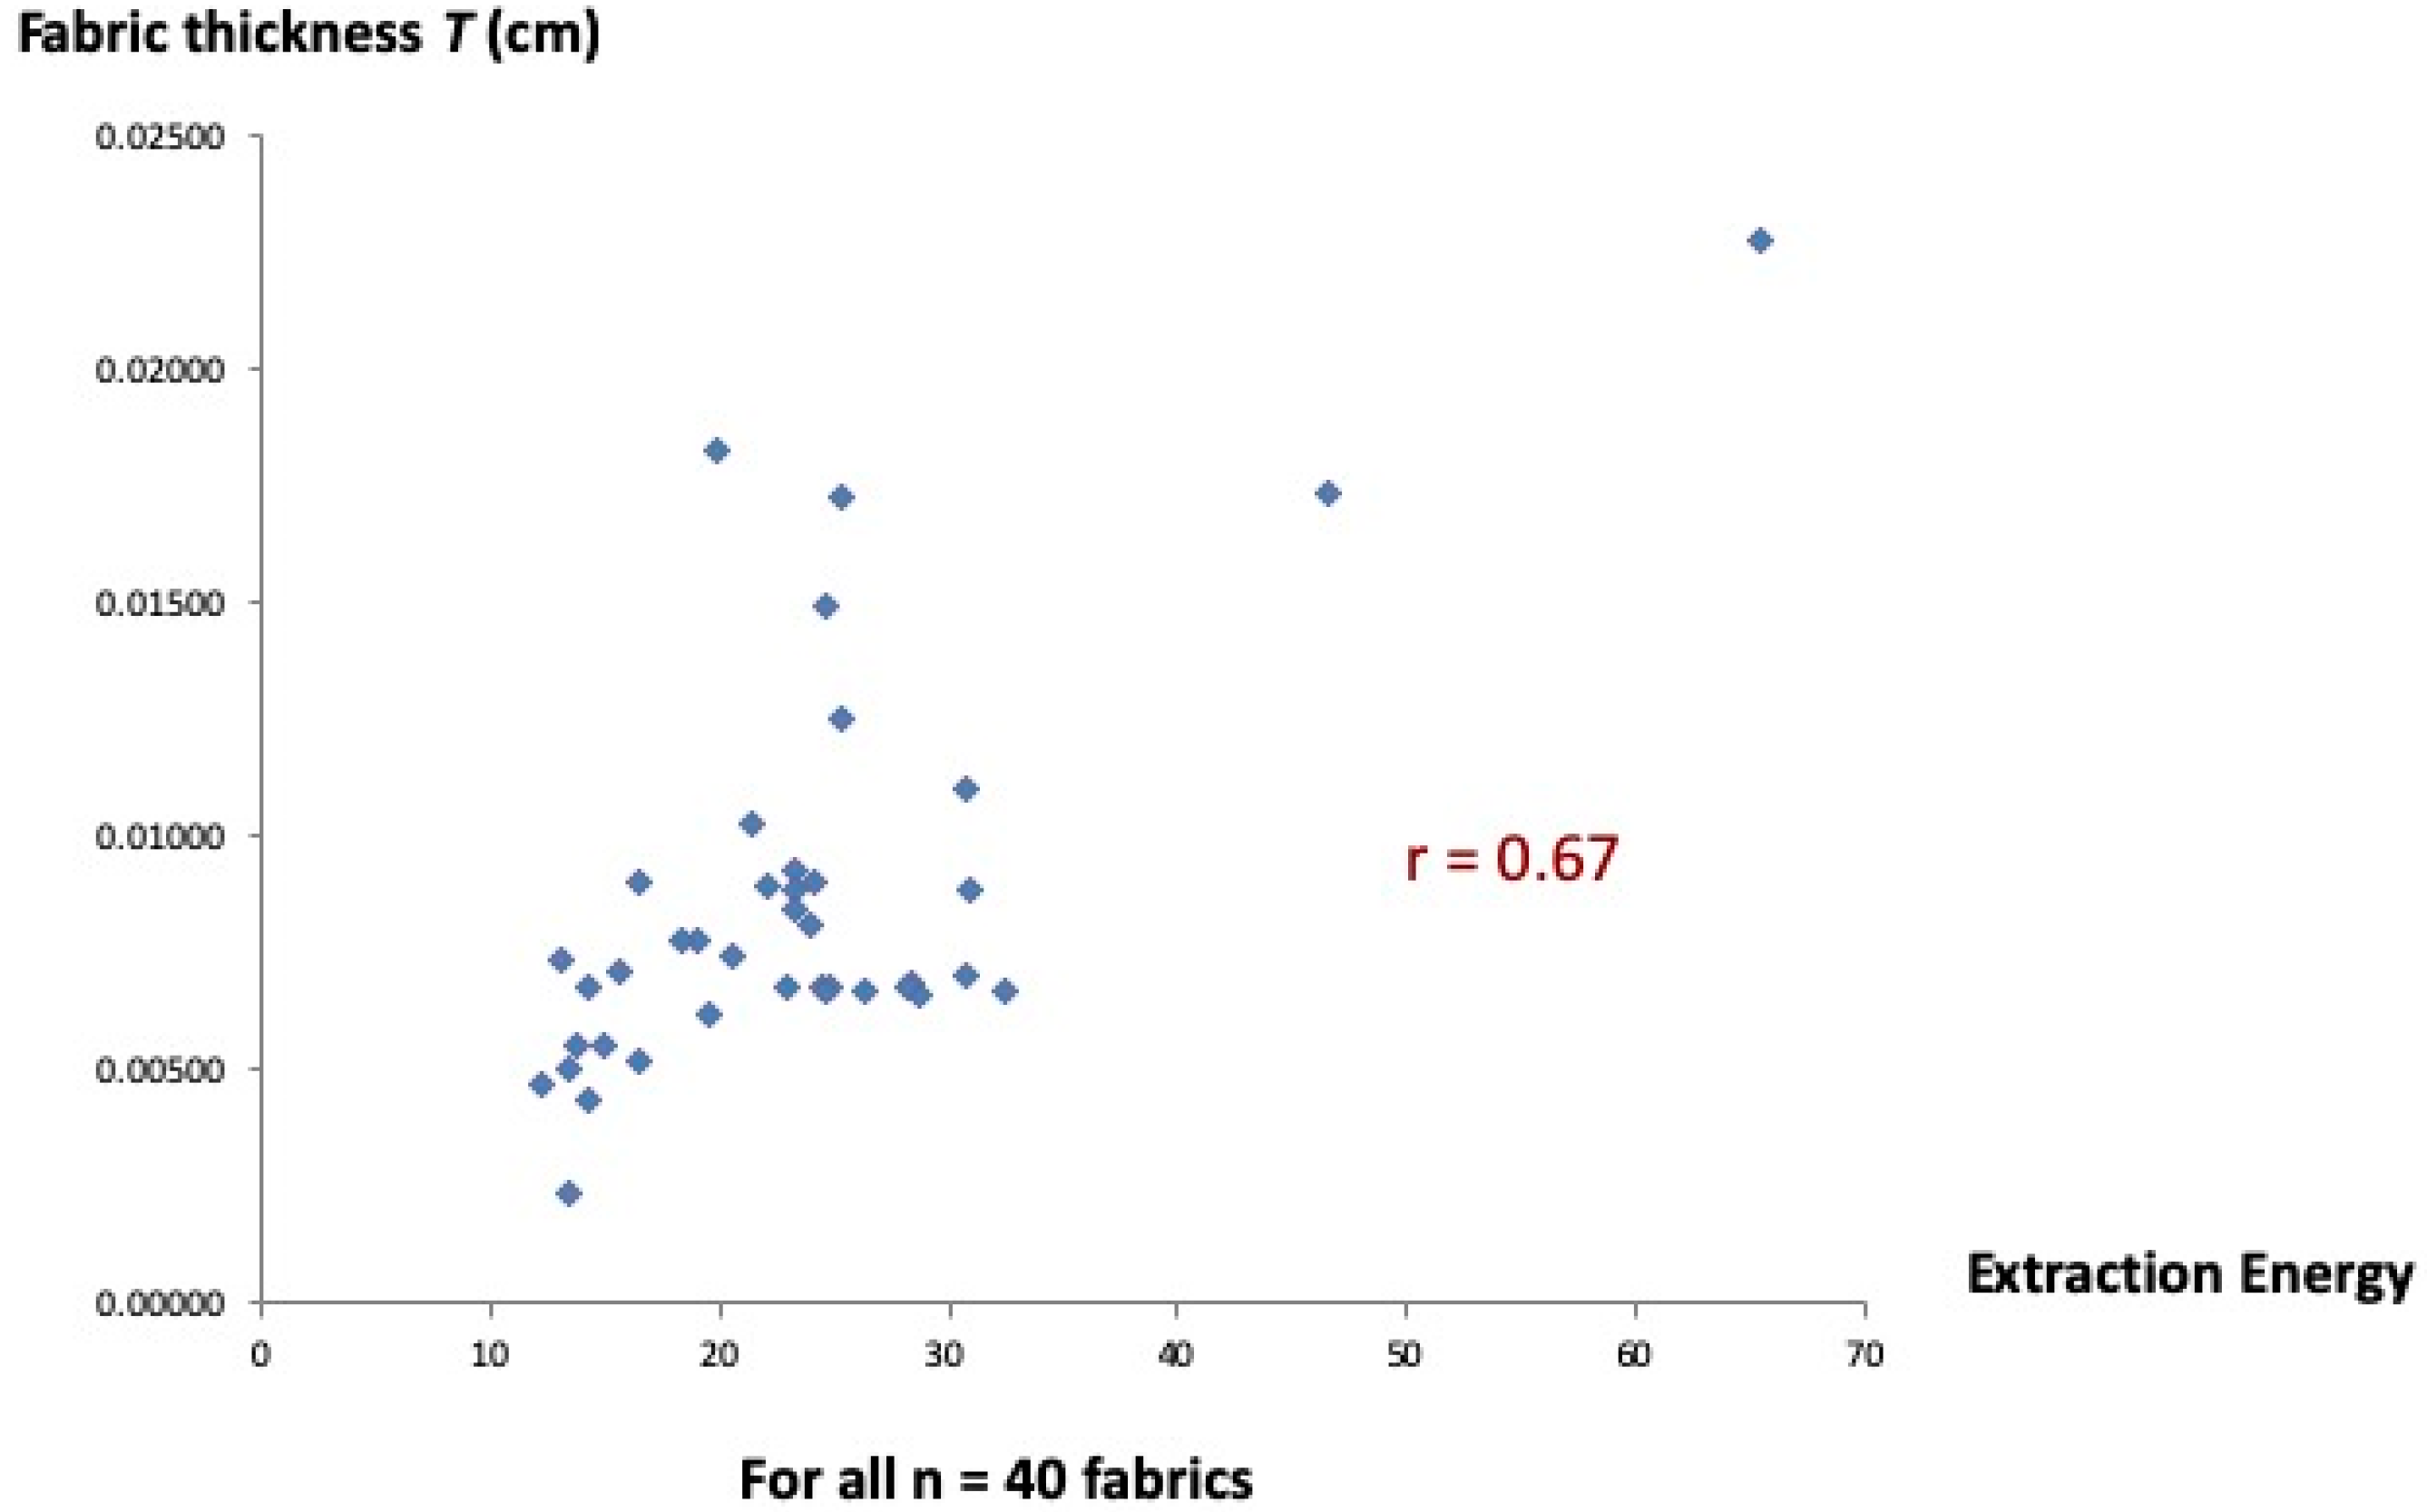
- As the most fundamental parameters in determining fabric performance, both fabric weight and thickness should be included in the resultant parameters.
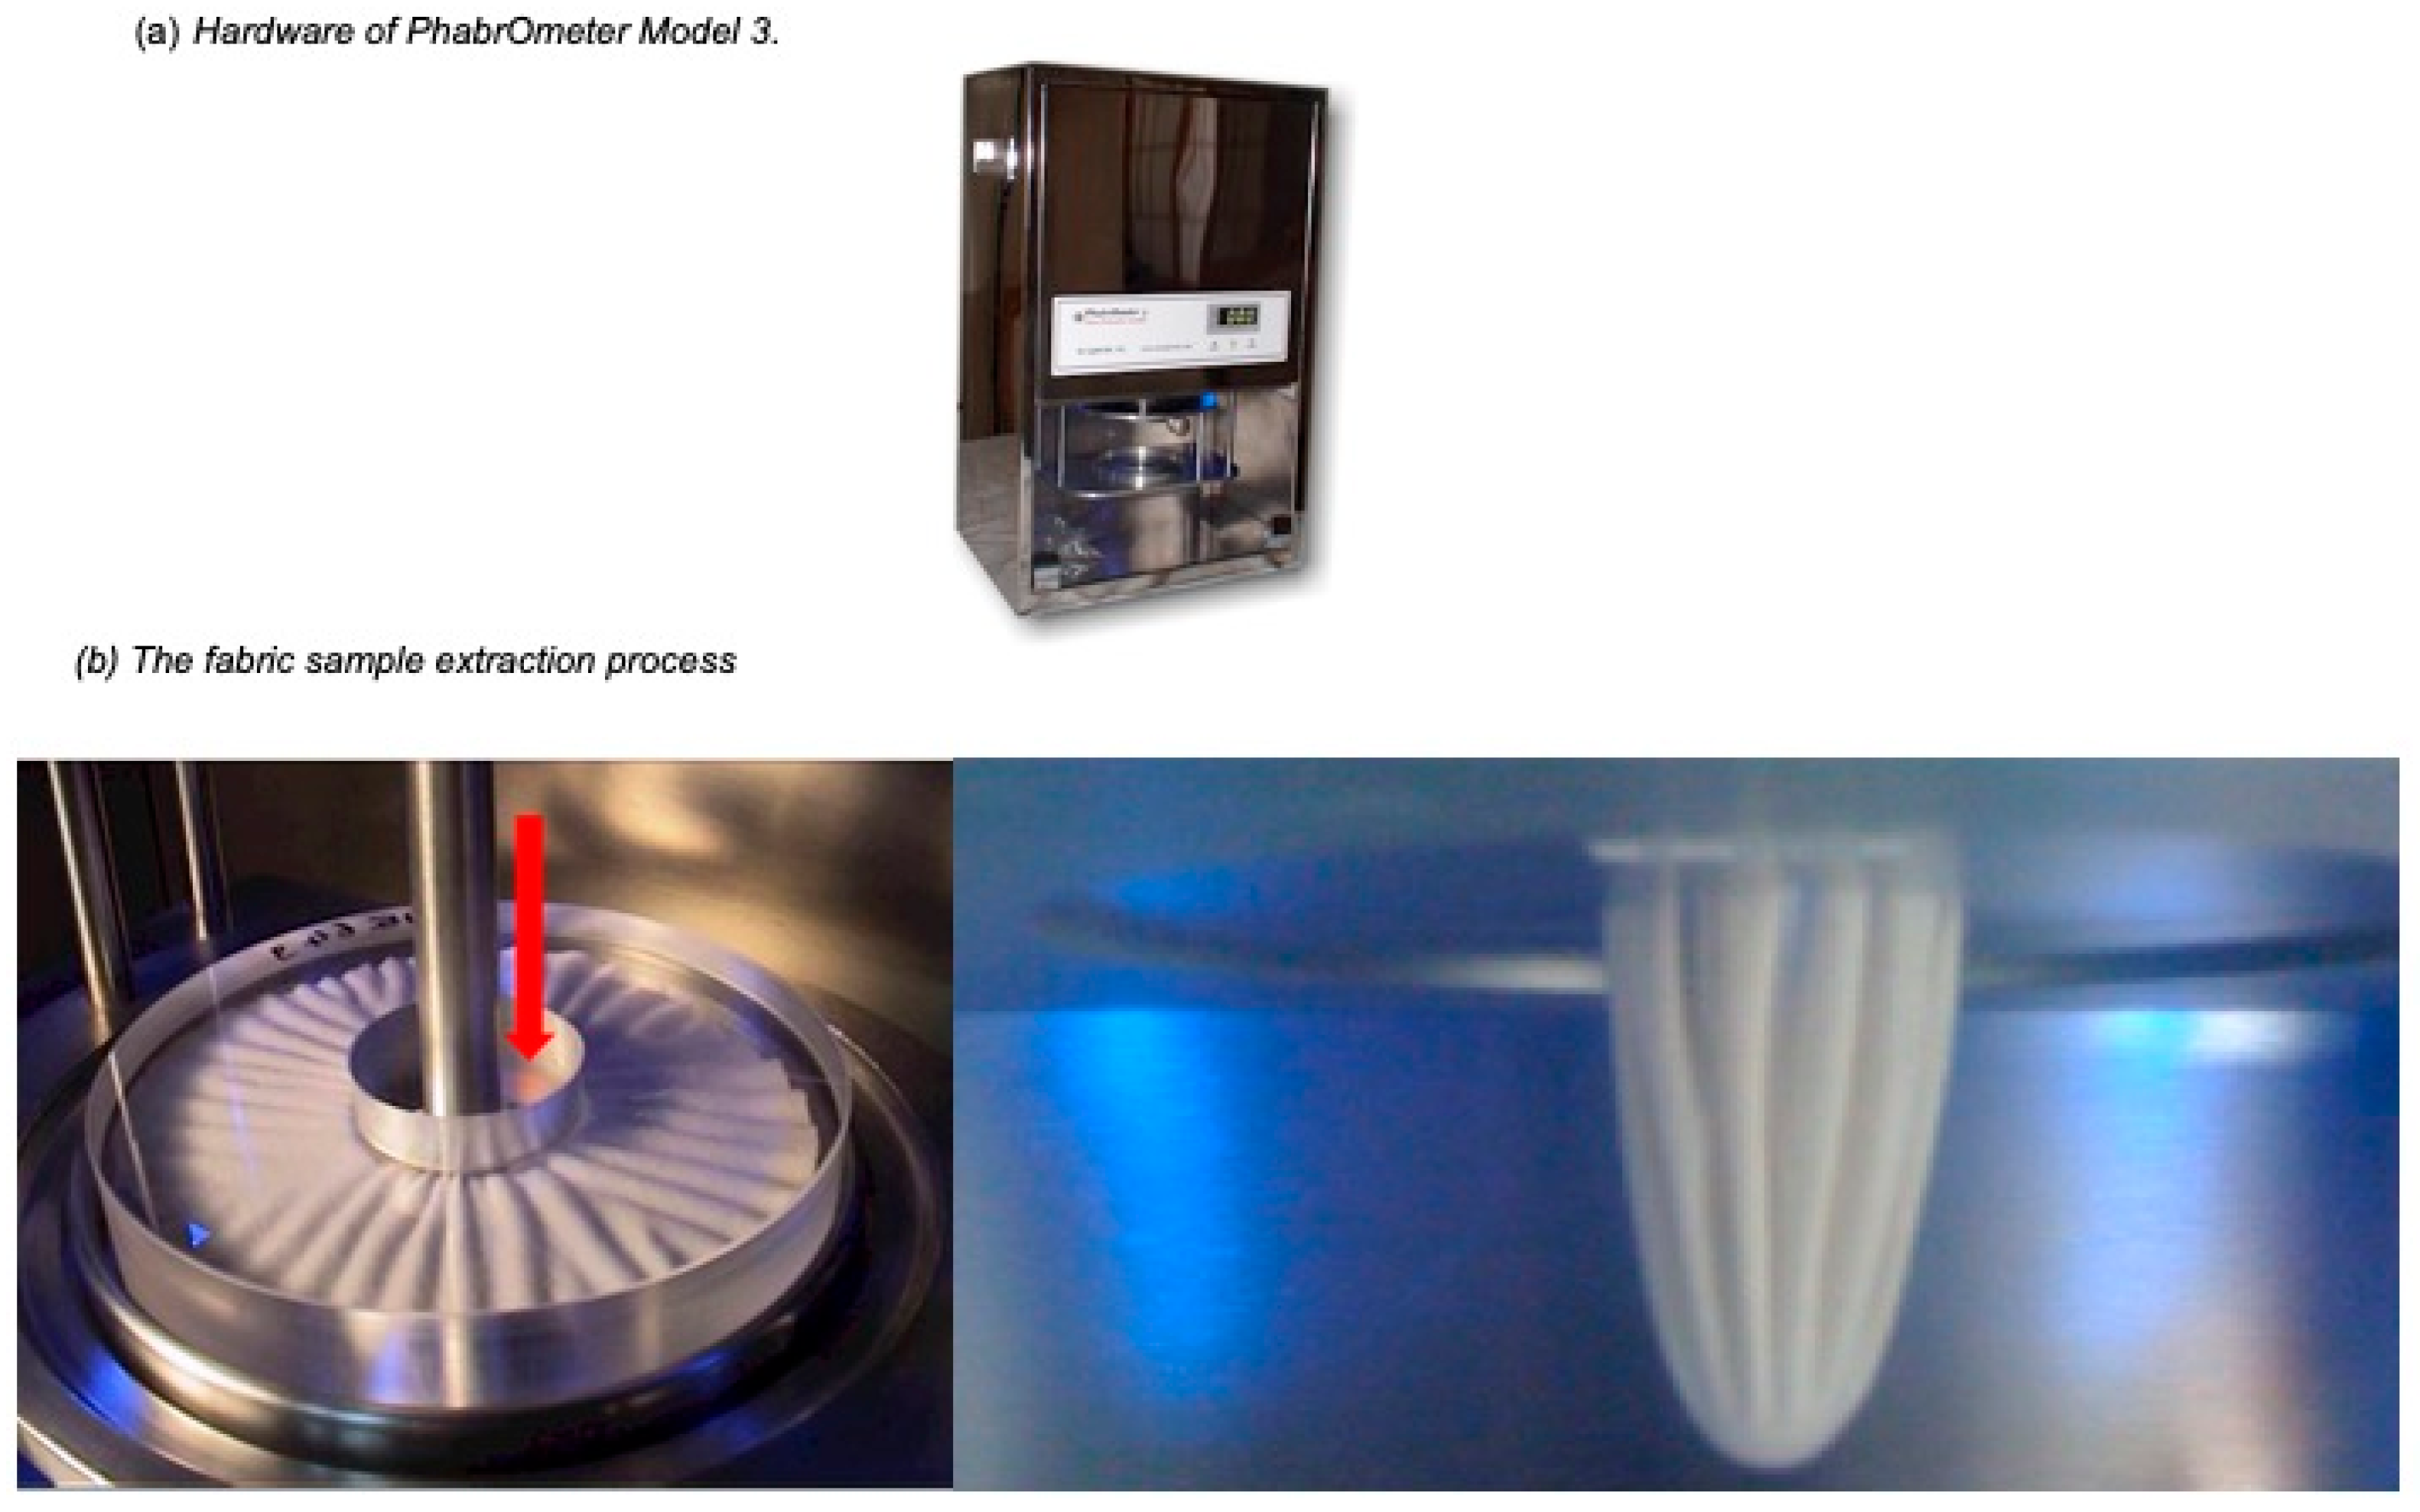
- In developing PhabrOmeter, it is known that, in the fabric extraction process, the fabric compaction density in the nozzle in Figure 1b is the key factor [52,53] in generating the test results. Increasing either fabric weight or thickness will lead to an increased fabric compaction density, i.e., both fabric weight and thickness affect the resultant parameter in the same trend.
- Structural differences (weaves, fiber types, etc.) can be specified afterwards within each resultant group, if necessary.
3. Samples and Test Methods
- Option A in ISO 9073-9:2008 was followed, using 30 cm specimen diameter.
- Three specimens for each fabric were tested on each side (face and back), thus six data points were obtained for one fabric.
- For each of the six readings from a given fabric, a drape coefficient value D was calculated as
4. Measurement by PhabrOmeter
5. Data Analysis
- Fabric linear density λ values calculated from Equation (2);
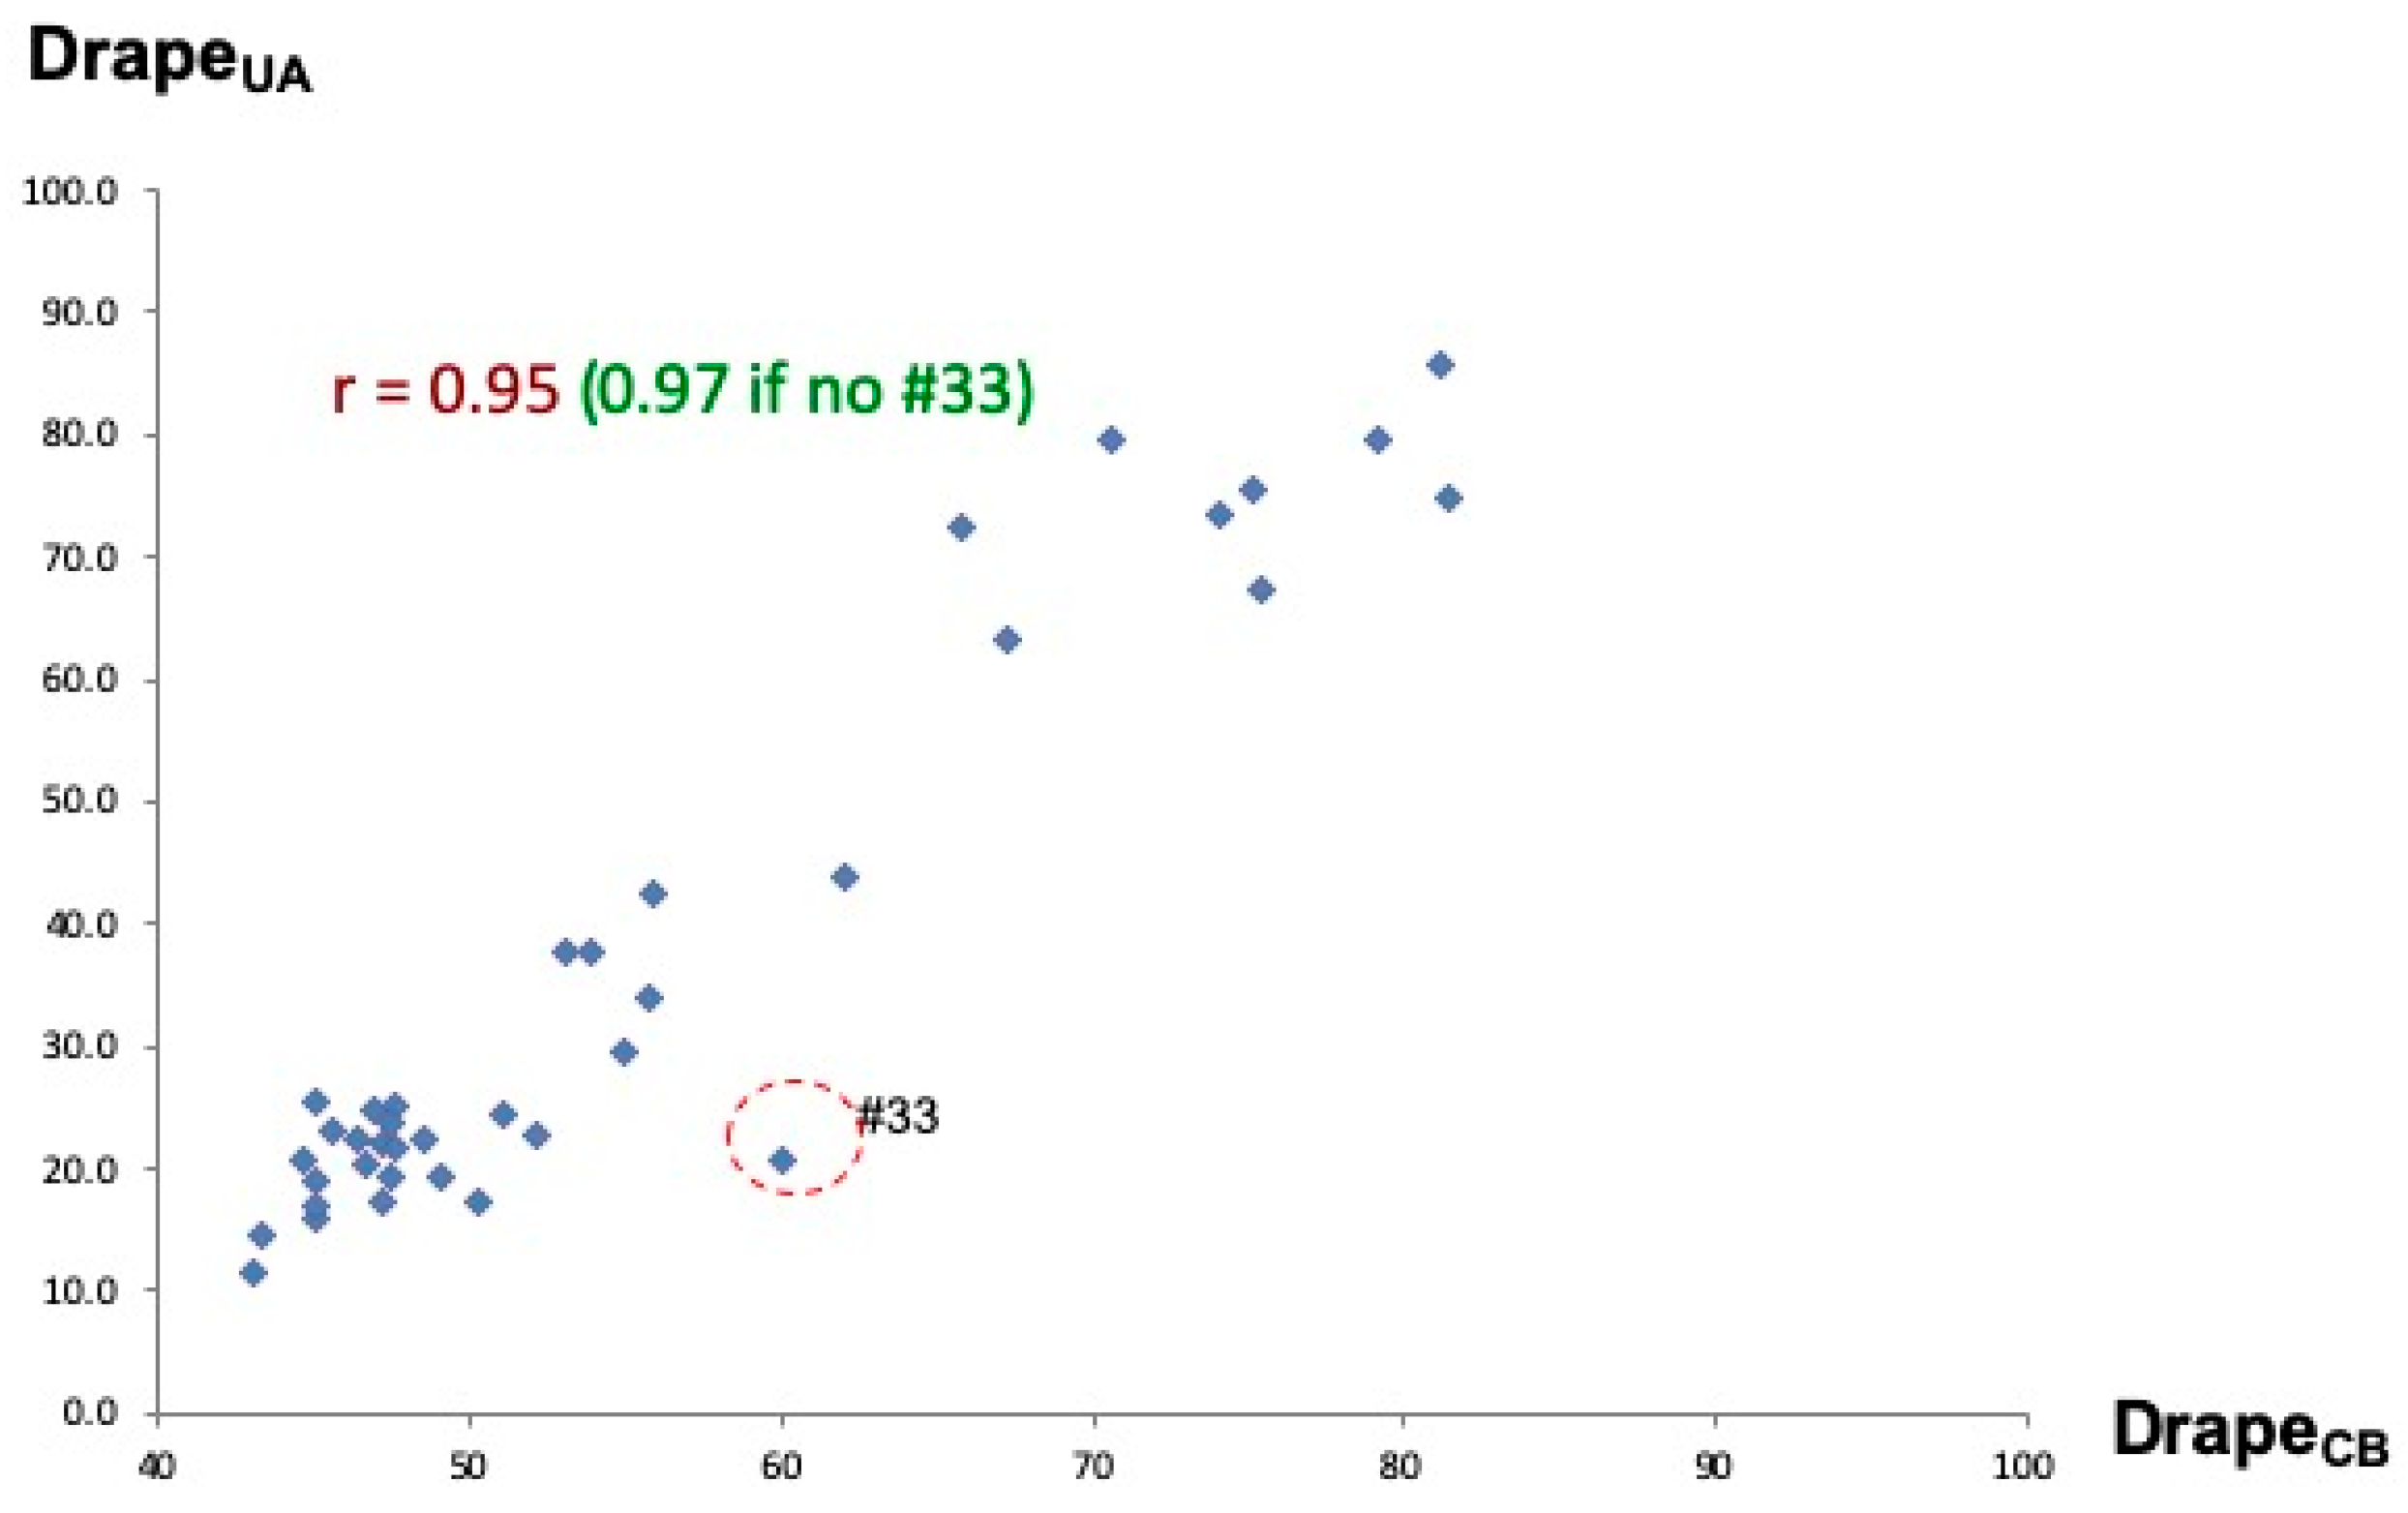
- Cusick data DrapeCB based on Option B in ISO 9073-9:2008 by Cotton Inc;
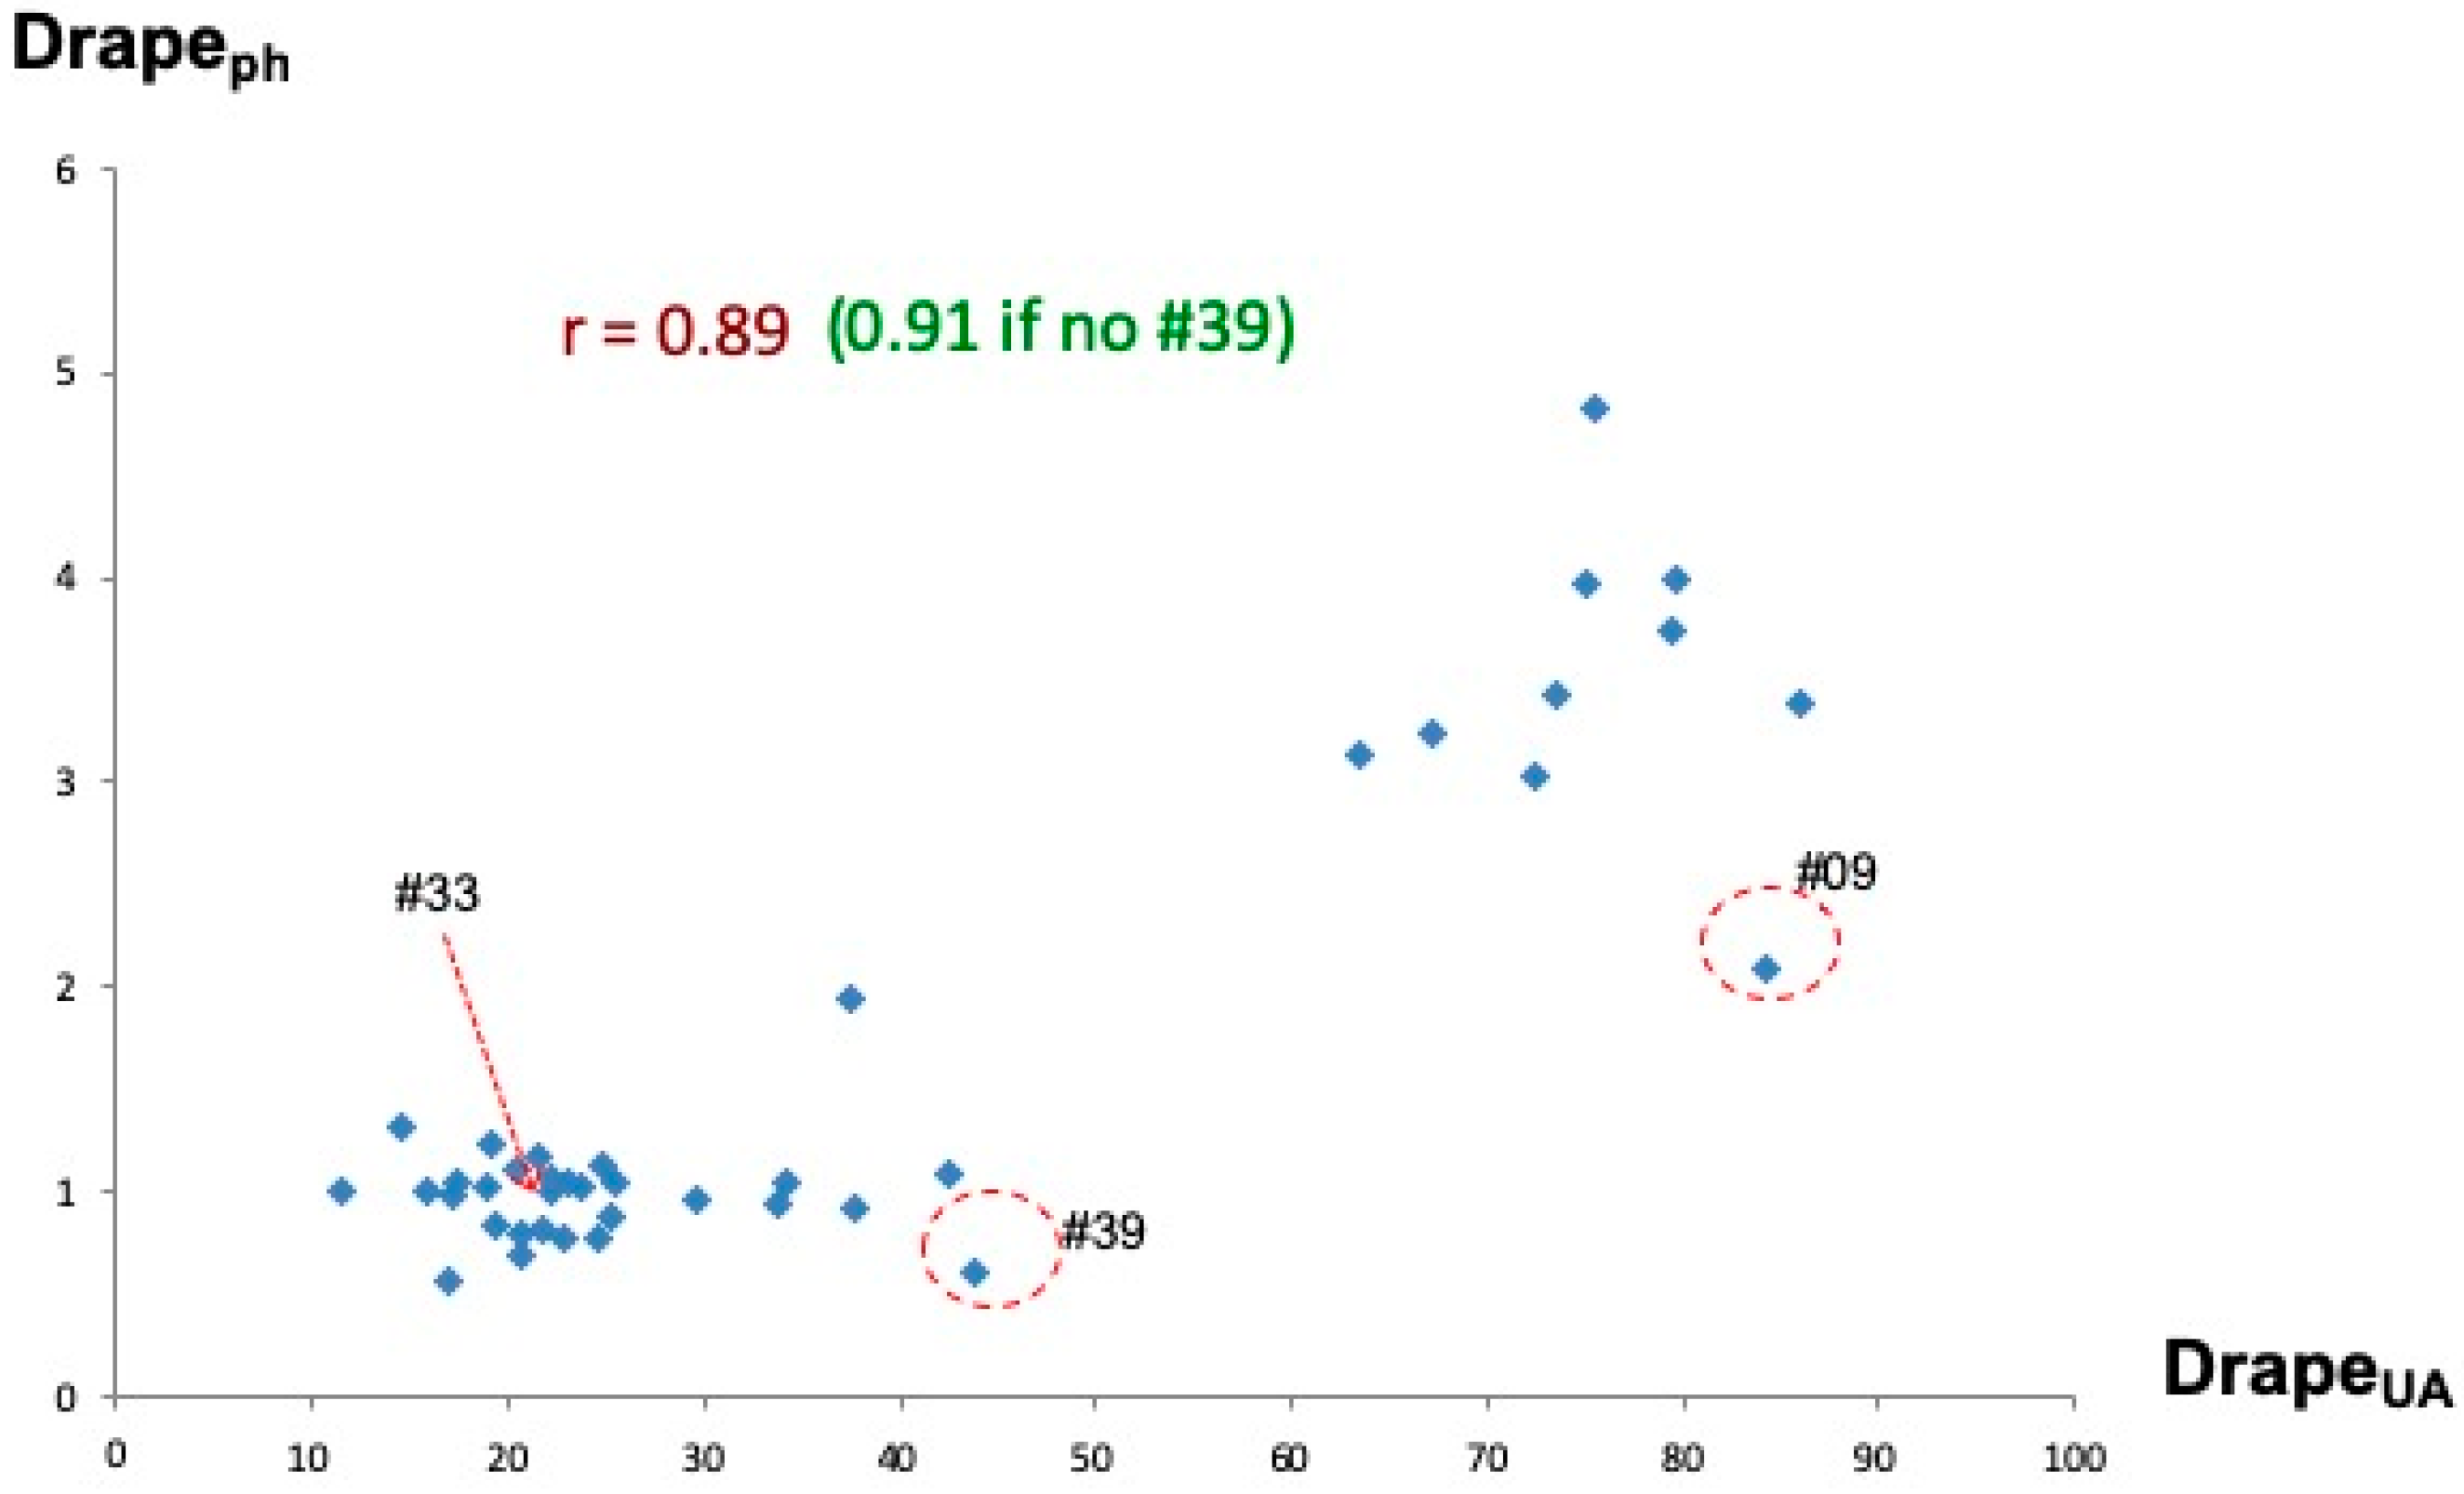
- Cusick data DrapeUA based on Option A in ISO 9073-9:2008 by UCD;
- DrapeUAB UCD Cusick Option A data rectified to Option B; and
- PhabrOmeter drape data DrapePh by UCD;
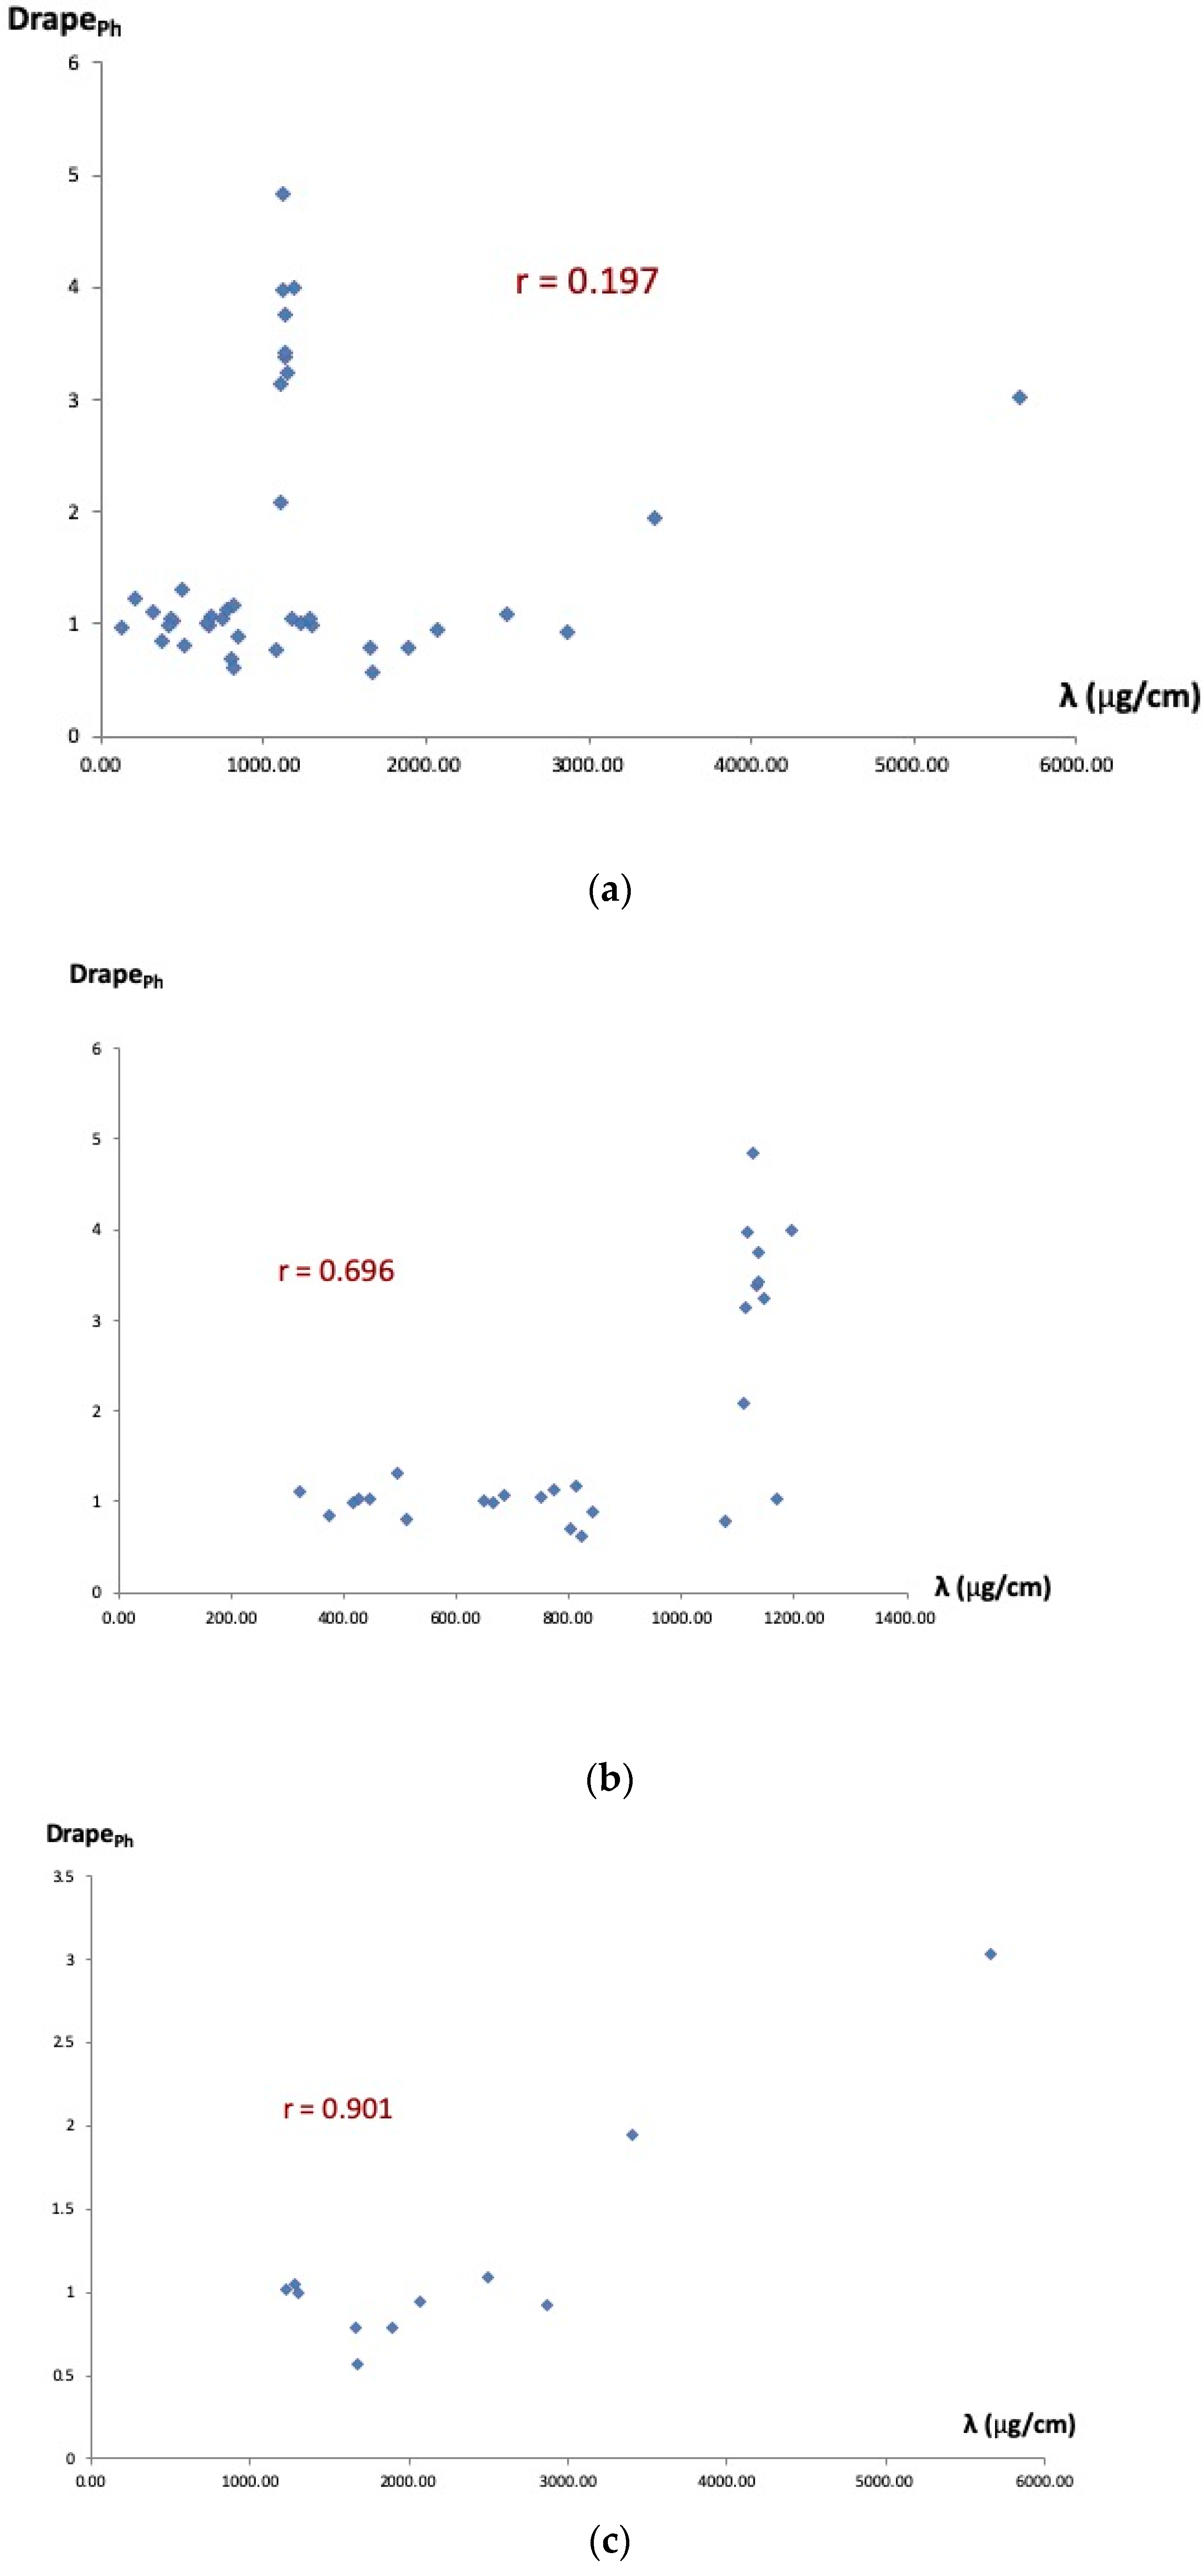
5.1. λ as a Fabric SAMPLE Classifier
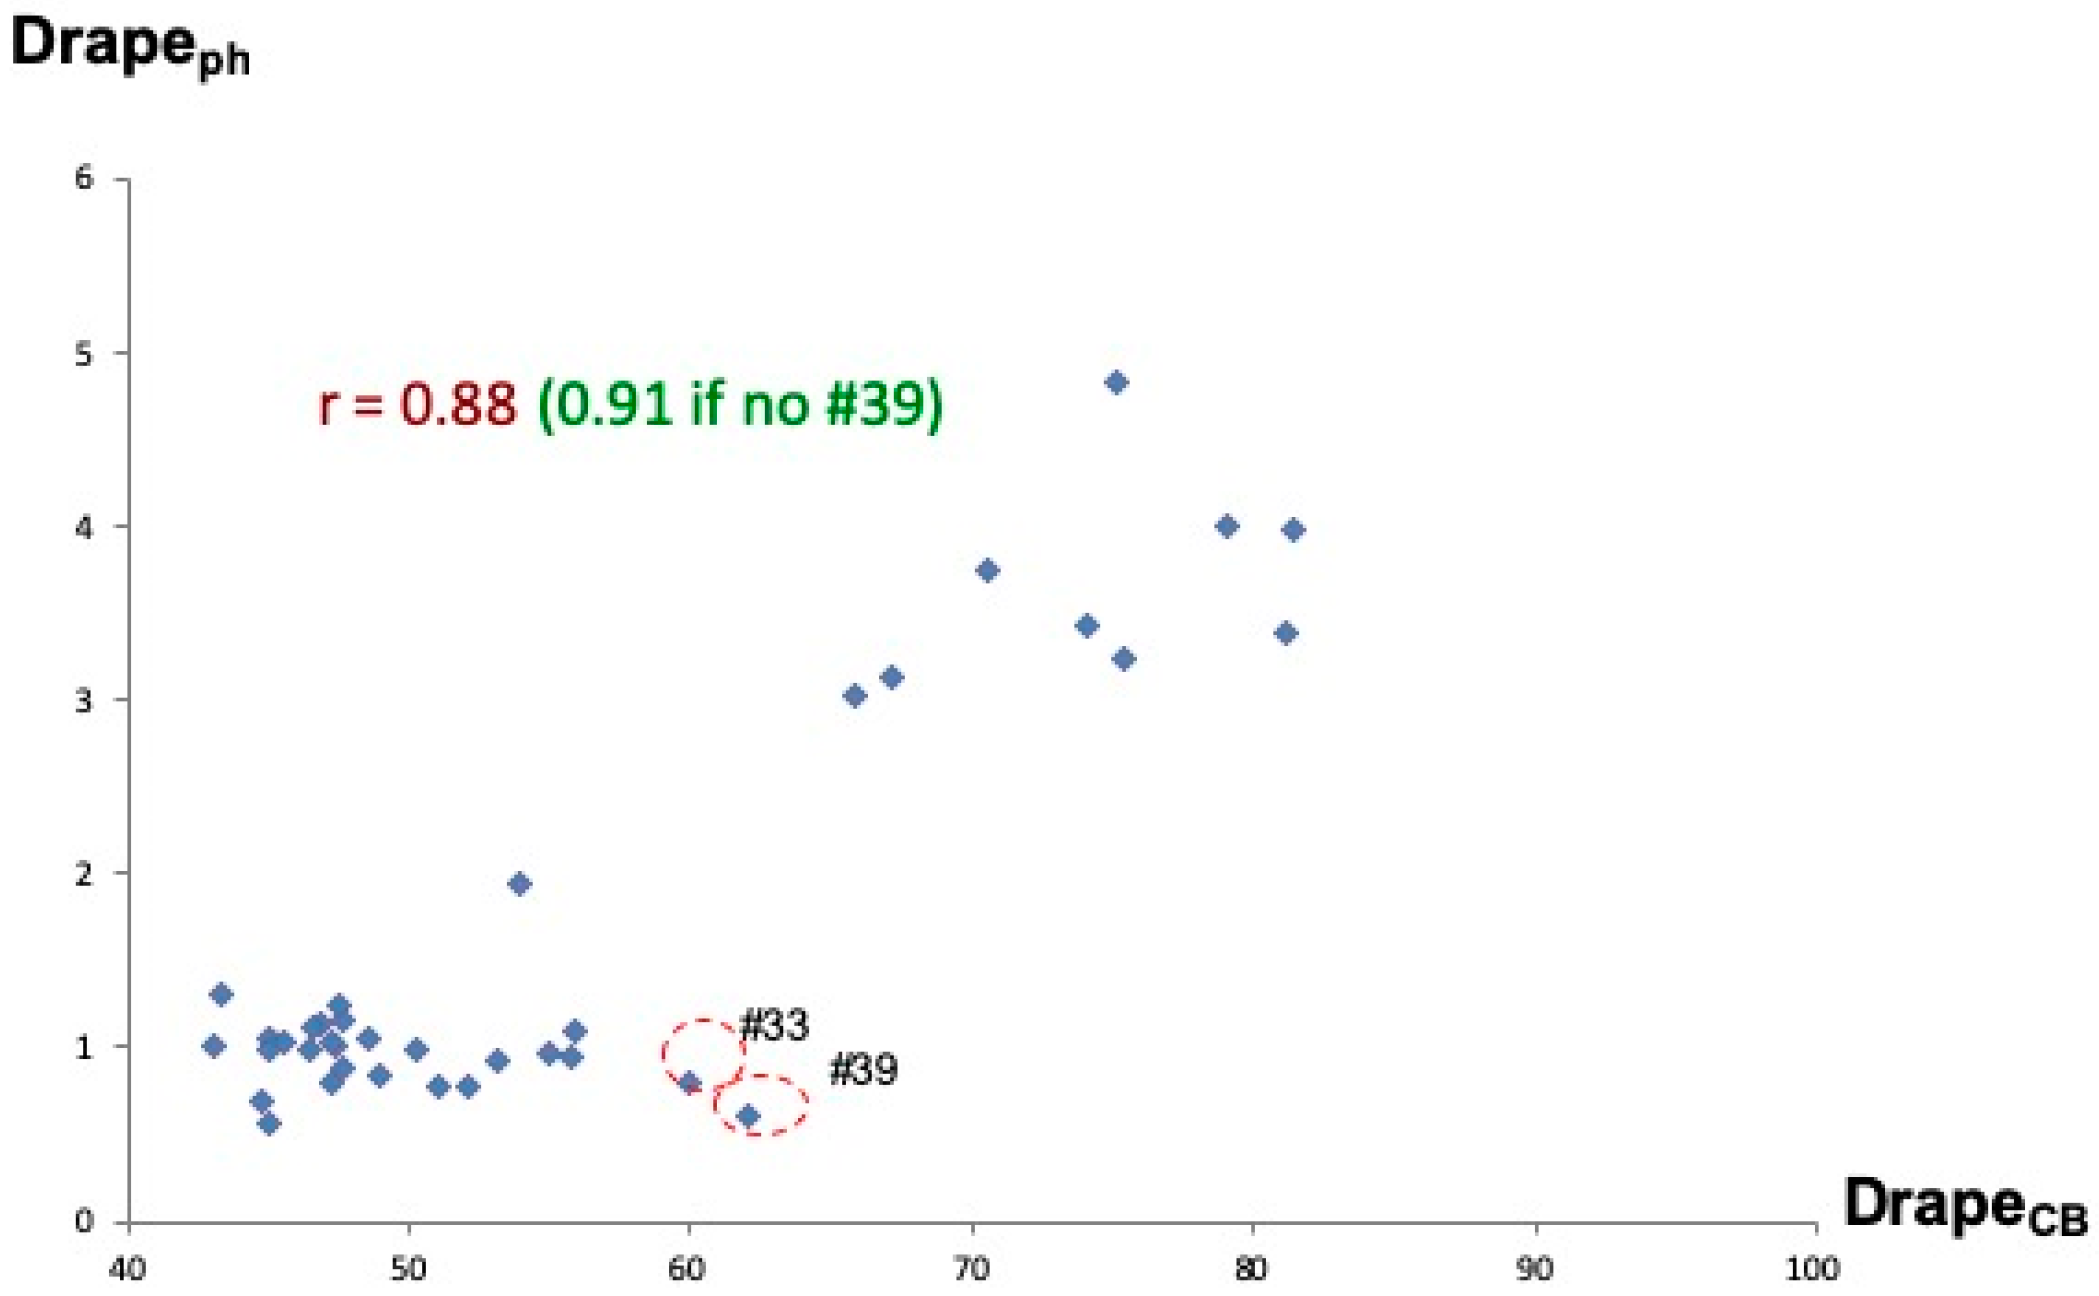
- DrapePh, DrapeUA and RHV are highly correlated with each other.
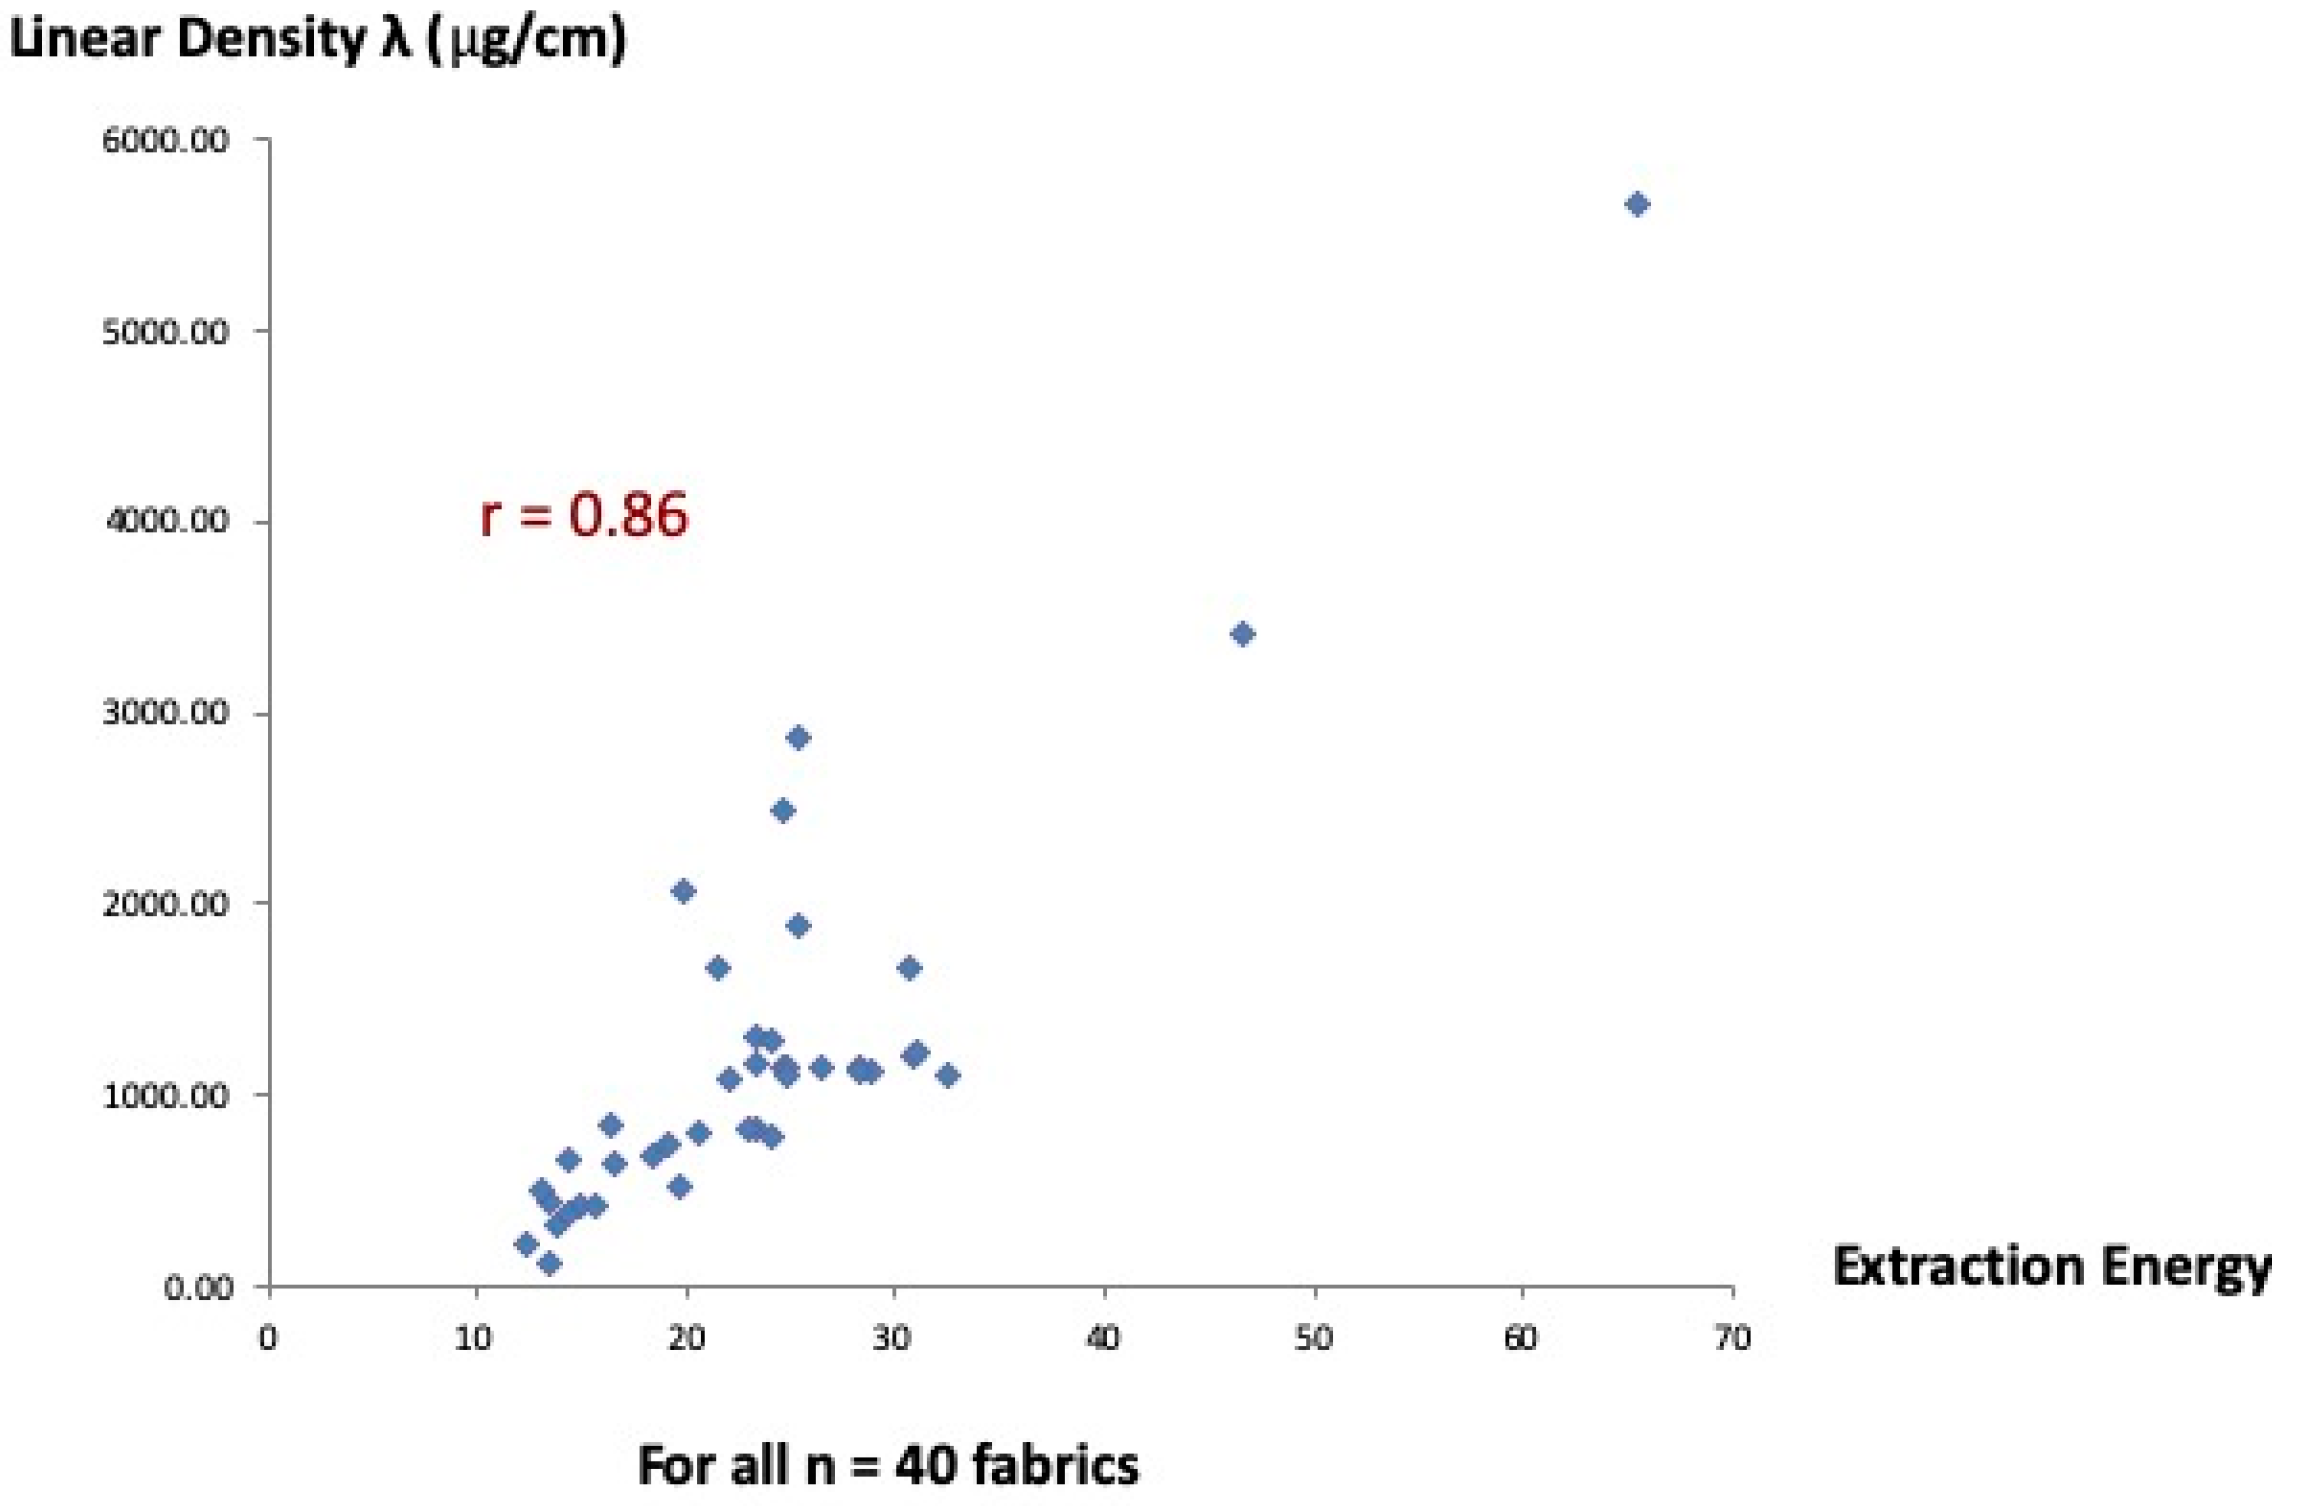
- Extraction energy only correlates significantly with the linear density.
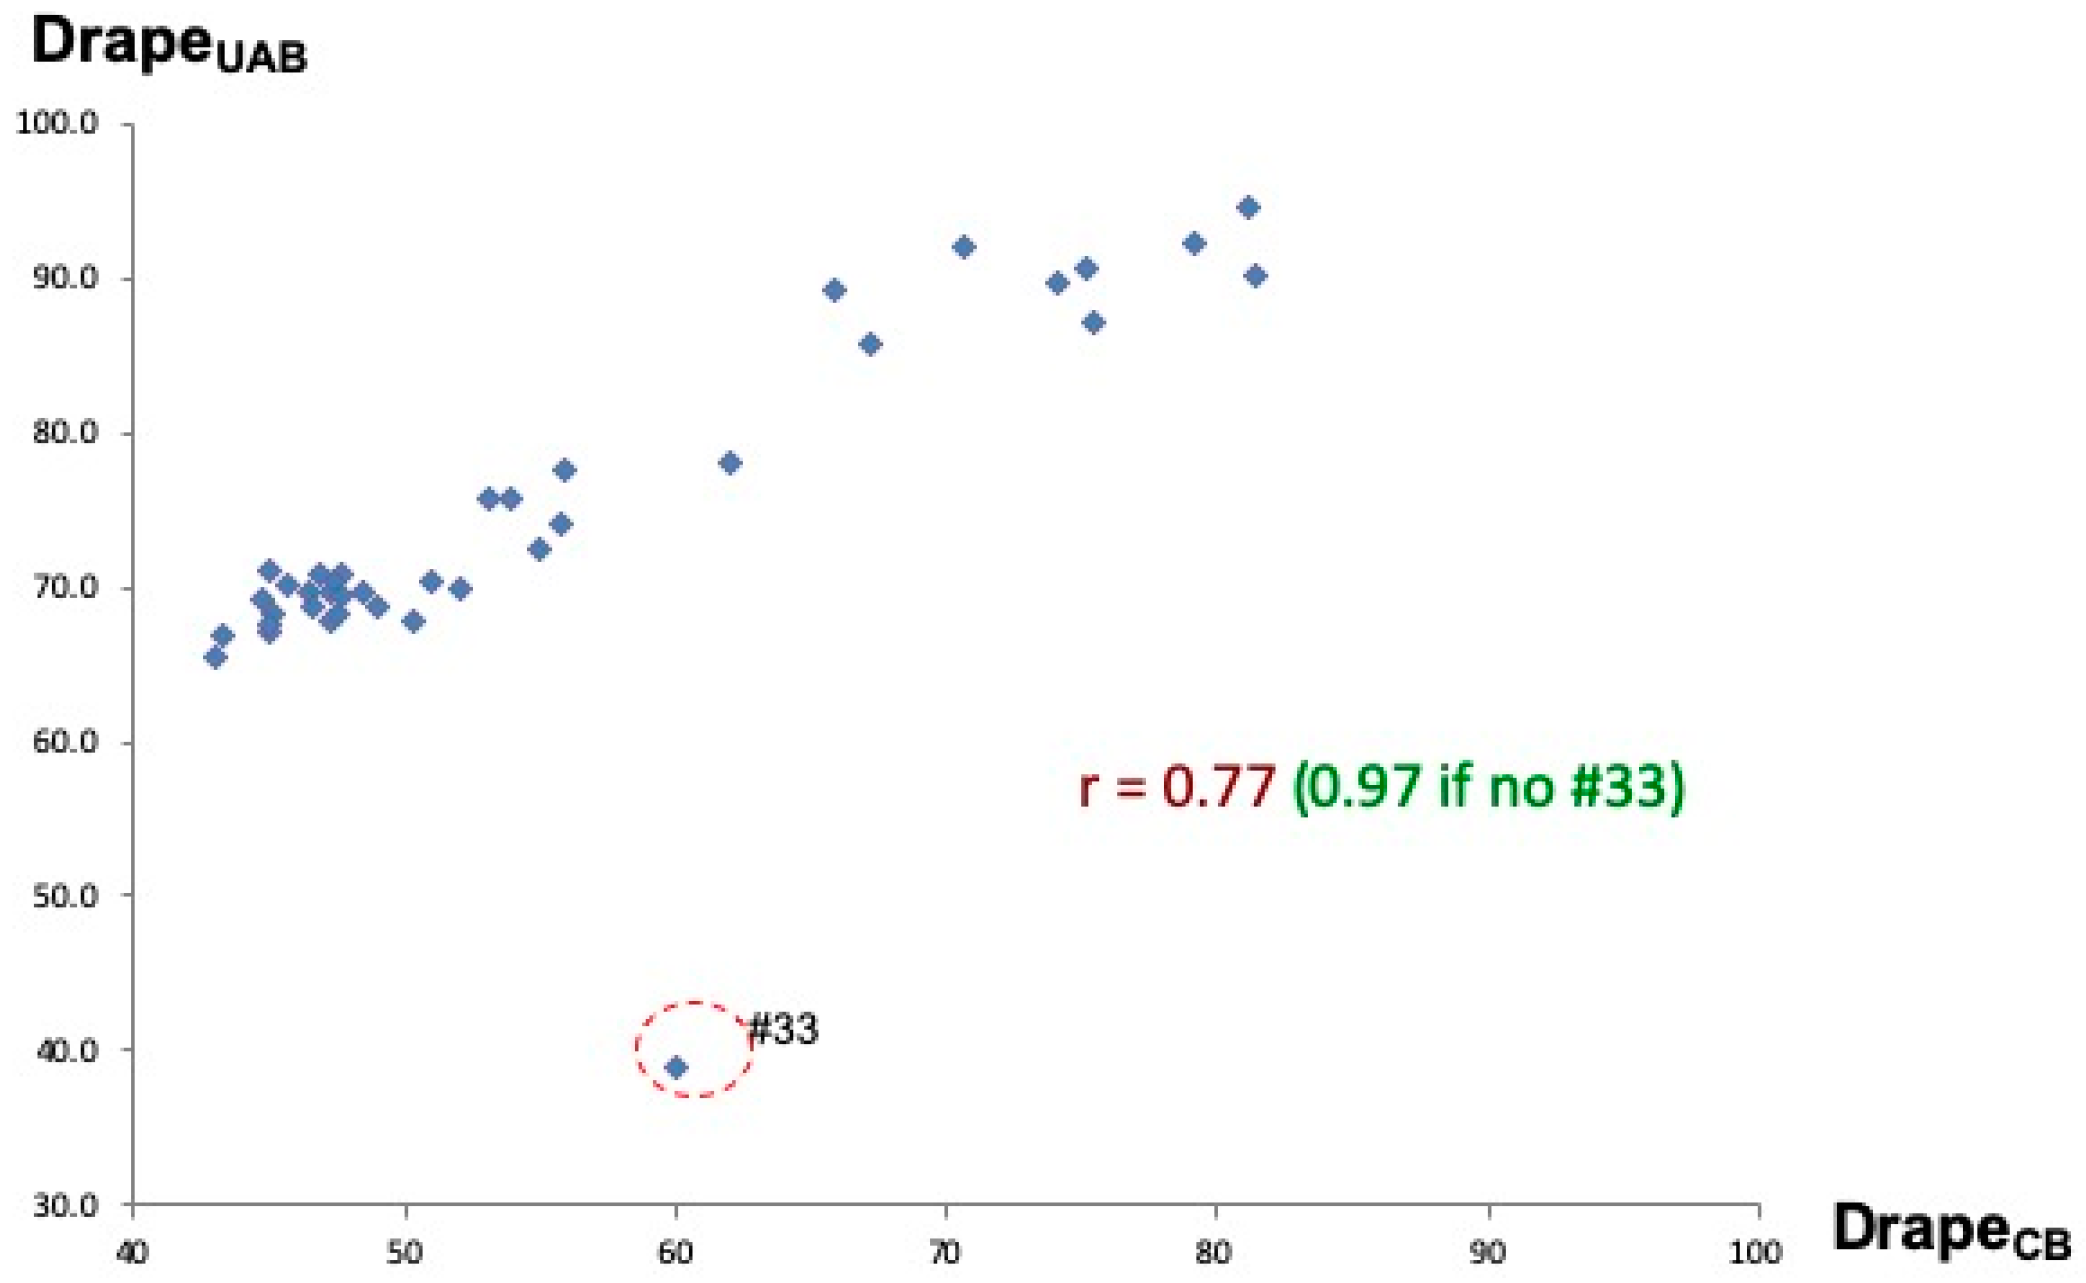
5.2. Comparison of Drape Data
5.3. Factors Influencing Fabric Drape Measurement
5.3.1. The Grouping Effect
- All (40 fabrics) were used in one group, and then split into Group 2 (27 light fabrics only) and Group 3 (11 Medium and heavy fabrics).
- Two fabrics (#26 and #38) in the Super light Group, and #31 in Heavy Group were eliminated from comparison.
- We used PhabrOmeter to test the drape data to explore the grouping effect associated with linear density λ.
5.3.2. Construction Type Effect
5.3.3. Effect of Fiber Types
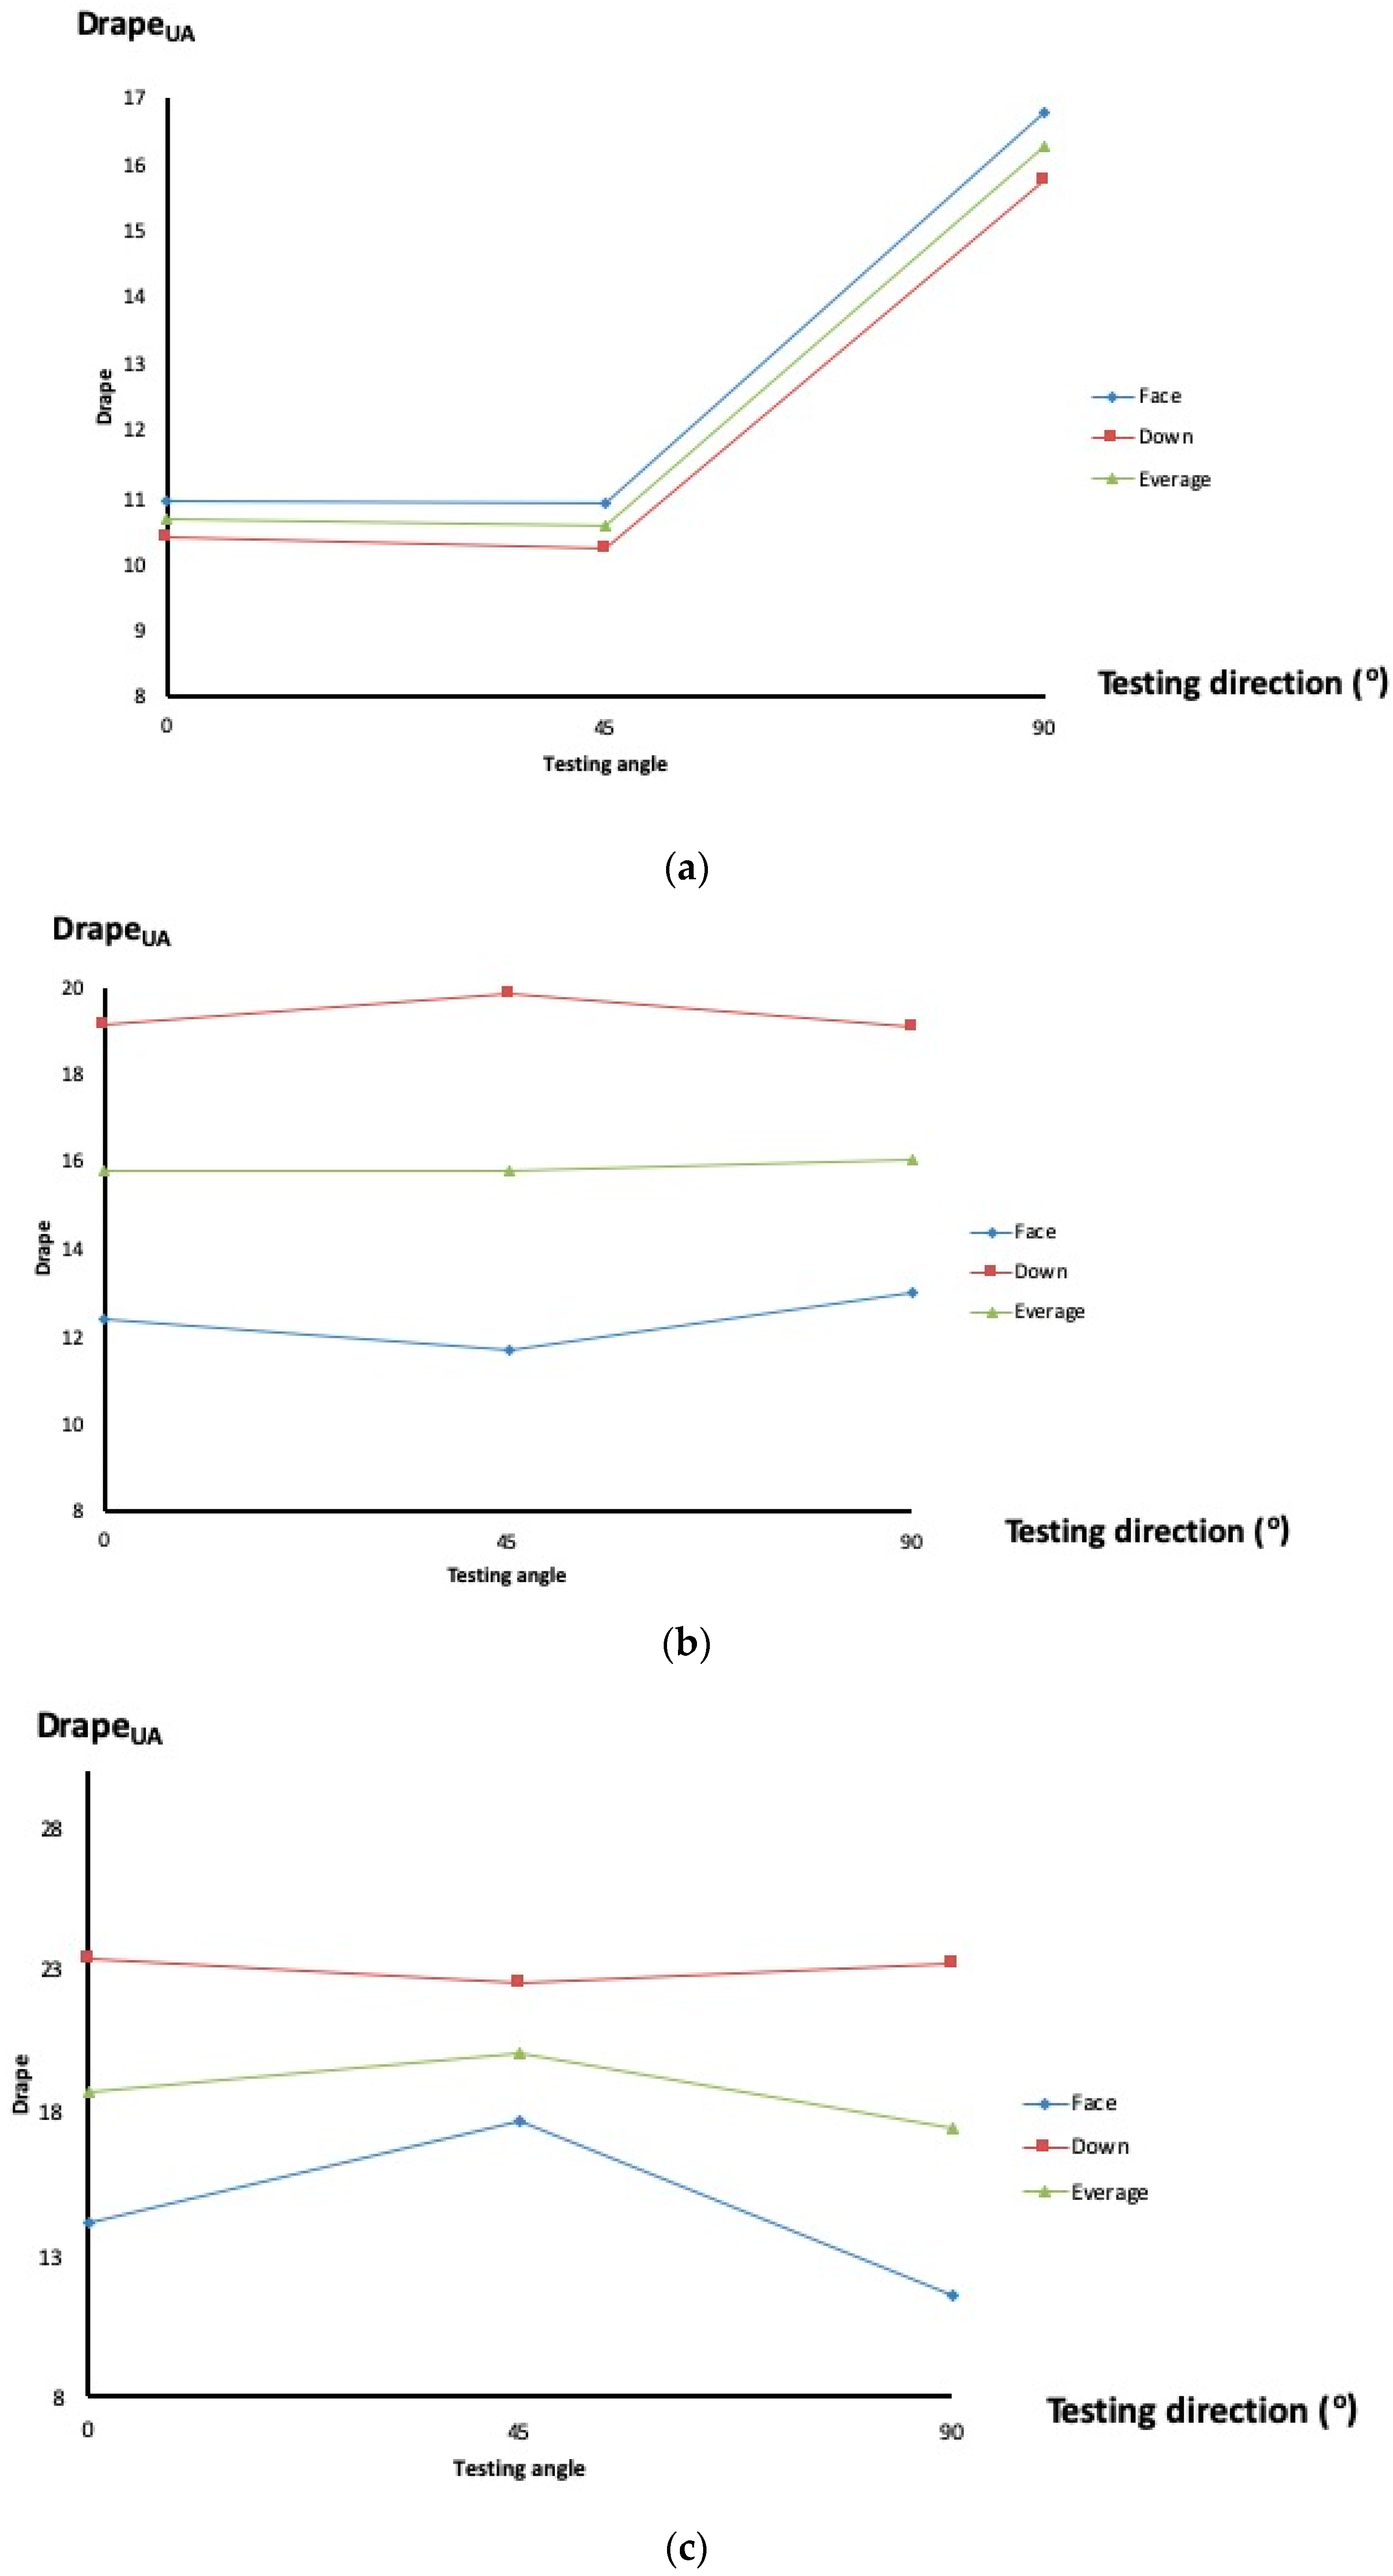
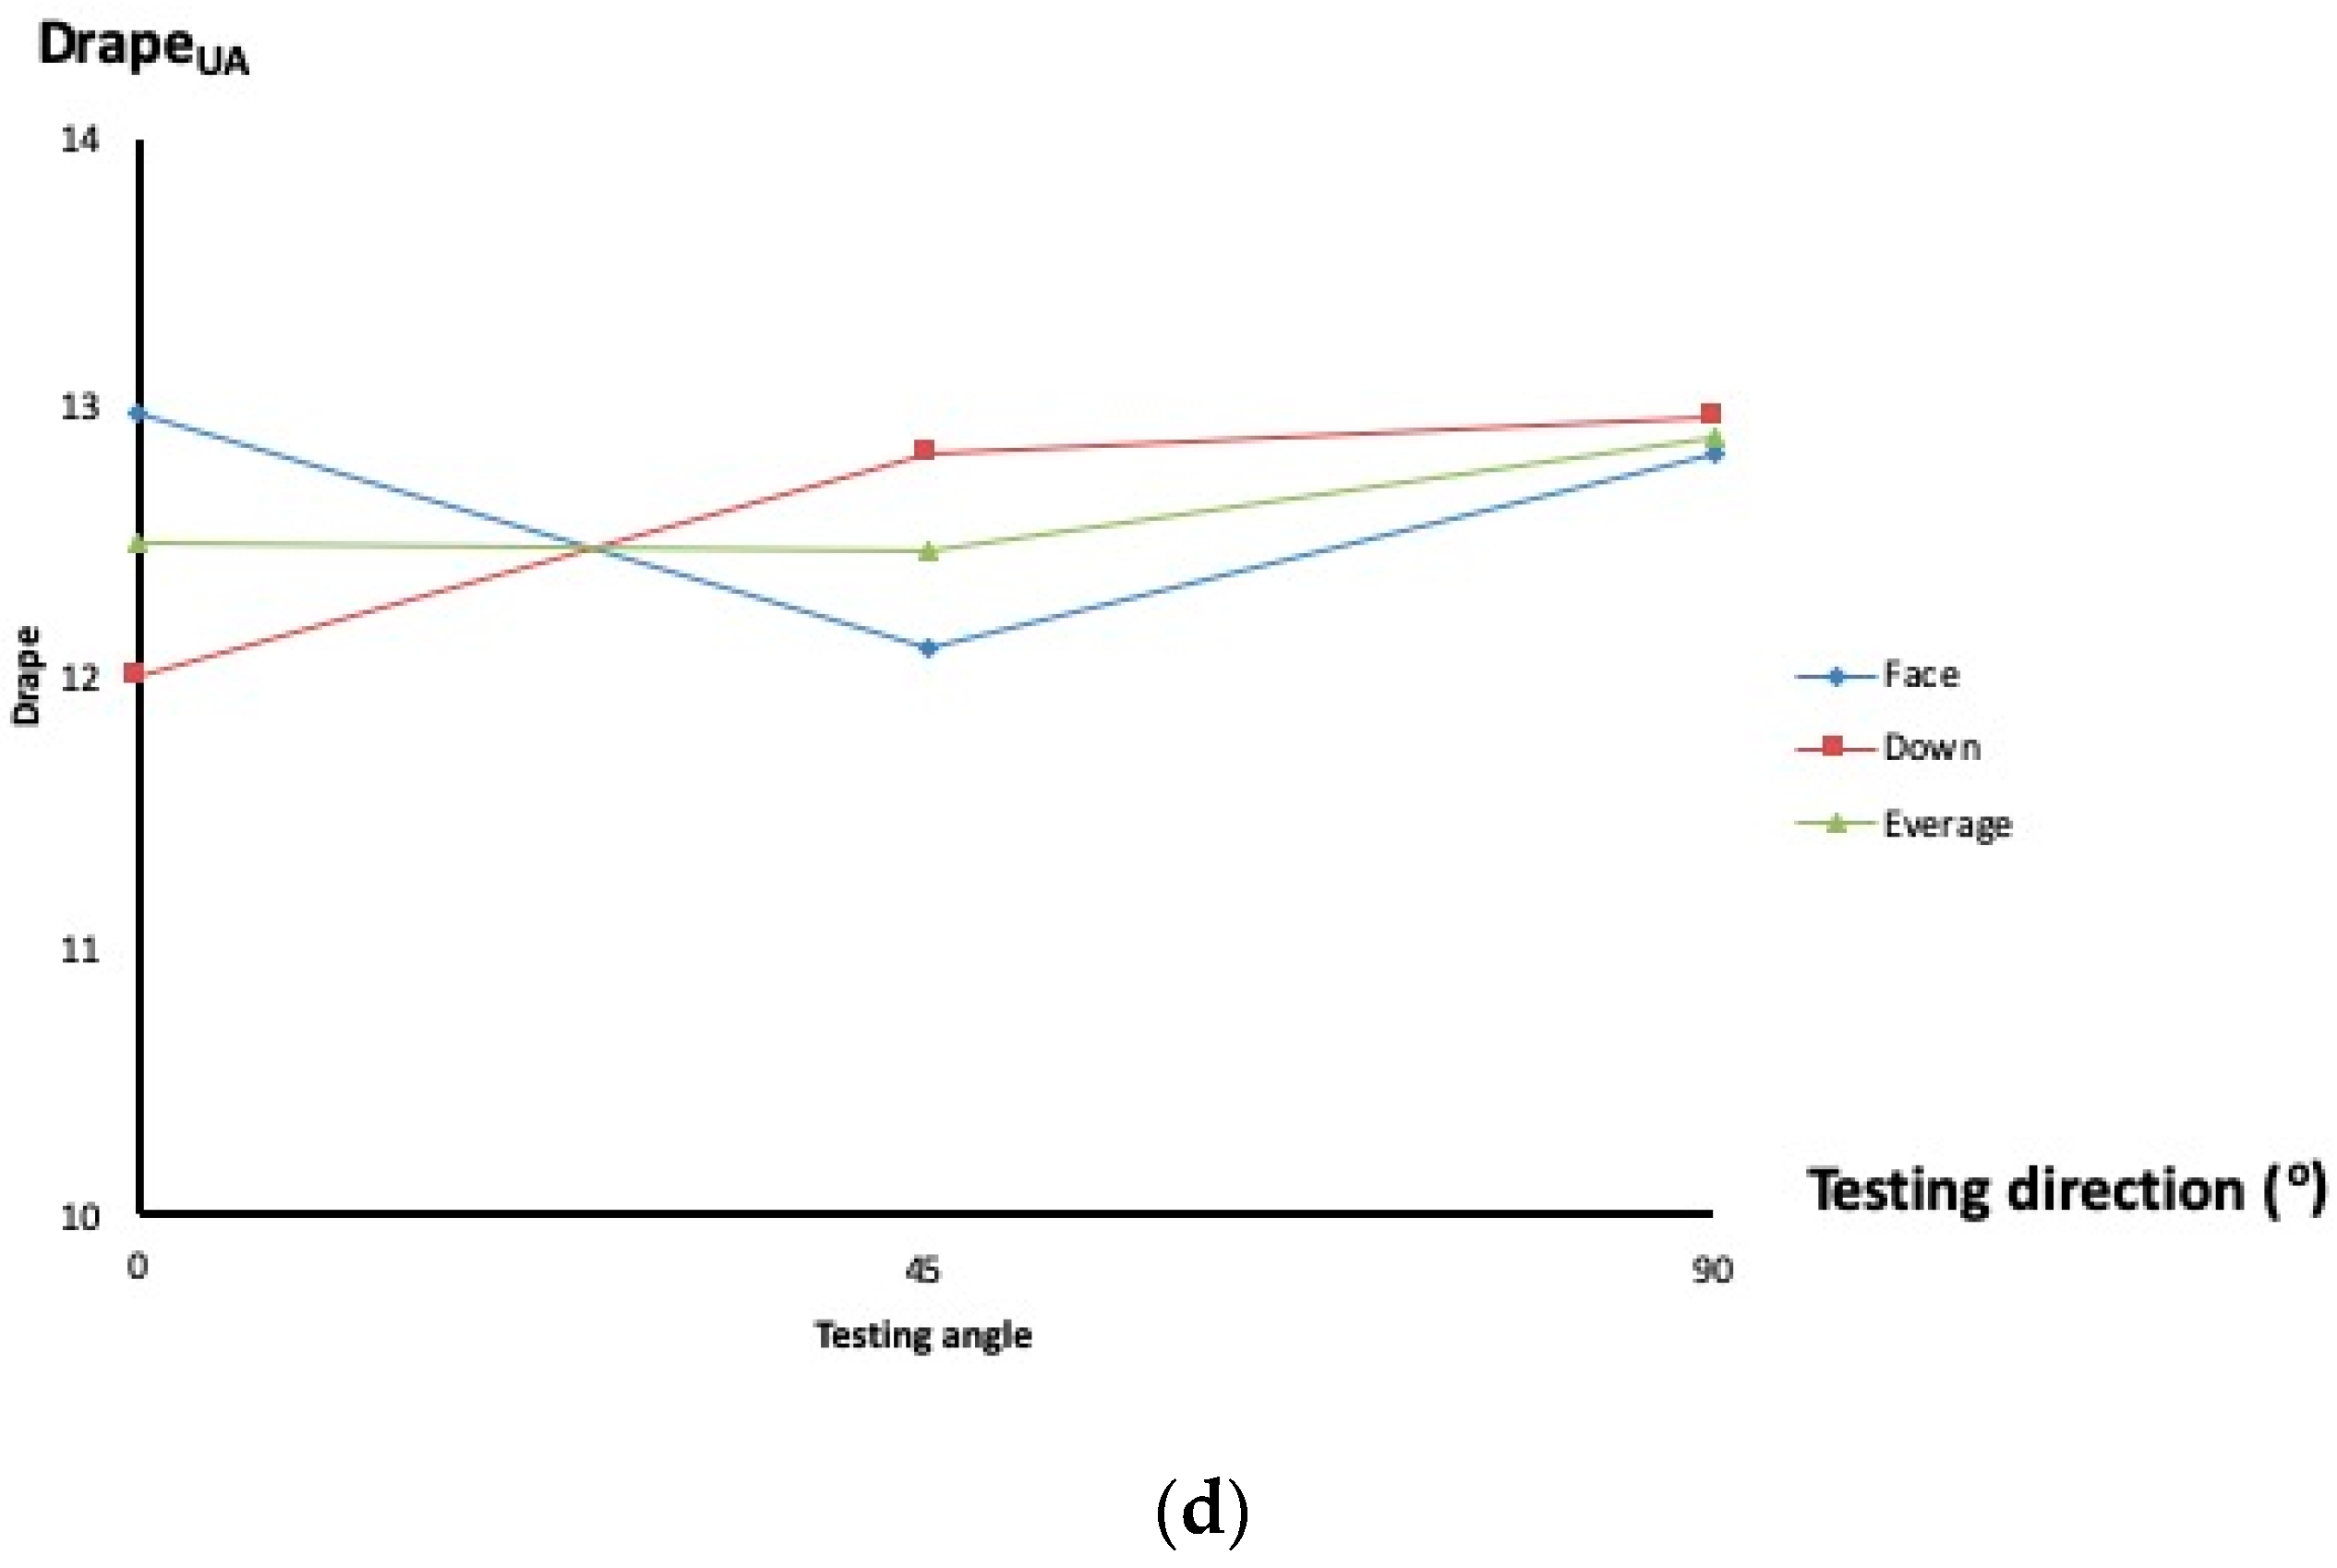
5.3.4. Side and Direction Effects
- Select 18 loosest, limpest and stretchiest fabrics out of the 40 fabric set.
- Follow Option A in ISO 9073-9:2008 for Cusick drape test, as directionality is not a concern for PhabrOmeter.
- Test by aligning the sample in three different directions: at 0°, 45°, and 90° between warp and the instrument width directions.
- Test both face and back sides.
- Being a single knit Inlay, #33 is a highly unstable structure. If not handled or even stored with extra caution during the whole process, inadvertent alternation of the fabric structure would lead to testing variations.
- Sample #33 has an extremely high (1852.4%) fabric stretch. It is thus hard to determine if there is any residual deformation left in a sample from previous stressing, resulting in changes in properties.
- Sample #33 also shows a very significant curl, known to cause testing error using Cusick method.
6. Conclusions
- cutting specimens into circular shape and being extracted during test by a force exerted at the sample center actually “isotropicize” the measurement process to reduce the variation caused by fabric directionality or anisotropies;
- as the samples are forced to drape, different sample sizes recommended in Cusick test are no longer necessary; and
- fabric curl, a tough problem in Cusick method, is no longer a concern for PhabrOmeter when the sample is actively compressed during test.
Author Contributions
Funding
Conflicts of Interest
References
- Peirce, F.T. The handle of cloth as a measurable quantity. J. Text. Inst. 1930, 21, T377–T416. [Google Scholar] [CrossRef]
- Chu, C.C.; Cummings, C.L.; Teixeira, N.A. Mechanics of elastic performance of textile materials part V: A study of the factors affecting the drape of fabrics-the development of a drape meter. Text. Res. J. 1950, 20, 539–548. [Google Scholar] [CrossRef]
- Cusick, G.E. Measurement of fabric drape. J. Text. Inst. 1968, 59, 253. [Google Scholar] [CrossRef]
- Pan, N. Quantification and evaluation of human tactile sense towards fabrics. Int. J. Des. Nat. 2006, 1, 48–60. [Google Scholar]
- Easson, M.; Edwards, J.; Mao, N.; Carr, C.; Marshall, D.; Qu, J.; Graves, E.; Reynolds, M.; Villalpando, A.; Condon, B. Structure/Function Analysis of Nonwoven Cotton Topsheet Fabrics: Multi-Fiber Blending Effects on Fluid Handling and Fabric Handle Mechanics. Materials 2018, 11, 2077. [Google Scholar] [CrossRef] [PubMed]
- Kan, C.W.; Lau, T.C. Use of Softener in Home Laundering of Cotton Fabric-Hand Feel Value Measurement by PhabrOmeter. Fibers Polym. 2018, 19, 2203–2207. [Google Scholar] [CrossRef]
- De Pascalis, F.; Nacucchi, M. Relationship between the anisotropy tensor calculated through global and object measurements in high-resolution X-ray tomography on cellular and composite materials. J. Microsc. 2019, 273, 65–80. [Google Scholar] [CrossRef]
- Tadesse, M.G.; Harpa, R.; Chen, Y.; Wang, L.; Nierstrasz, V.; Loghin, C. Assessing the comfort of functional fabrics for smart clothing using subjective evaluation. J. Ind. Text. 2019, 48, 1310–1326. [Google Scholar] [CrossRef]
- Hearle, J.W.S.; Grosberg, P.; Backer, S. Structural Mechanics of Yarns and Fabrics; Wiley-Interscience: New York, NY, USA, 1969. [Google Scholar]
- Jacob, M.; Subramaniam, V. A review of the literature on drape and pilling properties of textile fabrics. Colourage 1987, 34, 21–22. [Google Scholar]
- Gaucher, M.L.; King, M.W.; Johnston, B. Predicting the drape coefficient of knitted fabrics. Text. Res. J. 1983, 53, 297–303. [Google Scholar] [CrossRef]
- Stylios, G.K.; Zhu, R. The characterisation of the static and dynamic drape of fabrics. J. Text. Inst. 1997, 88, 465–475. [Google Scholar] [CrossRef]
- Postle, J.R.; Postle, R. The dynamics of fabric drape. Text. Res. J. 1999, 69, 623–629. [Google Scholar] [CrossRef]
- Matsudaira, M. Study on static and dynamic drape coefficients of fabrics. Sen-I Gakkaishi 2003, 59, P306–P310. [Google Scholar] [CrossRef]
- Taha, I.; Abdin, Y.; Ebeid, S. Analysis of the Draping Behaviour of Multi-Layer Textiles using Digital Image Processing. Polym. Polym. Compos. 2012, 20, 837–843. [Google Scholar] [CrossRef]
- Döbrich, O.; Gereke, T.; Cherif, C.; Krzywinski, S. Analysis and finite element simulation of the draping process of multilayer knit structures and the effects of a localized fixation. Adv. Compos. Mater. 2013, 22, 175–189. [Google Scholar] [CrossRef]
- Fischer, P.; Krzywinski, S.; Rodel, H.; Schenk, A.; Ulbricht, V. Simulating the drape behavior of fabrics. Text. Res. J. 1999, 69, 331–334. [Google Scholar] [CrossRef]
- Dias, J.M.S.; Gamito, M.N.; Rebordao, J.M. A discretized linear elastic model for cloth buckling and drape. Text. Res. J. 2000, 70, 285–297. [Google Scholar] [CrossRef]
- Hu, J.L.; Chen, S.F.; Teng, J.G. Numerical drape behavior of circular fabric sheets over circular pedestals. Text. Res. J. 2000, 70, 593–603. [Google Scholar]
- Bruniaux, P.; Vasseur, C. Modeling and identifying the parameters of a fabric drape model. Text. Res. J. 2001, 71, 336–342. [Google Scholar] [CrossRef]
- Fan, J.; Newton, E.; Au, R.; Chan, S.C.F. Predicting garment drape with a fuzzy-neural network. Text. Res. J. 2001, 71, 605–608. [Google Scholar] [CrossRef]
- Fare, N.; Maitre, E. Existence of solutions for a woven fabric drape model. Comptes Rendus De L Acad. Des Sci. Serie I-Math. 2001, 333, 967–972. [Google Scholar]
- Hofstee, J.; van Keulen, F. 3-D geometric modeling of a draped woven fabric. Compos. Struct. 2001, 54, 179–195. [Google Scholar] [CrossRef]
- Lo, W.M.; Hu, J.L.; Li, L.K. Modeling a fabric drape profile. Text. Res. J. 2002, 72, 454–463. [Google Scholar] [CrossRef]
- Bruniaux, P.; Ghith, A.; Vasseur, C. Modeling and parametric study of a fabric drape. Adv. Complex Syst. 2003, 6, 457–476. [Google Scholar] [CrossRef]
- Termonia, Y. Lattice model for the drape and bending properties of nonwoven fabrics. Text. Res. J. 2003, 73, 74–78. [Google Scholar] [CrossRef]
- Sirtautas, J.; Pickett, A.K.; Lepicier, P. A mesoscopic model for coupled drape-infusion simulation of biaxial Non-Crimp Fabric. Compos. Part B-Eng. 2013, 47, 48–57. [Google Scholar] [CrossRef]
- Chen, B.J.; Govindaraj, M. A physically-based model of fabric drape using flexible shell theory. Text. Res. J. 1995, 65, 324–330. [Google Scholar] [CrossRef]
- Stump, D.M.; Fraser, W.B. A simplified model of fabric drape based on ring theory. Text. Res. J. 1996, 66, 506–514. [Google Scholar] [CrossRef]
- Chen, M.X.; Sun, Q.P.; Yuen, M.F. Simulation of fabric drape using a thin plate element with finite rotation. Acta Mech. Sin. 1998, 14, 239–247. [Google Scholar]
- Dhande, S.G.; Rao, P.V.M.; Tavakkoli, S.; Moore, C.L. Geometric Modeling of Draped Fabric Surfaces. In Graphics, Design and Visualization; Mudur, S.P., Pattanaik, S.N., Eds.; Elsevier: Amsterdam, The Netherlands, 1993; pp. 349–356. [Google Scholar]
- Al-Gaadi, B.; Goktepe, F.; Halasz, M. A new method in fabric drape measurement and analysis of the drape formation process. Text. Res. J. 2012, 82, 502–512. [Google Scholar] [CrossRef]
- Mizutani, C.; Amano, T.; Sakaguchi, Y. A new apparatus for the study of fabric drape. Text. Res. J. 2005, 75, 81–87. [Google Scholar] [CrossRef]
- Sun, M.N. A new tester and method for measuring fabric stiffness and drape. Text. Res. J. 2008, 78, 761–770. [Google Scholar] [CrossRef]
- Jacob, M.; Subramanniam, V. Assessment of drape of uniform fabrics. Colourage 1990, 37, 21–22. [Google Scholar]
- Szabo, L.; Halasz, M. Examination of dependence of drape coefficient on the samples size. Tekstil 2008, 57, 439–447. [Google Scholar]
- Tamas, P.; Gersak, J.; Halasz, M. Sylvie((R)) 3D drape tester-New system for measuring fabric drape. Tekstil 2006, 55, 497–502. [Google Scholar]
- Farajikhah, S.; Madanipour, K.; Saharkhiz, S.; Latifi, M. Shadow Moire Aided 3-D Reconstruction of Fabric Drape. Fibers Polym. 2012, 13, 928–935. [Google Scholar] [CrossRef]
- Jeong, Y.J. A study of fabric-drape behaviour with image analysis part I: Measurement, characterisation, and instability. J. Text. Inst. 1998, 89, 59–69. [Google Scholar] [CrossRef]
- Kown, E.S.; Yoon, S.Y.; Sul, I.H.; Kim, S.; Park, C.K. A Quantitative Fabric Drape Evaluation System Using Image-Processing Technology, Part 2: Effect of Fabric Properties on Drape Parameters. J. Test. Eval. 2010, 38, 263–270. [Google Scholar]
- Park, C.K.; Kim, S.; Yu, W.R. Quantitative fabric drape evaluation system using image processing technology (Part 1: Measurement system and geometric model). J. Test. Eval. 2004, 32, 131–137. [Google Scholar] [CrossRef]
- Willems, A.; Lomov, S.V.; Verpoest, I.; Vandepitte, D. Drape-ability characterization of textile composite reinforcements using digital image correlation. Opt. Lasers Eng. 2009, 47, 343–351. [Google Scholar] [CrossRef]
- Kawabata, S. The Standardization and Analysis of Handle Evaluation, 2nd ed.; The Textile Machinery Society of Japan: Osaka, Japan, 1980. [Google Scholar]
- Pan, N.; Yen, K.C.; Zhao, S.J.; Yang, S.R. A new approach to the objective evaluation of fabric handle from mechanical-properties. Text. Res. J. 1988, 58, 438–444. [Google Scholar] [CrossRef]
- Pan, N.; Yen, K.C. Physical interpretations of curves obtained through the fabric extraction process for handle measurement. Text. Res. J. 1992, 62, 279–290. [Google Scholar] [CrossRef]
- Nu Cybertek, Inc. PhabrOmeter. 2014. Available online: http://www.nucybertek.com (accessed on 23 July 2019).
- Wang, H.; Mahar, T.J.; Pan, N.; Postle, R. Objective handle evaluation of next-to-skin fabrics knitted from merino wool. In Proceedings of the 86th Textile Institute World Conference, Hong kong, China, 18–21 November 2008; Volume 3. [Google Scholar]
- Mahar, T.J.; Wang, H. Measuring fabric handle to define luxury: An overview of handle specification in next-to-skin knitted fabrics from Merino wool. Anim. Prod. Sci. 2010, 50, 1082–1088. [Google Scholar] [CrossRef]
- AATCC. Test Method 202–2012, Relative Hand Value of Textiles: Instrumental Method; AATCC: Raleigh, NC, USA, 2012. [Google Scholar]
- Kim, J.O.; Slaten, B.L. Objective evaluation of fabric hand-Part I: Relationships of fabric hand by the extraction method and related physical and surface properties. Text. Res. J. 1999, 69, 59–67. [Google Scholar] [CrossRef]
- Bassett, R.J.; Postle, R.; Pan, N. Experimental methods for measuring fabric mechanical properties: A review and analysis. Textile Res. J. 1999, 69, 866–875. [Google Scholar] [CrossRef]
- Alley, V.L., Jr. Revised Theory for the Quantitative Analysis of Fabric Hand. J. Eng. Ind. 1980, 102, 25–31. [Google Scholar] [CrossRef]
- Behery, H.M. Comparison of Fabric Hand Assessment in the United States and Japan. Textile Res. J. 1986, 56, 227–240. [Google Scholar] [CrossRef]


| Parameter | Unit | Minimum | Maximum |
|---|---|---|---|
| Fabric weight | W (μg/cm2) | >100 | <3000 |
| Fabric thickness | T (cm) | 0.01 | 2.0 |
| Fabric linear density | λ (μg/cm) | >100 | <6000 |
| Groups | Super Light (S) | Light (L) | Medium (M) | Heavy (H) |
|---|---|---|---|---|
| λ (μg/cm) | <280 | 280–1200 | 1201–3440 | >3440 |
| Groups | Super Light (S), 2 | Light (L), 27 | Medium (M), 10 | Heavy (H), 1 |
|---|---|---|---|---|
| Fabrics | #26, #38 | #1–#14, #18–#20, #22–#25, #29, #30, #34, #36, #39, #40 | #15–#17, #21, #27, #28, #32, #33, #35, #37 | #31 |
| No. | Construction | Fiber Content |
|---|---|---|
| 1 | Standard Twill | 100% Cotton |
| 2 | Standard Twill | 100% Cotton |
| 3 | Standard Twill | 100% Cotton |
| 4 | Standard Twill | 100% Cotton |
| 5 | Standard Twill | 100% Cotton |
| 6 | Standard Twill | 100% Cotton |
| 7 | Standard Twill | 100% Cotton |
| 8 | Standard Twill | 100% Cotton |
| 9 | Standard Twill | 100% Cotton |
| 10 | Jersey | 92% Cotton/8% Spandex |
| 11 | Jersey | 50% Cotton/50% Model |
| 12 | Jersey | 95% Cotton/5% Spandex |
| 13 | Jersey | 95% Cotton/5% Spandex |
| 14 | Jersey | 57 Cotton/38% PET/5% Spandex |
| 15 | Interlock | 50% Cotton/50% Acetate |
| 16 | Interlock | 50% Cotton/50% Acetate |
| 17 | Interlock | 50% Cotton/50% Acetate |
| 18 | Interlock | 50% Cotton/50% Acetate |
| 19 | Interlock | 100% Cotton |
| 20 | Interlock | 100% Cotton |
| 21 | Flat knit | 100% Cotton |
| 22 | Plated Jersey | 62% Cotton/38% Nylon |
| 23 | Plated Jersey | 37% Cotton/63% Acetate |
| 24 | Plated Jersey | 54% Cotton/46% Acetate |
| 25 | Plated Jersey | 50% Cotton/50% Model |
| 26 | Jersey | 100% Cotton |
| 27 | Crepe | 96% Cotton/4% Spandex |
| 28 | Jacquard Single Knit | 100% Cotton |
| 29 | Needle out Double knit | 100% Cotton |
| 30 | Plated Jersey | 66% Cotton/34% PET |
| 31 | Interlock | 95% Cotton/5% Spandex |
| 32 | Interlock | 47.5% Cotton/47.5% PET/5% Spandex |
| 33 | Single knit inlay | 80% Cotton/18% PET/2% Spandex |
| 34 | Interlock | 100% Cotton |
| 35 | Ponte di Roma | 58% PET/40% Rayon/2% Spandex |
| 36 | Jersey S & Z twist alternating | 100% PET |
| 37 | Ponte di Roma | 100% PET |
| 38 | Satin | 100% PET |
| 39 | Twill | 100% PET |
| 40 | Plain Weave | 100% Rayon |
| No | Fabric Weight g/100 cm2 | Thickness 0.1 mm | Linear Density | DrapeCB % | DrapeUAB % | DrapeUA % | Drapeph % | Energy | RHV |
|---|---|---|---|---|---|---|---|---|---|
| 1 | 2.57 | 0.44 | 1134.53 | 81.10 | 94.52 | 85.89 | 3.39 | 28.32 | 4.55 |
| 2 | 2.62 | 0.46 | 1195.20 | 79.10 | 92.14 | 79.71 | 3.99 | 30.78 | 5.17 |
| 3 | 2.62 | 0.44 | 1147.29 | 75.40 | 87.20 | 67.24 | 3.25 | 24.53 | 4.41 |
| 4 | 2.62 | 0.43 | 1136.64 | 70.60 | 92.03 | 79.47 | 3.75 | 26.39 | 4.91 |
| 5 | 2.60 | 0.43 | 1116.08 | 81.40 | 90.25 | 74.95 | 3.97 | 28.76 | 5.15 |
| 6 | 2.58 | 0.44 | 1125.84 | 75.10 | 90.49 | 75.57 | 4.84 | 28.28 | 6.00 |
| 7 | 2.59 | 0.44 | 1138.10 | 74.10 | 89.73 | 73.51 | 3.43 | 24.78 | 4.58 |
| 8 | 2.58 | 0.43 | 1112.73 | 67.20 | 85.81 | 63.39 | 3.14 | 24.72 | 4.29 |
| 9 | 2.58 | 0.43 | 1111.42 | missing | missing | 84.17 | 2.09 | 32.52 | 3.27 |
| 10 | 1.50 | 0.50 | 750.57 | missing | missing | 34.25 | 1.05 | 19.10 | 0.41 |
| 11 | 1.28 | 0.40 | 511.09 | 47.20 | 69.60 | 21.87 | 0.81 | 19.63 | 0.54 |
| 12 | 1.66 | 0.48 | 801.12 | 44.70 | 69.13 | 20.72 | 0.70 | 20.52 | 0.71 |
| 13 | 1.38 | 0.32 | 444.46 | 45.10 | 68.34 | 18.87 | 1.03 | 13.46 | 0.29 |
| 14 | 1.44 | 0.58 | 840.52 | 47.60 | 70.85 | 25.19 | 0.89 | 16.45 | 0.40 |
| 15 | 2.18 | 0.60 | 1300.13 | 46.40 | 69.58 | 22.30 | 0.99 | 23.26 | 0.49 |
| 16 | 2.16 | 0.57 | 1231.15 | 47.40 | 70.44 | 23.73 | 1.02 | 30.96 | 0.78 |
| 17 | 2.20 | 0.58 | 1285.24 | 45.00 | 71.05 | 25.50 | 1.05 | 24.14 | 0.55 |
| 18 | 2.05 | 0.57 | 1169.49 | 45.60 | 70.08 | 23.01 | 1.04 | 23.32 | 0.51 |
| 19 | 1.47 | 0.53 | 772.15 | 46.90 | 70.77 | 24.74 | 1.14 | 23.97 | 0.60 |
| 20 | 1.49 | 0.55 | 812.18 | 47.60 | 69.47 | 21.55 | 1.17 | 23.34 | 0.58 |
| 21 | 2.58 | 1.11 | 2868.99 | 53.10 | 75.81 | 37.66 | 0.93 | 25.41 | 0.67 |
| 22 | 0.90 | 0.36 | 321.41 | 46.60 | 68.82 | 20.47 | 1.11 | 13.77 | 0.15 |
| 23 | 1.53 | 0.44 | 666.09 | 50.30 | 67.88 | 17.18 | 0.99 | 14.36 | 0.31 |
| 24 | 1.86 | 0.58 | 1077.16 | 52.10 | 69.87 | 22.80 | 0.78 | 22.03 | 0.63 |
| 25 | 1.19 | 0.36 | 425.58 | 47.20 | 67.73 | 17.31 | 1.04 | 14.96 | 0.24 |
| 26 | 0.70 | 0.30 | 213.36 | 47.50 | 68.38 | 19.20 | 1.24 | 12.26 | 0.00 |
| 27 | 2.58 | 0.97 | 2492.84 | 55.90 | 77.51 | 42.41 | 1.09 | 24.60 | 0.58 |
| 28 | 1.75 | 1.18 | 2066.93 | 55.80 | 74.16 | 33.78 | 0.95 | 19.93 | 0.41 |
| 29 | 1.04 | 0.48 | 496.09 | 43.30 | 66.97 | 14.64 | 1.31 | 13.15 | 0.14 |
| 30 | 1.36 | 0.50 | 686.04 | 48.50 | 69.73 | 22.22 | 1.06 | 18.38 | 0.32 |
| 31 | 3.85 | 1.47 | 5656.17 | 65.80 | 89.23 | 72.45 | 3.03 | 65.36 | 3.02 |
| 32 | 3.05 | 1.12 | 3408.68 | 53.90 | 75.61 | 37.52 | 1.95 | 46.63 | 1.84 |
| 33 | 2.34 | 0.81 | 1892.44 | 60.00 | 38.85 | 20.68 | 0.79 | 25.32 | 0.72 |
| 34 | 0.91 | 0.46 | 416.51 | 45.00 | 67.15 | 15.79 | 0.99 | 15.71 | 0.25 |
| 35 | 2.53 | 0.66 | 1673.38 | 45.00 | 67.63 | 16.90 | 0.57 | 21.50 | 1.02 |
| 36 | 1.95 | 0.33 | 648.84 | 43.00 | 65.43 | 11.49 | 1.01 | 16.50 | 0.33 |
| 37 | 2.33 | 0.71 | 1661.83 | 51.00 | 70.36 | 24.49 | 0.78 | 30.72 | 1.75 |
| 38 | 0.83 | 0.15 | 128.18 | 55.00 | 72.52 | 29.52 | 0.97 | 13.43 | 0.40 |
| 39 | 1.89 | 0.44 | 823.78 | 62.00 | 78.01 | 43.90 | 0.61 | 23.00 | 0.93 |
| 40 | 1.32 | 0.28 | 374.17 | 49.00 | 68.69 | 19.41 | 0.84 | 14.26 | 0.51 |
| B | C | E | J | λ | |
|---|---|---|---|---|---|
| B | 1 | 0.448 | 0.889 | 0.959 | 0.197 |
| C | 1 | 0.548 | 0.478 | 0.865 | |
| E | 1 | 0.925 | 0.316 | ||
| J | 1 | 0.206 | |||
| λ | 1 |
© 2019 by the authors. Licensee MDPI, Basel, Switzerland. This article is an open access article distributed under the terms and conditions of the Creative Commons Attribution (CC BY) license (http://creativecommons.org/licenses/by/4.0/).
Share and Cite
Pan, N.; Lin, C.; Xu, J. A New Method for Measuring Fabric Drape with a Novel Parameter for Classifying Fabrics. Fibers 2019, 7, 70. https://doi.org/10.3390/fib7080070
Pan N, Lin C, Xu J. A New Method for Measuring Fabric Drape with a Novel Parameter for Classifying Fabrics. Fibers. 2019; 7(8):70. https://doi.org/10.3390/fib7080070
Chicago/Turabian StylePan, Ning, Chengwei Lin, and Jun Xu. 2019. "A New Method for Measuring Fabric Drape with a Novel Parameter for Classifying Fabrics" Fibers 7, no. 8: 70. https://doi.org/10.3390/fib7080070
APA StylePan, N., Lin, C., & Xu, J. (2019). A New Method for Measuring Fabric Drape with a Novel Parameter for Classifying Fabrics. Fibers, 7(8), 70. https://doi.org/10.3390/fib7080070