Article

Characterisation of the Anisotropic Thermoelastic Properties of Natural Fibres for Composite Reinforcement

Department of Mechanical and Aerospace Engineering, University of Strathclyde, 75 Montrose Street, Glasgow G1 1XJ, UK
*
Author to whom correspondence should be addressed.
Fibers 2017, 5(4), 36; https://doi.org/10.3390/fib5040036
Submission received: 24 July 2017 / Revised: 29 August 2017 / Accepted: 11 September 2017 / Published: 25 September 2017
(This article belongs to the Special Issue Natural Fibers)

Abstract

:
There has been a substantial increase in the investigation of the potential of natural fibres as a replacement reinforcement in the traditional fibre reinforced polymer composite application. However, many researchers often overlook the anisotropic properties of these fibres, and the estimation of the potential reinforcement performance. A full understanding of the thermoelastic anisotropy of natural fibres is important for realistically predicting their potential performance in composite applications. In this study, the thermoelastic properties of flax and sisal fibres were determined through a combination of experimental measurements and micromechanical modelling. The results confirm the high degree of anisotropy in properties of the flax and sisal fibres. The implications of these results on using natural fibres as an engineering composite reinforcement are discussed.

1. Introduction

The use of fibre reinforced polymer materials has increased dramatically during the last half century, becoming the standard for high performance in automotive, aeronautical and many other applications. Glass fibres (GF) currently represent more than 95% of the reinforcement fibres used globally in the engineering composites industry [1]. However, the increasing pressure on natural resources and the large amounts of energy required in glass fibre production has led to an upsurge in the research of fibres derived from natural sustainable plant sources as potential reinforcements for high performance composite materials [2,3,4,5,6,7,8,9,10,11]. Many academic researchers argue that plant-based natural fibres (NF) can successfully compete with glass fibres in today’s market because of their attractive properties, which may include low cost, low density, good specific strength properties, renewable, carbon dioxide neutrality emissions, and sustainability [3,4,5,6,7,8]. Nevertheless, a certain level of reinforcement performance is still required from such fibres in order to succeed in engineering composite applications. In this context, many researchers refer to the respectable level of axial modulus exhibited by some natural fibres, which can be made to appear more attractive by comparing modulus/density ratios [2,3,4,5,6,7,8,9,10,11]. An interesting point about such claims is that both low density and specific performance are claimed to be advantages for NF. It should, of course, be noted that any use of specific performance comparisons precludes claiming low weight or density as an advantage for NF over GF, as this is already included in the specific performance calculation.
The suggestion that NF may well be suitable as a good reinforcement fibre for composite materials is also dependent on the use of standard micromechanical models and test methods. These have been developed by the composites community, based on the use of well-defined, uniformly cylindrical, often isotropic, man-made fibres with very low levels of variability. The assumption that these models and methods can be applied to complex, anisotropic, non-cylindrical NF, which have a high level of batch-to-batch, inter-fibre and intra-fibre variability [2,6,12,13,14,15,16,17], is open to question. In order to effectively predict realistic values for the properties of natural fibre reinforced composites, it is essential to fully appreciate the relevant properties of the constituent materials. In the case of natural fibres, the simple relationships that characterise isotropic materials are not sufficient due to the significant structural anisotropy of natural fibres. Therefore, further investigation is needed to effectively measure their orthotropic thermomechanical behaviour. Unfortunately, the majority of research to date has focused on reasonably attractive longitudinal fibre properties and has tended to ignore the challenges resulting from the high degree of anisotropy of natural fibres [12,13,14,15]. Although the longitudinal modulus of the natural fibres can be directly measured, characterising the transverse and shear properties of the fibre is more challenging due to the complex shapes and structure of such fibres. Nevertheless, it has been shown that such fibre properties can be estimated by using a range of micromechanical and semi-empirical models to analyse and model the natural fibre composite properties [12].
In one of the first papers which fully explored the thermomechanical anisotropy of a natural fibre, Cichocki and Thomason [12] presented a methodology to characterise the five thermoelastic constants of jute fibres using experimental results from off-axis loading of unidirectional composites. The fibre properties were calculated from the composite modulus and thermal expansion coefficient data, using a range of micromechanical models which were examined for their suitability. It was reported that the well-known Voigt and Reuss models appeared to be as appropriate as many of the more complex micromechanical models in producing values for the longitudinal and transverse moduli of the jute fibres. It was noted that Young’s longitudinal modulus of the jute fibre exceeded the fibre transverse modulus by a factor of five, and the fibre shear modulus by a factor of ten. Thomason expanded on these results to show that the anisotropy of these jute fibres, and specifically their low transverse and shear modulus, could fully explain the apparent low performance levels observed in the injection moulded jute–polypropylene composites [13,15]. Using similar methods, Ntenga et al. [18] reported high levels of mechanical anisotropy in sisal fibres and reported values of 11.5 GPa, 1.4 GPa, and 0.1 GPa, respectively for the sisal fibre longitudinal, transverse and shear moduli. Baley et al. [19] reported that the transverse modulus of flax fibres was 8 GPa, compared to a longitudinal modulus of 59 GPa. However, Shah et al. reported that flax fibres in a twisted yarn had a transverse modulus of 3.9 GPa, a longitudinal modulus of 46 GPa and a shear modulus of 2 GPa [20]. The results emphasize the need for composite researchers to fully appreciate and acknowledge the mechanical anisotropy of natural fibres caused by their highly complex structure.
Sisal and flax are good examples of the many types of natural fibre which have been identified as appearing to have some appropriate, mechanical properties for structural reinforcement purposes. In this study, the thermoelastic properties of flax and sisal fibres have been determined using a combination of experimental measurements and micromechanical modelling, following the basic methodology presented by Cichocki and Thomason [12]. Dynamic mechanical analysis (DMA) and thermomechanical analysis (TMA) techniques were employed to characterise the unidirectional natural fibre–epoxy composites over a range of loading angles. The results were put into a number of micromechanical models to determine the values for the fibres transverse, longitudinal, shear moduli and thermal expansion coefficients over a range of temperatures.

2. Materials and Methods

2.1. Materials

The natural fibres used for the investigation were untreated, twist-free flax and sisal. The flax fibres were sourced from Wigglesworth fibres, and were grown in Germany. The sisal fibres were sourced from the same company, but were grown in Brazil. The longitudinal Young’s moduli for these particular fibres, obtained by single fibre tensile testing at multiple gauge lengths, were previously 70.8 GPa for flax and 30.4 GPa for sisal [16]. For the composite production, the epoxy matrix used Araldite 506 combined with a room temperature curing agent (triethylenetetramine), both sourced from Sigma Aldrich (Irvine, United Kingdom).

2.2. Composite Production

Unidirectional natural fibre composites were manufactured by a vacuum infusion process, as described by Symington [21]. Unidirectional fibre mats were layered, by hand, into a 15 cm × 15 cm mould. A vacuum pump via a pressure pot was used to achieve a smooth and adjustable filling of resin in a mould. The ideal infusion rate of approximately 5 mm per second can be controlled by adjusting the inlet and outlet valves. This relatively slow infusion rate ensures the minimisation of trapped voids. The high compaction of the fibres, without significant damage to the microtubules of each fibre, was achieved through the sandwiching of aluminium and acrylic outer plates using a number of bolt fixings and G-clamps [12]. The infused composite was left in the mould to cure at room temperature for 12 h, and then post cured at 120 °C for 12 h. A Struers Accutom high speed precision cutting wheel with an aluminium oxide blade, was used to accurately machine samples for thermomechanical testing. Samples for DMA and TMA were cut to approximately 55 mm × 14 mm × 2 mm and 4 mm × 4 mm × 1 mm, respectively. The composite and resin samples were dried to achieve a constant weight in an oven at 120 °C and then stored in a desiccator until they were required for testing, to avoid the reabsorption of moisture.

2.3. Thermal and Mechanical Testing

Thermal analysis was used on the natural fibre composites to investigate their glass transition temperature (Tg), the temperature dependence of their modulus and the coefficient of thermal expansion. A TA Instruments Q800 dynamic mechanical analyser (TA Instruments, New Castle, DE, USA) was used to determine the storage modulus, loss modulus and the Tan Delta of the composites over a range of temperatures. Samples were tested in the deformation mode using a three-point bending clamp (TA Instruments, New Castle, DE, USA) with a preload of 0.1 N and a frequency of 1 Hz. Samples were heated from −50 °C to 150 °C at a rate of 3 °C/min. A TA Instruments Q400E thermomechanical analysis machine (TA Instruments, New Castle, DE, USA) was used to determine the matrix glass transition temperature and the thermal expansion, coefficient of the natural fibre composites. A macro expansion probe was used to allow a large contact area of the sample to be tested. The composites were tested over a range of different fibre orientations (0°, 25°, 45°, 65°, 90°).

2.4. Composite Fibre Volume Fraction

All the composite samples that were tested using DMA and TMA were subsequently examined to determine their fibre volume fraction. Small samples of these composites were cut perpendicular to the fibre orientation using a Struers Discotom abrasive cutter (Struers, Ballerup, Danmark). The cut sections were then embedded in Epofix resin, and after a 24 h room temperature cure, the samples were ground using progressively finer grinding papers (120 grade, 1200 grade, 2400 grade and 4000 grade) and polished using 3 micron diamond paste. The samples were then photographed using an Olympus G51 microscope (Olympus, Essex, United Kingdom) at × 50 magnification. The pictures were then imported into Image Pro Plus image analysis software (Media Cybernetics, Rockville, MD, USA) and formatted to binary. The binary image allowed the software to count the number of pixels in the picture to calculate the fractional cross-sectional area taken up by the fibre. Once the volume fraction had been determined for each picture, an average fibre volume fraction for each composite was calculated.

3. Results

3.1. Composite Fibre Volume Fraction

Typical optical micrographs of polished cross sections of the flax and sisal composites are shown in Figure 1. Using the methods described above, the average fibre volume fraction for the flax and sisal composites were found to be 0.31 and 0.4, respectively.
It can be observed that, unlike conventional composite fibers, the cross-sectional shapes of natural fibers vary widely. Thomason has discussed the influence of the noncircularity of the natural fibres in terms of the challenges of obtaining accurate values from single fibre micromechanical tests; such as, single fibre tensile testing and single fibre adhesion tests for determining interfacial shear strength [16,17]. The images in Figure 1 also highlight the complex internal structure of these natural fibres. The ‘technical’ fibres are actually composite structures consisting of an assembly of many elementary fibres, which have a polygonal cross-section, allowing them to fit closely together. Due to the low cost requirements of many of the applications, where natural fibres are being considered as reinforcement, these fibre bundles are the most prevalent morphology observed. In the case of flax, the technical fibres are located around the stem of the plant and tend to contain between 10 and 40 elementary fibres. Sisal technical fibres originate from within the large leaves of the plant, and contain between 50 and 200 elementary fibres, which tend to be slightly smaller than the flax elementary fibres. Each elementary fibre contains multiple concentric cell walls, with a void in the middle, known as the lumen. It is clear from the micrographs, that the structure of these fibres reveals many potential weak interfaces. Indeed, Figure 1 reveals that the flax fibre has been damaged during the sample preparation and has failed at a number of internal interfaces. The images in Figure 1 highlight the need for the determination of the transverse properties of such fibres, as it is clearly unreasonable to expect that the complex structures can be anything other than highly anisotropic.

3.2. Composite and Fibre Modulus

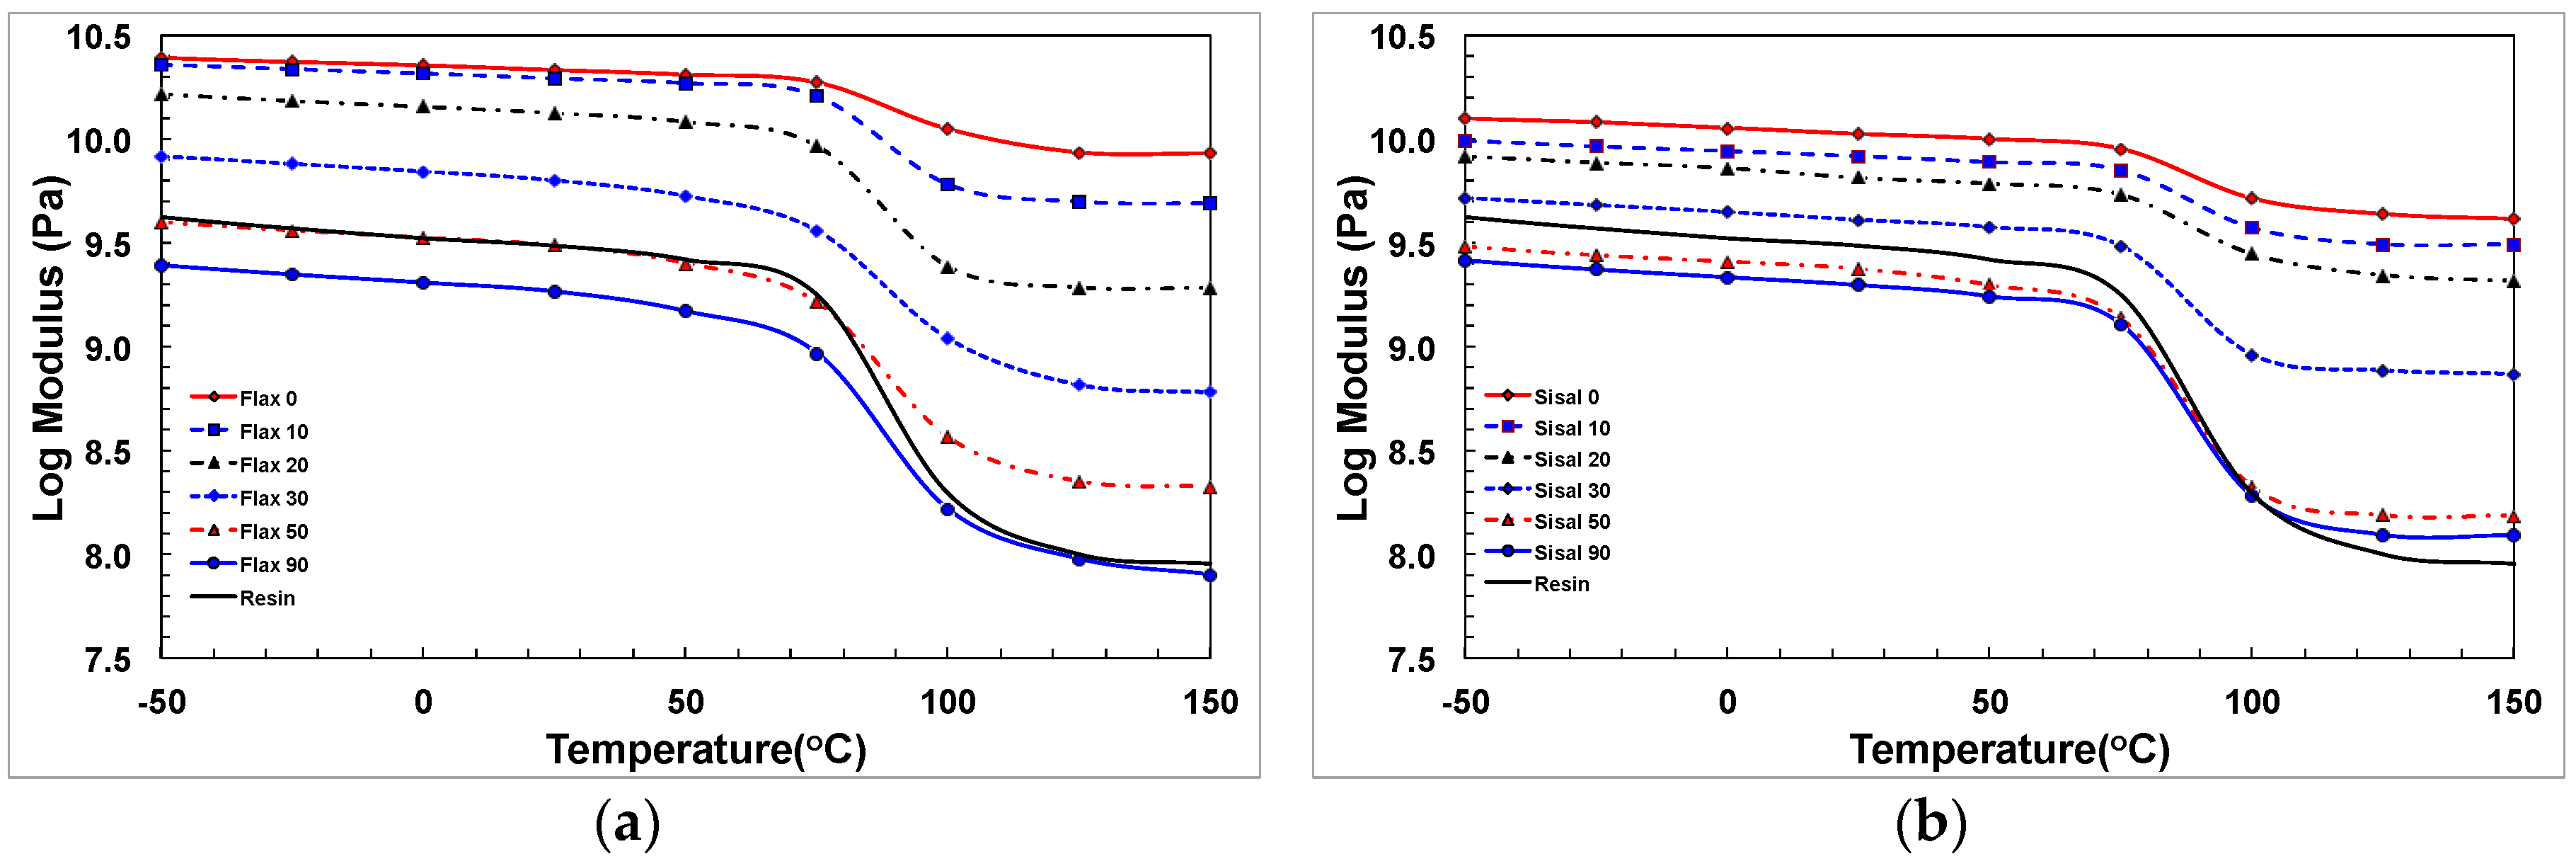
A selection of the DMA storage modulus results for fibre and epoxy are plotted as a function of temperature in Figure 2. A large reduction in stiffness, due to the epoxy matrix glass transition temperature (Tg), is clearly visible between 70 °C–90 °C. It can be seen over the whole temperature range, that the composites of Young’s modulus decrease as the off-axis loading angle increases. It is also interesting to note that the transverse stiffness of some of the composites loaded at higher off-axis angles is lower than the epoxy resin at temperatures below the matrix Tg. This is an indication of the likely probability of low transverse stiffness of the flax and sisal fibre. The longitudinal fibre modulus Ef1 can be obtained at any temperature from the composite longitudinal moduli (EC0) and the epoxy matrix modulus (Em) using the well-known Voigt model (also known as the linear rule of mixtures) using the equation below:
E f 1 = E c 0 E m V m V f
Vf and Vm are the volume fractions of the fibre and the matrix, respectively. It should be noted that the properties of the composites and epoxy matrix change by orders of magnitude in the region of Tg. These large changes can give unexpected results from the micromechanical equations used in this work; and so, we have restricted the temperatures for the micromechanical analysis to the range of −50 °C to +50 °C. The results for the longitudinal fibre moduli of flax and sisal fibres obtained from Equation (1) are compared with the epoxy matrix modulus in Figure 3a. It can be seen that the axial stiffness of both of these fibres is considerably greater than the stiffness of the epoxy matrix; and hence, as observed in the introduction, it can be expected that these fibres will give a considerable reinforcement effect in the composite longitudinal direction. It is further noted that the values obtained for the room temperature fibre moduli of flax and sisal are in good agreement with the values previously reported from single fibre tensile testing.
The transverse fibre modulus Ef2 can be obtained at any temperature from the composite longitudinal moduli (Ec90) and the epoxy matrix modulus (Em) using the well-known Reuss model (also known as the inverse rule of mixtures) using the equation below:
1 E f 2 = 1 V f ( 1 E c 90 V m E m )
Results for the transverse fibre moduli of flax and sisal fibres that were obtained from Equation (2) are compared with the epoxy matrix modulus over the temperature range −50 °C to +50 °C in Figure 3b. It can immediately be observed that the values of Ef2 for both fibres are significantly lower than the modulus of the epoxy matrix across the whole temperature range. The transverse modulus of the sisal fibres is only approximately 50% of that of the matrix. The flax fibre transverse modulus is even lower with values of only 30% of that of the epoxy matrix. Figure 3b clearly illustrates a major weakness in the application of these natural fibres as a composite reinforcement, in that they provide no reinforcement of the polymer matrix in the transverse direction. On the contrary, these fibres have an anti-reinforcement effect in the transverse direction and result in a composite with a lower transverse modulus than the matrix polymer alone.
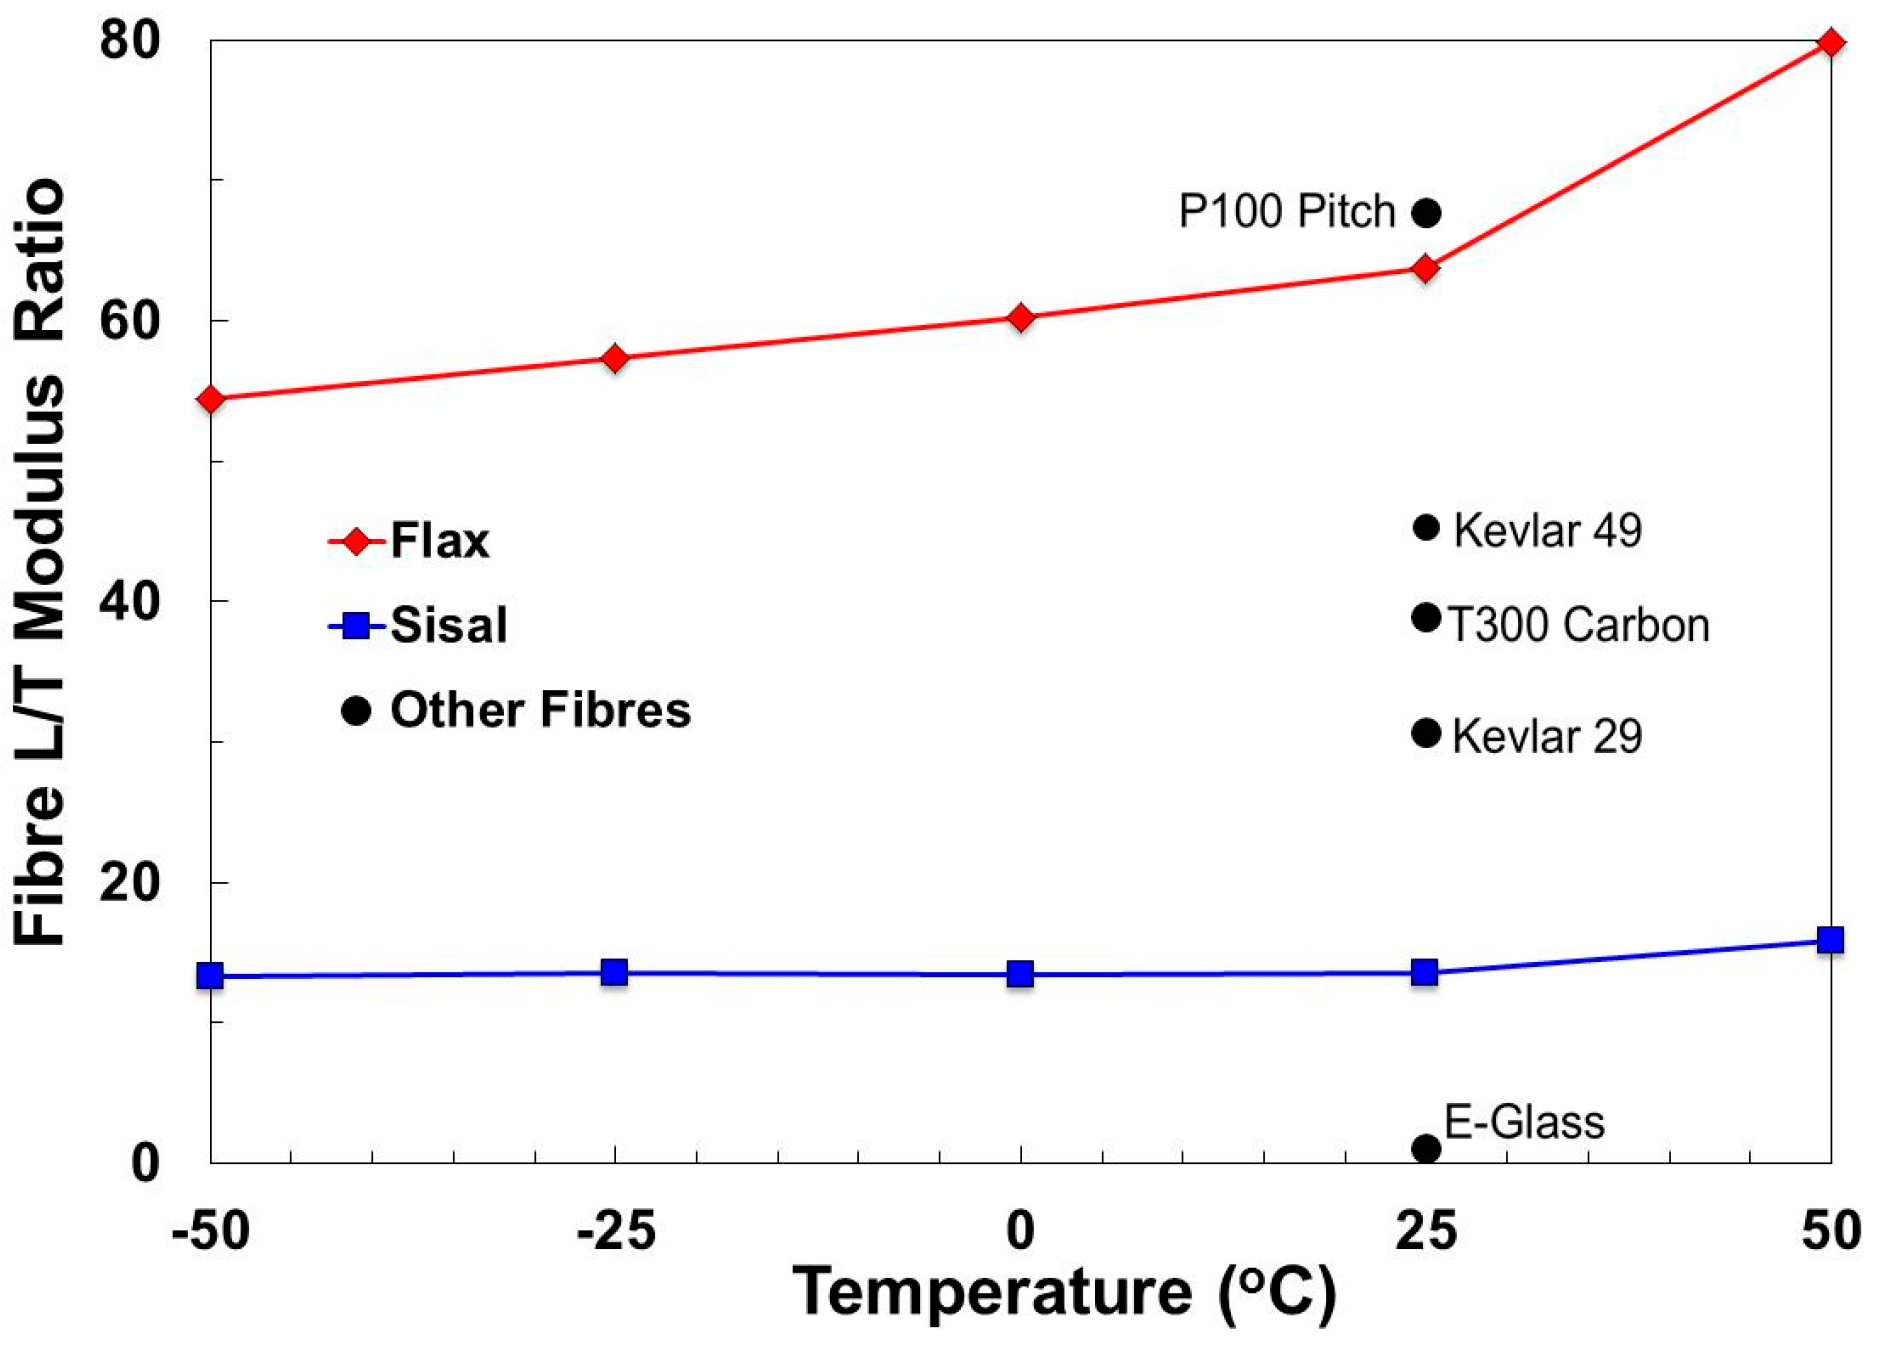
The mechanical anisotropy of these natural fibres is further visualised in Figure 4, which presents the ratio of Ef1/Ef2 for the flax and sisal fibres, and compares them with some other reinforcement fibres [22]. It can be seen that both sisal and flax are highly anisotropic in their mechanical performance. The flax fibres have a modulus ratio from 55–80 across the temperature range studied, and can be seen to have a level of anisotropy comparable with pitch carbon fibre. The sisal fibres have a considerably lower level of anisotropy, with a modulus ratio of approximately 17. This is lower than most carbon and aramid fibres, but still highly anisotropic in comparison with glass fibres.
The values obtained for the off-axis of Young’s moduli (E) from Figure 1 and Figure 2 can also be used to obtain values for the composite shear modulus GC12 , which can then be used to obtain a value for the fibre shear modulus Gf12. The mechanics concerning the coordinate system transformations can be applied, leading to the well-known relationship between off-axis modulus and the principal properties of a unidirectional composite ply [12]:
1 E C θ = cos 4 θ E C 1 + sin 4 θ E C 2 + [ 1 G C 12 2 ν C 12 E C 1 ] cos 2 θ sin 2 θ
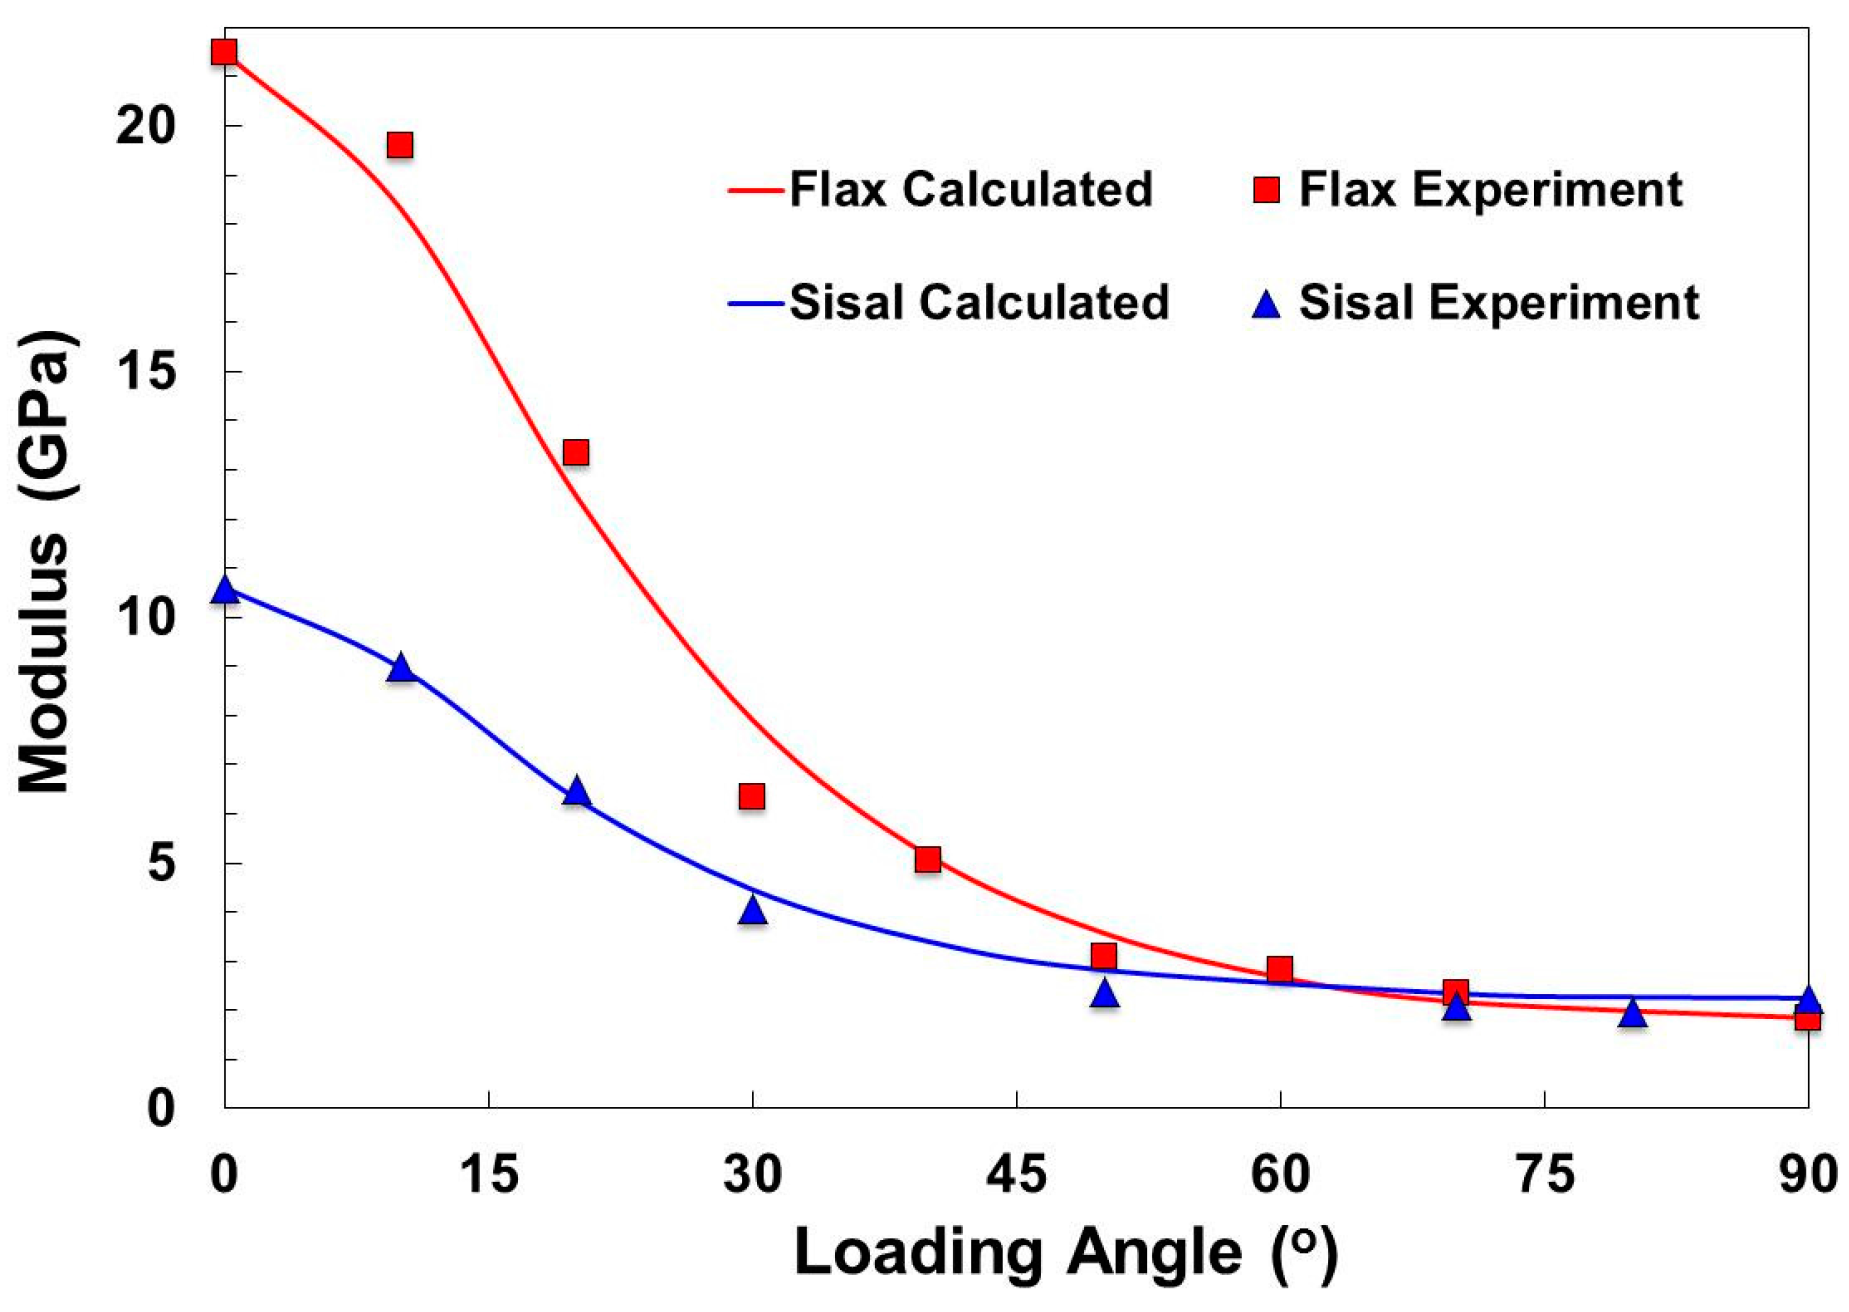
Hence, by measuring the composite modulus as a function of the loading angle, it is possible to obtain a value for GC12 by using the curve fitting Equation (3) with the experimental results taken from Figure 2 at various temperatures. An example is shown in Figure 5 for the flax and sisal composite moduli obtained at 25 °C.
The fibre shear modulus Gf12 can then be obtained at any temperature from the composite moduli (GC12) and the epoxy matrix shear modulus (Gm), also using the well-known Reuss model:
1 G f 12 = 1 V f ( 1 G C 12 V m G m )
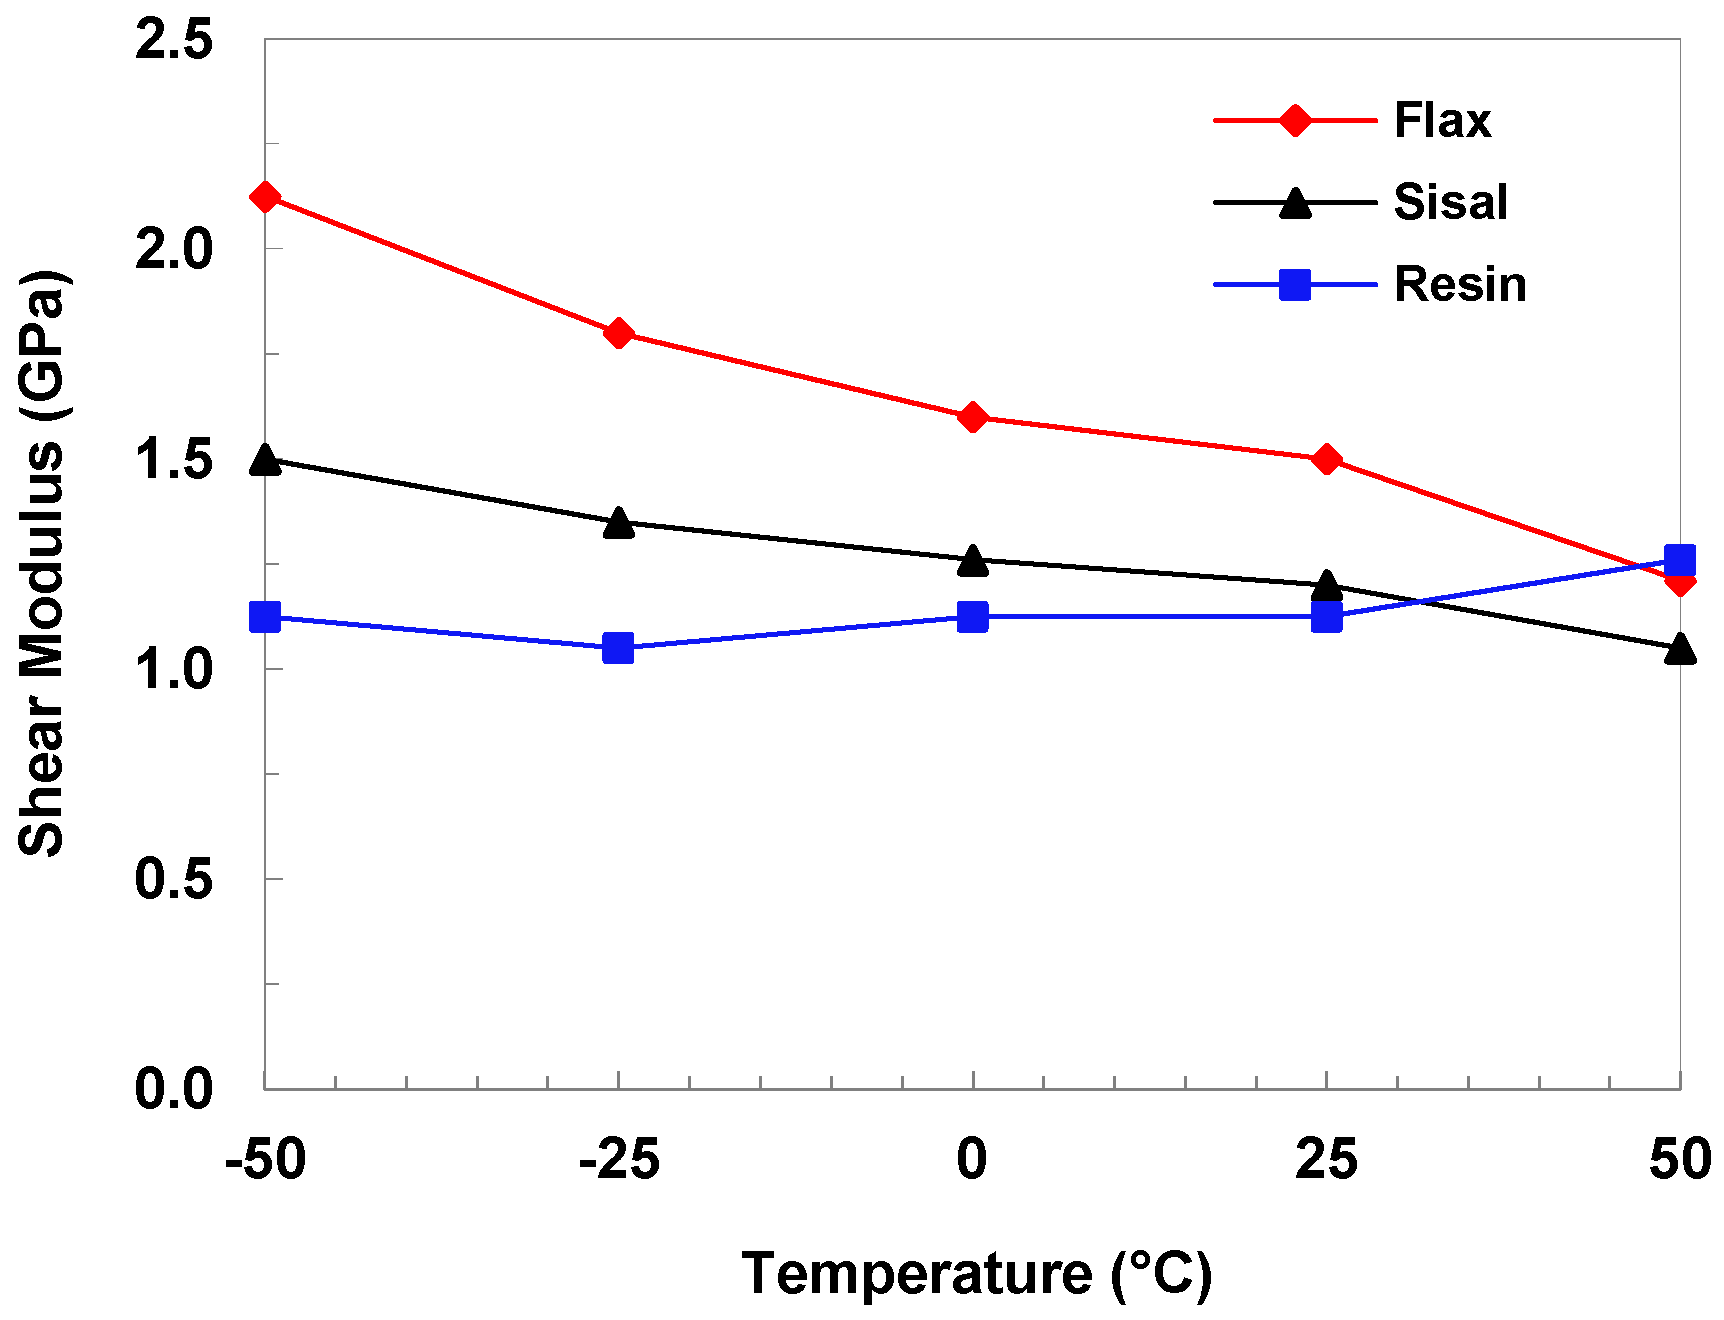
Results for the shear moduli of flax and sisal fibres obtained from Equation (2) are compared with the epoxy matrix shear modulus in Figure 6. It can be seen that the shear modulus of the sisal fibres differs a little from the shear modulus of the epoxy polymer and is actually lower, at lower temperatures. The shear modulus of the flax fibres (1.0 GPa–2.1 GPa) is significantly higher than both the sisal fibres and the epoxy matrix. However, as a reference, it can be noted that the shear modulus of E-glass fibres is more than an order of magnitude greater, at around 30 GPa.

3.3. Composite and Fibre Thermal Expansion

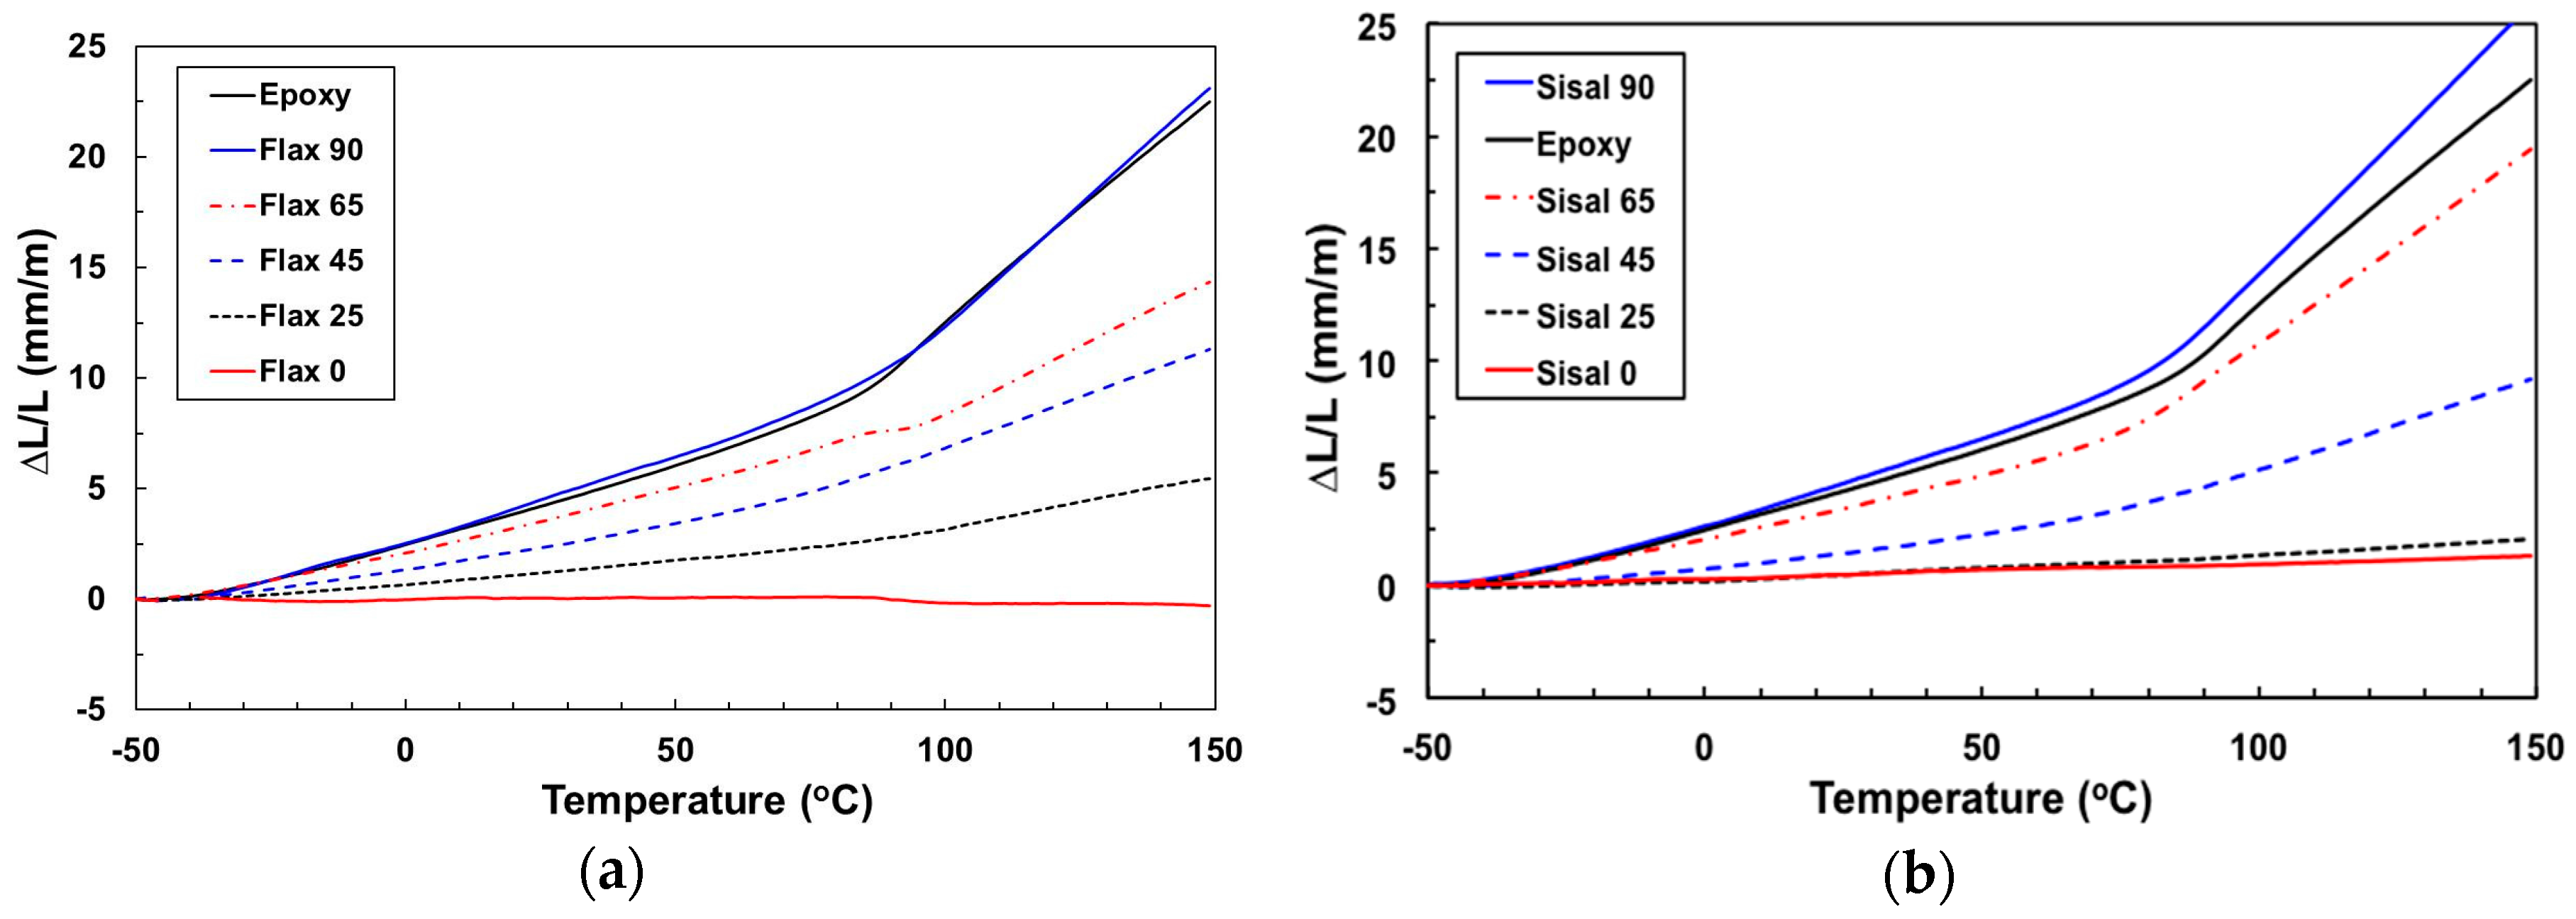
Figure 7 illustrates the TMA measured thermal strain of the epoxy matrix and the natural fibre composites with different fibre orientation. The data exhibits some typical elements of TMA analysis of polymer materials. When below the glass transition temperature (Tg), the thermal strain is low but as the temperature increases towards Tg, the thermal strain increases, and above Tg, the thermal strain is significantly high. The temperature region of this change of slope is indicative of the polymer (matrix) Tg which, in both cases, can be seen to be in the range of 70 °C to 90 °C (similar to the values obtained by DMA). It can further be noted from these figures, that when loading at 90°, the thermal strain of the composite is approximately the same as the resin thermal strain. At fibre orientation angles, the composite thermal strain is very low and a change in slope at Tg becomes quite indistinct. Interestingly, when the flax composites are at 0° fibre orientation, the thermal strain turns negative, above the matrix Tg temperature. From the results, it can be concluded that the composite thermal strain decreases as the fibre orientation decreases from 90° to 0°.
In a similar manner to the analysis of the composite and fibre modulus, the coefficient of thermal expansion of the composites determined by TMA can be used to establish the coefficient of thermal expansion of the fibre using micromechanical models. The longitudinal coefficient of thermal expansion of the fibre (αf1) can be obtained using a rearrangement of the well-established Schapery [23] equation:
α f 1 = [ α C 1 ( E f 1 V f + E m V m ) α m E m V m ] E f 1 V f
where αC1 and αm are the longitudinal coefficient of thermal expansion (CTE) of the composite and the linear CTE of matrix [17]. There is not, as yet, a universally applicable micromechanical model or equation for predicting the transverse CTE of composites; and so, we have compared the results from the published methods of both Chamberlain [24] and Chamis [25]. The rearrangement of the equation from Chamis gives the following expression for the transverse CTE (αf2) of the fibres:
α f 2 = α C 2 ( 1 V f ) ( 1 + ν f V m E f 1 E 1 ) α m V f
Whereas, the equation from Chamberlain results in the following expression:
α f 2 = α m + ( α C 2 α m ) [ ν m ( F 1 + V m ) + ( F + V f ) + E m E f 1 ( 1 ν f 12 ) ( F + 1 V m ) ] 2 V f
where αC2 is the transverse CTE of the composite and F is the fibre packing factor with a value of 0.785 for the square packing [24].
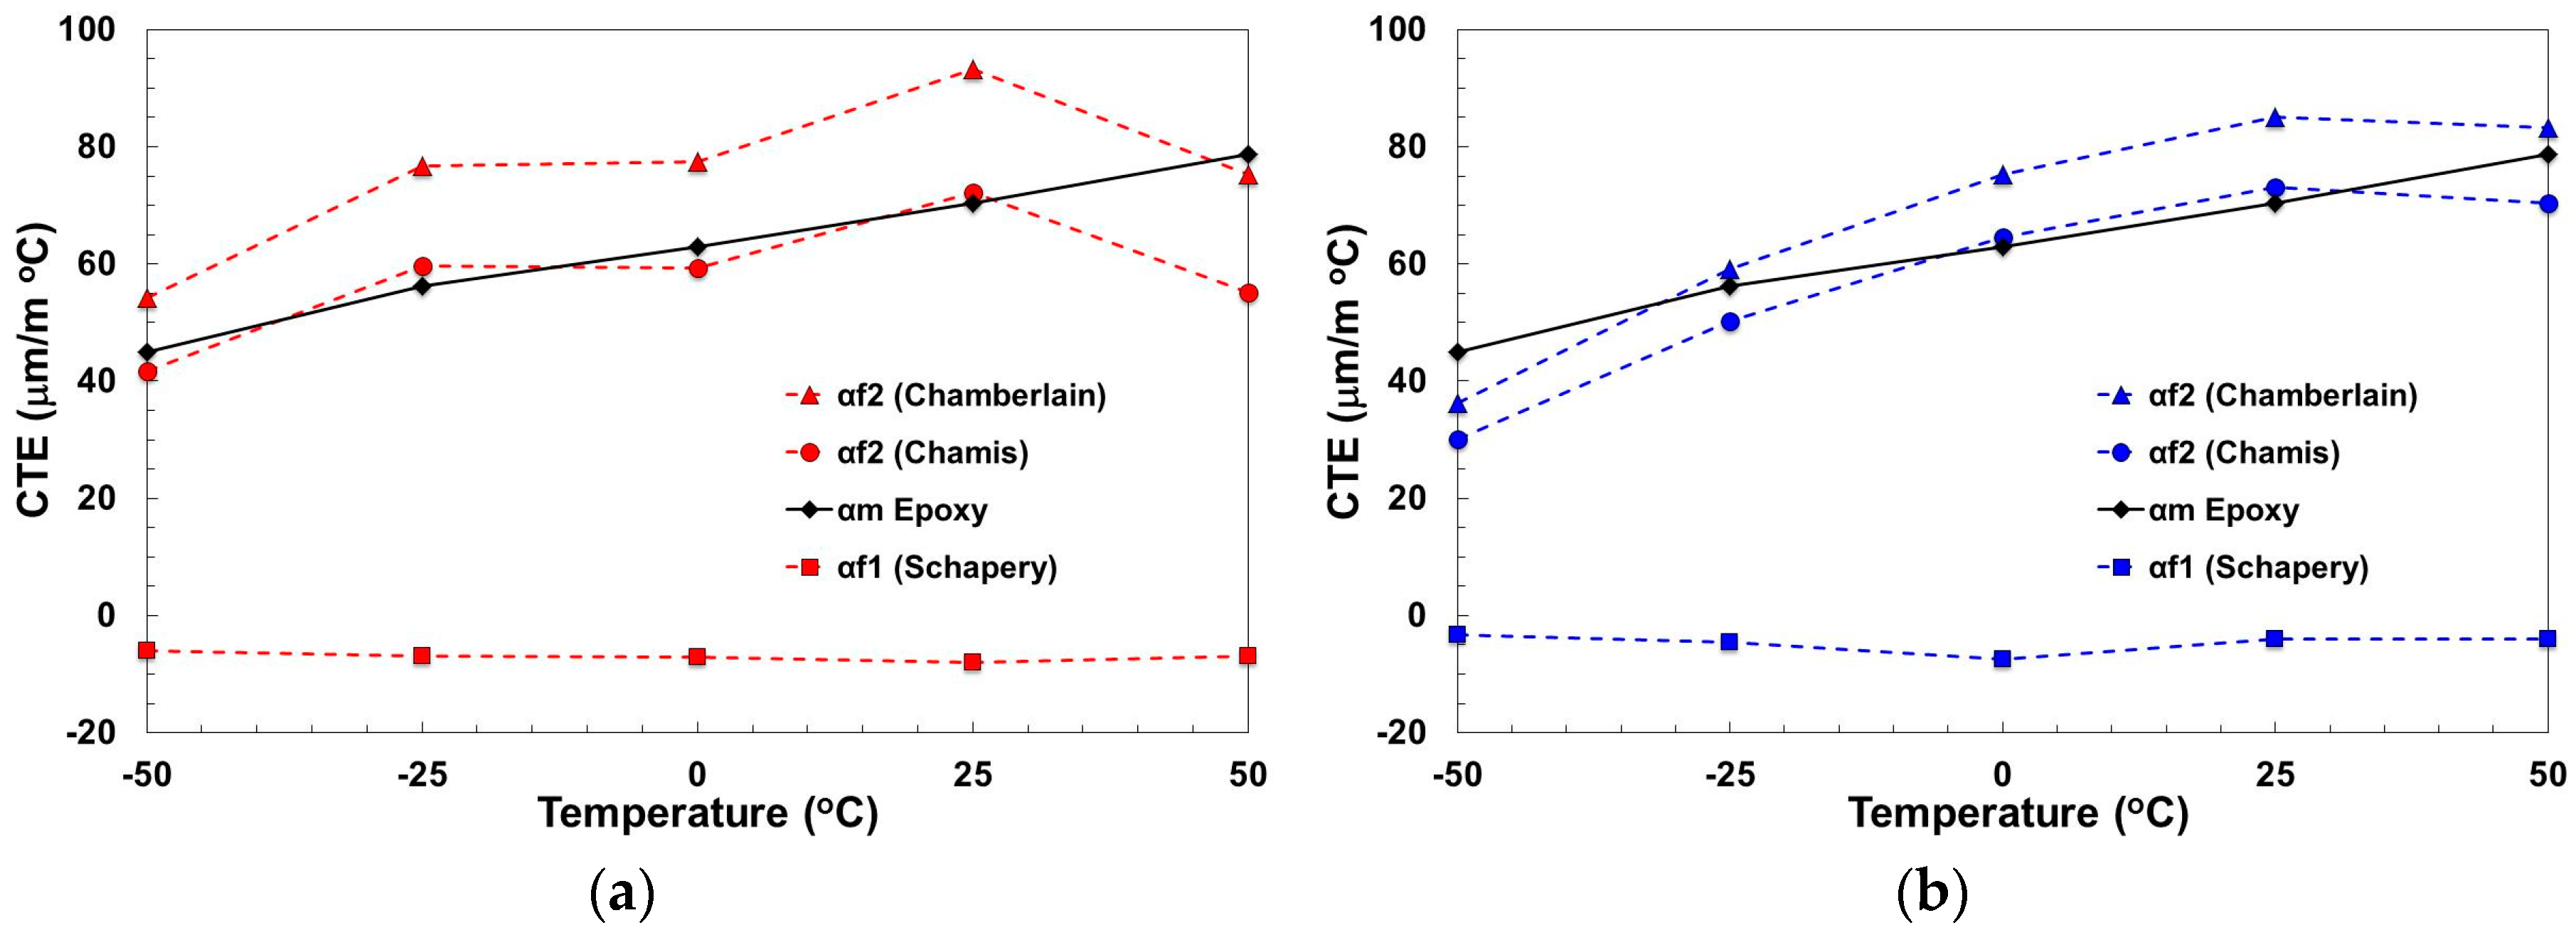
The longitudinal and transverse CTEs of the flax and sisal fibres obtained from this analysis are compared with the epoxy matrix CTE in Figure 8 respectively. It can be seen that the longitudinal CTEs for both natural fibres are not only an order of magnitude smaller than their transverse CTEs, but also negative in both cases. In other words, flax and sisal fibres shrink along their length when heated up. This is in agreement with the results of Cichocki and Thomason who found that jute fibre also has a negative longitudinal CTE [12].
The two equations for the fibre transverse CTE give similar values in the case of both flax and sisal, although the Chamberlain equation results in systematically higher values for αf2 in comparison to the Chamis equation. The sisal fibres appear to have a slightly smaller transverse CTE compared to flax fibres over the −50 °C to +50 °C temperature range. In both cases, the fibre transverse CTE is of the same order of magnitude as the epoxy matrix CTE, which is probably a reflection of the thermal response of the amorphous polymeric components of these fibres. An overall summary of the temperature dependence of the various thermomechanical parameters obtained for sisal and flax fibres in this study is shown in Table 1. It should be noted that the values of αf2 in Table 1 are an average of the values obtained using Equations (6) and (7).

3.4. Implications for Natural Fibre Performance as a Composite Reinforcement

The results presented in Table 1 illustrate the high levels of thermomechanical anisotropy present in the natural fibres. Although this anisotropy does not, in itself, present insurmountable challenges to the further application of such fibres as reinforcements for engineering composites, the implications do bear some further discussion. Table 2 compares values of the thermomechanical properties [22] of some other well-known reinforcement fibres at 25 °C, with those obtained in this work for flax and sisal.
It can be observed from the values present in Table 2 that other reinforcements, such as carbon fibre and aramid fibre, used in engineering composite applications also have high levels of thermomechanical anisotropy. However, the challenge for those who wish to use natural fibres is not so much the anisotropy itself; rather it is the very low values of fibre transverse and shear modulus. These values for natural fibre are much lower than most polymer matrices; consequently, natural fibres perform poorly as reinforcement for the composite material in any off-axis loading scenario. In fact, natural fibres are not seriously considered by many as a replacement for carbon or aramid fibres, but they are regularly promoted as a possible replacement for glass fibres. In this case, the applications which are being considered are most often low performance, low cost, moulded composites; where a large proportion of the reinforcement fibres experience off-axis loading. In this situation, the isotropic nature of glass fibres still results in a significant level of reinforcement; whereas, the natural fibres will perform poorly.
There are many articles to be found in the literature which strongly identify the fibre–matrix interface as a challenge for the further development of natural fibre composites. Many authors have seen this as an issue of chemical compatibility and adhesion. However, it has recently been shown that the residual compressive radial stresses at the fibre–matrix interface caused by the fibre–matrix mismatch in CTE can account for a large proportion of the interfacial stress transfer capability in many composites [15,26,27,28,29,30]. Thomason has published an analysis for jute–PP composites which indicates that this hypothesis can be used to explain the very low levels of apparent interfacial shear strength in these composites [13,15]. Clearly, the data presented above where the value of αf2 for flax and sisal is very close to that of the polymer matrix, implies a similar lack of any interfacial radial compressive stress to the interfacial stress transfer capability in composites using these fibres. In fact, if, as appears to be the case at some points in Figure 8, αf2 is greater than the CTE of the polymer matrix, this could result in an interface under radial tension, which could be very weak.
In further discussion of the interface in fibre reinforced composites, it is worth observing that the accepted stress transfer mechanism is shear along the interface. This has mainly been considered in terms of its effects on the interface and surrounding matrix, but there has been little attention paid to the effects of this interfacial shear stress on the reinforcing fibres. However, considering the very low values obtained for the natural fibre shear modulus in comparison to glass fibres, one must assume that the levels of shear strain on the fibre side of the interface must be at least an order of magnitude higher for natural fibres than for glass fibres. It is interesting to ask what effects such high levels of shear deformation might have on the internal structure of these natural fibres, how that might manifest itself in the apparent interfacial stress transfer capability, and the overall performance of the natural fibre composite. Charlet et al. [31] have published the results of a unique study of the properties on the internal interphase region between elementary fibres within technical flax fibres. They gave a value for the average shear strength of these interphases of 2.9 MPa and a value for the shear modulus of 0.02 MPa. It seems clear that there is a much higher probability of failure of these internal interphase regions due to high shear strains, rather than the failure of the fibre–matrix interface. Such a result would go a long way to explaining why the chemical modification of the interface has such little effect on improving the composite performance with natural fibres in comparison to glass fibres. It also suggests that the way to move forward to improve natural fibre composite performance should be more focused on the internal structure of the technical fibres.

4. Conclusions

The thermoelastic behaviour of untreated flax and sisal epoxy composites has been investigated and quantified in this study, and both fibres were shown to exhibit high levels of thermoelastic anisotropy. The longitudinal and transverse properties of the fibres were found to be significantly different, highlighting the highly anisotropic structure of the natural fibres. The longitudinal and transverse modulus of flax at room temperature (25 °C) was found to be 65.7 GPa and 1.1 GPa, respectively. The room temperature longitudinal and transverse modulus of sisal was found to be 23.3 GPa and 1.7 GPa, respectively. The shear modulus of both fibres was also low, with sisal 1.1 GPa and flax 1.5 GPa. The coefficient of the thermal expansion of the fibres exhibits low negative values in the longitudinal direction and high values (typical of polymers) in the transverse direction. The level of anisotropy in these fibres did not change significantly within the temperature range of −50 °C to +50 °C. These results confirm that overlooking the anisotropy of natural fibres will lead to a significant overestimation of their reinforcement potential in off-axis loading situations. Furthermore, it is suggested that the root cause of the apparent poor interfacial stress transfer performance of natural fibres may well lie in their thermoelastic anisotropy, and not primarily in the chemical interactions at the natural fibre–polymer interface.

Acknowledgments

The authors would like to express their gratitude to the Saudi Basic Industries Corporation for the financial support. The costs to publish in open access is self-covered.

Author Contributions

James Thomason and Liu Yang conceived and designed the experiments; Fiona Gentles performed the experiments; James Thomason and Liu Yang analyzed the data; James Thomason and Liu Yang wrote the paper.

Conflicts of Interest

The authors declare no conflict of interest.

References

  1. Thomason, J.L.; Jenkins, P.; Yang, L. Glass fibre strength—A review with relation to composite recycling. Fibers 2016, 4, 18. [Google Scholar] [CrossRef] [Green Version]
  2. Fortea-Verdejo, M.; Bumbaris, E.; Burgstaller, C.; Bismarck, A.; Lee, K.-Y. Plant fibre-reinforced polymers: Where do we stand in terms of tensile properties? Int. Mater. Rev. 2017, 62, 441–464. [Google Scholar] [CrossRef]
  3. Pickering, K.L.; Efendy, M.G.A.; Le, T.M. A review of recent developments in natural fibre composites and their mechanical performance. Compos. Part A 2016, 83, 98–112. [Google Scholar] [CrossRef] [Green Version]
  4. Codispoti, R.; Oliveira, D.V.; Olivito, R.S.; Lourenço, P.B.; Fangueiro, R. Mechanical performance of natural fiber-reinforced composites for the strengthening of masonry. Compos. Part B 2015, 77, 74–83. [Google Scholar] [CrossRef]
  5. Lu, T.; Jiang, M.; Jiang, Z.; Hui, D.; Wang, Z.; Zhou, Z. Effect of surface modification of bamboo cellulose fibers on mechanical properties of cellulose/epoxy composites. Compos. Part B 2013, 51, 28–34. [Google Scholar] [CrossRef]
  6. Shahzad, A. Hemp fiber and its composites—A review. J. Compos. Mater. 2011, 46, 973–986. [Google Scholar] [CrossRef]
  7. Joshi, S.V.; Drzal, L.T.; Mohanty, A.K.; Arora, S. Are natural fiber composites environmentally superior to glass fiber reinforced composites? Compos. Part A 2004, 35, 371–376. [Google Scholar] [CrossRef]
  8. Wambua, P.; Ivens, J.; Verpoest, I. Natural fibres: Can they replace glass in fibre reinforced plastics? Compos. Sci. Technol. 2003, 63, 1259–1264. [Google Scholar] [CrossRef]
  9. Li, Y.; Mai, Y.-W.; Ye, L. Sisal fibre and its composites: A review of recent developments. Compos. Sci. Technol. 2000, 60, 2037–2055. [Google Scholar] [CrossRef]
  10. Saheb, D.N.; Jog, J.P. Natural fiber polymer composites: A review. Adv. Polym. Technol. 1999, 18, 351–363. [Google Scholar] [CrossRef]
  11. Bledzki, A.K.; Gassan, J. Composites reinforced with cellulose based fibres. Prog. Polym. Sci. 1999, 24, 221–274. [Google Scholar] [CrossRef]
  12. Cichocki, F.R., Jr.; Thomason, J.L. Thermoelastic anisotropy of a natural fiber. Compos. Sci. Technol. 2002, 62, 669–678. [Google Scholar] [CrossRef]
  13. Thomason, J.L. Why are natural fibres failing to deliver on composite performance? In Proceedings of the 17th International Conference on Composite Materials, Edinburgh, UK, 27–31 July 2009. [Google Scholar]
  14. Virk, A.S.; Hall, W.; Summerscales, J. Tensile properties of jute fibres. Mater. Sci. Technol. 2009, 25, 1289–1295. [Google Scholar] [CrossRef]
  15. Thomason, J.L. Dependence of interfacial strength on the anisotropic fiber properties of jute reinforced composites. Polym. Compos. 2010, 31, 1525–1534. [Google Scholar] [CrossRef]
  16. Thomason, J.L.; Carruthers, J.; Kelly, J.; Johnson, G. Fibre cross-section determination and variability in sisal and flax and its effects on fibre performance characterisation. Compos. Sci. Technol. 2011, 71, 1008–1015. [Google Scholar] [CrossRef]
  17. Thomason, J.L.; Carruthers, J. Natural fibre cross sectional area, its variability and effects on the determination of fibre properties. J. Biobased Mater. Bioenergy 2012, 6, 424–430. [Google Scholar] [CrossRef]
  18. Ntenga, R.; Béakou, A.; Atangana Atéba, J.; Ayina Ohandja, L. Estimation of the elastic anisotropy of sisal fibres by an inverse method. J. Mater. Sci. 2008, 43, 6206–6213. [Google Scholar] [CrossRef]
  19. Baley, C.; Perrot, Y.; Busnel, F.; Guezenoc, H.; Davies, P. Transverse tensile behaviour of unidirectional plies reinforced with flax fibres. Mater. Lett. 2006, 60, 2984–2987. [Google Scholar] [CrossRef]
  20. Shah, D.U.; Schubel, P.J.; Clifford, M.J.; Licence, P. The tensile behavior of off-axis loaded plant fiber composites: An insight on the nonlinear stress–strain response. Polym. Compos. 2012, 33, 1494–1504. [Google Scholar] [CrossRef]
  21. Symington, M.C. Vacuum infusion of natural fibre composites. In Proceedings of the 13th European Conference of Composite Materials, Stockholm, Sweden, 2–5 June 2008. [Google Scholar]
  22. Kawabata, S. Measurement of the transverse mechanical properties of high-performance fibres. J. Text. Inst. 1990, 81, 432–447. [Google Scholar] [CrossRef]
  23. Schapery, R.A. Thermal expansion coefficients of composite materials based on energy principles. J. Compos. Mater. 1968, 2, 380–404. [Google Scholar] [CrossRef]
  24. Chamberlain, N.J. Derivation of Expansion Coefficients for a Fibre Reinforced Composites; BAC SON(P) Report 33; British Aircraft Corporation: London, UK, 1968. [Google Scholar]
  25. Chamis, C.C. Simplified Composite Micromechanics Equations for Hygral, Thermal and Mechanical Properties; NASA Report TM-83320; NASA: Washington, DC, USA, 1983.
  26. Thomason, J.L. Interfacial strength in thermoplastic composites—At last an industry friendly measurement method? Compos. Part A 2002, 33, 1283–1288. [Google Scholar] [CrossRef]
  27. Thomason, J.L. Micromechanical parameters from macromechanical measurements on glass reinforced polypropylene. Compos. Sci. Technol. 2002, 62, 1455–1468. [Google Scholar] [CrossRef] [Green Version]
  28. Thomason, J.L.; Yang, L. Temperature dependence of the interfacial shear strength in glass–fibre polypropylene composites. Compos. Sci. Technol. 2011, 71, 1600–1605. [Google Scholar] [CrossRef]
  29. Thomason, J.L.; Yang, L. Temperature dependence of the interfacial shear strength in glass–fibre epoxy composites. Compos. Sci. Technol. 2014, 96, 7–12. [Google Scholar] [CrossRef] [Green Version]
  30. Thomason, J.L.; Yang, L.; Bryce, D.; Minty, R. An exploration of the relationship of chemical and physical parameters in the micromechanical characterisation of the apparent interfacial strength in glass fibre epoxy systems. IOP Conf. Ser.: Mater. Sci. Eng. 2016, 139, 012048. [Google Scholar] [CrossRef]
  31. Charlet, K.; Jernot, J.P.; Eve, S.; Gomina, M.; Bréard, J. Multi-scale morphological characterisation of flax: From the stem to the fibrils. Carbohydr. Polym. 2010, 82, 54–61. [Google Scholar] [CrossRef]
Figure 1. Optical micrographs of polished cross sections of natural fibre epoxy composites: (a) Flax fibre composites; (b) Sisal fibre composites.
Fibers 05 00036 g001
Figure 2. Results of dynamic mechanical analysis (DMA) of epoxy matrix and composites at various loading angles: (a) Flax fibre composites; (b) Sisal fibre composites.
Fibers 05 00036 g002
Figure 3. Comparison of the fibre and resin moduli: (a) Fibre longitudinal modulus; (b) Fibre transverse modulus.
Fibers 05 00036 g003
Figure 4. Comparison of the modulus anisotropy of natural fibres with other reinforcement fibres.
Fibers 05 00036 g004
Figure 5. The composite modulus at various loading angles compared to values fitted using Equation (3).
Fibers 05 00036 g005
Figure 6. Shear modulus of flax and sisal fibres compared with the shear modulus of the matrix.
Fibers 05 00036 g006
Figure 7. Results of TMA of epoxy matrix composites at various loading angles: (a) Flax fibre composites; (b) Sisal fibre composites.
Fibers 05 00036 g007
Figure 8. Comparison of resin and fibre coefficients of thermal expansion: (a) Flax fibres; (b) Sisal fibres.
Fibers 05 00036 g008
Table 1. Summary of flax and sisal fibre thermoelastic properties at different temperatures.
FlaxSisal
−50 °C−25 °C0 °C25 °C50 °C−50 °C−25 °C0 °C25 °C50 °C
E1f (GPa)69.867.665.762.560.225.024.623.321.921.1
E2f (GPa)1.31.21.11.00.751.91.81.71.61.3
G12 (GPa)2.11.81.51.41.11.11.01.11.11.1
α1f
(µm/m °C)
−6.0−6.9−7.1−8.0−6.9−3.3−4.6−7.4−3.9−4.0
α2f
(µm/m °C)
48.068.168.482.765.233.254.770.079.176.8
Table 2. Comparison of reinforcement fibre thermoelastic properties at room temperatures [22].
E-GlassCarbonAramidFlaxSisal
Ef1 (GPa)7722015262.521.9
Ef2 (GPa)68144.21.01.6
Gf12 (GPa)30142.91.41.1
αf1 (µm/m °C)5−0.43.6−8.0−3.9
αf2 (µm/m °C)518778380