Skip to Content
FibersFibers
  • Article
  • Open Access

1 December 2016

Performance of Strengthened Non-Uniformly Corroded Reinforced SCC-RAP Members

and
1
Civil Engineering Department, Ohio Northern University, Ada, OH 45810, USA
2
Mechanical Engineering Department, Ohio Northern University, Ada, OH 45810, USA
*
Author to whom correspondence should be addressed.

Abstract

This research examines the performance of strengthened non-uniformly corroded reinforced self-consolidating concrete (SCC) members. This paper focuses on three aspects of concrete including corrosion, concrete cover loss, and repair technique. Up to a 50% corrosion level is considered in this study. Corrosion was experimentally induced and was simulated in other cases. Twenty-six reinforced concrete (RC) members with various corrosion levels or simulated corrosion levels were constructed and investigated. The beams with corrosion problems including those that had experimentally induced corrosion or simulated corrosion, with or without concrete cover, were repaired using carbon fiber reinforced polymer (CFRP) sheets and U-wraps. Two line loads were applied to all of the non-repaired and repaired beams constructed in this study until failure. It was found that it is conservative to model the actual corrosion by simulating the equivalent area of steel reinforcing for up to a 20% level of corrosion. For corrosion levels over 20%, the simulated corrosion over predicts the load capacity of the actual corrosion cases. When the concrete cover was lost and for a corrosion level larger than 10%, the repaired beam did not reach similar performance to that of a repaired beam with a concrete cover that was still intact. It appears that using two layers of CFRP sheet did not improve the load capacity further, but rather improved the ductility of the deteriorated RC member.

1. Introduction

Corrosion of steel reinforcing is a problem affecting the durability and safety of reinforced concrete (RC) structures. It has even been identified as the main cause for deterioration of concrete structures [1]. During the winter time, especially in areas with a severe winter, there is a greater application of deicing salts on bridges, which creates harsh environmental conditions that result in a higher likelihood of corrosion. Due to penetration of chemicals, corrosion in reinforcing steel may start to occur if the chemicals reach the steel surface in high enough concentration. When the corrosion process starts in the presence of water, the corrosion products on reinforcing steel expand, which may subject the surrounding concrete to an internal pressure. Cracks may develop and spalling of the concrete cover may take place [2,3,4,5]. With spalling of concrete cover and significant loss of rebar cross-sectional area, the performance of the RC structure will be affected, and this may affect load carrying capacity, serviceability, and ductility of the RC structure.
Since this is a problem of durability and safety that may shorten the service life of RC structures, it is essential to investigate an efficient and cost-effective repair technique to be used to store the capacity and extend the service life of deteriorated RC members. Many researchers have investigated the corrosion problem of RC structures (e.g., [1,6,7,8,9]).
In general, carbon fiber reinforced polymer (CFRP) is commonly used in the repair of defective concrete structures, therefore, it can be used to strengthen corroded reinforced concrete structures. Li and Englund [10] presented the application of CFRP in the aerospace industry and discussed how the waste is recycled to produce new composite products. CFRP has some superior characteristics such as its high strength to weight ratio, resistance to chemicals, and smoothness of applying CFRP in the field without disturbance to traffic [11,12]. CFRP has some drawbacks such as debonding, which limits utilizing full capacity of CFRP [13,14,15]. It was found that applying both vertical and horizontal fiber reinforced polymer (FRP) laminates reduces the possibilities of debonding [16].
Several researchers have investigated the performance of self-consolidation concrete (SCC) (e.g., [17,18,19,20,21,22,23,24,25]). Research was undertaken to investigate the appropriate mix design for SCC and to incorporate new materials in the preparation of SCC. It was found that using fly ash and slag cement has a positive effect on the fresh and hardened characteristics of SCC. Having high content of Portland cement in SCC increases the cost of SCC; also, CO2 emission increases. A number of researchers incorporated recycled aggregates in concrete since recycled aggregates can help to reduce the environmental impact of concrete as they come from the demolition of roads, returned concrete, and buildings or structures. Moreover, it can reduce the consumption of natural resources that are used in concrete. Abdel-Mohti et al. [17] performed research to prepare SCC with recycled aggregates.
The aim of this study is to investigate: (1) The effect of corrosion on the RC members with up to 50% non-uniform (experimentally induced) corrosion over the length of bar under accelerated simulated natural environmental conditions and a simulated uniform corrosion level over the length of bar; (2) The effect of recovering the beam with cover loss due to concrete cover spalling; and (3) The effectiveness of the repair technique of applying CFRP on beams with different corrosion levels and recovers. RC members were constructed using SCC with supplementary cementation materials (SCM) and 10% recycled asphalt pavement (RAP) to replace conventional coarse aggregates. Repair was carried out by repairing the concrete cover if beams were constructed without cover and by applying CFRP in both transverse and longitudinal directions. Some of the RC members were reinforced with corrosion-free reinforcing steel or were not repaired to be used as benchmarks. All of the constructed RC members in the current study, either repaired or non-repaired, were tested under double line loads until failure.

2. Experimental Program

2.1. Preparation of Self-Consolidating Concrete

Following a detailed study to incorporate RAP into SCC to replace a portion of coarse aggregates [17], it was decided to use an SCC mixture having cementitious material (Table 1) including ASTM C 150 Type I Portland cement, Class C flyash, and slag cement. The supplementary cementation materials (SCM) were incorporated to make SCC more sustainable. Natural sand was used as fine aggregate. Coarse aggregates used were #57 and #8 limestone with a fixed ratio between the amounts of #57 to #8 of 1:1. Water to cementitious material ratio (w/cm) of 0.38 was used. The mixtures included RAP to replace 10% of the coarse aggregates in an effort to further improve the sustainability. A viscosity modifying admixture (VMA) and a high range water reducer (HRWR) were used to produce SCC.
Table 1. Mix design proportions. W: Water ; C: Cement.
Fresh characteristics of SCC were determined by conducting a number of tests. Abdel-Mohti et al. [17] presents the results of these tests in more details.
The compressive and tensile strength of the SCC mixture were determined at 3, 7, 14, and 28 days of age of concrete to capture the early strength of concrete. A total of 16 samples were taken from each concrete mixture and allowed to cure for 28 days, noting that mix design was the same throughout this project (Table 1). Curing was performed in accordance with ASTM C192. The strength of each sample was measured and then the average of the results of all the samples was reported at the time of each test. The compression test was performed in accordance with ASTM C39, whereas the splitting tensile test was performed in accordance with ASTM C496. The samples were thoroughly cured for 3, 7, 14, and 28 days. The same standard testing machine was used to conduct both the compression and tensile tests. The machine was cleaned and brushed before placing a sample on the center of the bottom plate. The load was applied at a constant rate as per ASTM until failure. A Weibull distribution, density function denoted as f(x) as follows [26], was used to fit the results of compressive and tensile strength to present the size of scatter in the data.
f ( x ) = m x ( x c ) m e ( x c ) m
where the parameters, m and c, called shape and scale parameters, respectively, must be positive.

2.2. Casting of Reinforced Concrete Beams

A large-scale accelerated corrosion test was performed to induce corrosion in a total of 34 Grade 60 deformed steel rebars to achieve different levels of corrosion. The rebars were 1.828 m long and 15.875 mm in diameter and were immersed in a molten salt solution. A copper tube was put in the solution next to the rebar to form an electrochemical galvanic couple. A constant electric current of 5.76 Amp was applied to the designed system through installed power supplies to expedite the corrosion process. The level of corrosion was measured by means of measuring the amount of mass loss after the test was completed. More details about the corrosion process can be found in Abdel-Mohti and Shen [27]. Five levels of corrosion were targeted including 10%, 20%, 32%, 40%, and 50%. It required approximately 3 days, 5–6 days, 10 days, 13 days, and 18 days to reach 10%, 20%, 32%, 40%, and 50% corrosion levels, respectively. Figure 1 defines the notations used in Table 2 for the diameter schedule of the corroded rebars.
Figure 1. Diameter schedule for rebars (dimensions are in mm).
Table 2. Rebar diameter schedule for different corrosion levels. E: Experimental.
It was possible to simulate most of the levels of corrosion by using the equivalent cross-sectional areas of the rebars to reach a similar level of reduction in the cross-sectional area of the reinforcing steel. It was possible to simulate 10%, 20%, 32%, and 50% corrosion levels (Table 3), but it was not possible to simulate a 40% corrosion level. This was due to the unavailability of rebar sizes that could be used to reach this level of reduction in the cross-sectional area of reinforcing steel. The performance of concrete members reinforced with experimentally corroded rebars was compared to that of concrete members reinforced with simulated rebars in order to examine the influence of the non-uniform distribution of corrosion over the length of rebars, that takes place due to the actual corrosion process, on the performance of RC members.
Table 3. Simulated corrosion. S: Simulated. #: Size.
When SCC and rebars were prepared, 26 beams were casted. A typical beam was 15.24 cm wide, 15.24 cm deep, and 1.828 m long. Distance from one support to another was 1.524 m. A control beam was reinforced with two (#5) 15.875 mm diameter corrosion-free deformed rebars. A beam with a given level of corrosion was reinforced with two (#5) 15.875 mm diameter corroded deformed rebars. A beam with a particular simulated level of corrosion was reinforced with rebars having diameters in accordance with Table 3 to match different levels of corrosion. Shear reinforcement was applied by providing three 6.35 mm diameter A36 steel stirrups at 203.2 mm spacing on the center. The distance from the center of the support to the center of the first stirrup was 50.8 mm. A cover of 25.4 mm was applied all around the reinforcement.
After the reinforcement cage was assembled, chairs were attached to the bottom and sides of the cage to provide the needed cover. The cage was placed in the designed formwork, and then the prepared SCC was poured. SCC was poured only from one side of the beam and was able to completely fill the formwork without the need for any mechanical compaction. The casted beams were allowed to cure for 28 days; afterwards, repair and testing were performed.

2.3. Repair of Reinforced Concrete Beams

The control beam was the one that did not have any corrosion problems and was not repaired (CB-CN). Beams with rebars with corrosion levels of 10% (E 10–CN), 20% (E 20–CN), 32% (E 30–CN), 40% (E 40–CN), and 50% (E 50–CN) were not repaired and were used as benchmarks. Correspondingly, beams with simulated corrosion levels of 10% (S 10–CN), 20% (S 20–CN), 32% (S 32–CN), and 50% (S 50–CN) did not experience any repair and were used as benchmarks. Tyfo SCH-41 CFRP and two-part Tyfo S epoxy were used to repair the beams. The properties of the CFRP materials are presented in Table 4. U-wraps were applied to beams as presented in Figure 2. The beams with rebars having corrosion levels of 10% (E 10–CR and S 10–CR), 20% (E 20–CR and S 20–CR), 32% (E 32–CR and S 32–CR), 40% (E 40–CR), and 50% (E 50–CR and S 50–CR) were repaired with both one layer CFRP sheets and U-wraps. The beams having rebars with high corrosion levels of 40% (E 40–C2R) and 50% (E 50–C2R) were repaired again with one more layer of CFRP sheets and U-wraps. When the concrete cover was assumed to be lost, the beams with rebars with corrosion levels of 10% (E 10–NCR), 20% (E 20–NCR), 32% (E 32–NCR), 40% (E 40–NCR), and 50% (E 50–NCR) were repaired after 28 days by adding a new cover by casting the beams with one layer CFRP sheet and U-wraps. The same mix design (Table 1) was used to prepare the concrete for the cover, and the concrete was allowed to cure for only 7 days to simulate the case when the concrete of the cover has a smaller strength than the concrete of the original RC member. The CFRP sheets, installed to the bottom of the beams, were 12.7 cm wide and 1.22 m long.
Table 4. Properties of carbon fiber reinforced polymer (CFRP) materials.
Figure 2. A typical test setup for a repaired reinforced concrete (RC) member (dimensions are in mm).
A number of steps were undertaken to prepare the beam before CFRP was applied as recommended by the manufacturer. The beams were flipped so the bottom was facing up. The CFRP sheets and U-wrap were cut and prepared. The first step is surface preparation which followed these principles; the surface shall be clean, free of any holes, and dry. Sandblasting or grinding may be needed to prepare the surface. If the epoxy parts are too thick, heat may be applied by placing the individual containers in a hot water bath until the components become more fluid. The two parts of the epoxy shall be mixed thoroughly for at least five minutes using a low-speed mixer at 400–600 rpm. After mixing is complete, the epoxy shall be inspected to insure consistency. Next, a primer layer of epoxy is applied to the concrete surface while the CFRP is saturated with epoxy. Apply CFRP to the concrete surface and press it against the surface to ensure that there are no air voids between the fabric and concrete or in epoxy.
Several scenarios were investigated in this study: (1) Actually corroded rebars were used to resemble the real corrosion scenario when corrosion is non-uniform over the length of rebars while the concrete cover is still intact; (2) Assumed a uniform reduction in the reinforcing steel cross-sectional area. In this case, an equivalent area of reinforcing steel to corroded steel was used to reinforce the RC members; (3) It was assumed that the concrete cover was lost due to corrosion and the corroded RC member was built without cover, and then got recovered as part of the repair; (4) CFRP was applied on beams with different corrosion levels and recovered to study the effectiveness of the repair technique.

2.4. Testing

All of the beams were tested under the effect of static loading until failure. The beams were control beam (CB)–CN, E 10–CN, S 10–CN, E 10–CR, S 10–CR, E 20–CN, S 20–CN, E 20–CR, S 20–CR, E 32–CN, S 32–CN, E 32–CR, S 32–CR, E 40–CN, E 40–CR, E 50–CN, S 50–CN, E 50–CR, S 50–CR, E 10–NCR, E 20–NCR, E 32–NCR, E 40–NCR, E 50–NCR, E 40–C2R, and E 50–C2R. The beams were placed on the test setup, where the center to center distance between supports was 1.524 m. Two line loads were applied to each beam through a loading frame centered at the mid-span of the beam. The two line loads were applied 30.48 cm apart. The load was applied using an Instron® machine (Instron, Norwood, MA, USA) until failure.

3. Results and Discussion

3.1. Compressive and Tensile Concrete Strength

Figure 3 and Figure 4 show the results of compressive and tensile strength at 3, 7, 14, and 28 days for all of the concrete samples taken from the SCC mixtures for all the 26 beams. Results are analyzed using Weibull distribution as presented in Figure 5 and Figure 6. Table 5 presents a comparison between the average concrete strength and mean concrete strength calculated using Weibull distribution.
Figure 3. Concrete compressive strength results.
Figure 4. Concrete tensile strength results.
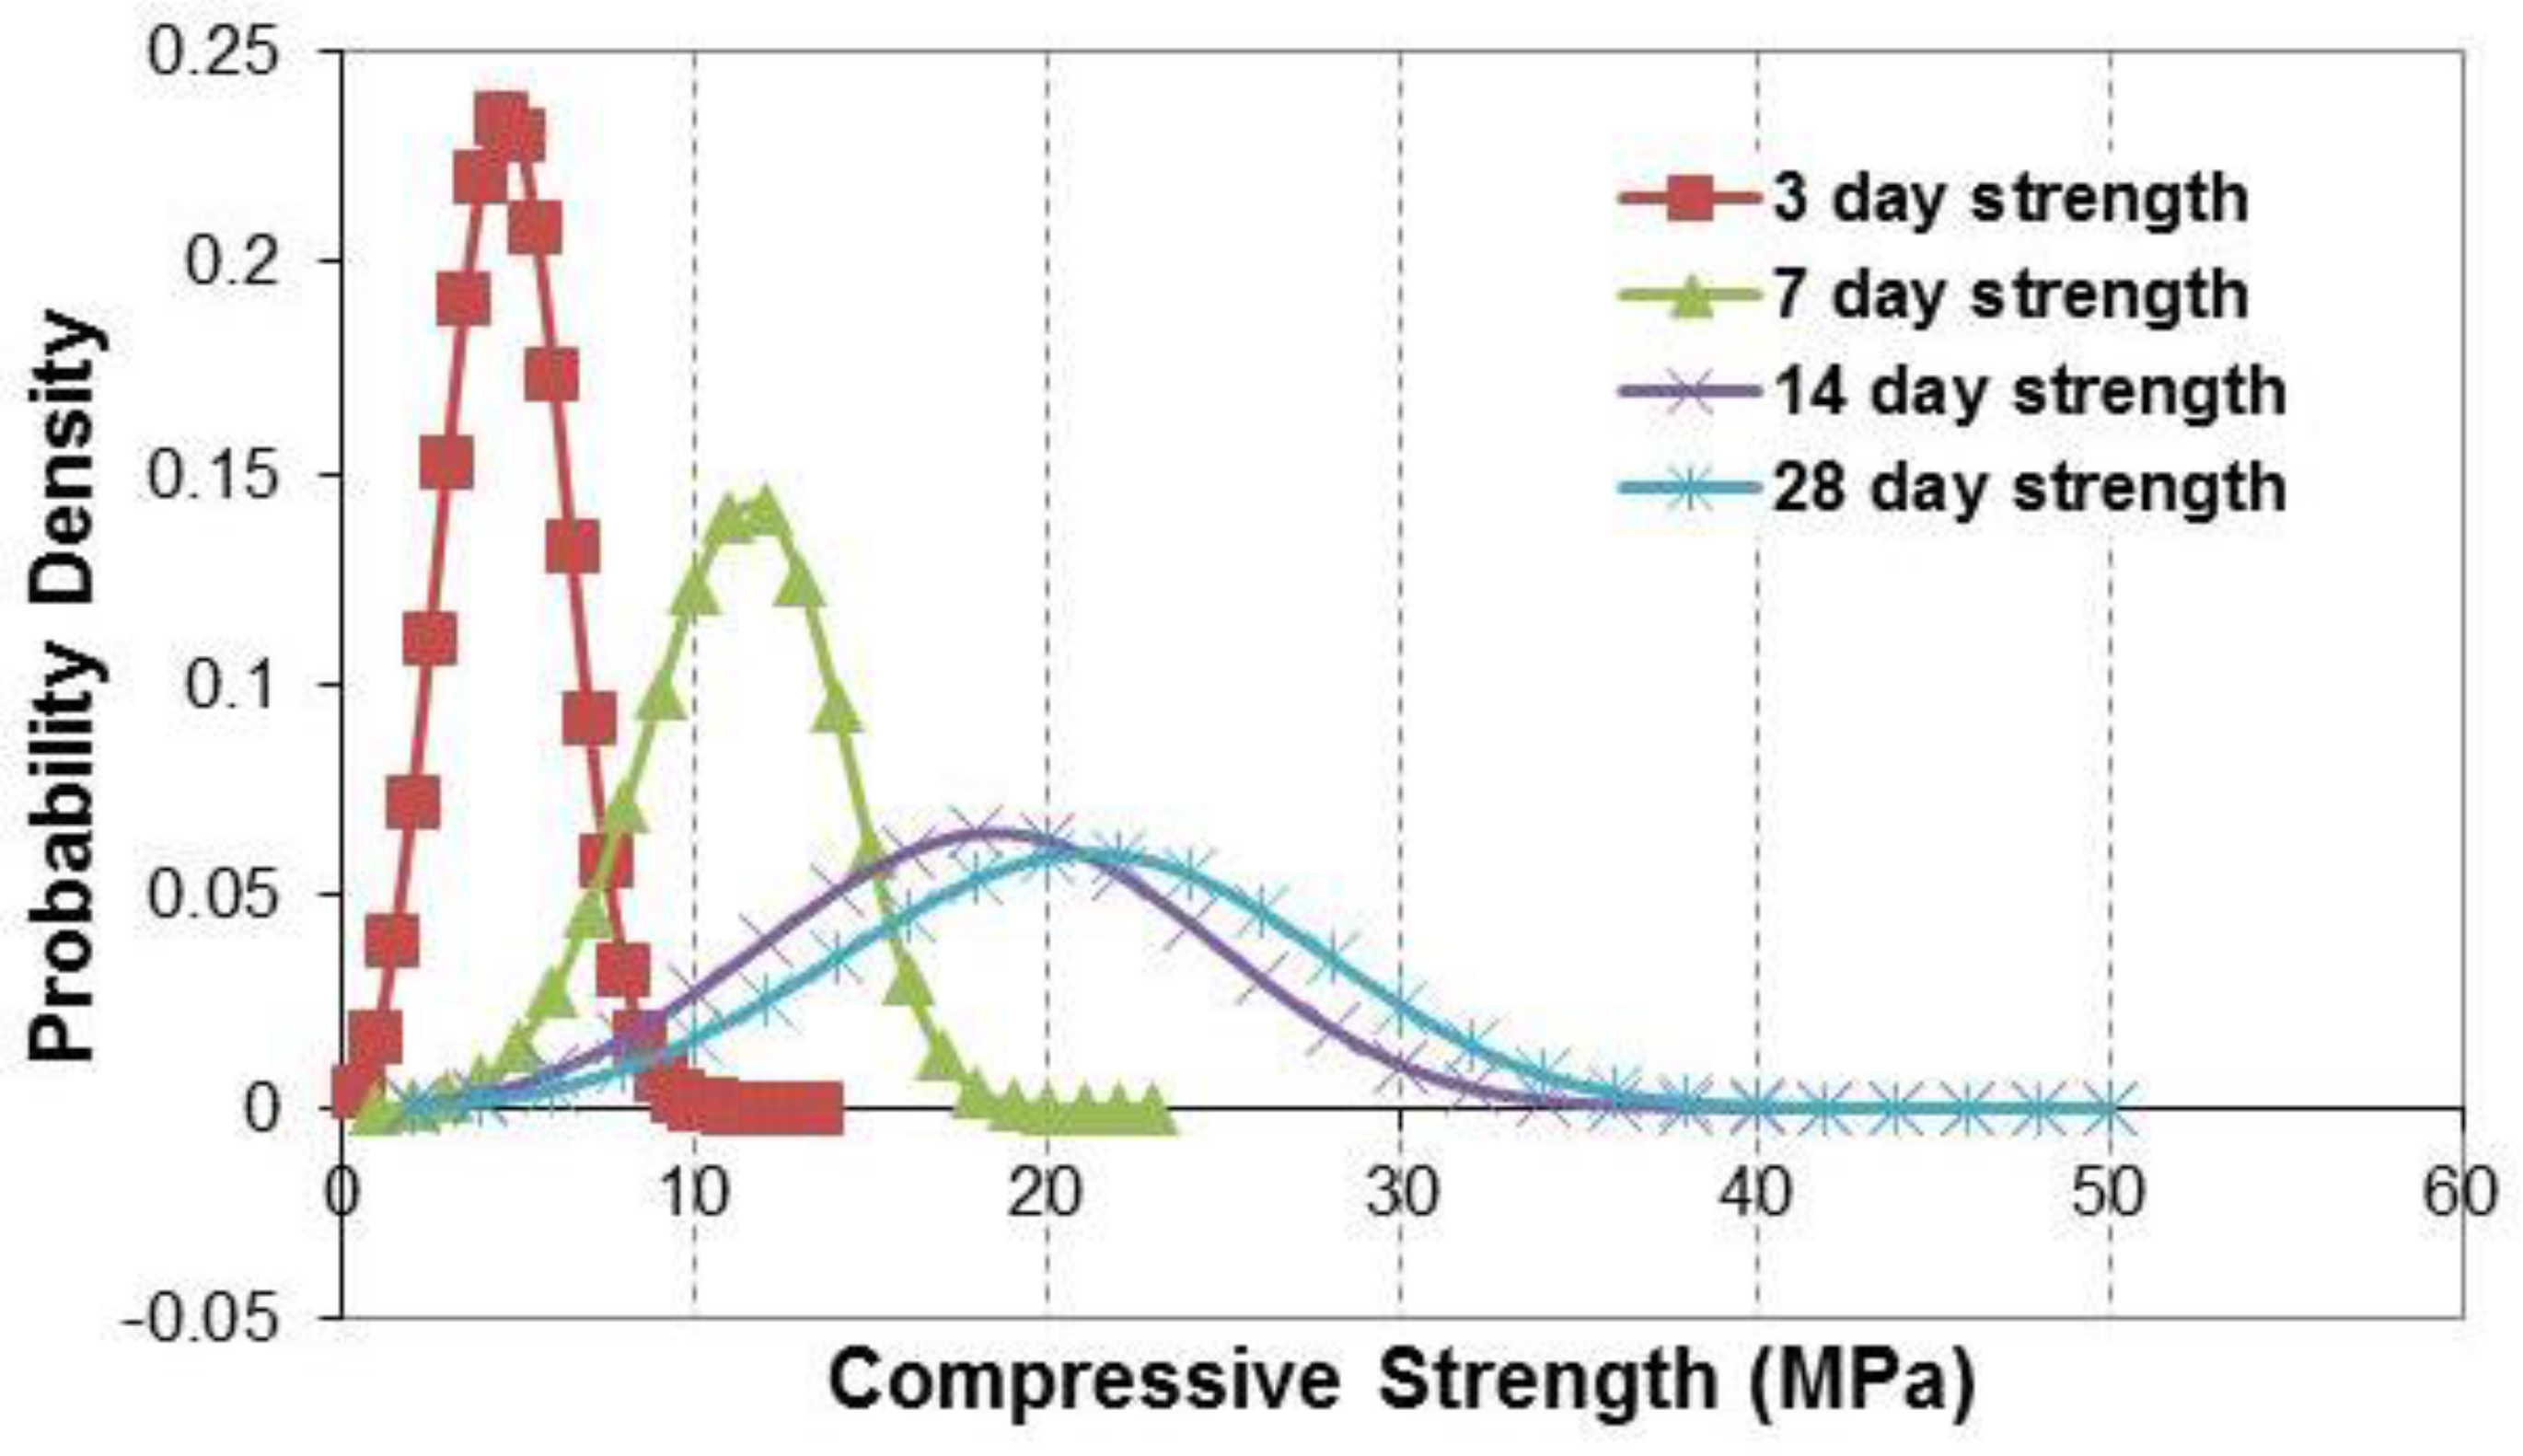
Figure 5. Weibull distribution of concrete compressive strength.
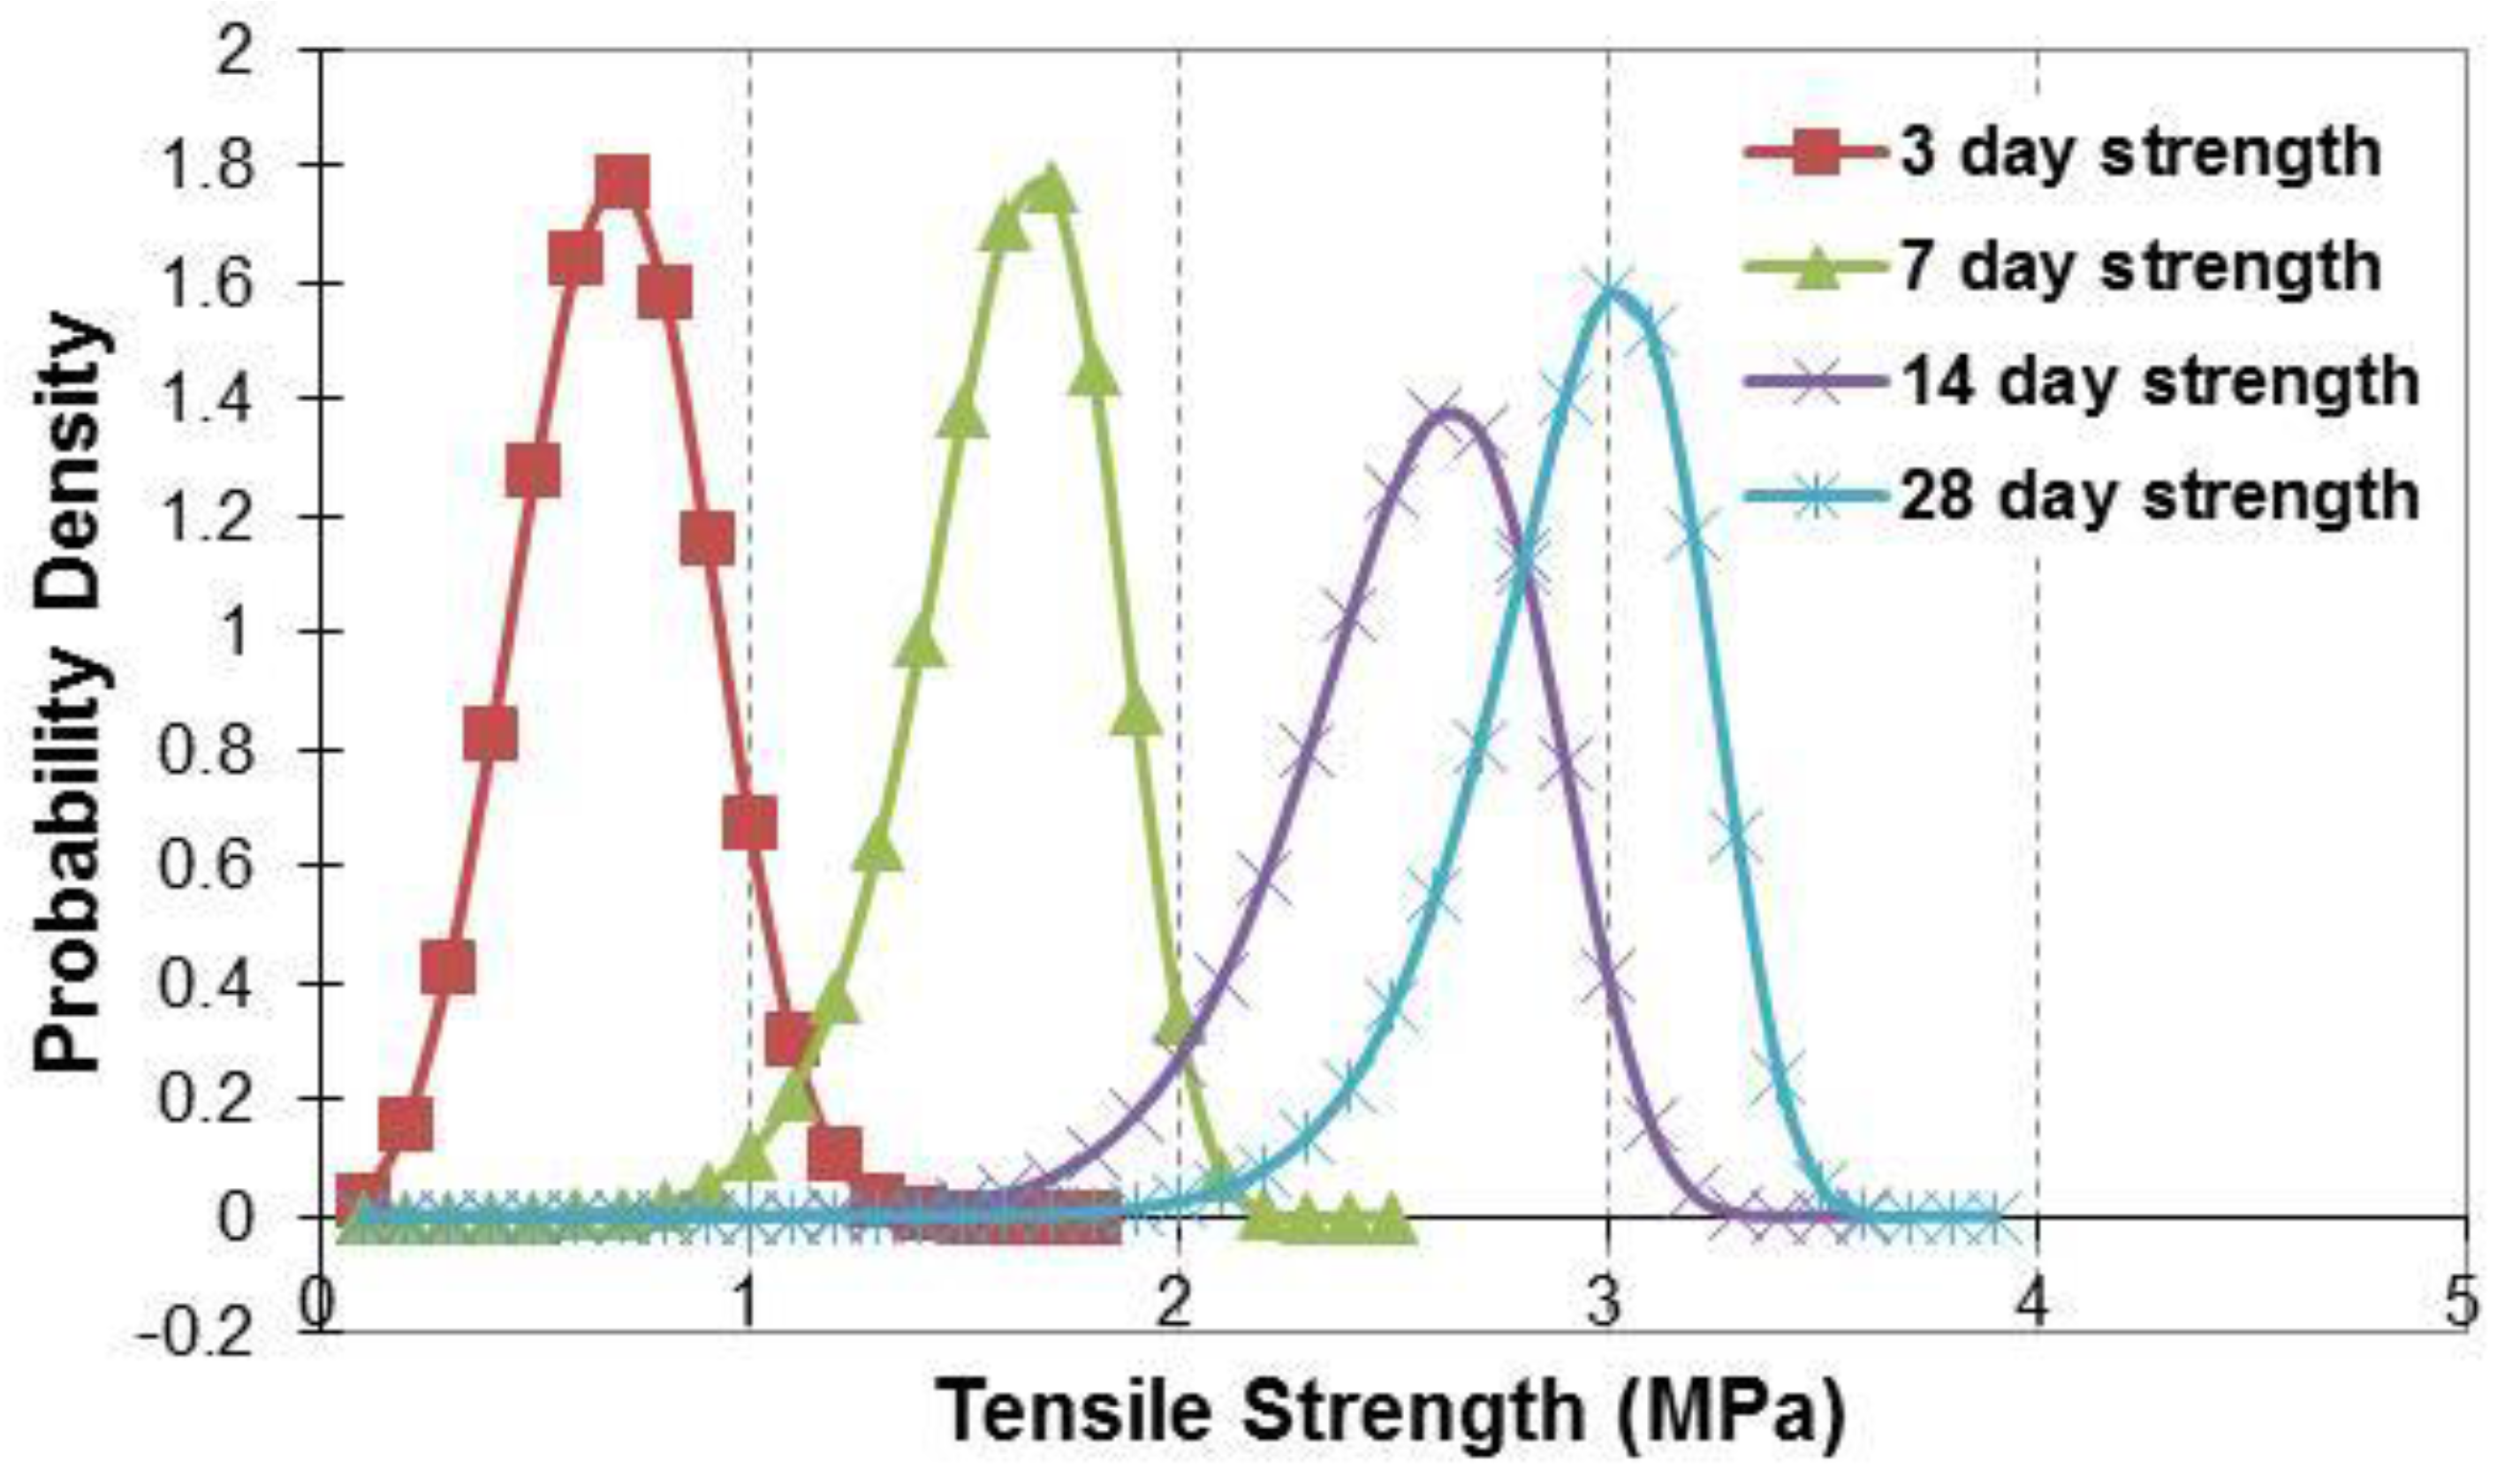
Figure 6. Weibull distribution of concrete tensile strength.
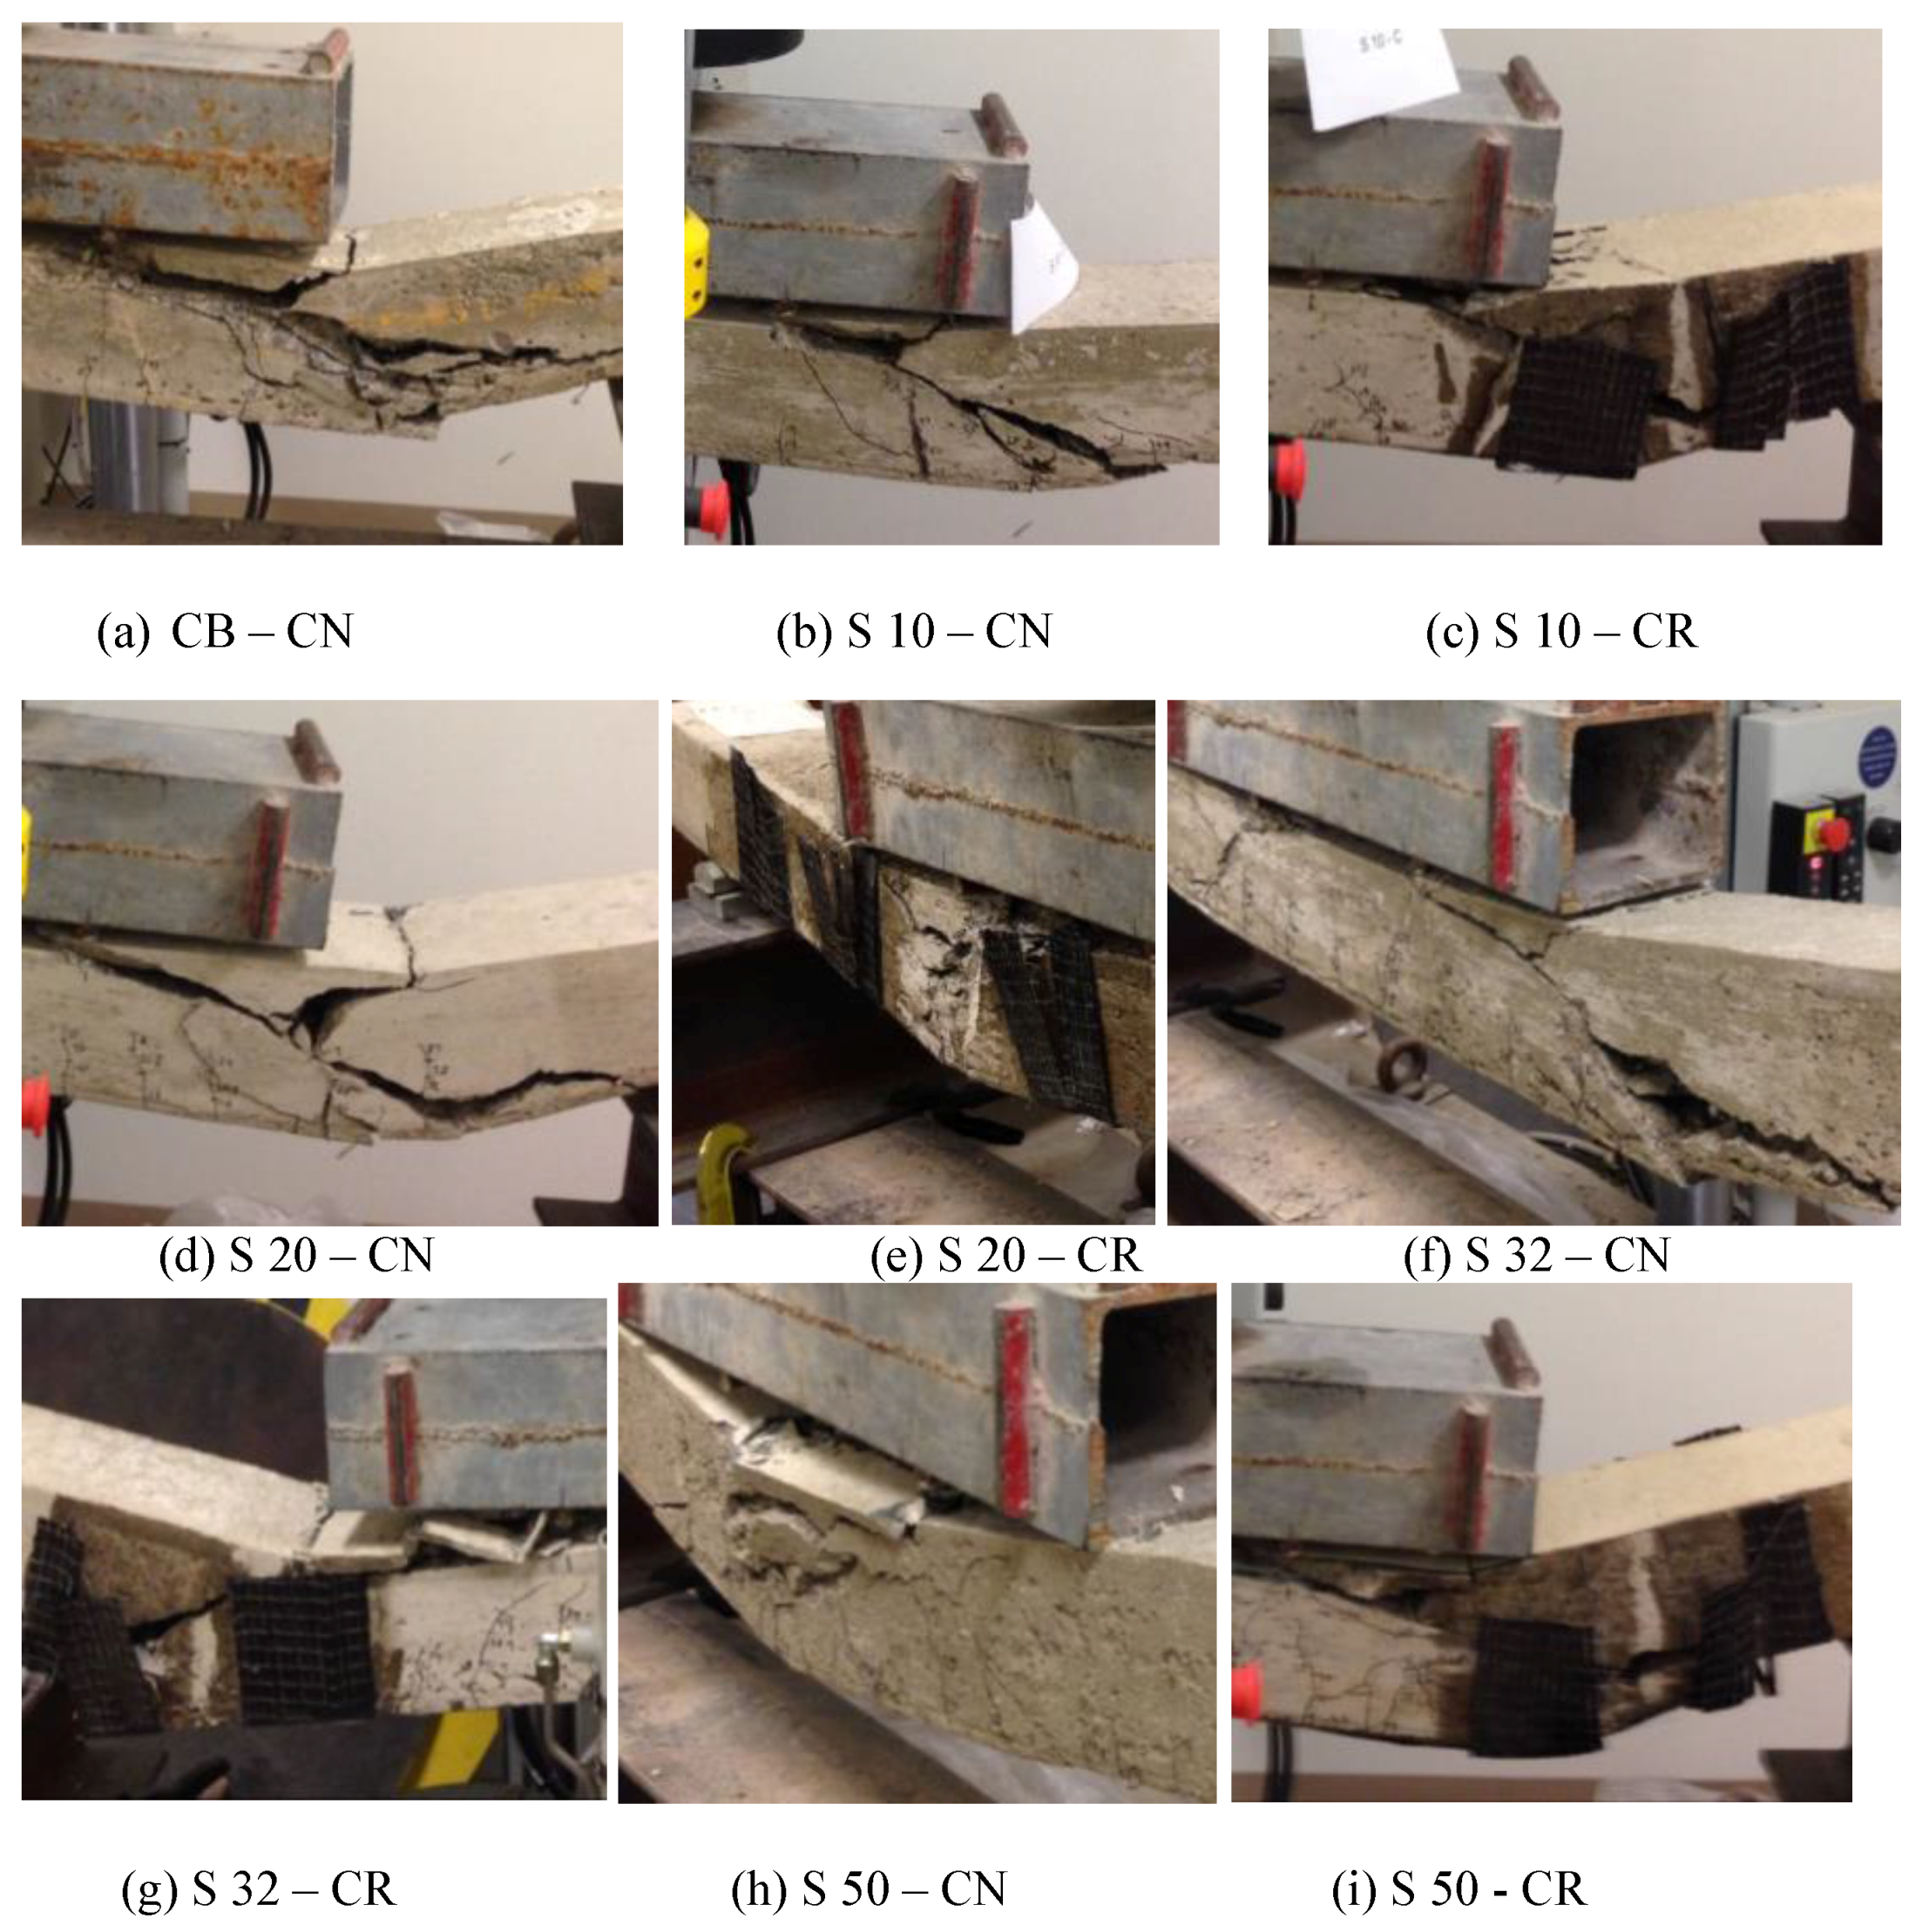
Table 5. Concrete compressive and tensile strength.

3.2. Testing

As mentioned before, all of the 26 beams were tested under two line loads until failure using the same test setup (Figure 2). For all beams under study, the load-deflection relationships were plotted. All of the tested beams experienced extensive flexural cracks close to mid-span before failure. Table 6 presents primary test results of all of the RC members.
Table 6. Comparison between load capacity of all beams.

3.2.1. Simulated Corrosion

Table 7 presents a description of failure of the control beam and all beams with simulated corrosion. Also, Figure 7 shows the failure of the beams. By comparing the load-deflection relationships of beams with simulated corrosion to that of the control beam (Figure 8), it can be observed that as the level of simulated corrosion increased, the load capacity became smaller, stiffness became lower, and beam became more ductile. Beam S 10–CN did not follow this trend as it showed the lowest carrying capacity. This may be due to the quality of concrete of beam S 10–CN. It was difficult to simulate 10% corrosion level and the only option was to use 5 # 3 rebar. It seems that there was not enough spacing between rebars due to the large number of rebars used, so, concrete was blocked, which affected the quality of concrete.
Table 7. Failure description of control beam and beams with simulated corrosion.
Figure 7. Failure of control beam and beams with simulated corrosion.
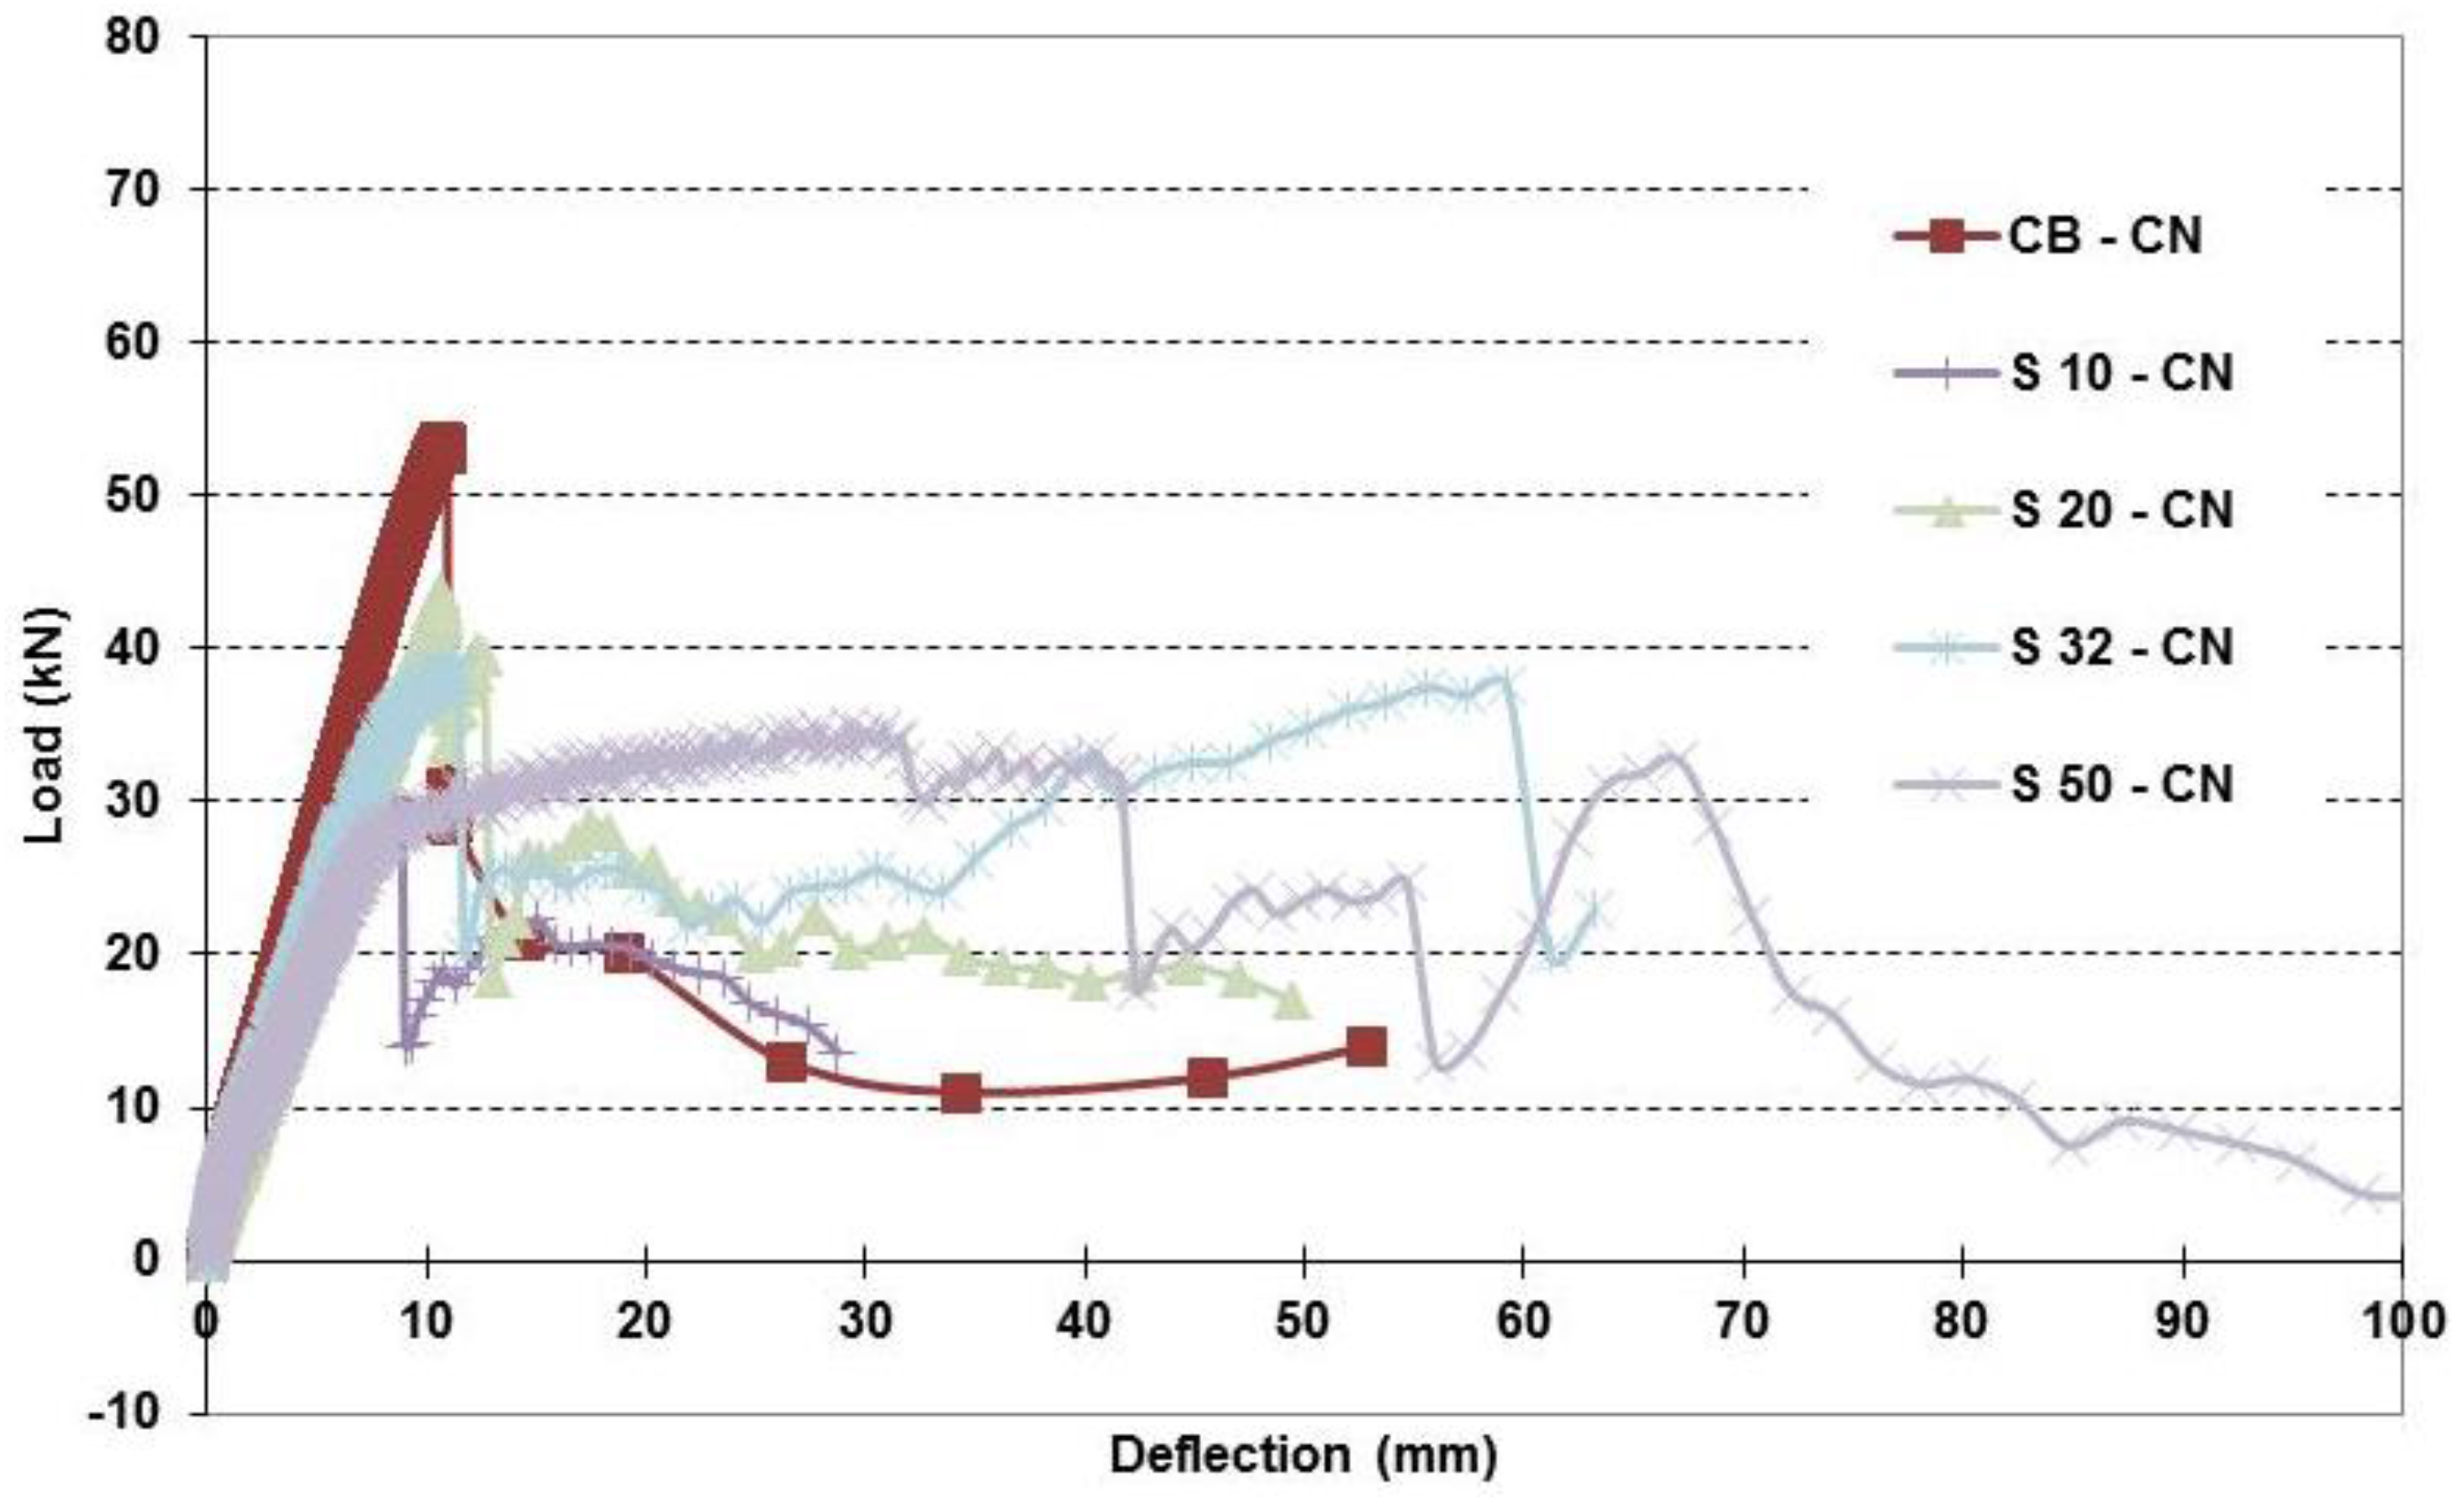
Figure 8. Load-deflection relationships of control beam and beams with simulated corrosion.
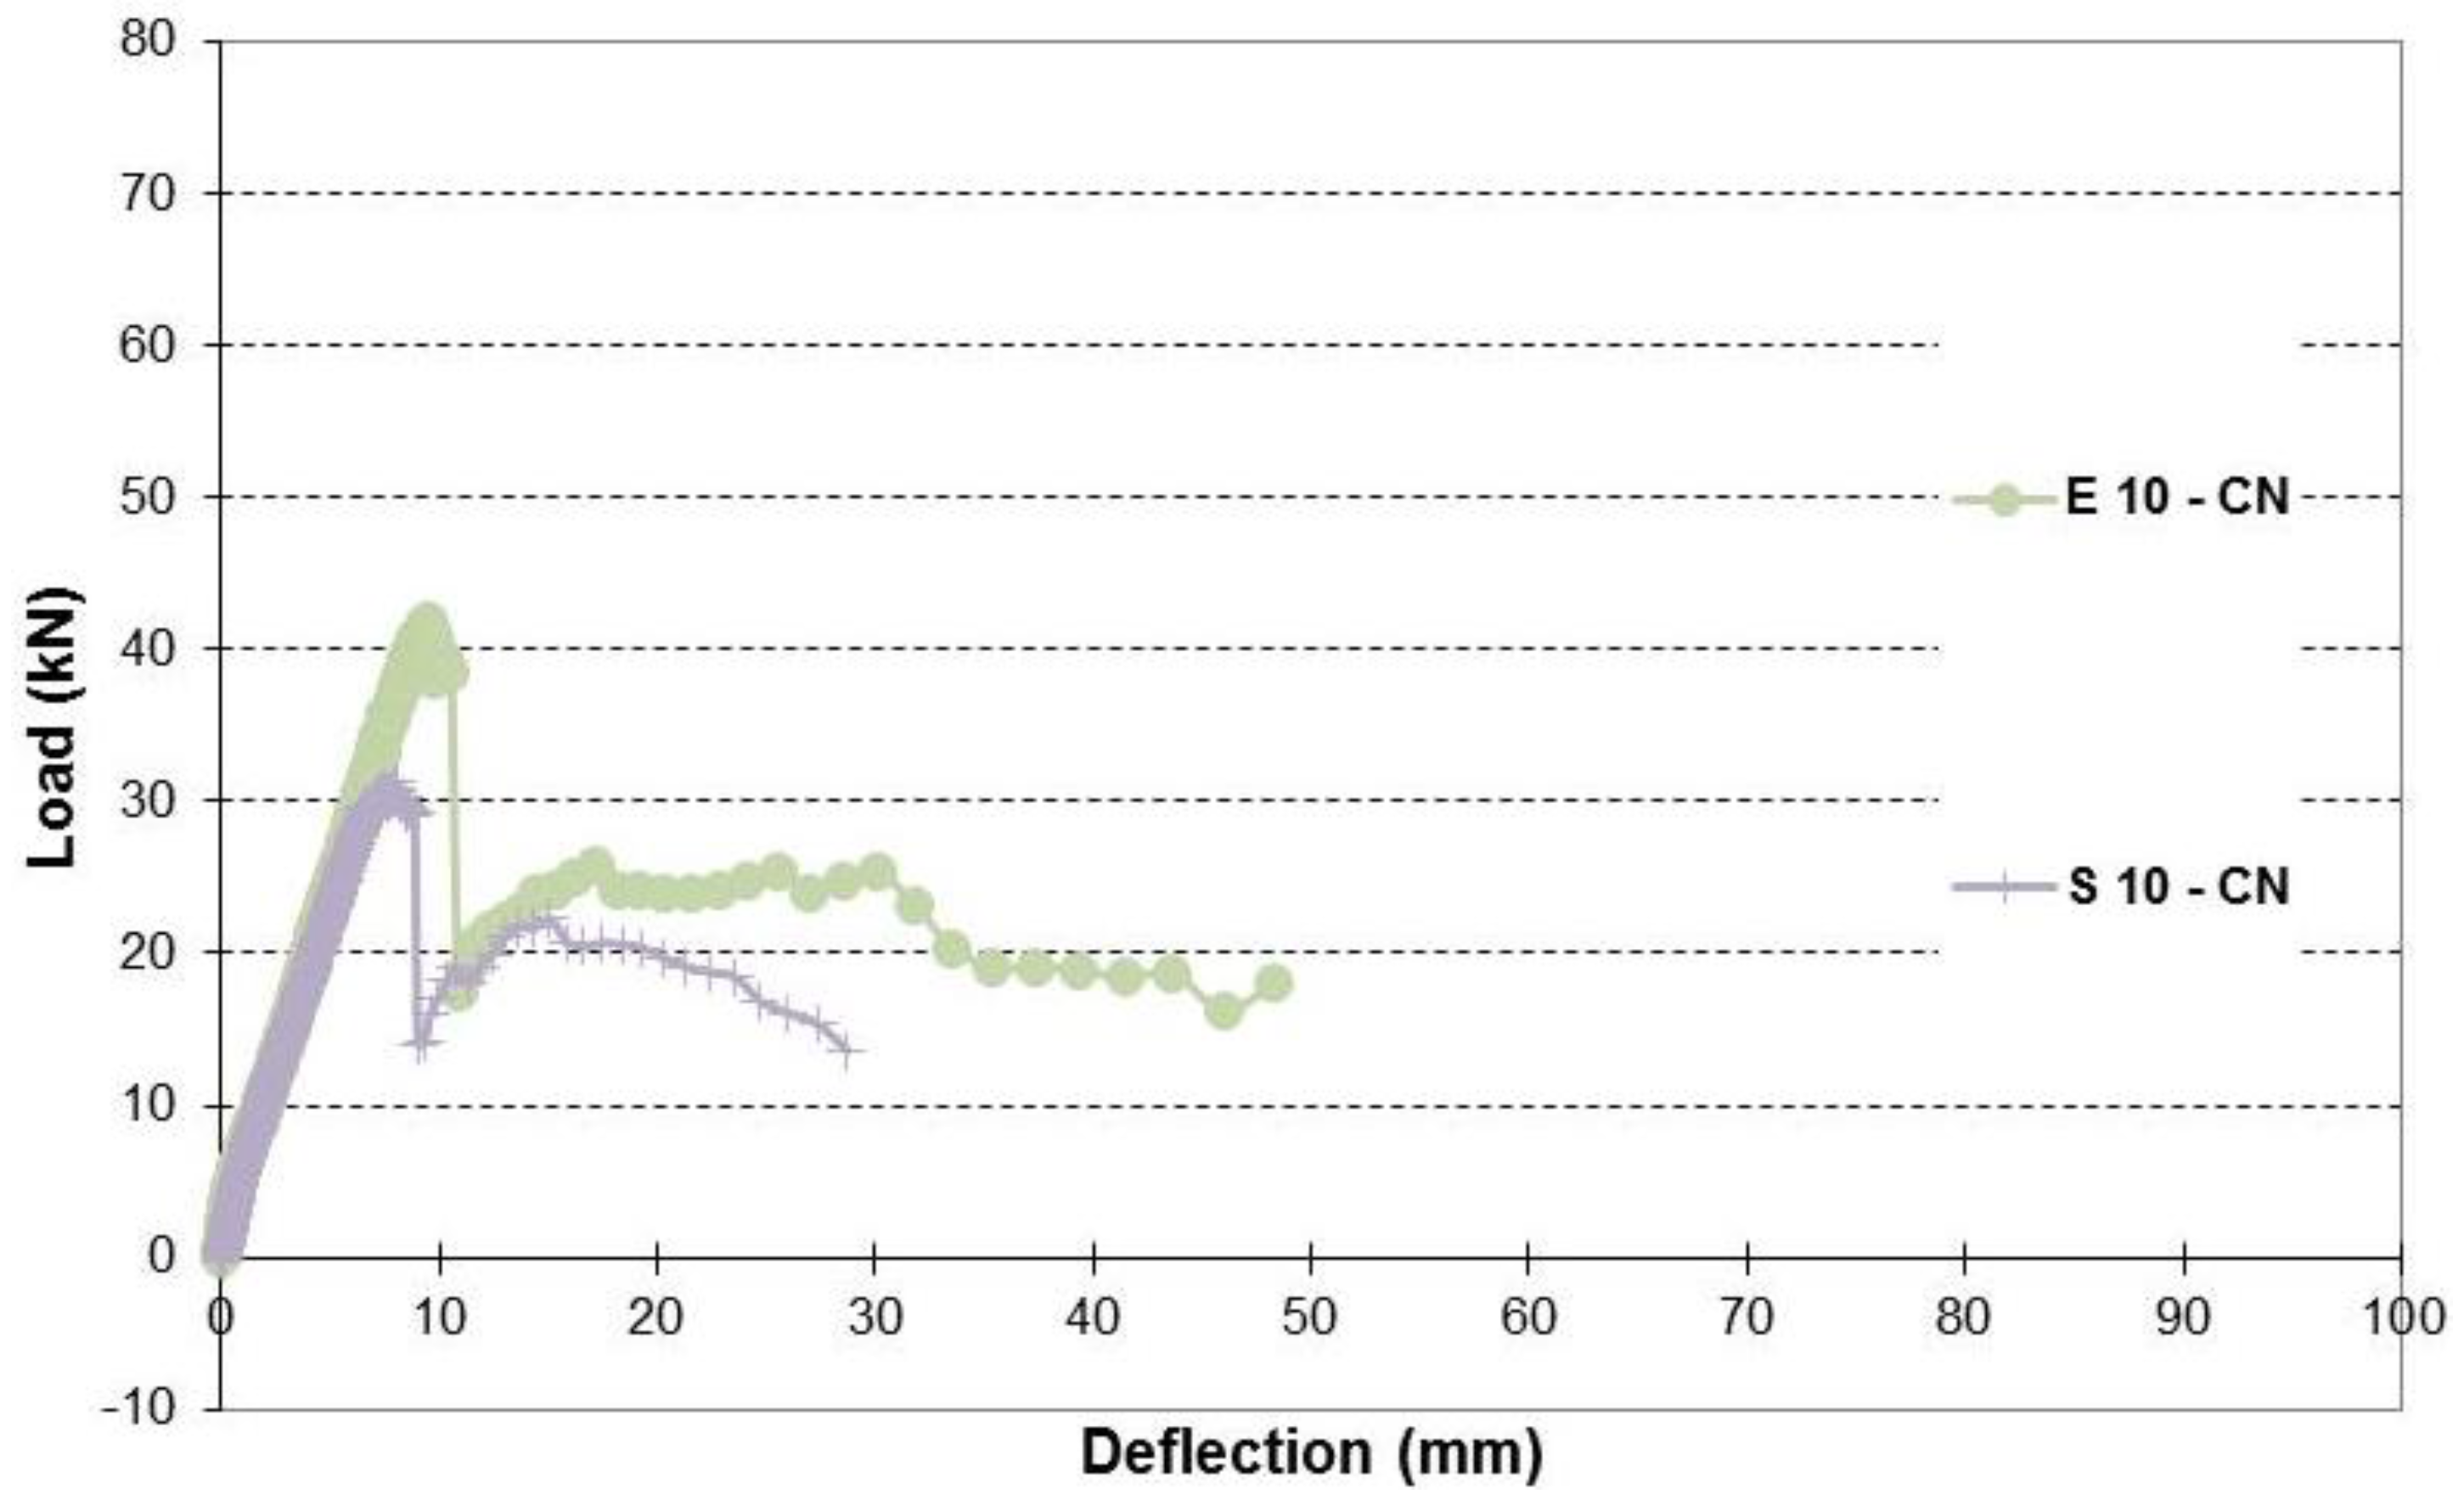
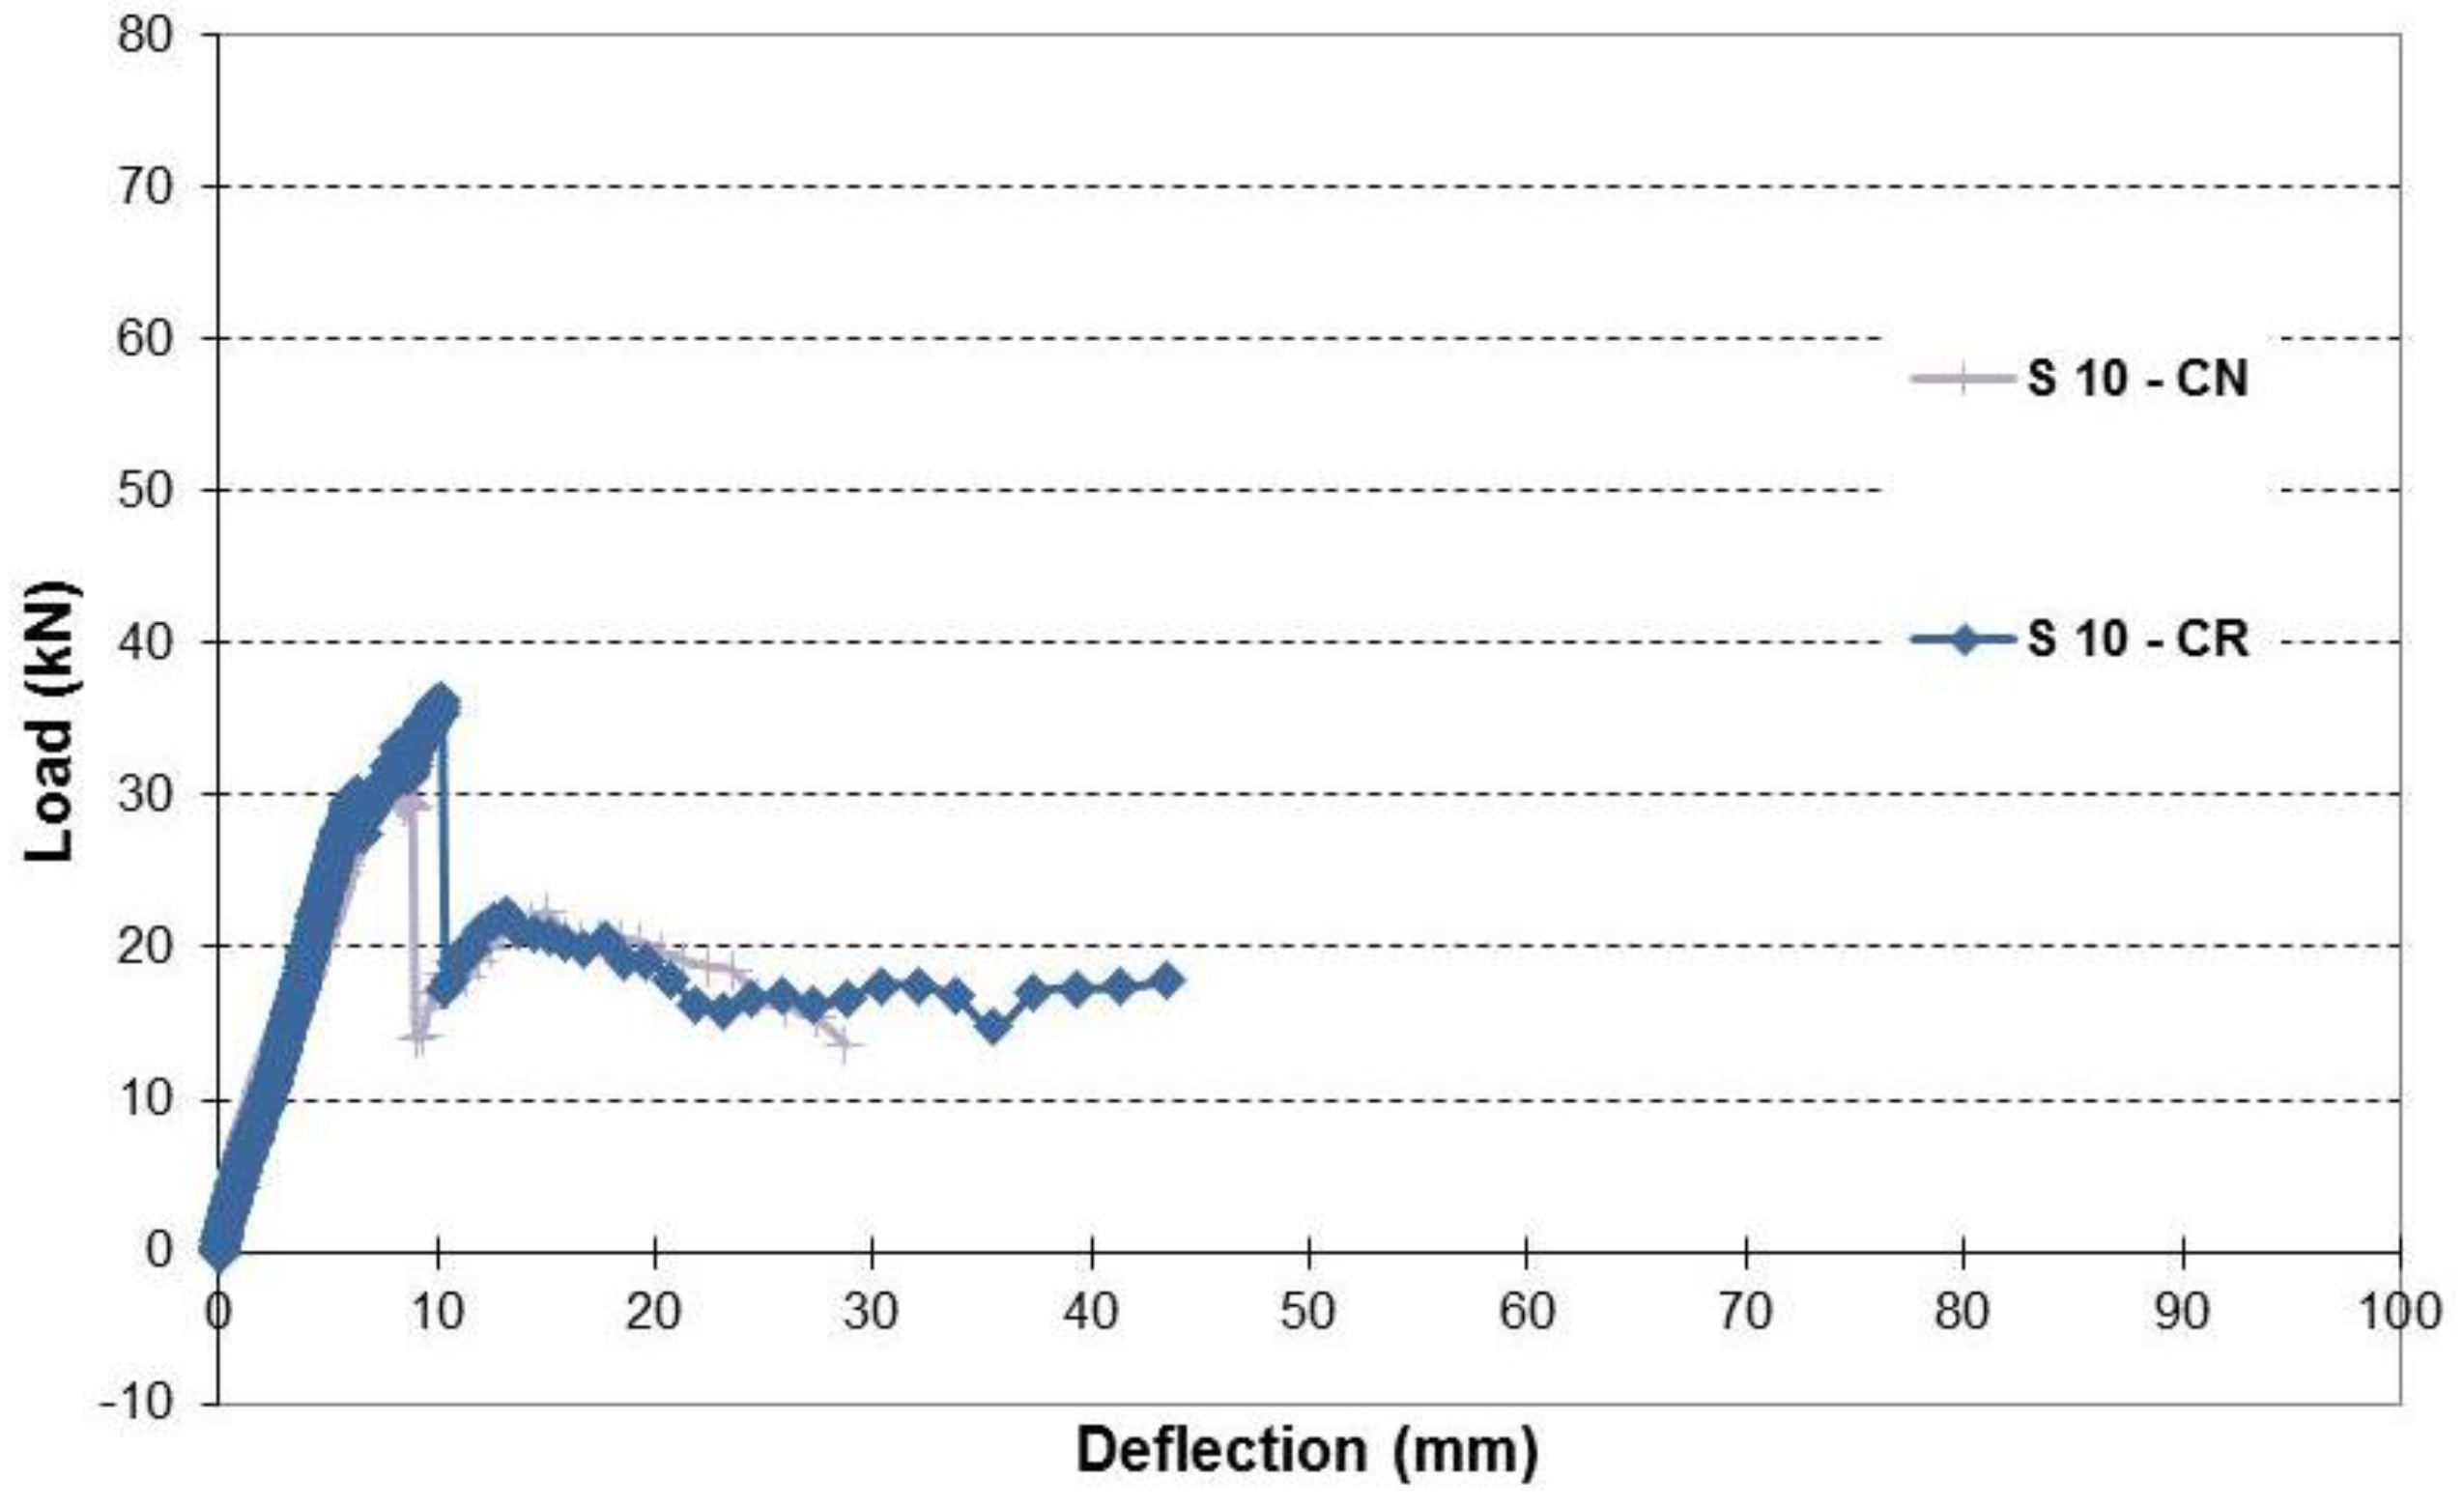
When S 10–CN was repaired, its load capacity and stiffness increased (Figure 9). Load capacity of S 10–CR was greater than that of S 10–CN by about 16%. Strengthening S 20–CN resulted in larger stiffness and higher load capacity (Figure 10). Load capacity of S 20–CR was larger than that of S 20–CN by about 7%. S 20–CR was also more ductile due to yielding and debonding of CFRP. Beam S 32–CR was stiffer and showed a larger capacity than S 32–CN by about 30% (Figure 11). Also, S 32–CR showed better ductility due to yielding and CFRP debonding and rupture. For 50% corrosion level, repair resulted in a stiffer beam and about 18% higher load capacity of S 50–CR than S 50–CN (Figure 12). However, S 50–CN showed more ductility than S 50–CR.
Figure 9. Load-deflection relationship of beams with simulated 10% corrosion level.
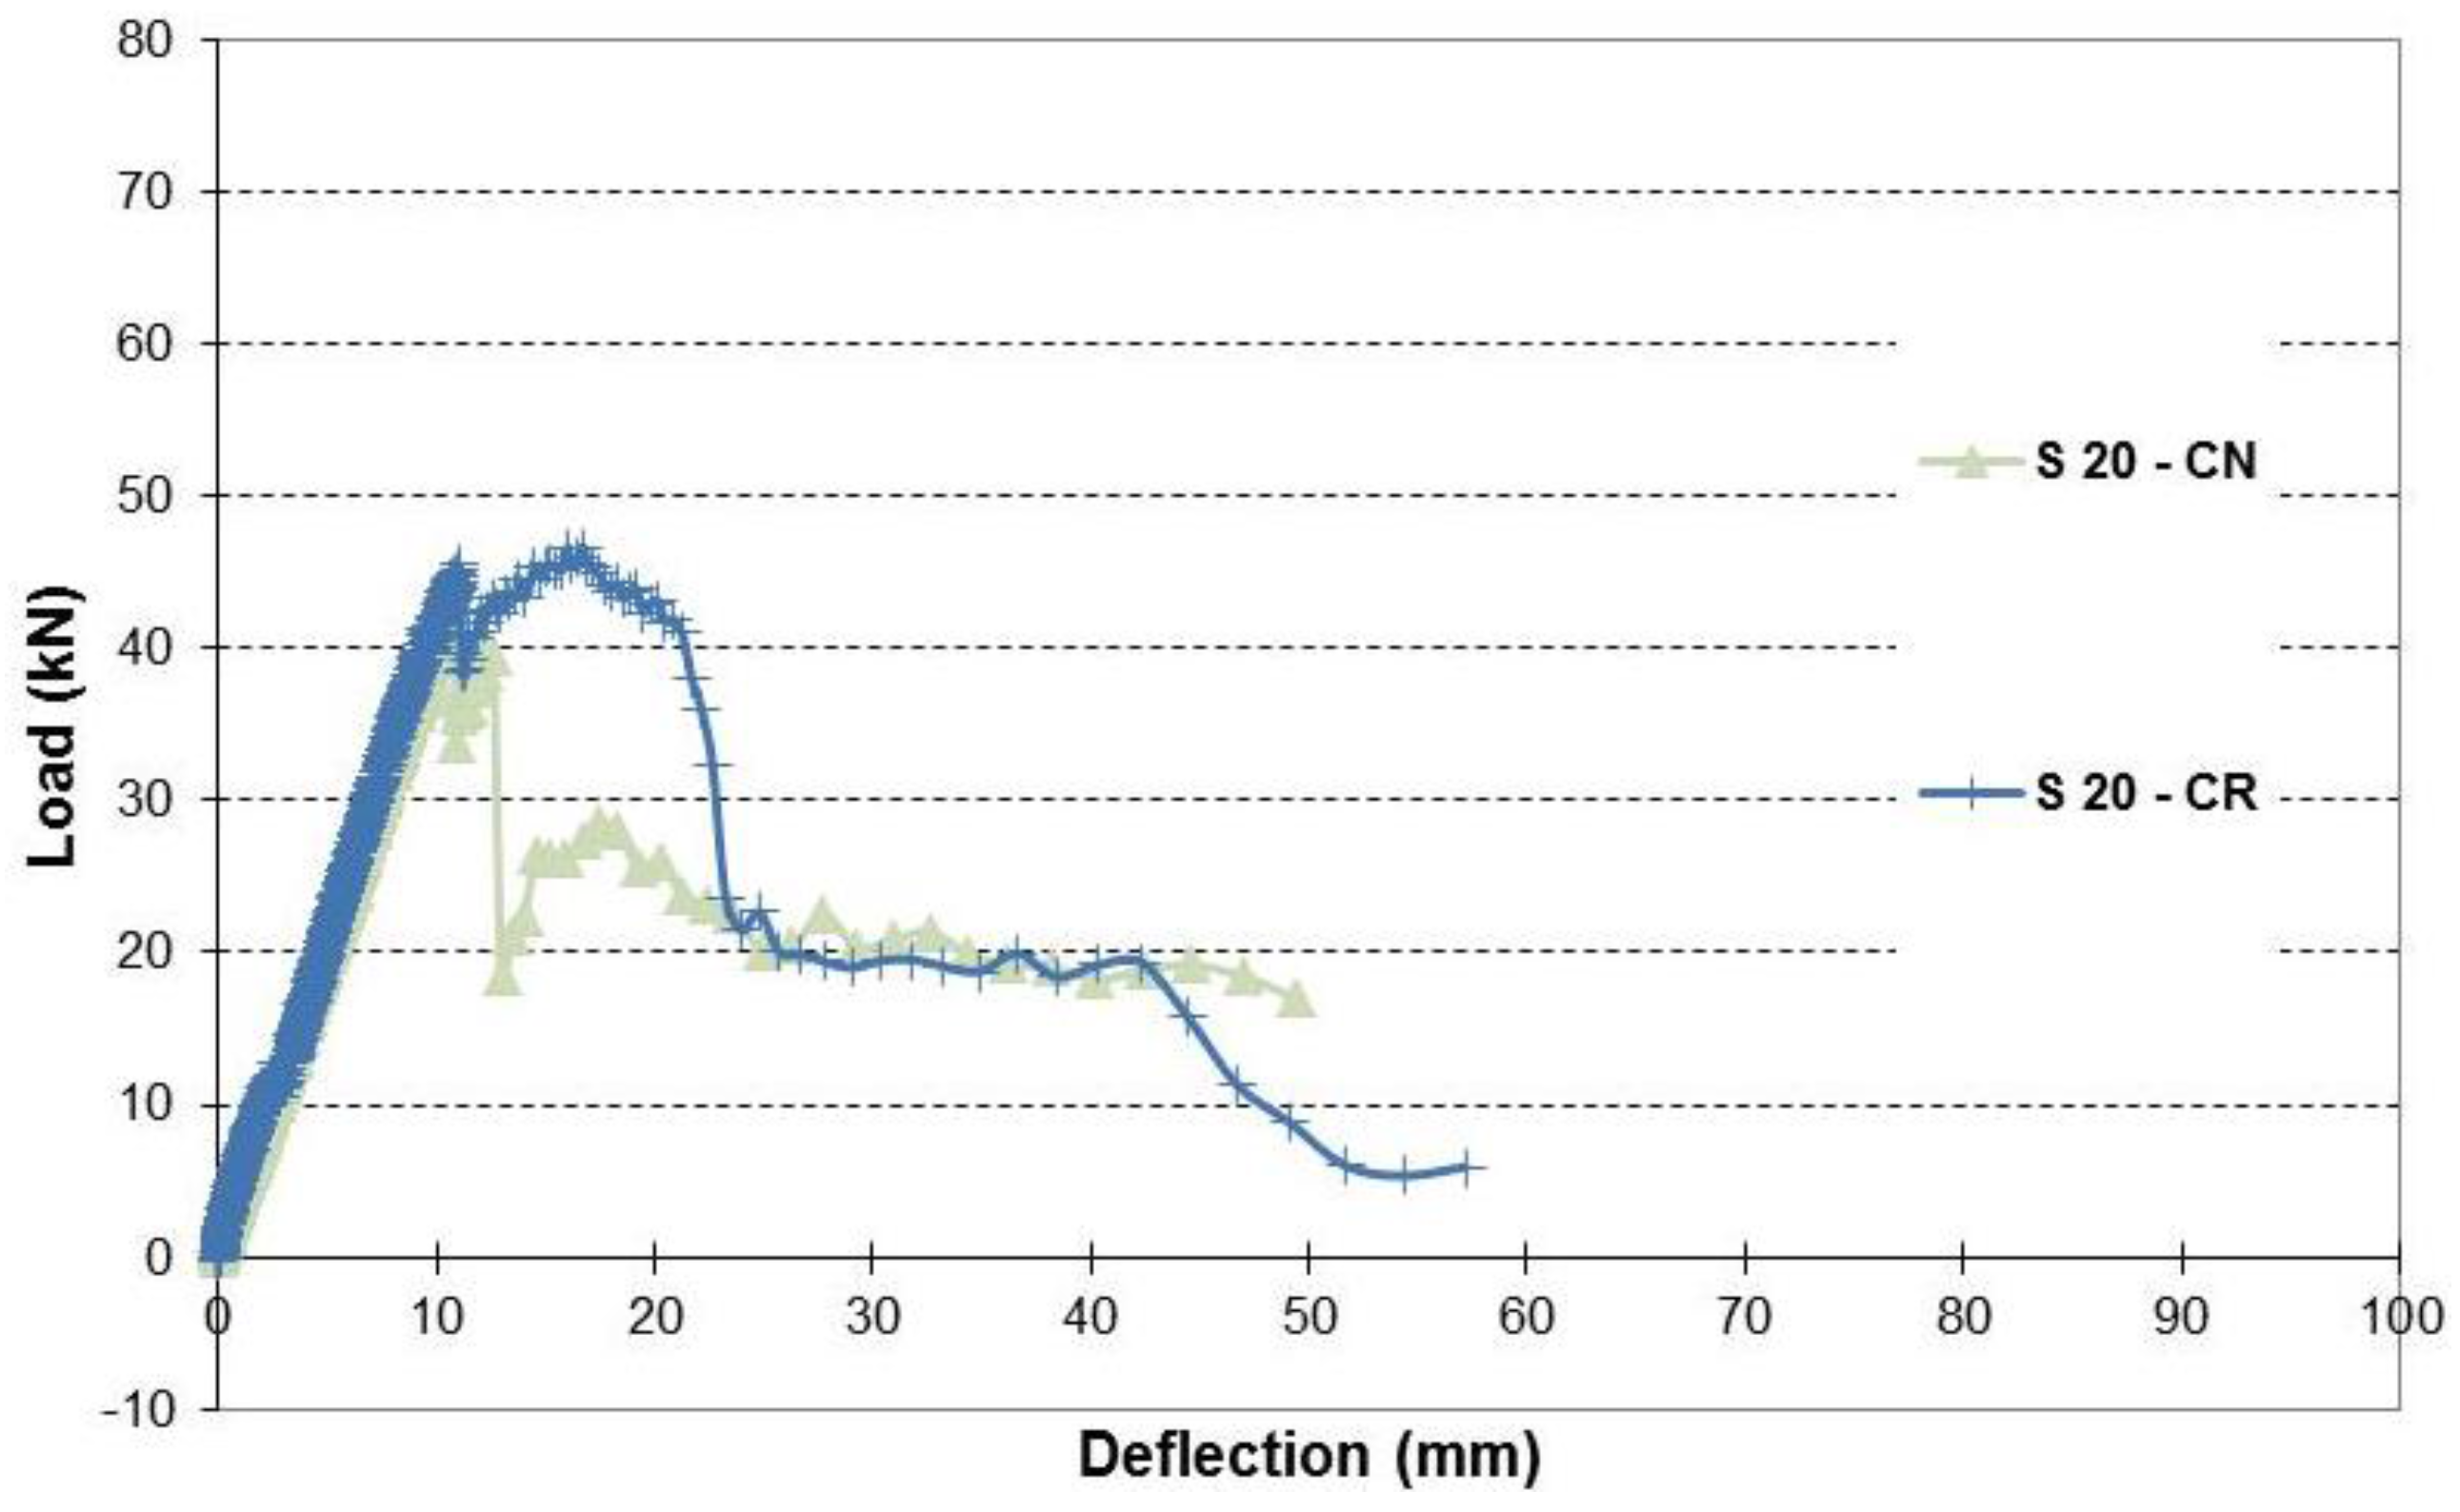
Figure 10. Load-deflection relationship of beams with simulated 20% corrosion level.
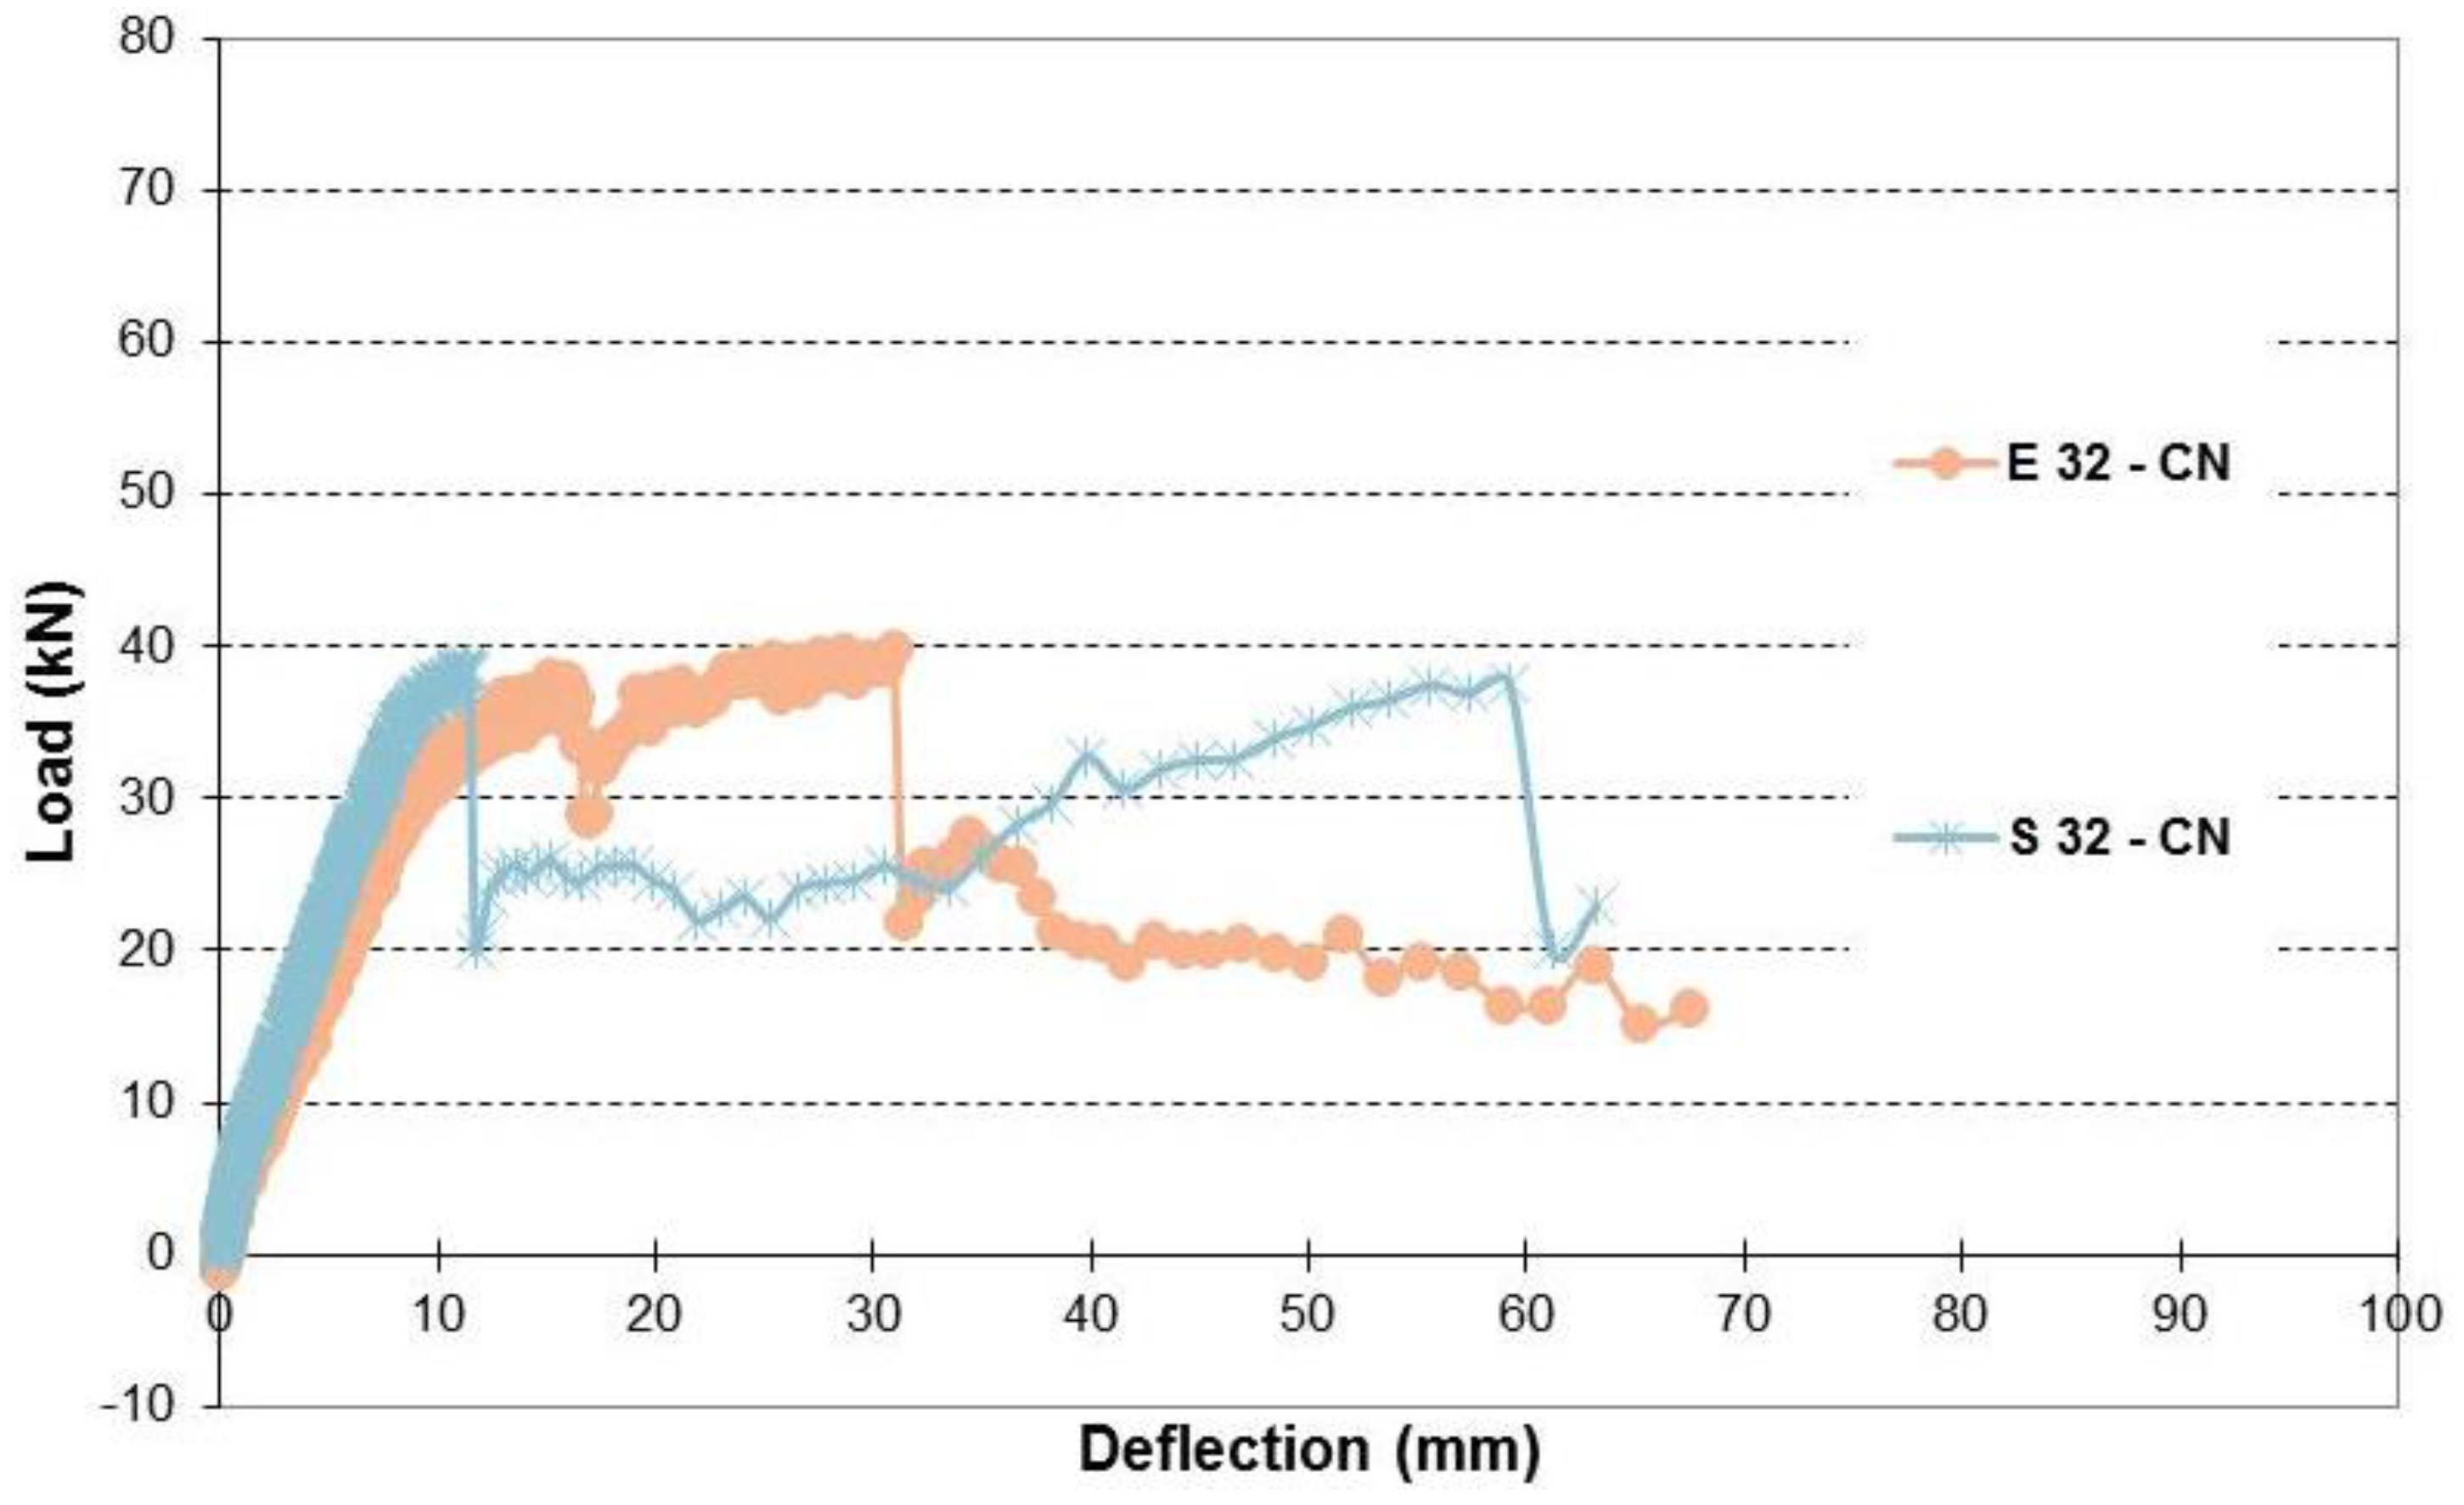
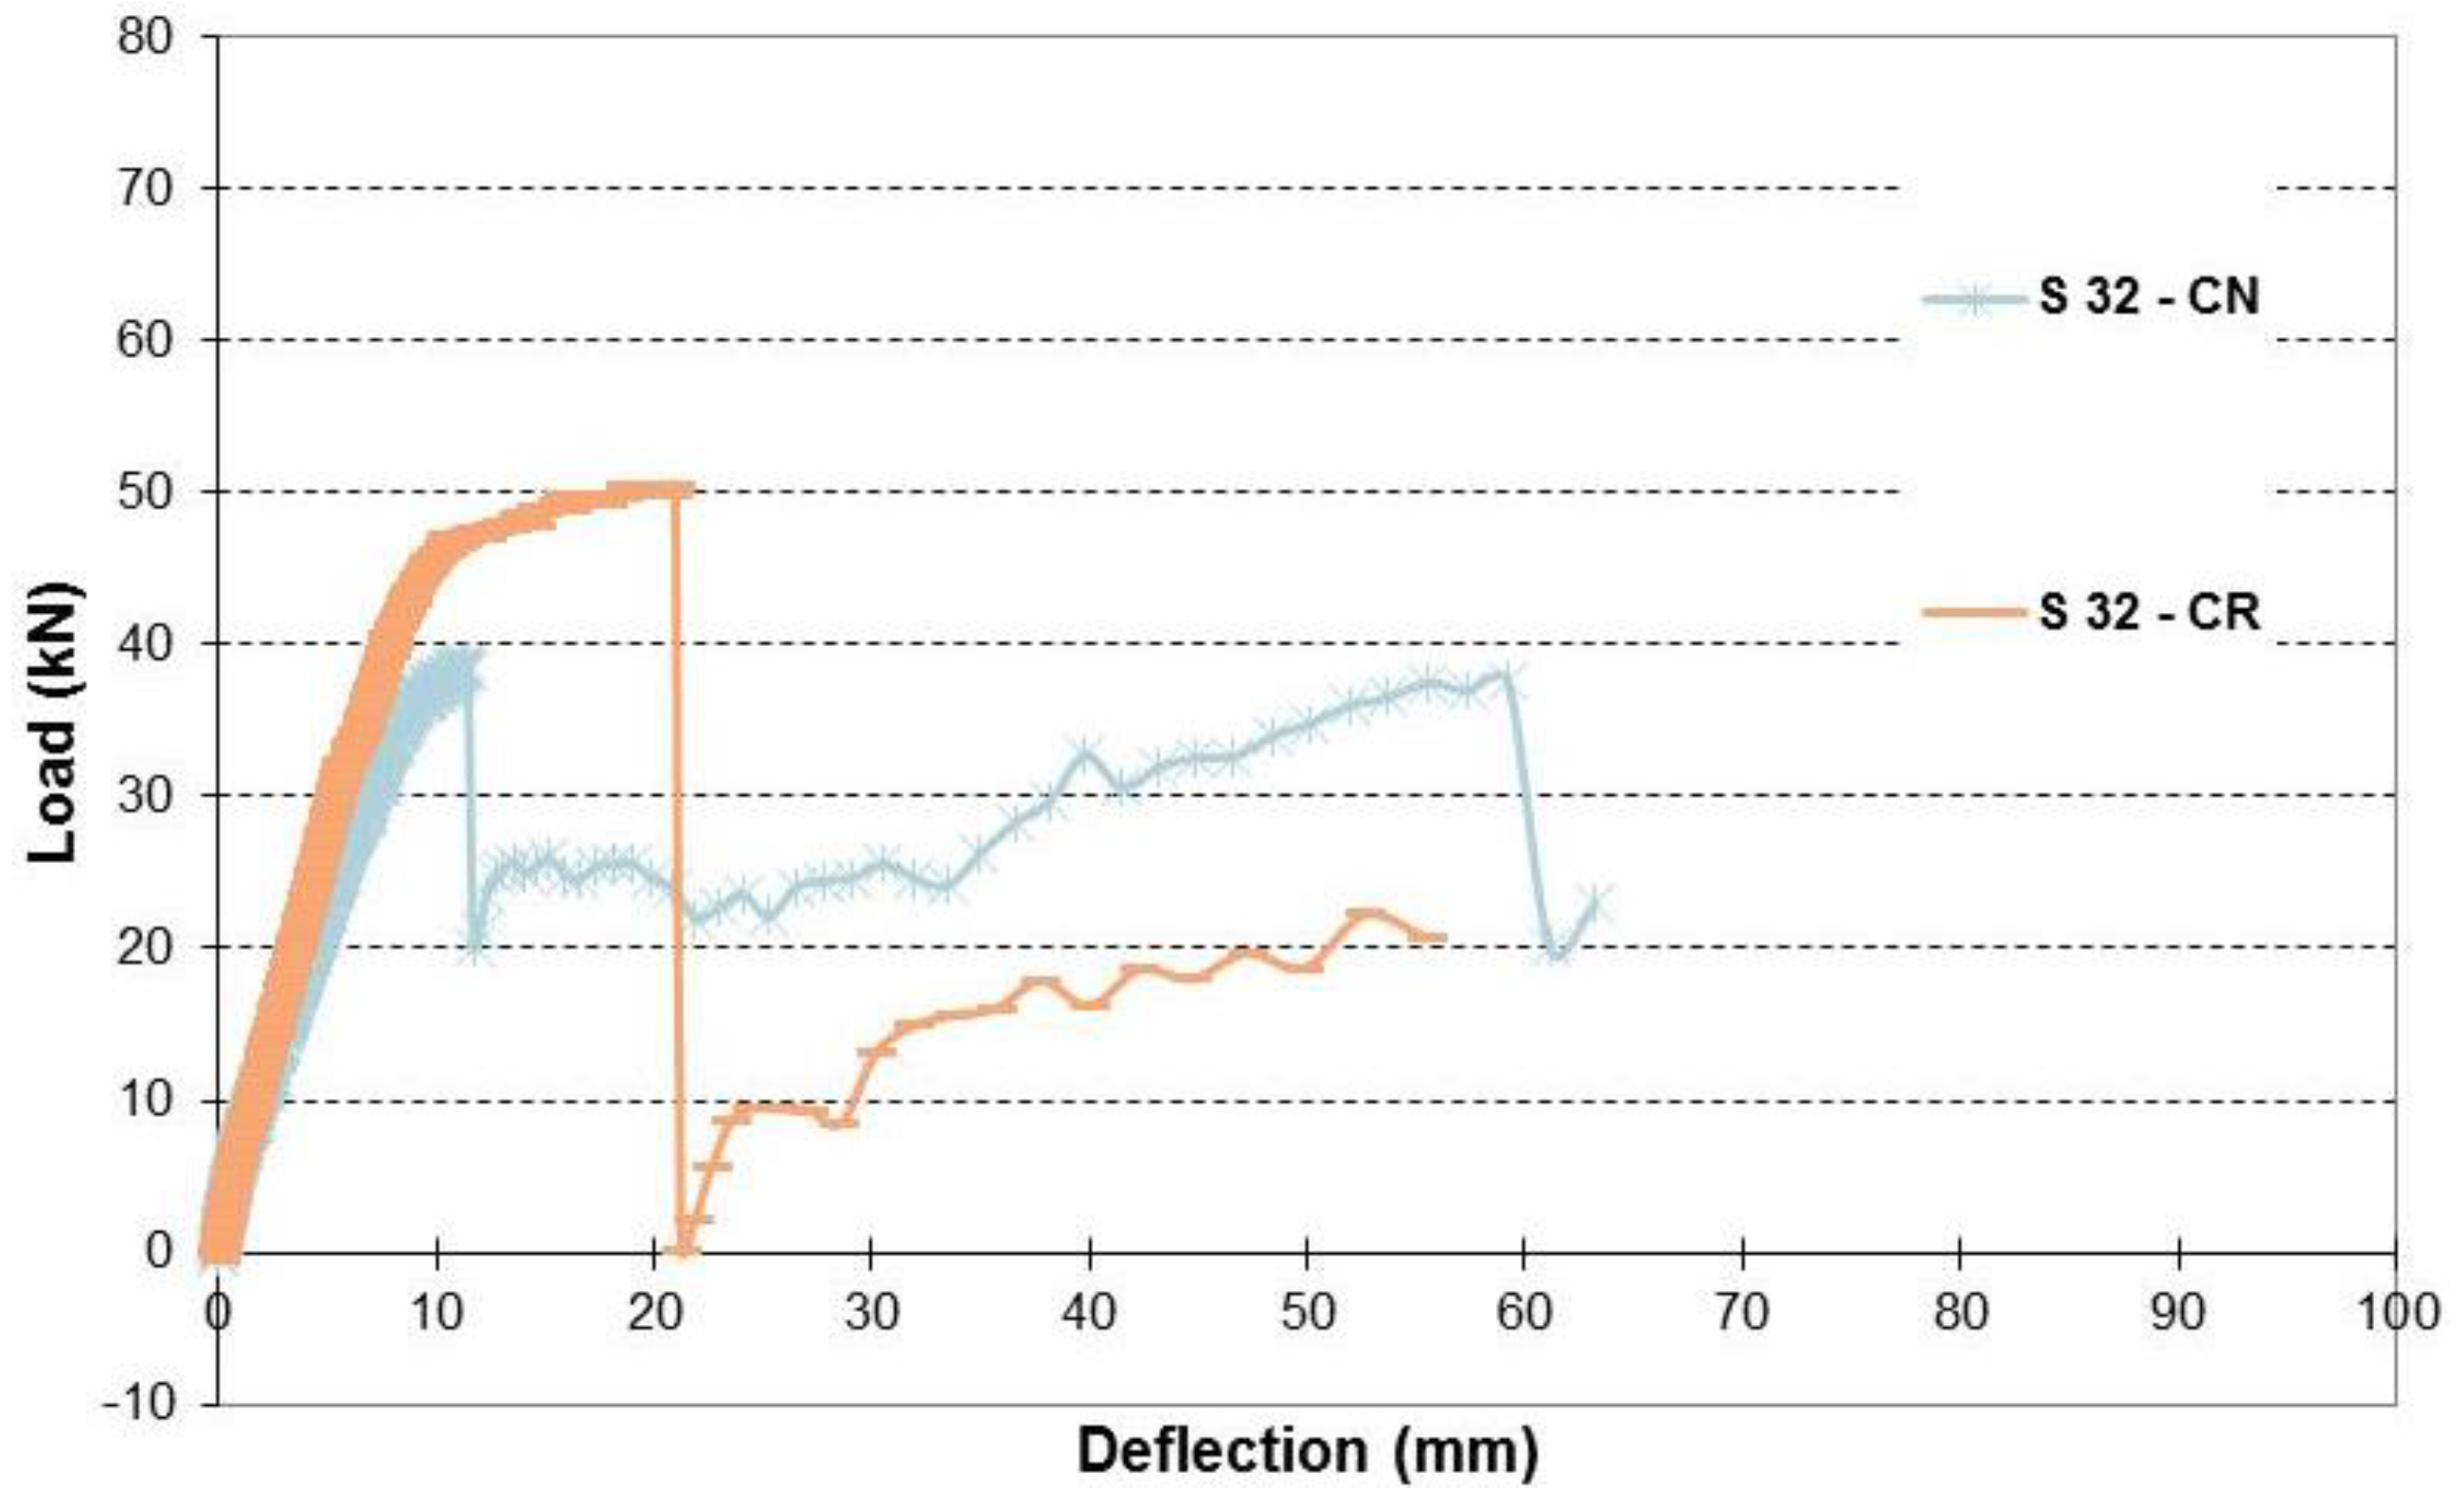
Figure 11. Load-deflection relationship of beams with simulated 32% corrosion level.
Figure 12. Load-deflection relationship of beams with simulated 50% corrosion level.
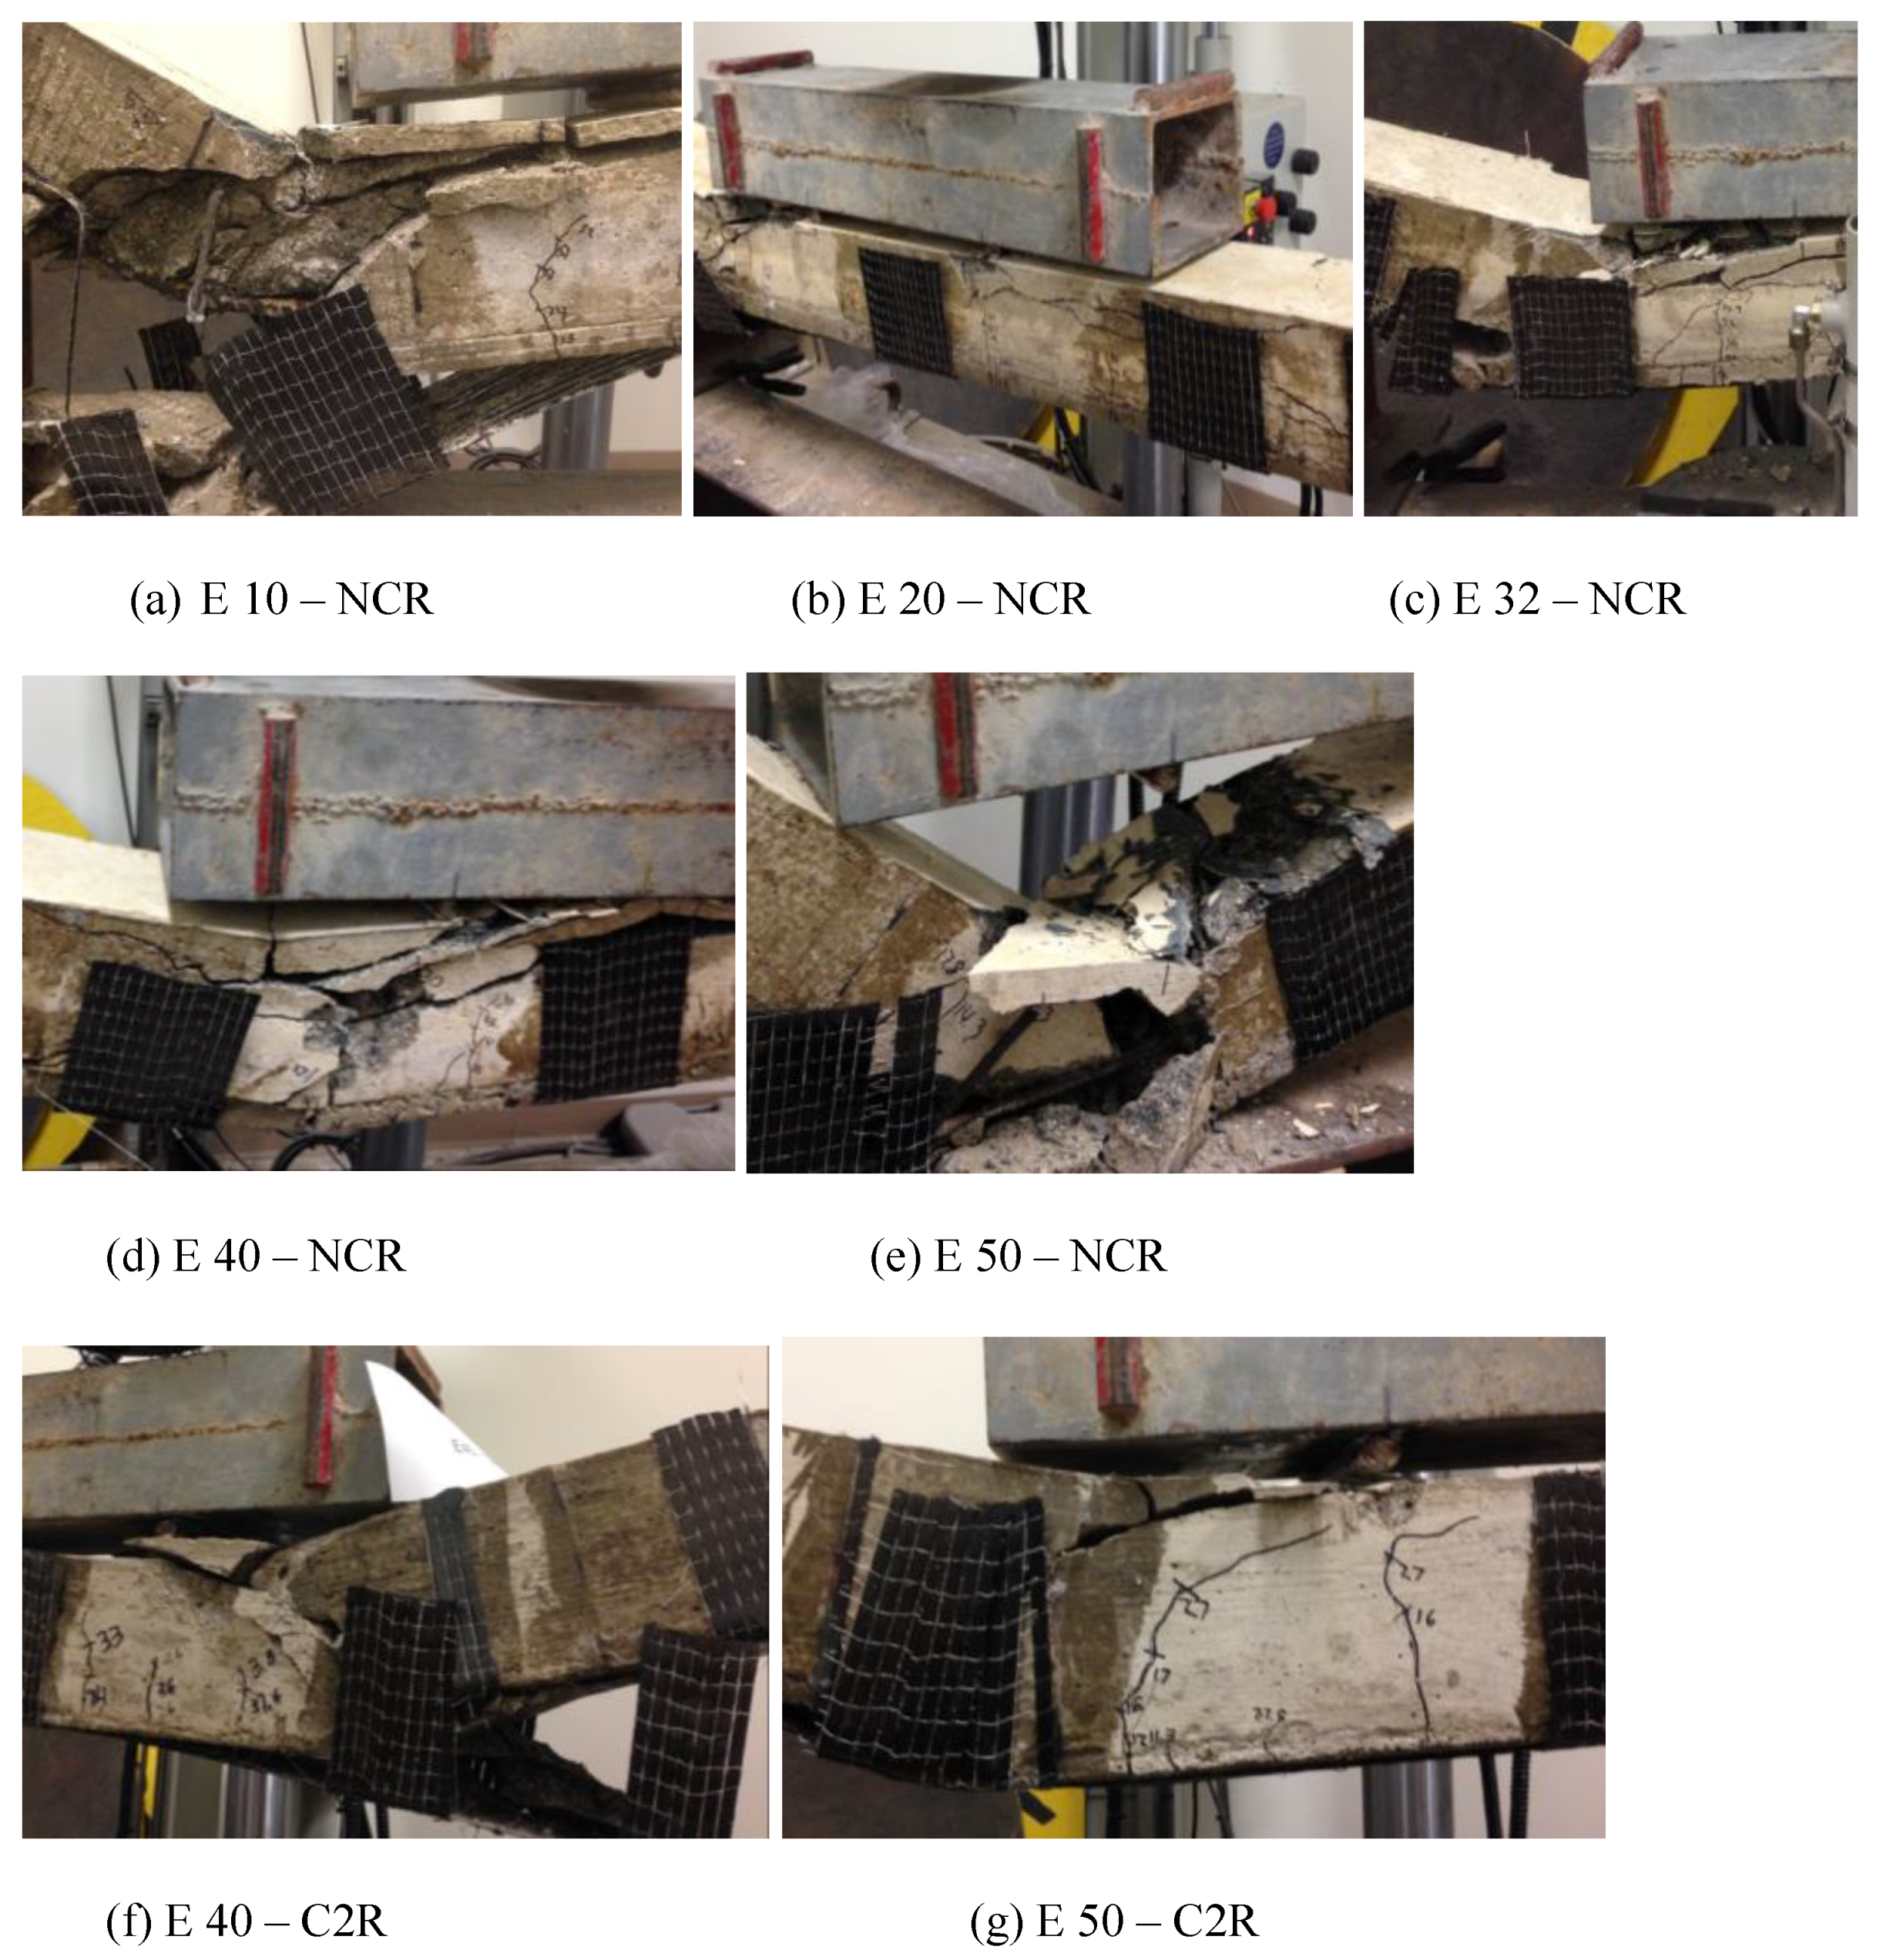
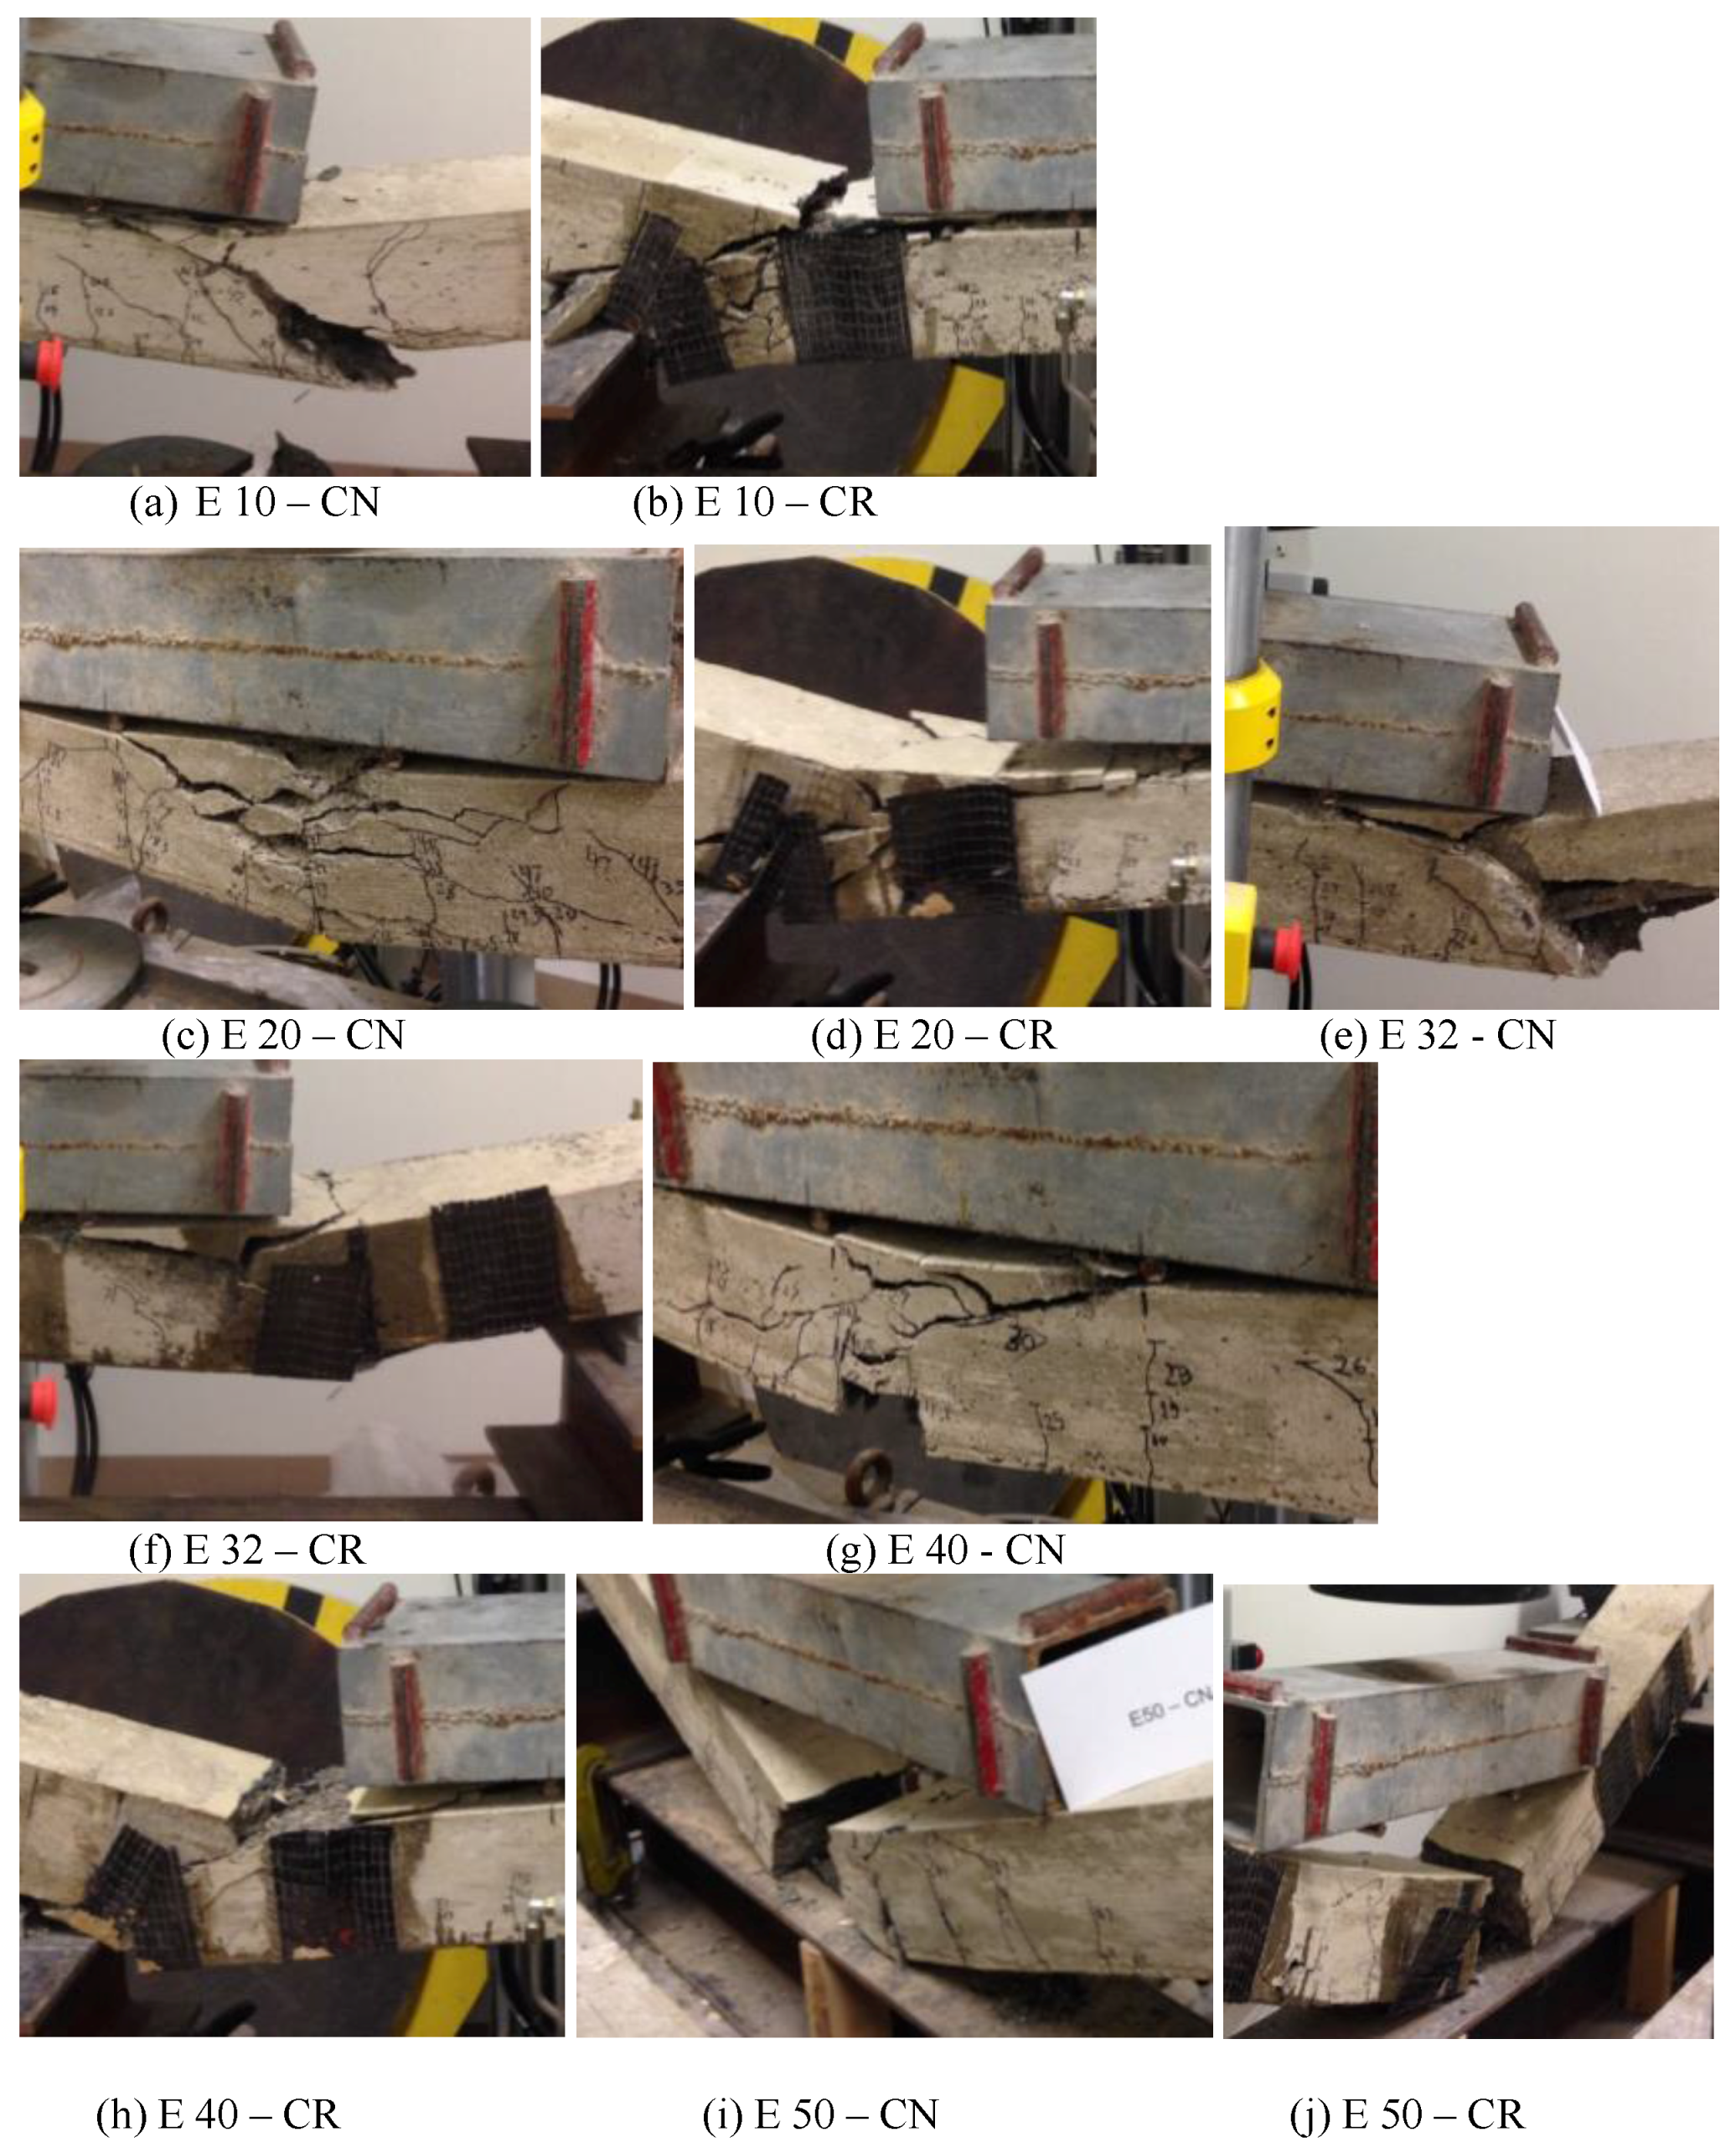
3.2.2. Experimental Corrosion

Figure 13 shows the failure of beams with concrete cover, which is still intact, and with different levels of experimentally induced corrosion. Table 8 describes the mode of failure of these beams.
Figure 13. Failure of beams with experimental corrosion.
Table 8. Failure description of beams with experimental corrosion.
The beams with either experimental or simulated 10% corrosion level showed a different performance from each other (Figure 14). This difference in performance can be attributed to the non-uniform change in the cross-section of rebars due to the actual corrosion, whereas, in the simulated corrosion case, the reduction in cross-section of rebars was uniform over the entire length of rebars. S 10–CN showed about 25% smaller load capacity than that of E 10–CN (Figure 14). This is also due to the diameter schedule of corroded rebars as shown in Table 2. Both beams had a comparable stiffness. For beams with 20% corrosion level, they showed different performance. S 20–CN showed about 14% smaller load capacity than that of E 20–CN, but beam E 20–CN was less stiff and showed more ductility (Figure 15). For beams with 32% corrosion level, they showed different performance. Also, the trend that was observed in 10% and 20% corrosion level cases has changed. E 32–CN and S 32–CN had a very similar load carrying capacity; however, S 32–CN had a slightly higher load capacity and was stiffer than E 32–CN (Figure 16). Also, E 32–CN showed more ductility than S 32–CN. A similar trend as in the 32% corrosion level case was observed in the 50% corrosion level case. S 50–CN showed more ductility than E 50–CN (Figure 17). S 50–CN showed about 50% higher capacity than E 50–CN and was stiffer than E 50–CN. E 50–CN showed more ductility than S 50–CN. It seems that it is conservative to model the corrosion by using the equivalent area of steel (simulated) for up to 20% corrosion level. Beyond 20% corrosion level, it is not conservative to use the equivalent area of steel to model the corrosion. However, the simulated cases over-predict the load capacity and stiffness of the actual corroded RC at relatively high levels of corrosion.
Figure 14. Load-deflection of beams with 10% corrosion levels (No repair).
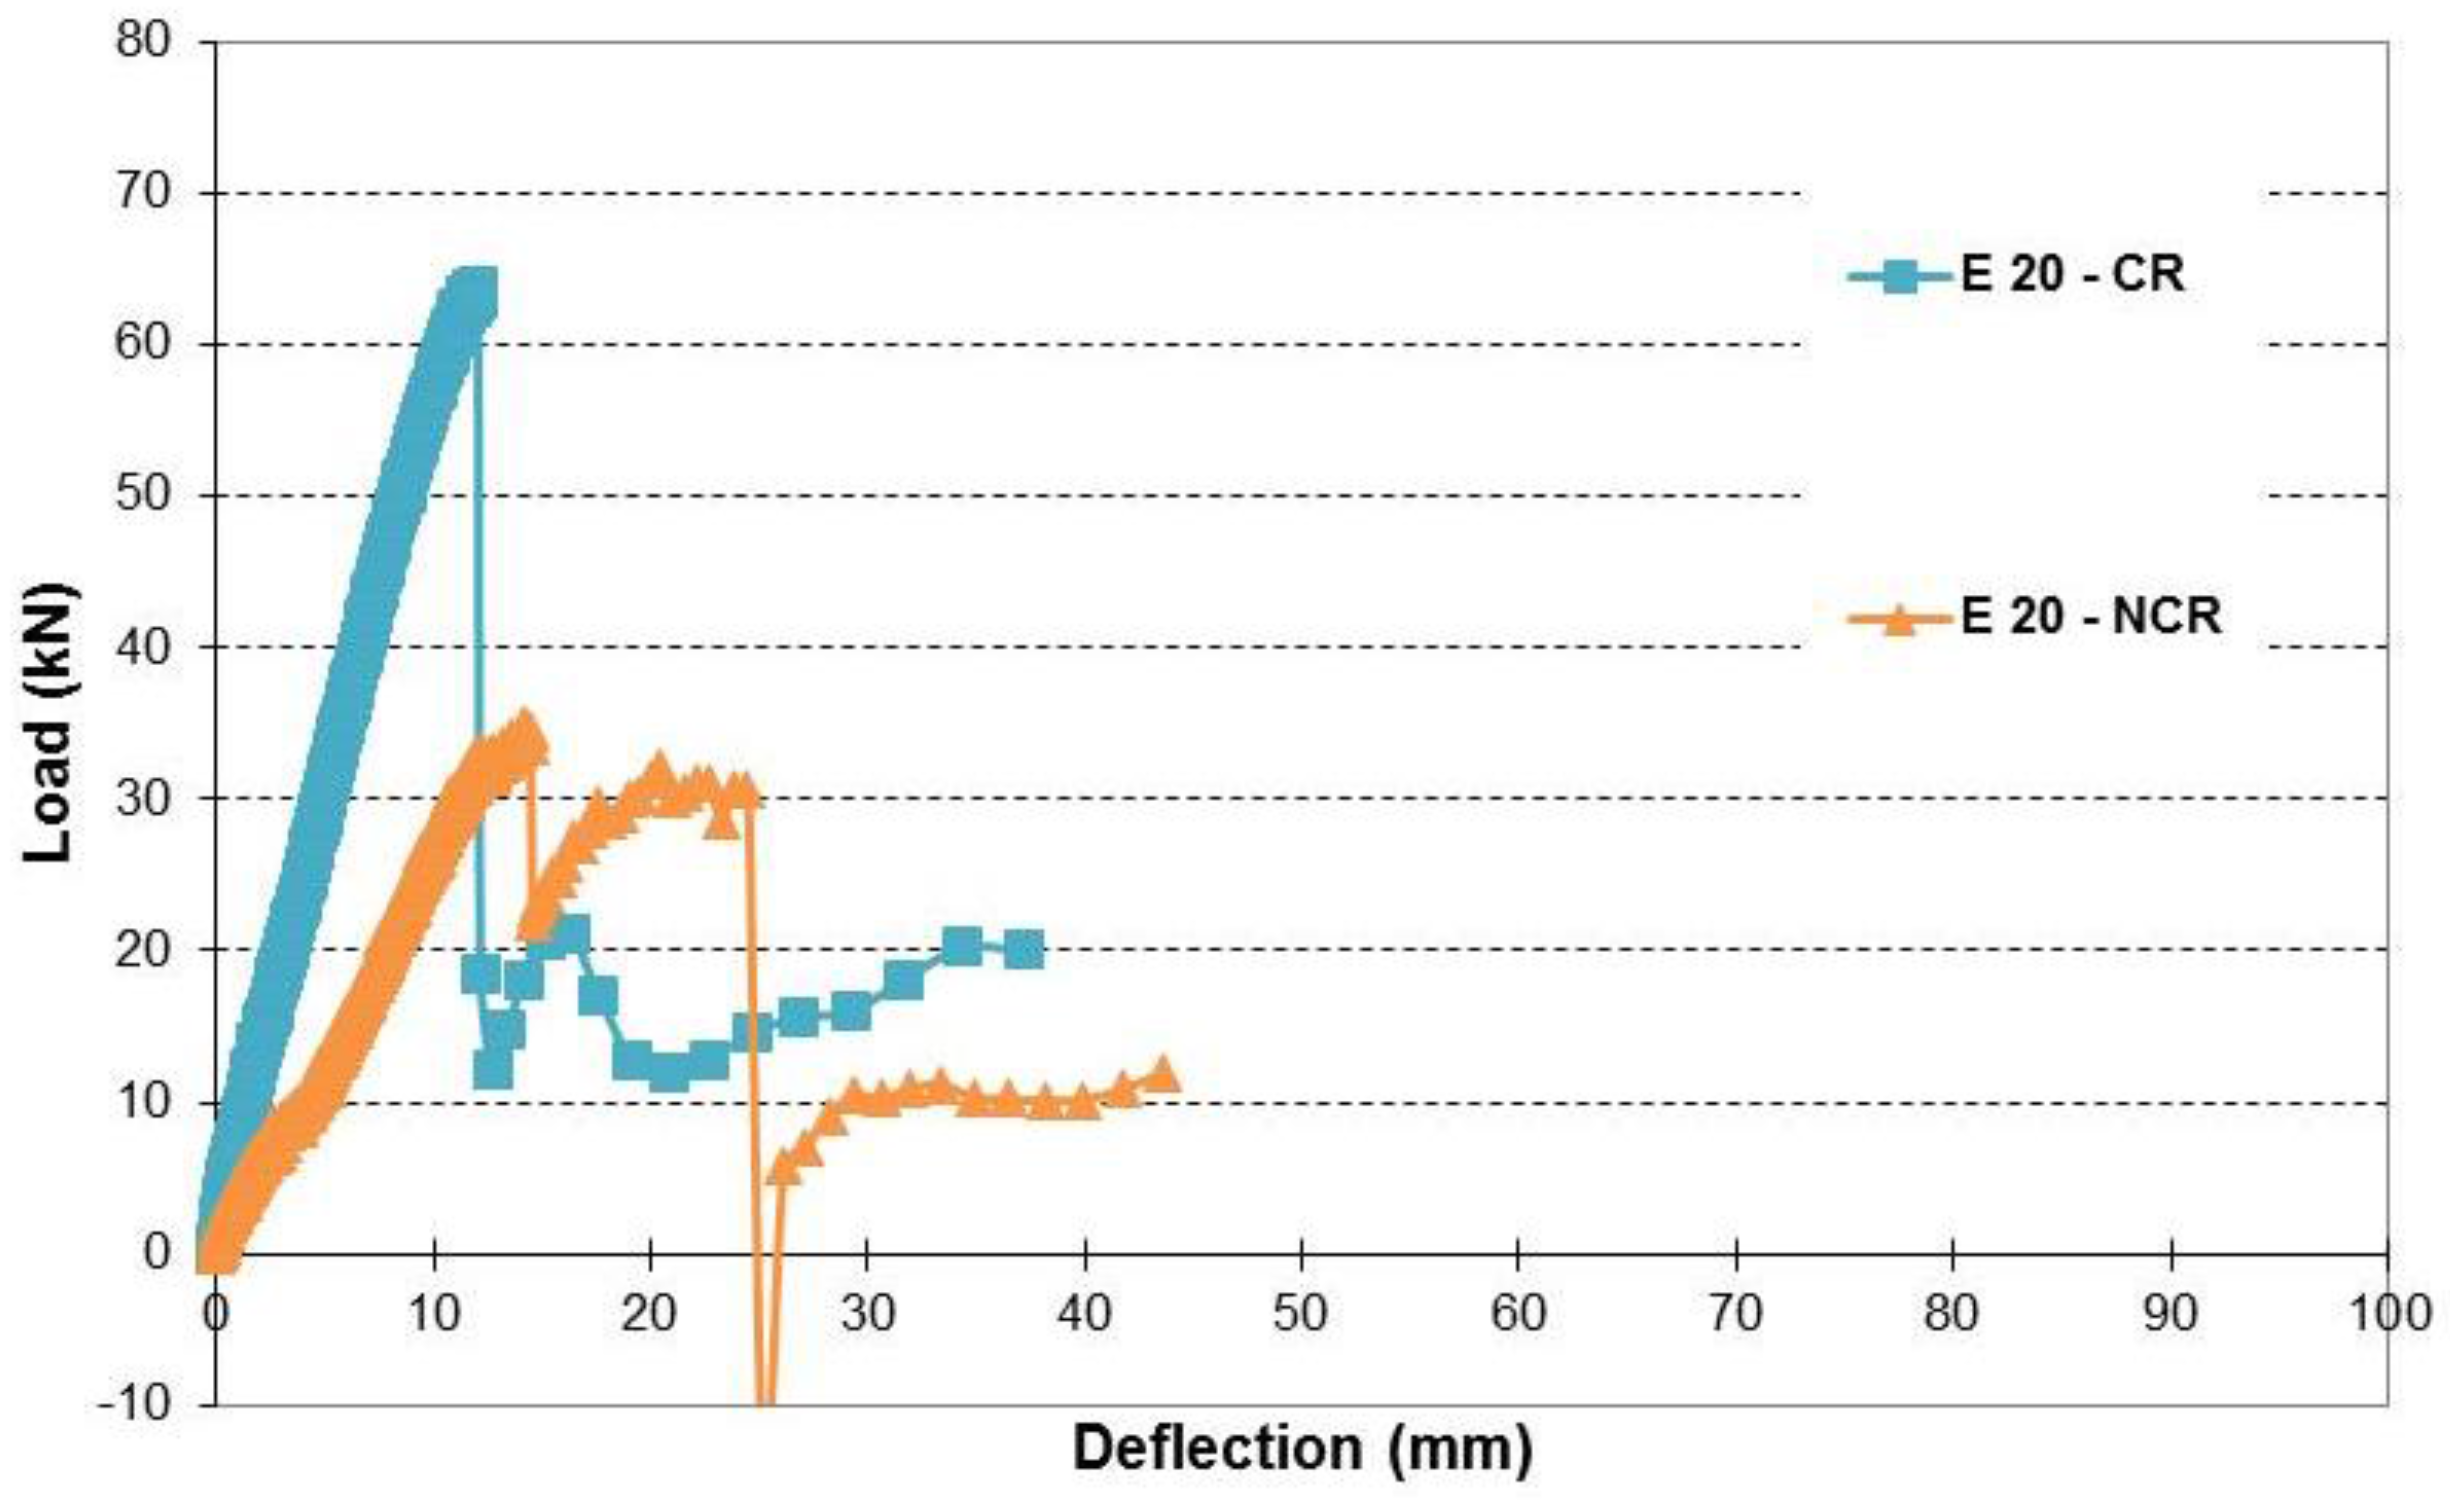
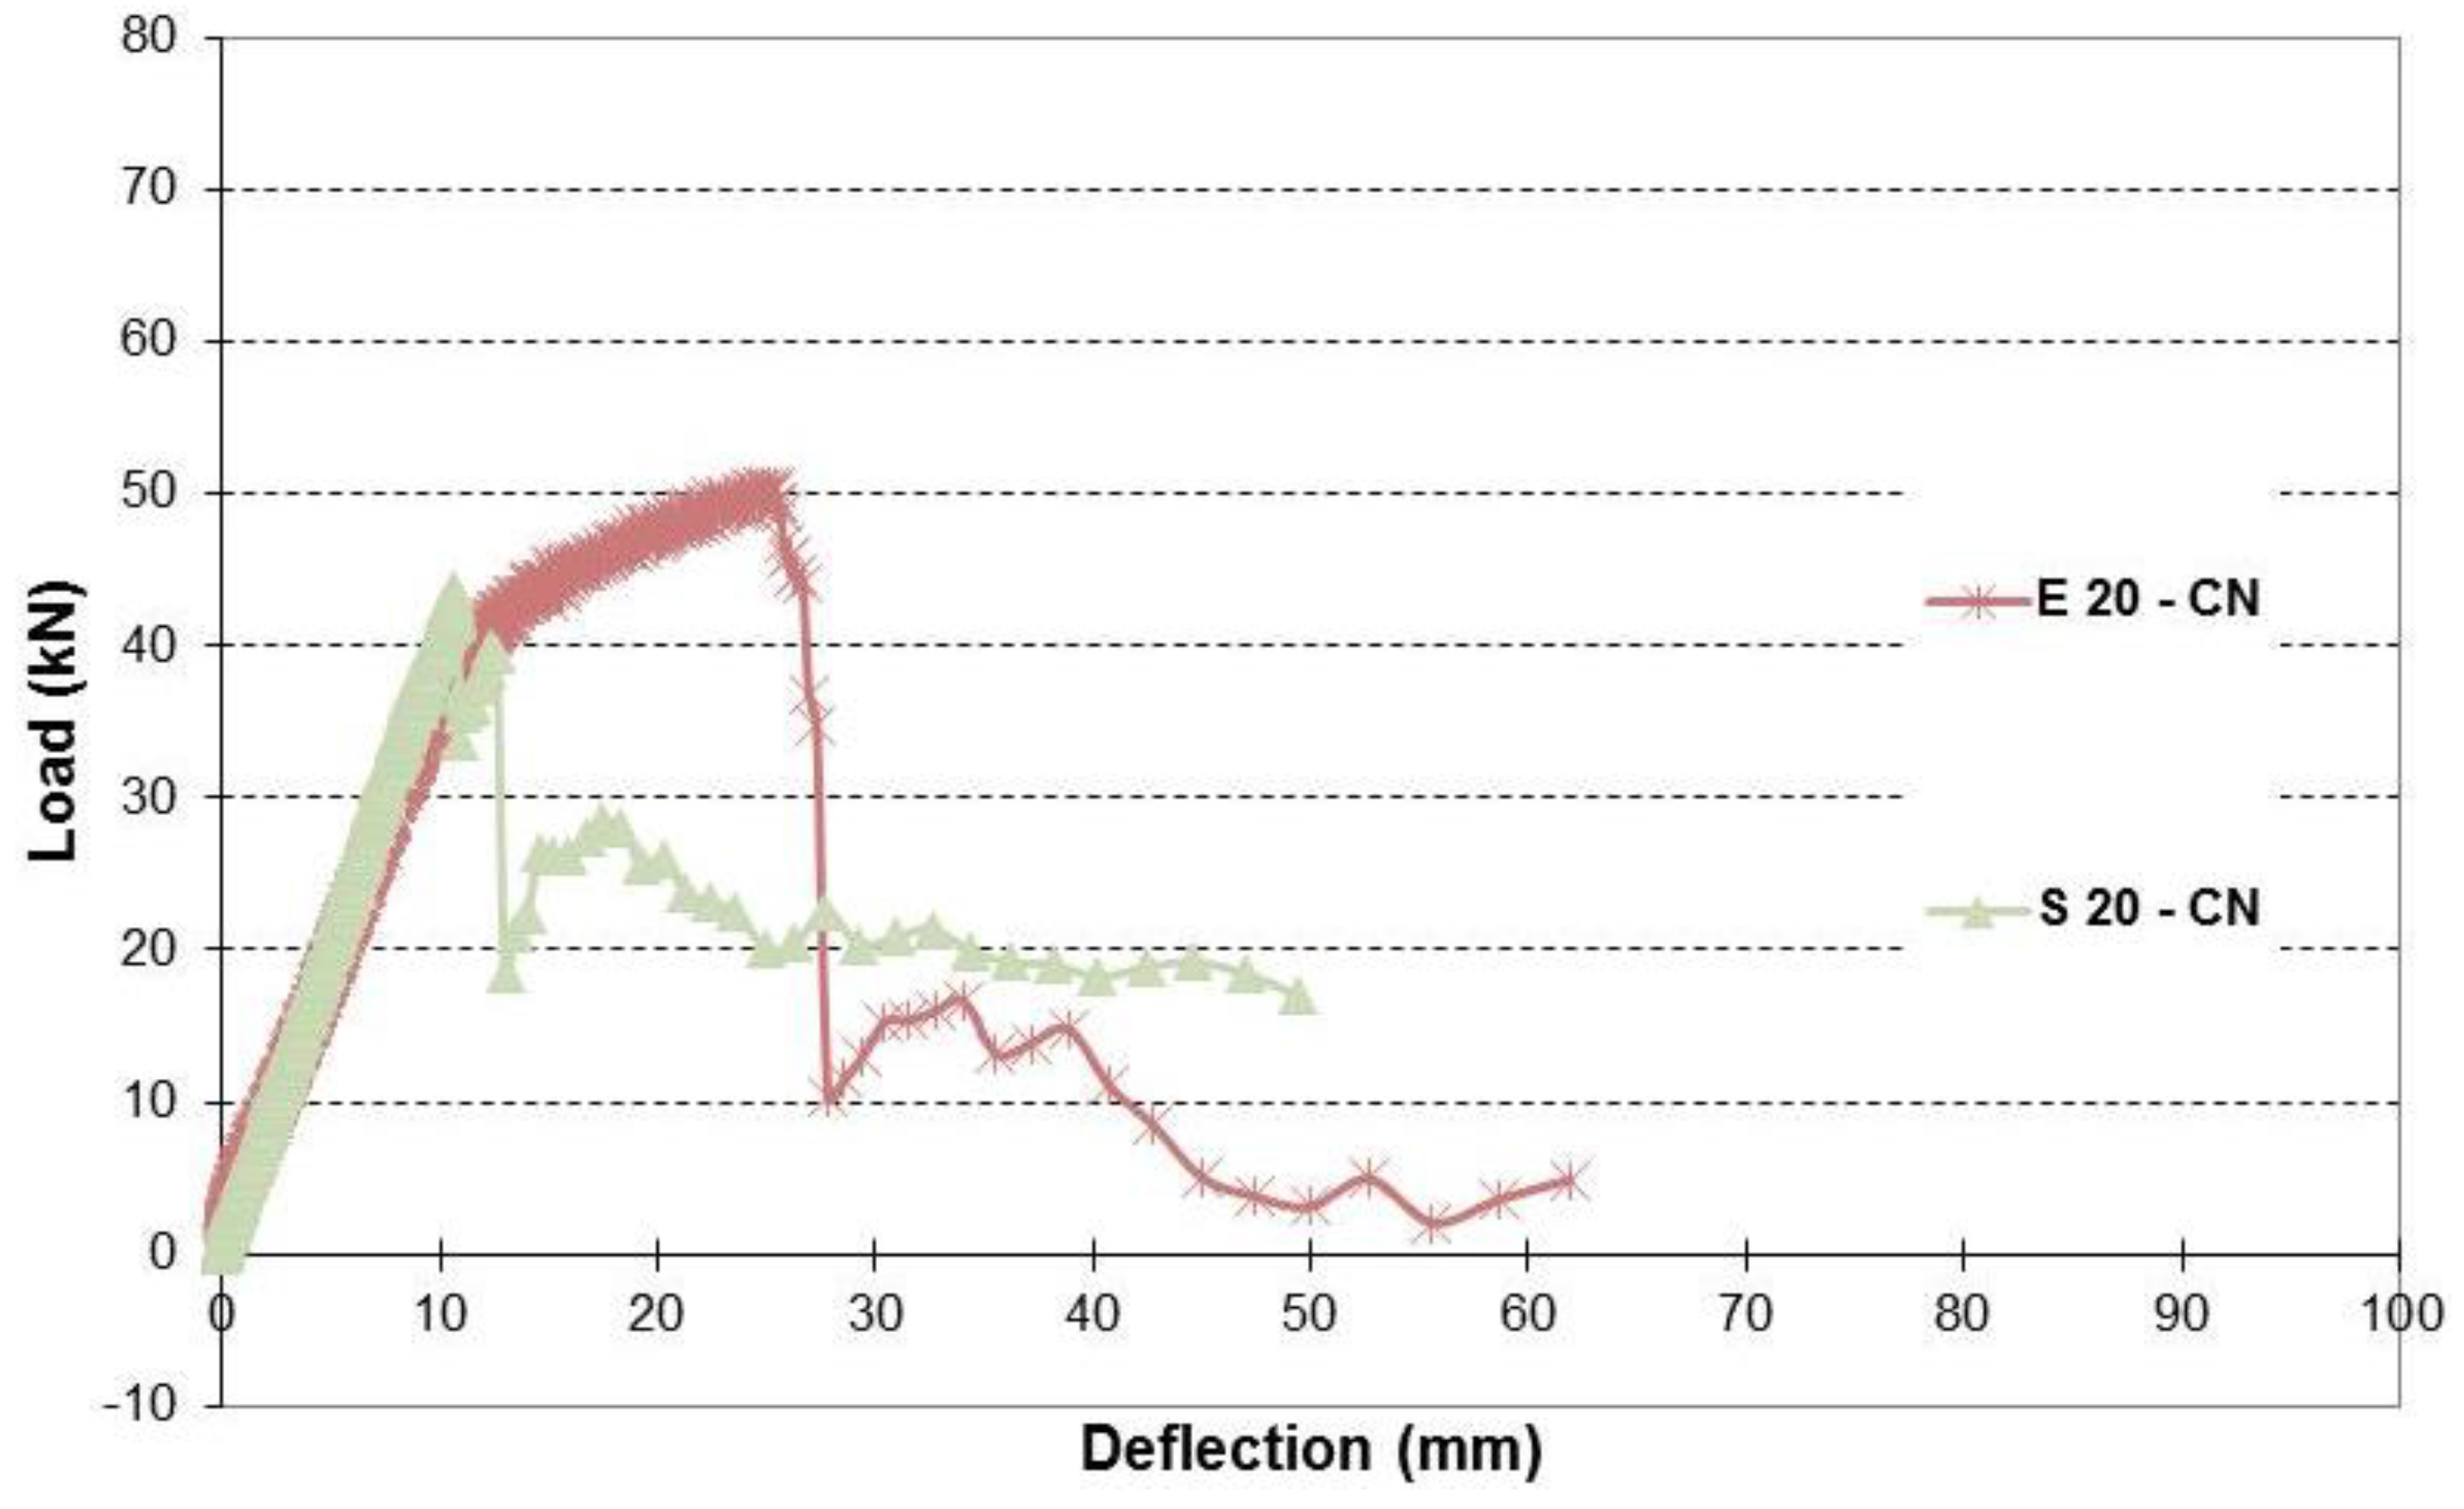
Figure 15. Load-deflection of beams with 20% corrosion levels (No repair).
Figure 16. Load-deflection of beams with 32% corrosion levels (No repair).
Figure 17. Load-deflection of beams with 50% corrosion levels (No repair).
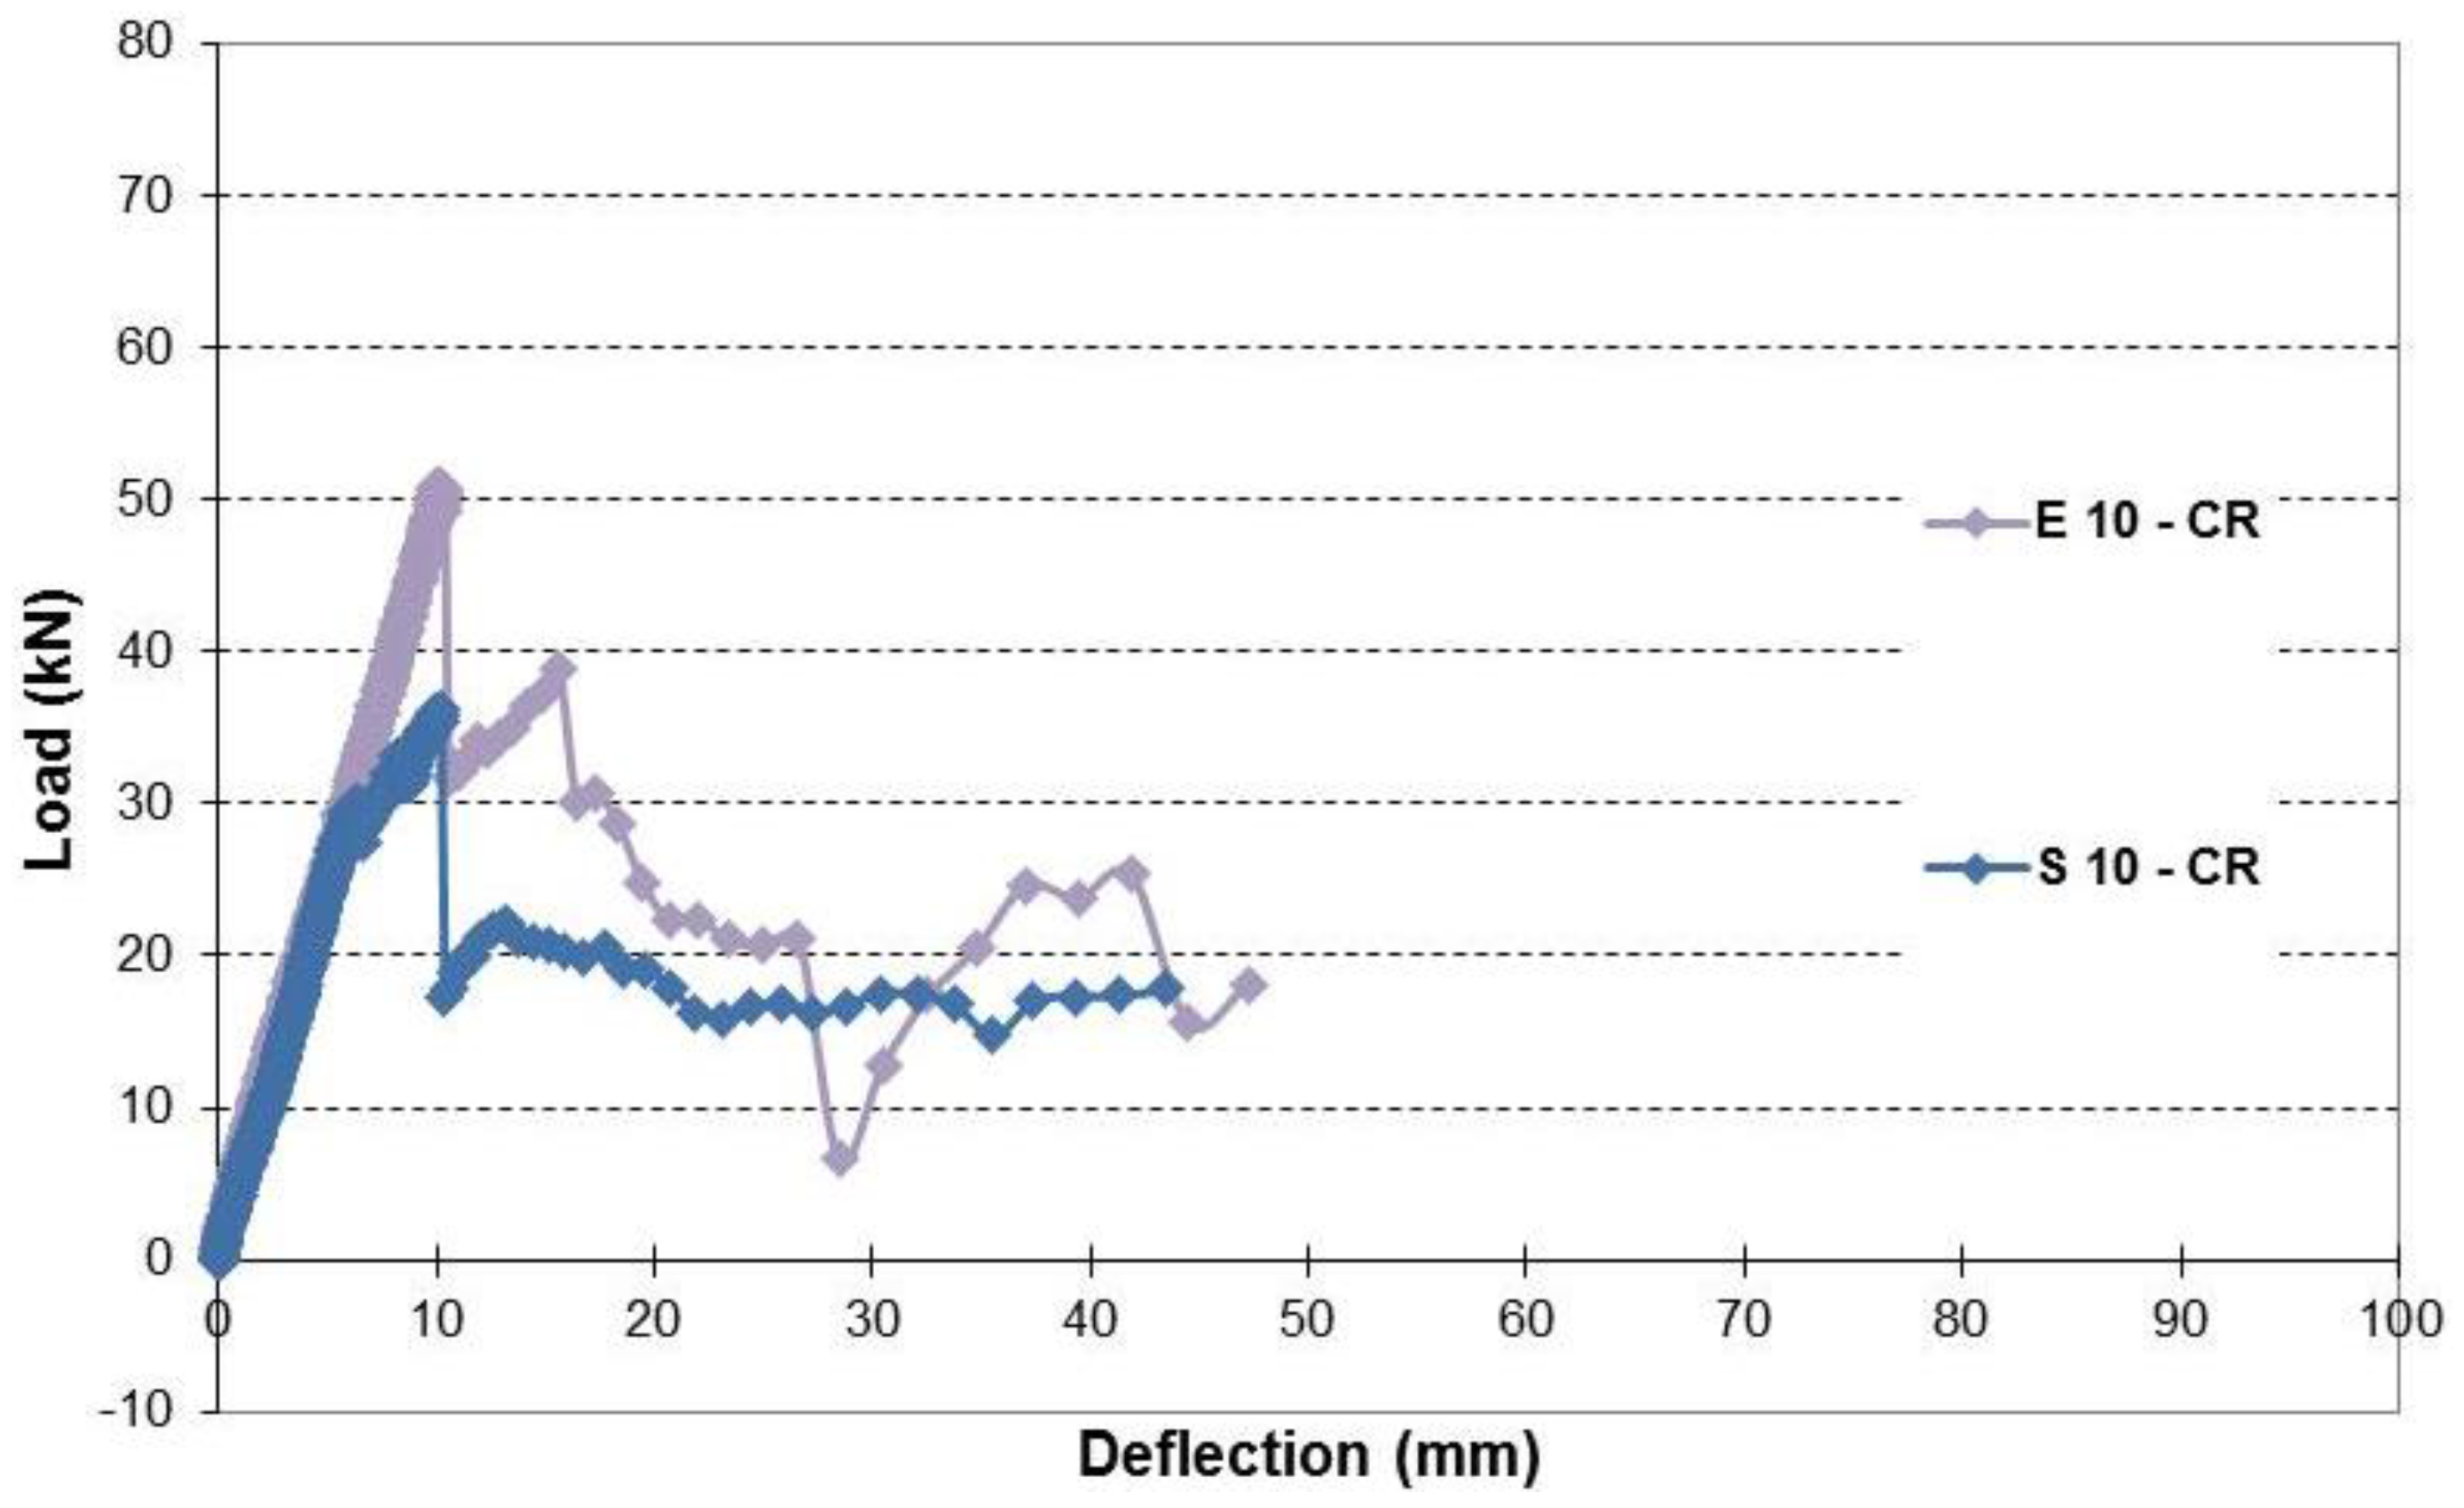
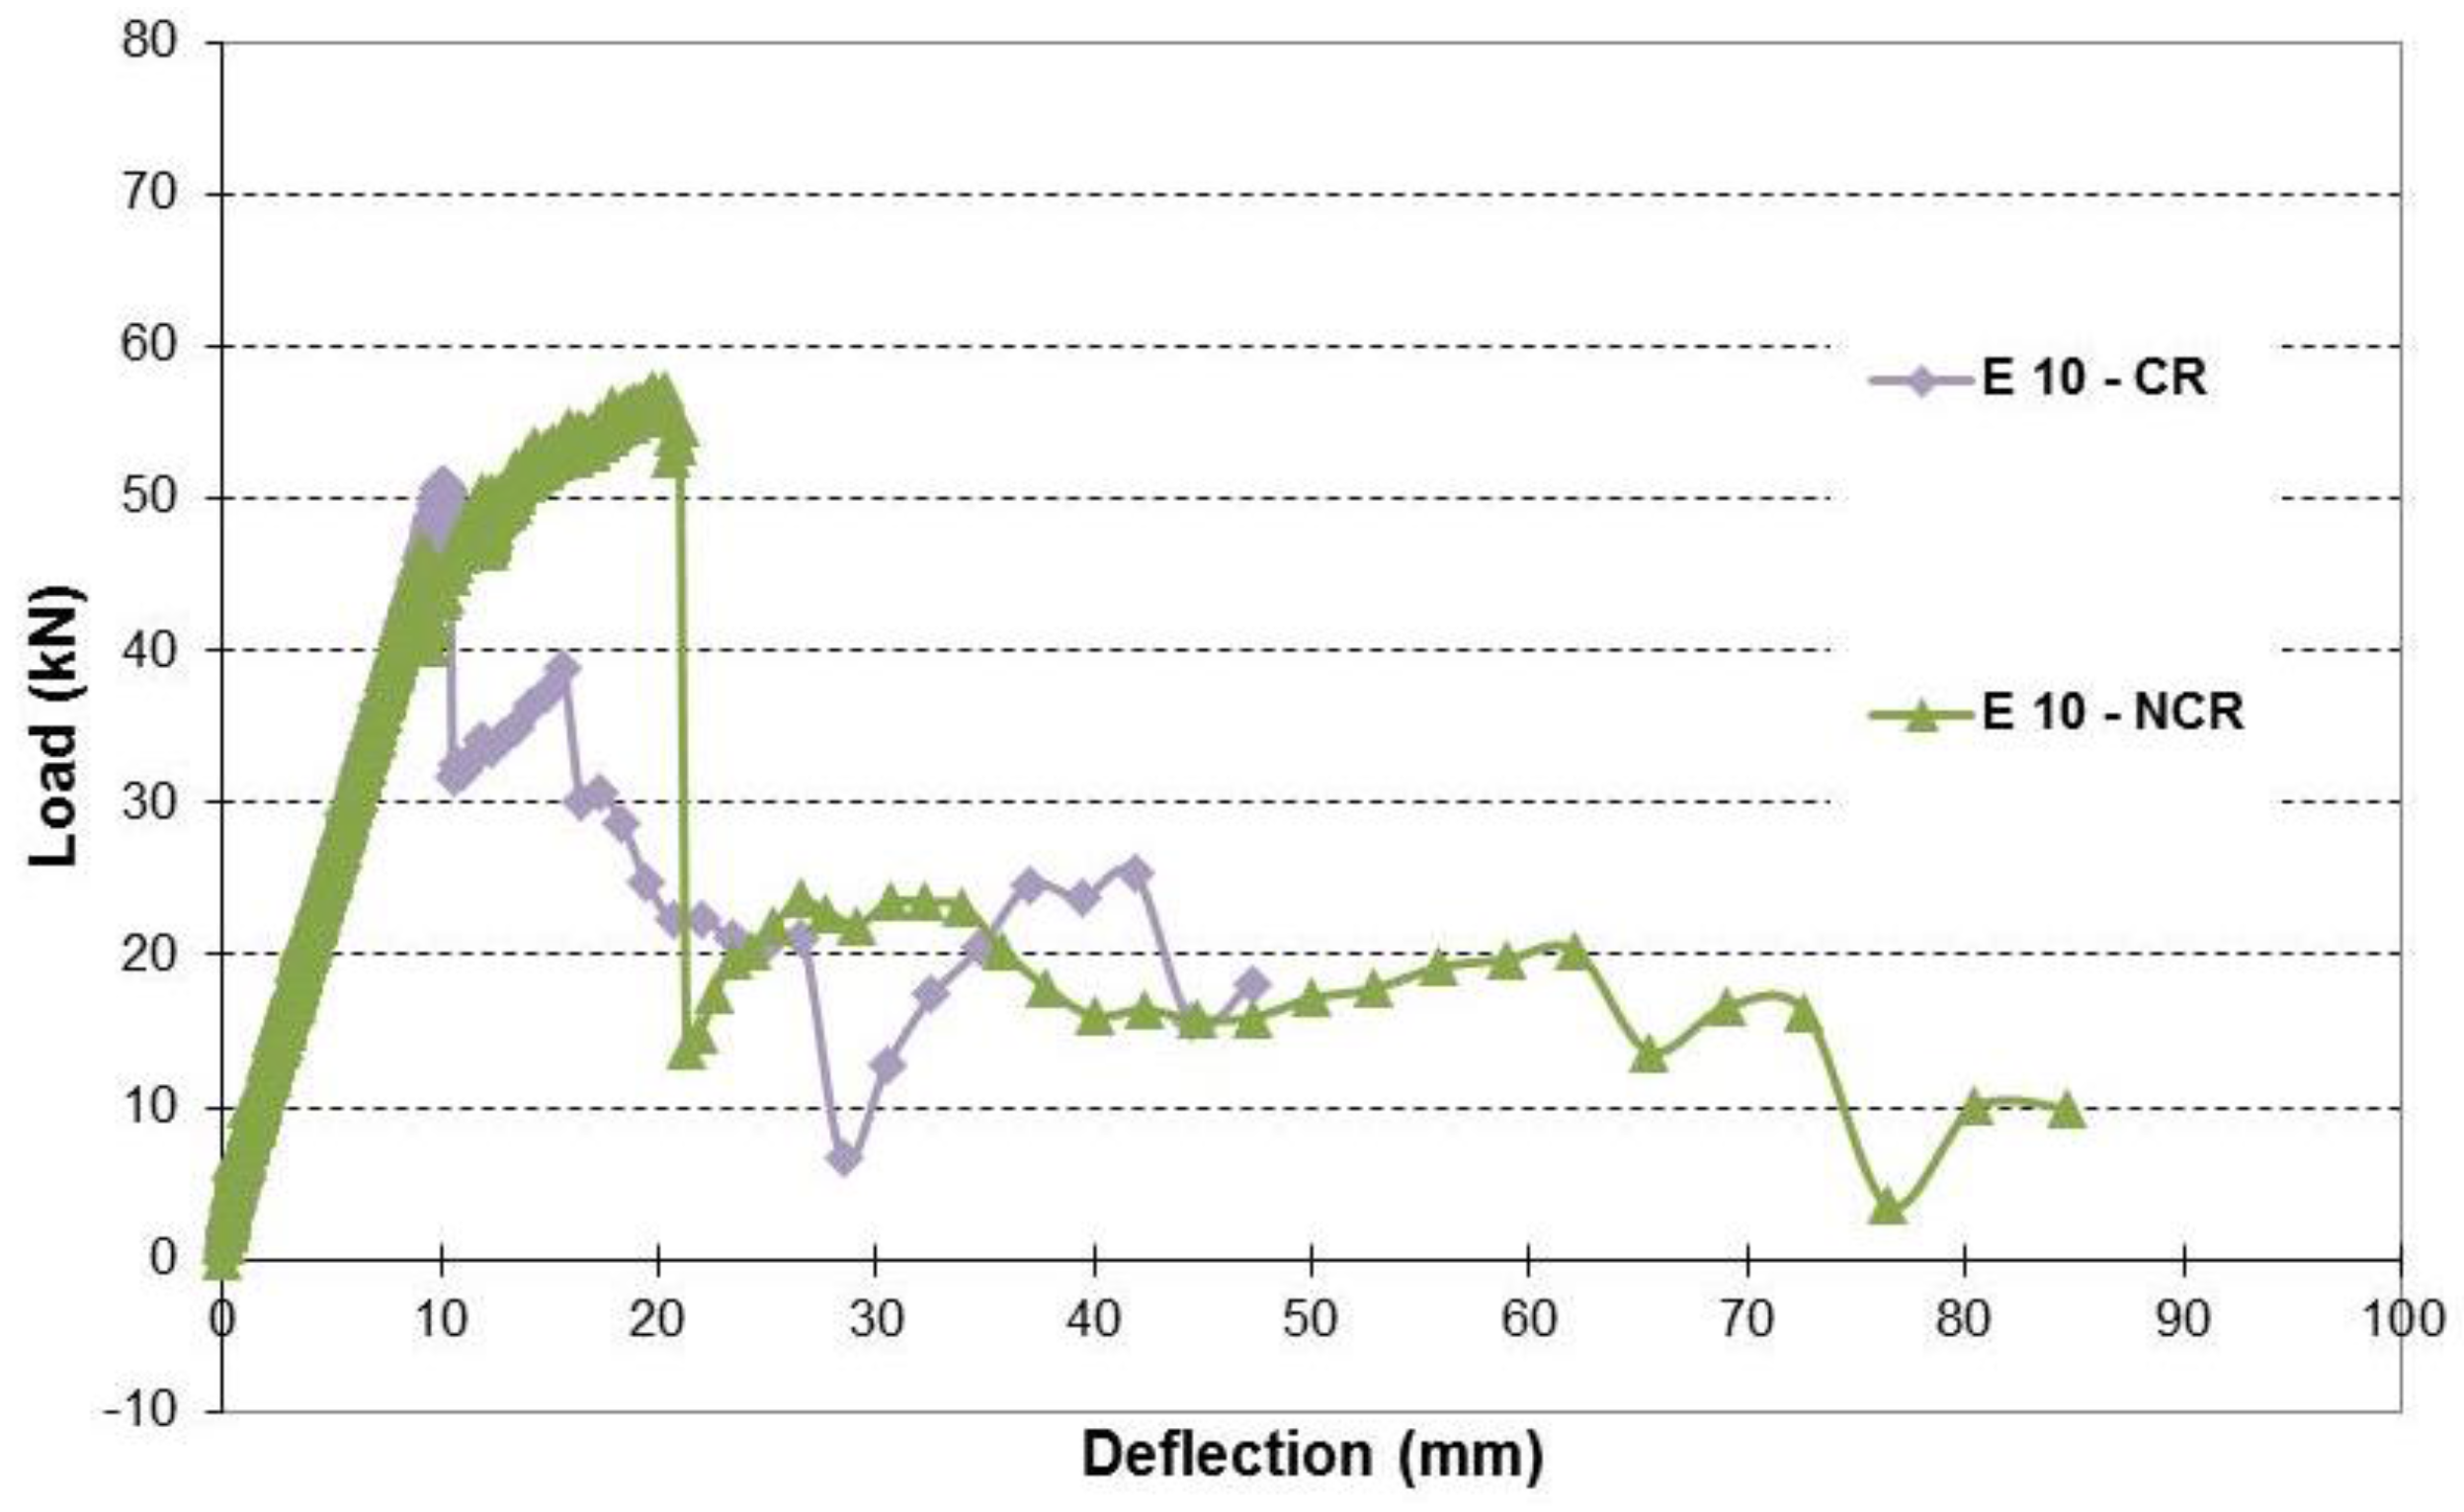
After the beams with different levels of actual or simulated corrosion were repaired, they were tested and their performance was monitored. For 10% corrosion level, beam E 10–CR and S 10–CR had a very similar stiffness, but S 10–CR had about 29% smaller load capacity than E 10–CR (Figure 18). S 10–CR showed more ductility than E 10–CR. For 20% corrosion level, beam E 20–CR was stiffer than S 20–CR (Figure 19). S 20–CR had about 27% smaller load capacity than E 20–CR. S 20–CR also showed more ductility than E 20–CR. For 32% corrosion level, a different trend was observed. S 32–CR was stiffer and showed about 30% larger load capacity than E 32–CR (Figure 20). Also, S 32–CR showed more ductility than E 32–CR. The same trend continued, when 50% corrosion level was considered. S 50–CR was stiffer and had about 28% higher load capacity than S 50–CN (Figure 21).
Figure 18. Load-deflection of beams with 10% corrosion levels (Repaired).
Figure 19. Load-deflection of beams with 20% corrosion levels (Repaired).
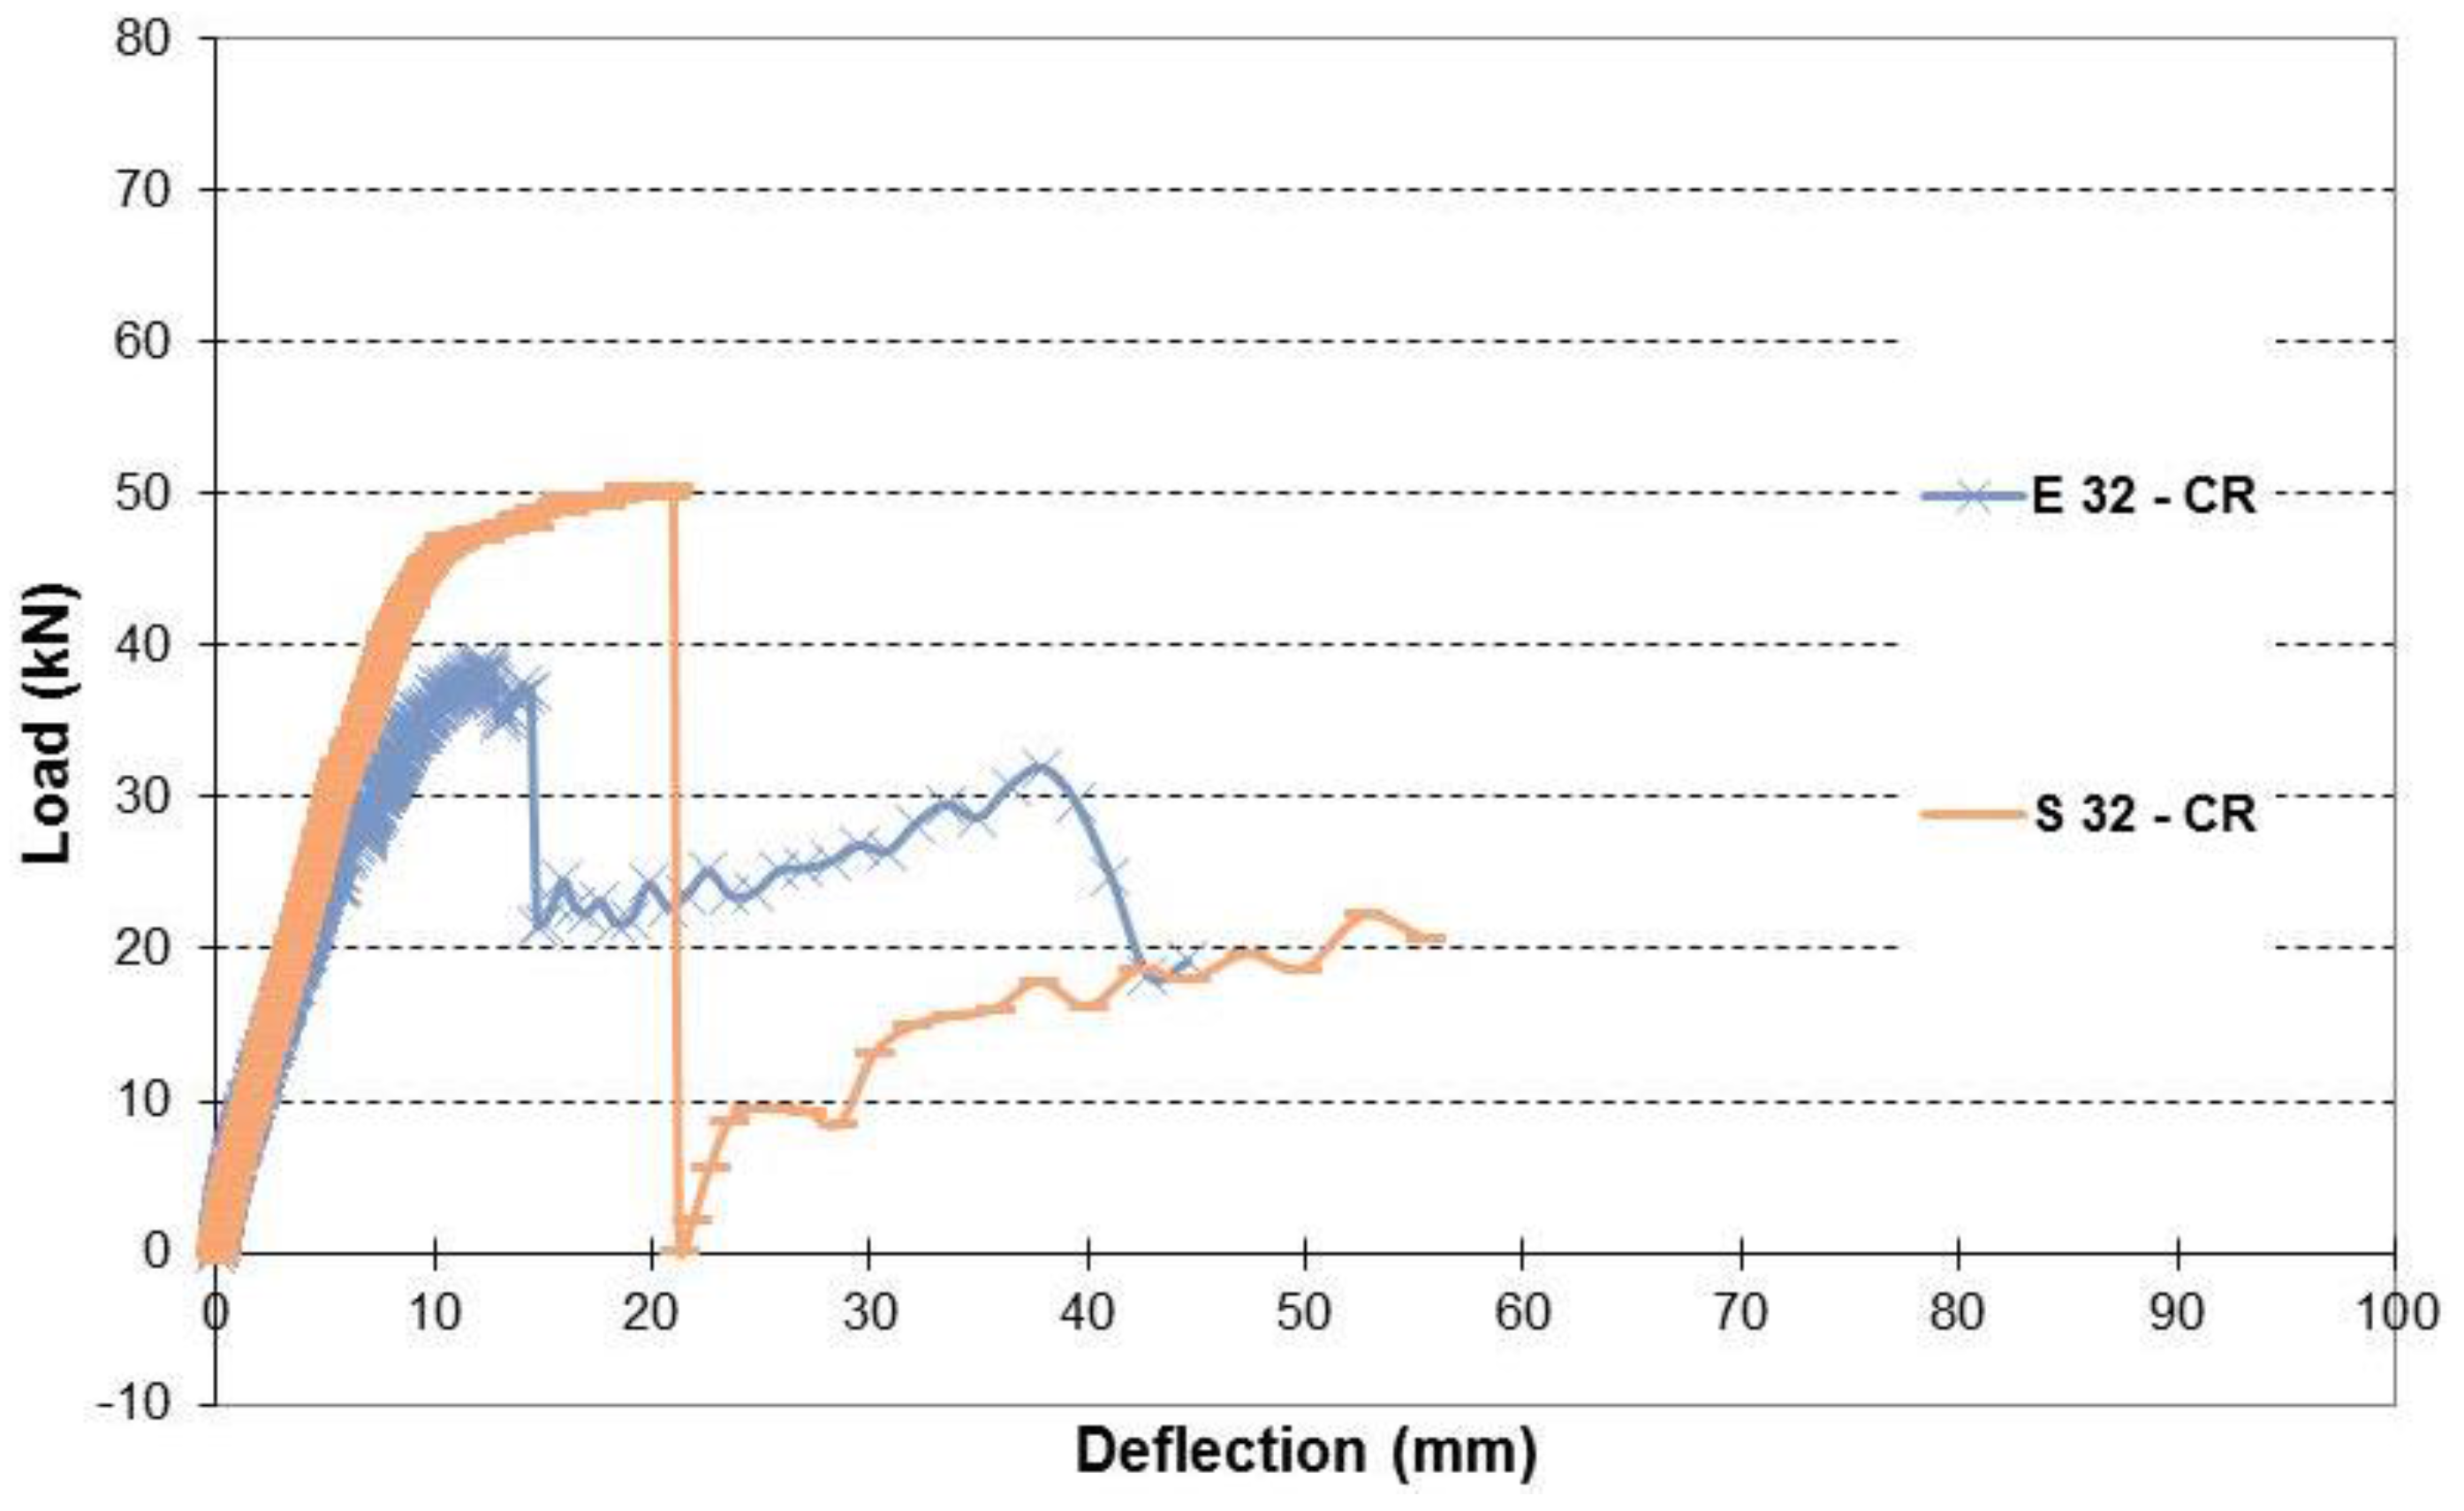
Figure 20. Load-deflection of beams with 32% corrosion levels (Repaired).
Figure 21. Load-deflection of beams with 50% corrosion levels (Repaired).

3.2.3. Loss of Cover

It was assumed that the RC members would lose the concrete cover due to corrosion. Therefore, beams were constructed without concrete cover. After 28 days, they were recovered by applying a new concrete cover with lower concrete compressive strength than that of the beam. Figure 22 shows the failure of repaired beams without cover. Table 9 presents a description of failures of beams. Figure 23, Figure 24, Figure 25, Figure 26 and Figure 27 compare the performance of repaired beams with and without cover for different corrosion levels. It seems that for 10% corrosion levels, after the cover was recovered and beam was repaired with CFRP, the repaired beam showed better performance than that of the repaired beam with cover and the same corrosion level. Beam E 10–NCR had similar stiffness to E 10–CR and showed more ductility than E 10–CR (Figure 23). For 20% corrosion level, E 20–NCR had about 45% less load capacity and showed more ductility than E 20–CR (Figure 24). E 20–CR was stiffer than E 20–NCR. For 32% corrosion level, both beams had similar load capacity; however, E 32–NCR was more ductile (Figure 25). For 40% corrosion level, E 40–NCR had smaller stiffness and about 32% less load capacity than that of E 40–CR (Figure 26). E 40–NCR showed more ductility than E 40–CR. For 50% corrosion level, E 50–CR was stiffer and had almost 31% higher load capacity than that of E 50–NCR (Figure 27). In general, it can be concluded that if an RC member experienced loss of cover and 10% corrosion level and was repaired by adding a new cover and applying CFRP, it performed better than a repaired beam that had the same corrosion level and a concrete cover. However, if corrosion level exceeded 10%, the repaired beam that lost its concrete cover had a load carrying capacity that was lower than that of a repaired beam with cover by about 32%. This can be explained that as the rebar gets more corrosive, the strength of the rebar decreases and then the cover plays a more dominant role in strengthening the beam. A weak cover for the recovered beam would offer lower strength than the beam with an intact cover.
Figure 22. Failure of beams without cover and repaired with double sheets.
Table 9. Failure description of beams without cover and repaired with double sheets.
Figure 23. Load-deflection relationship of repaired beams with 10% corrosion level with and without cover.
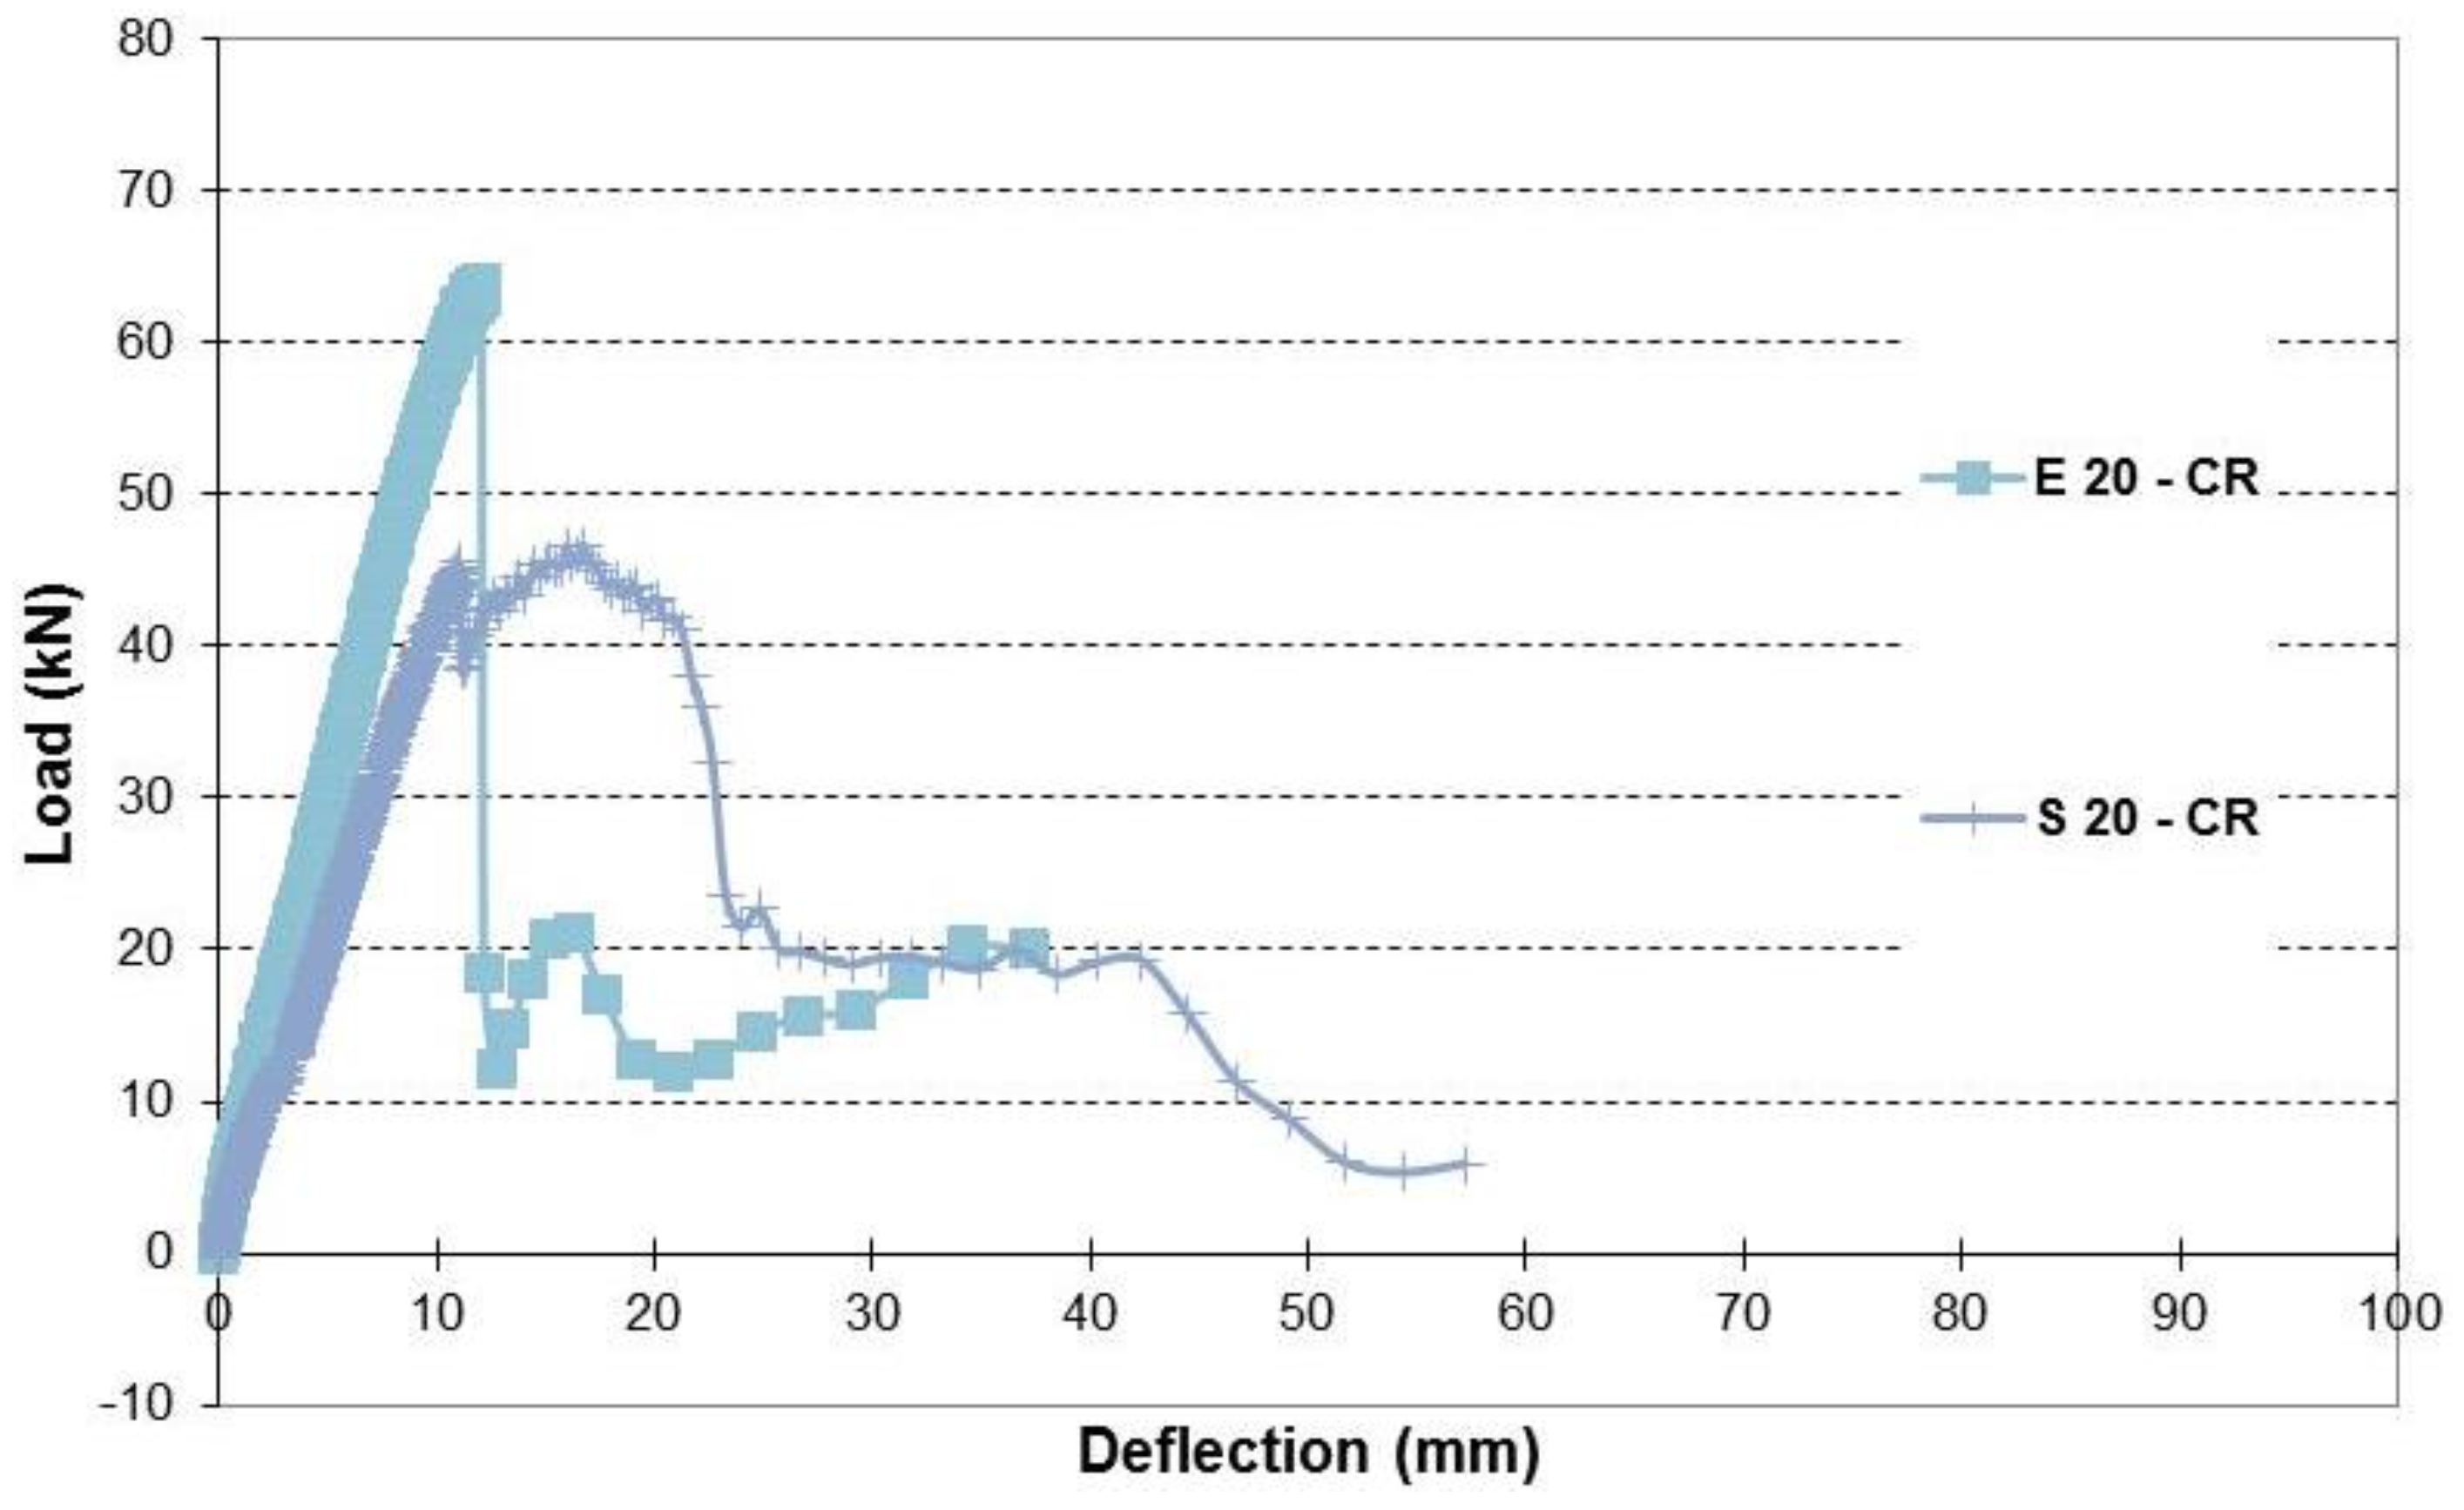
Figure 24. Load-deflection relationship of repaired beams with 20% corrosion level with and without cover.
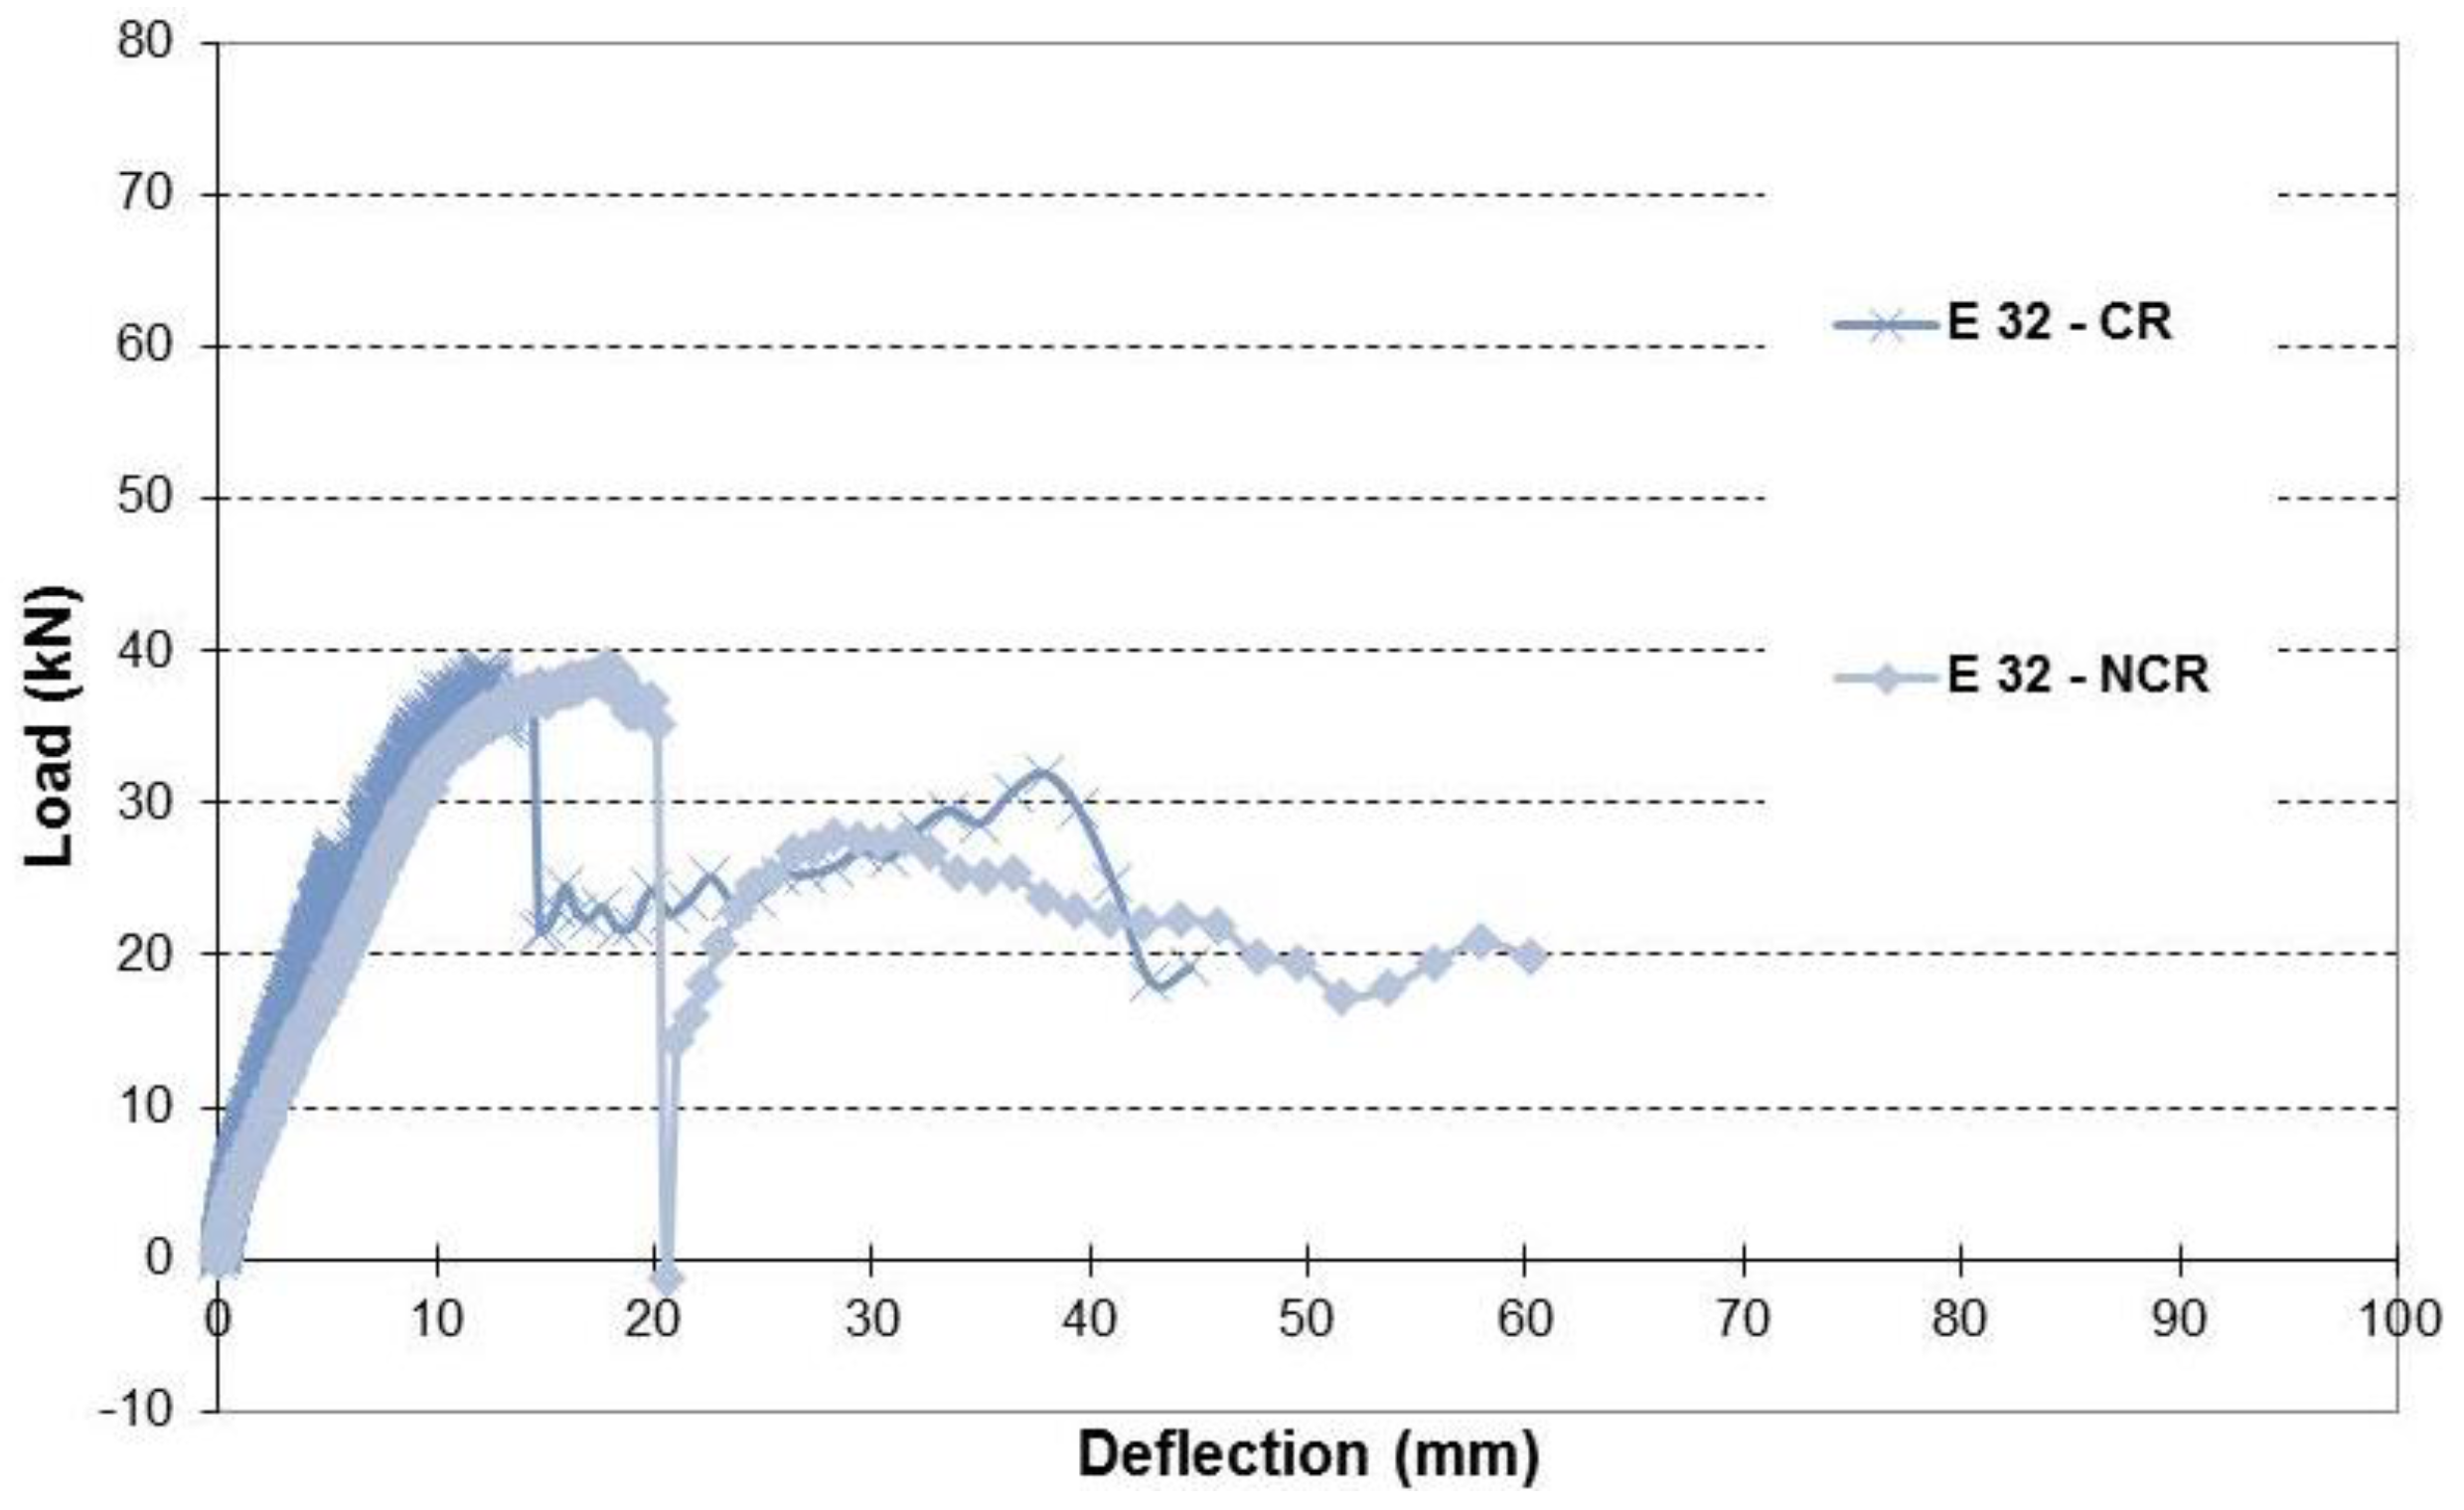
Figure 25. Load-deflection relationship of repaired beams with 32% corrosion level with and without cover.
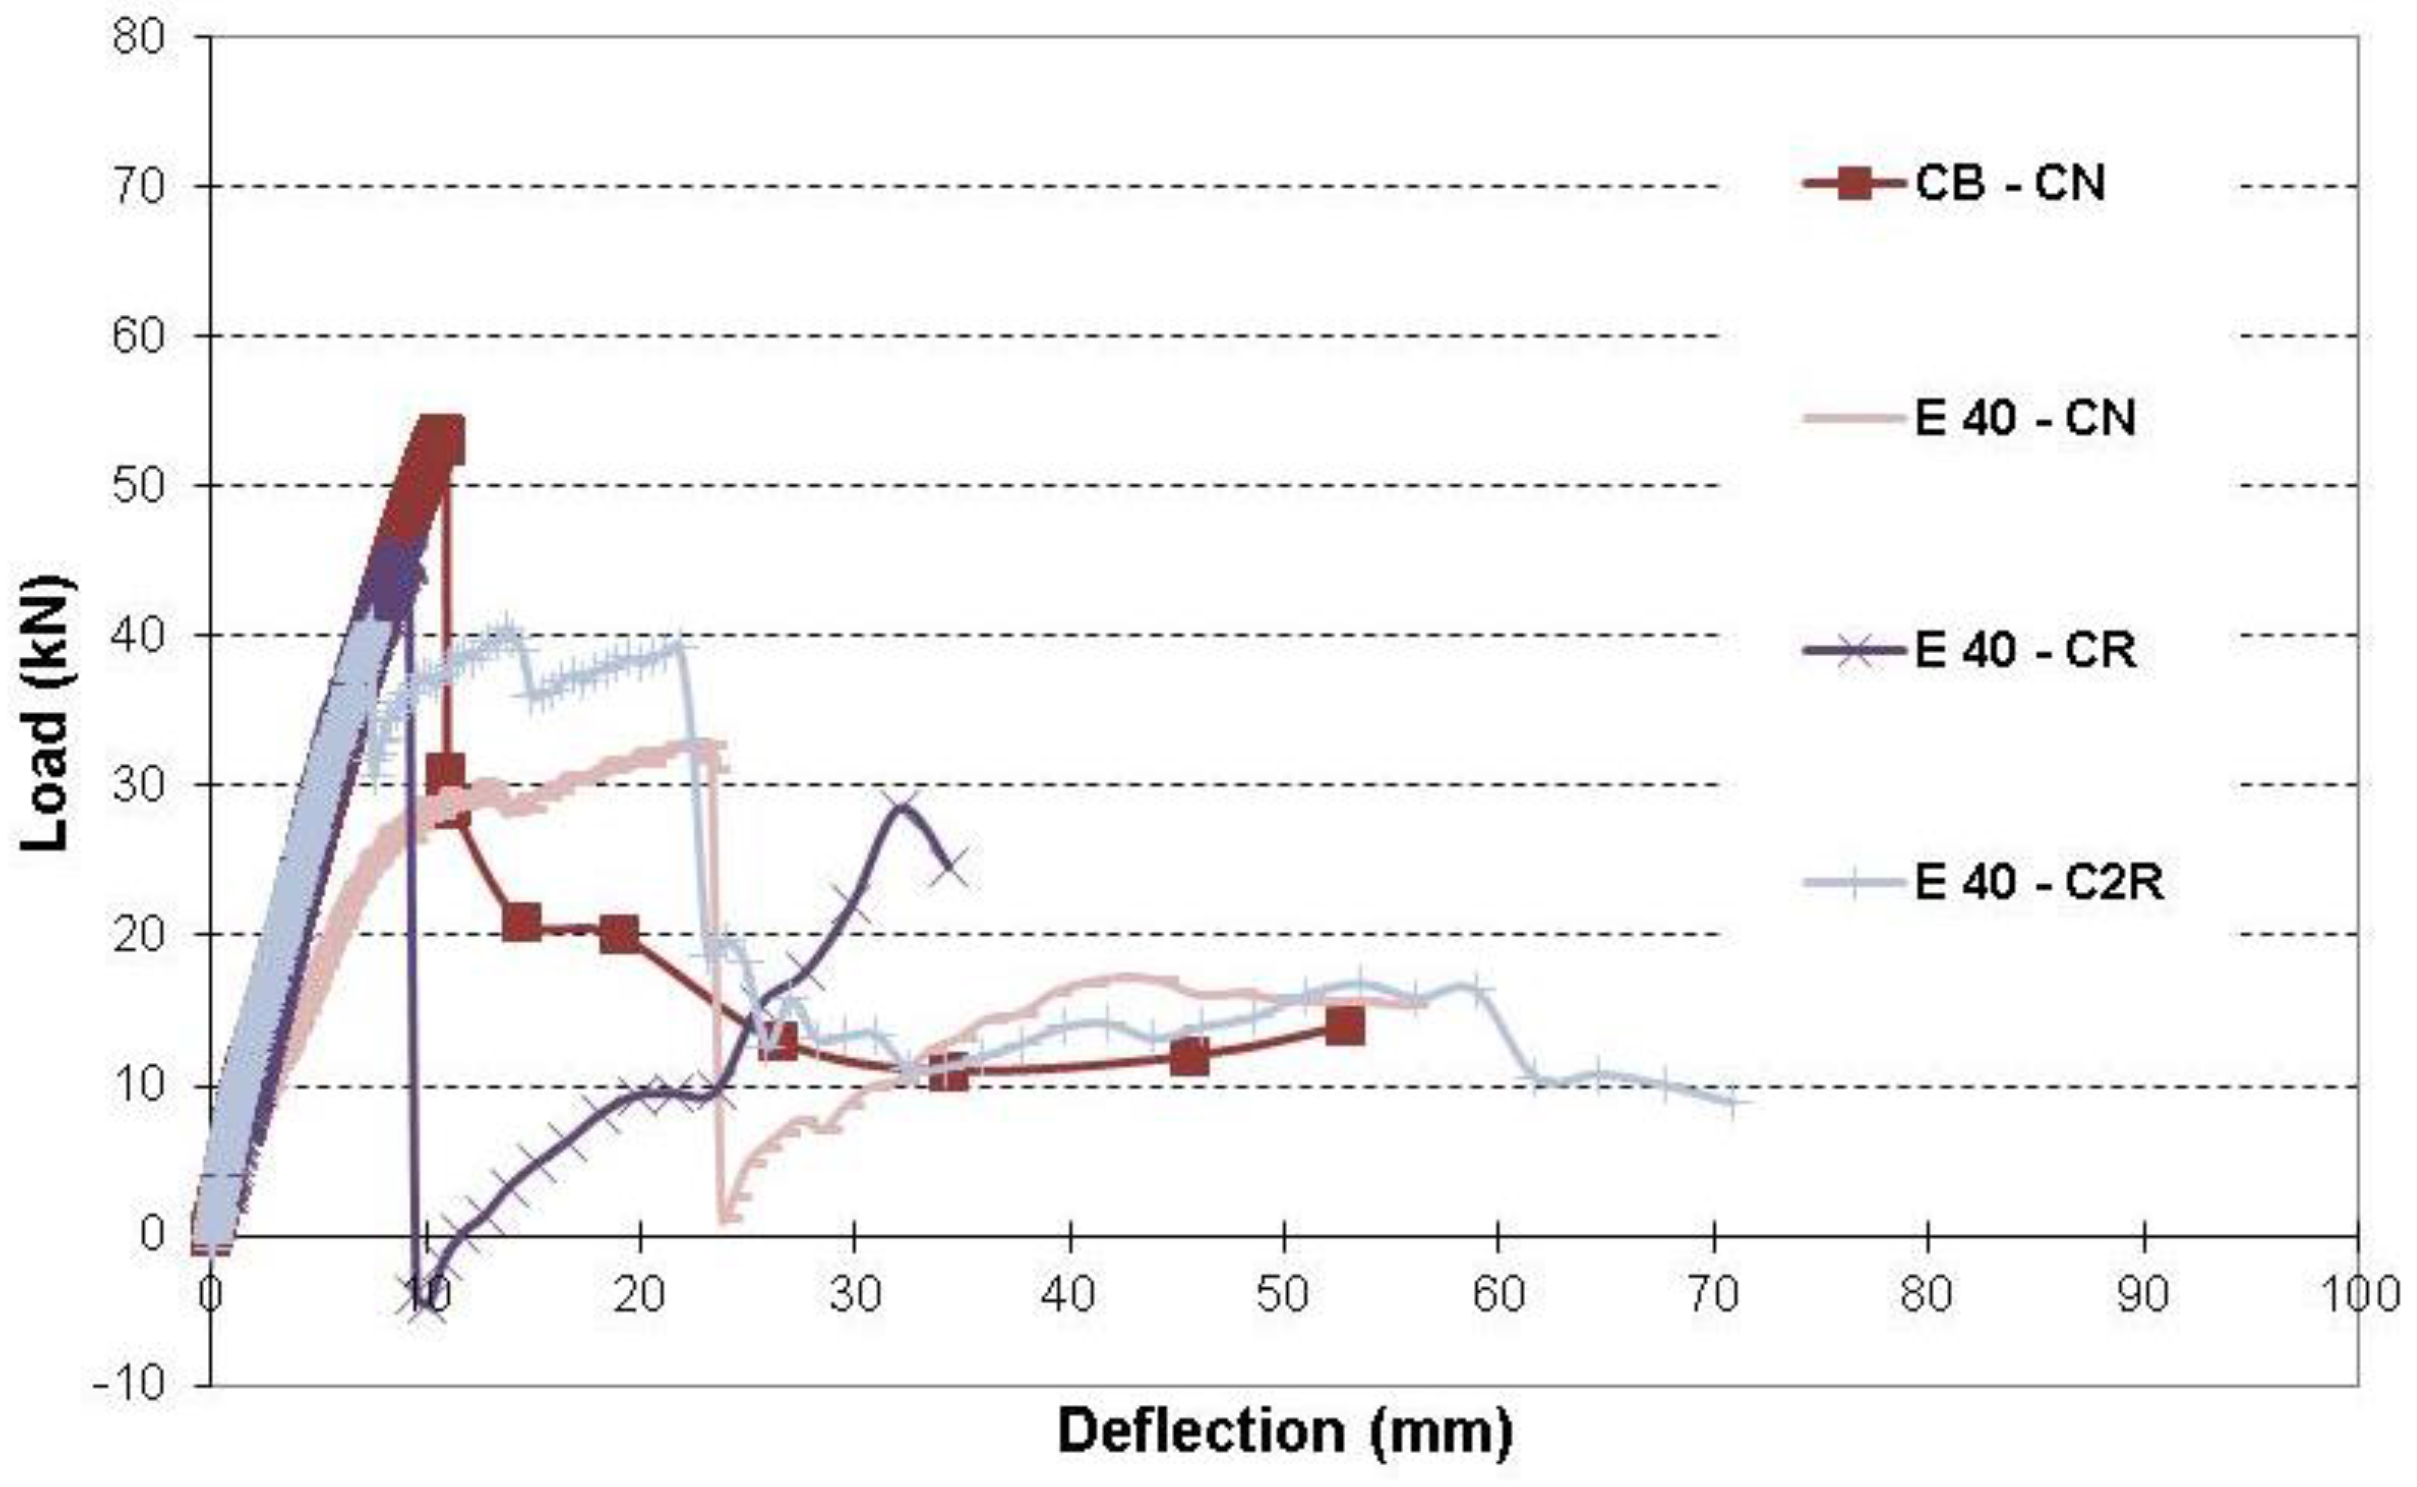
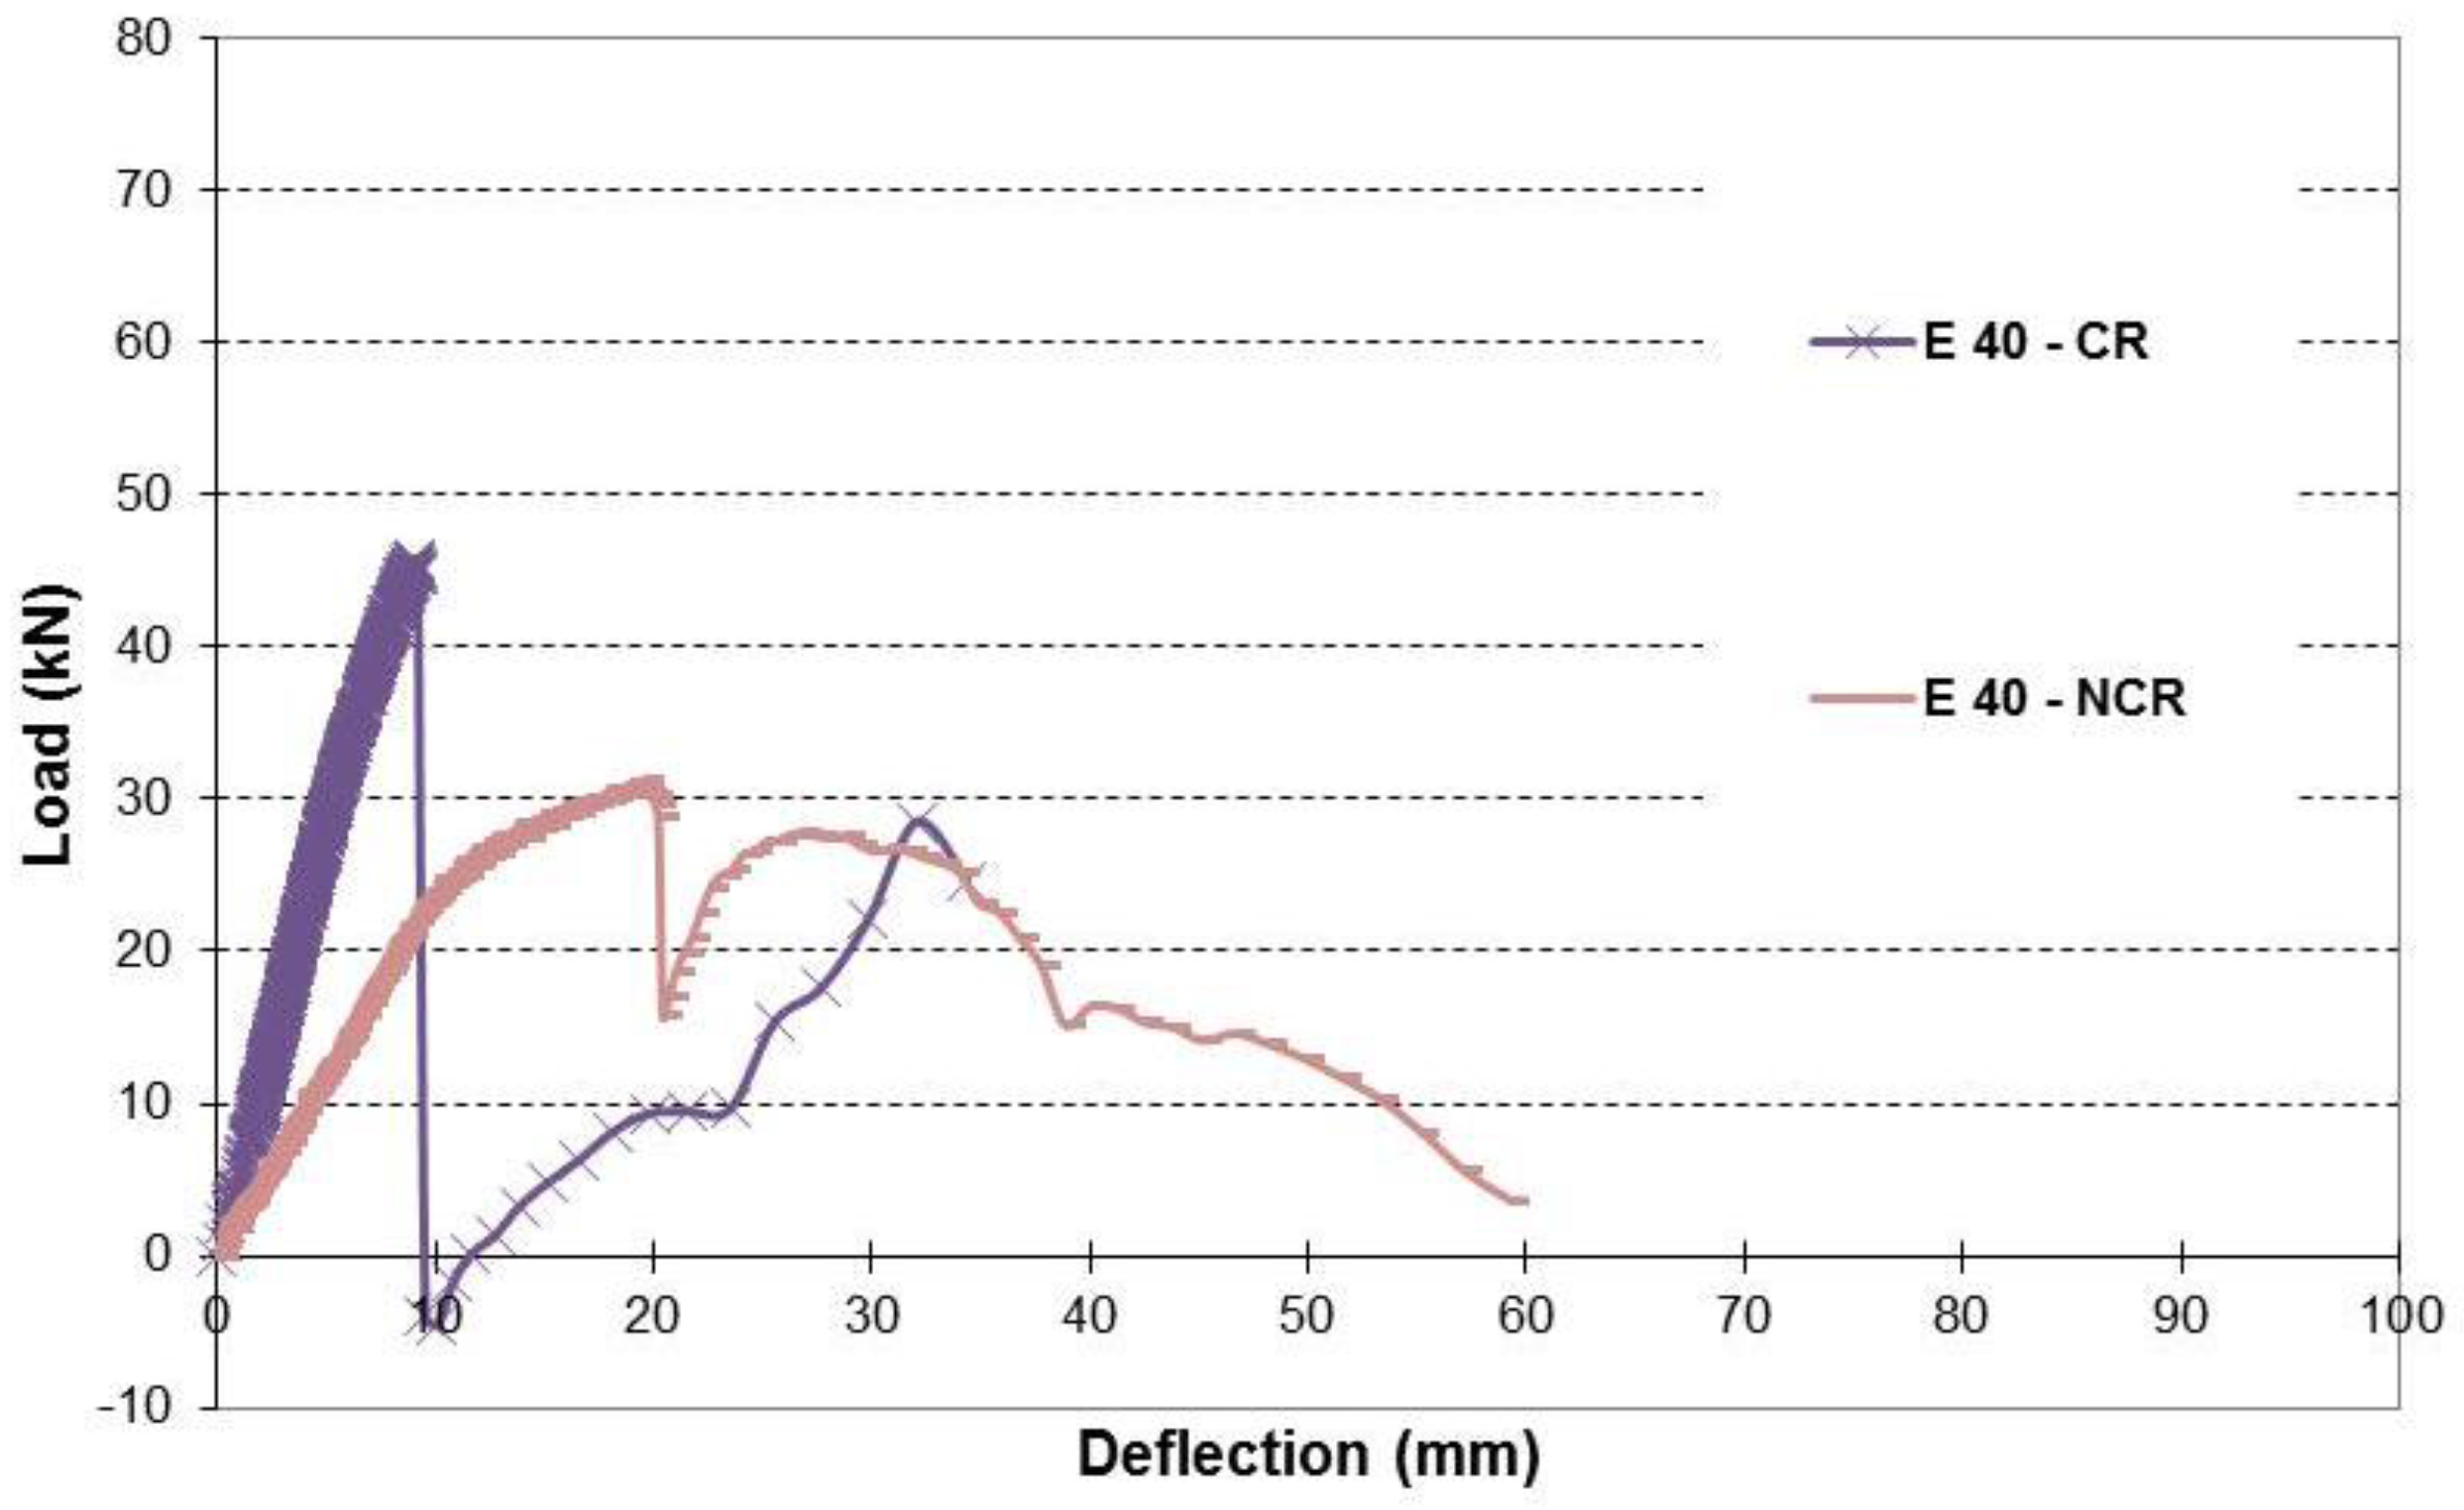
Figure 26. Load-deflection relationship of repaired beams with 40% corrosion level with and without cover.
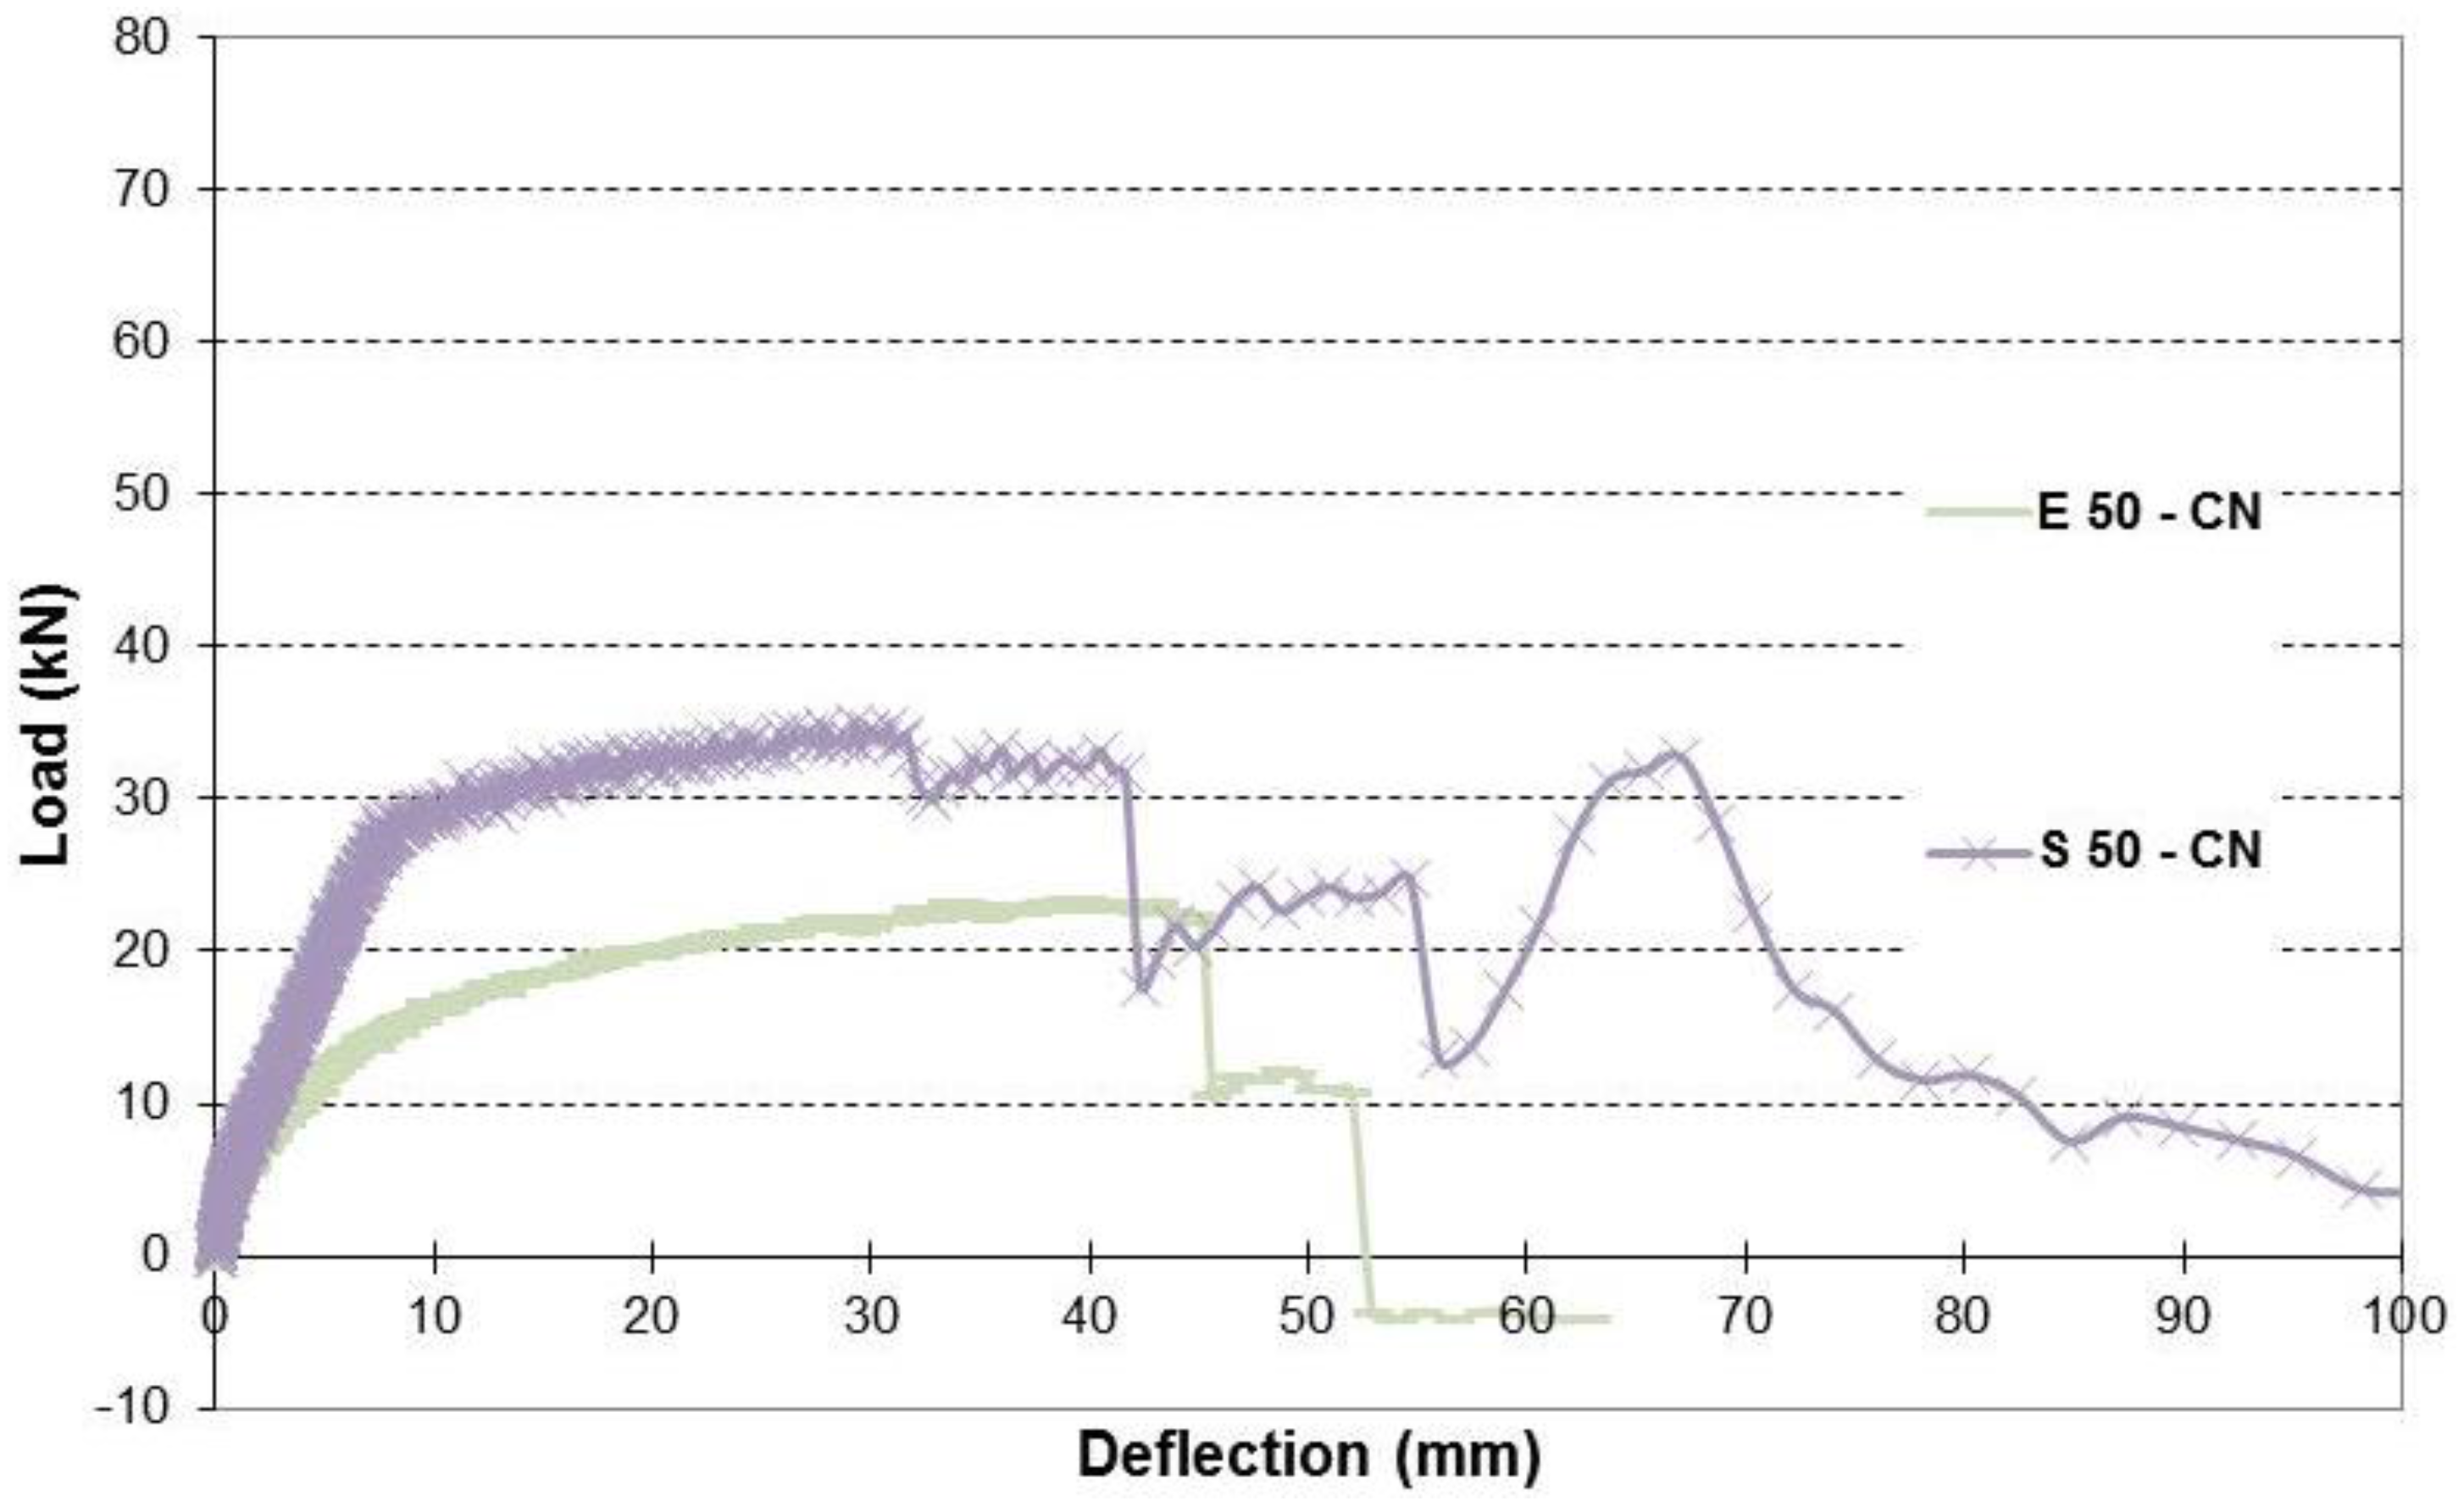
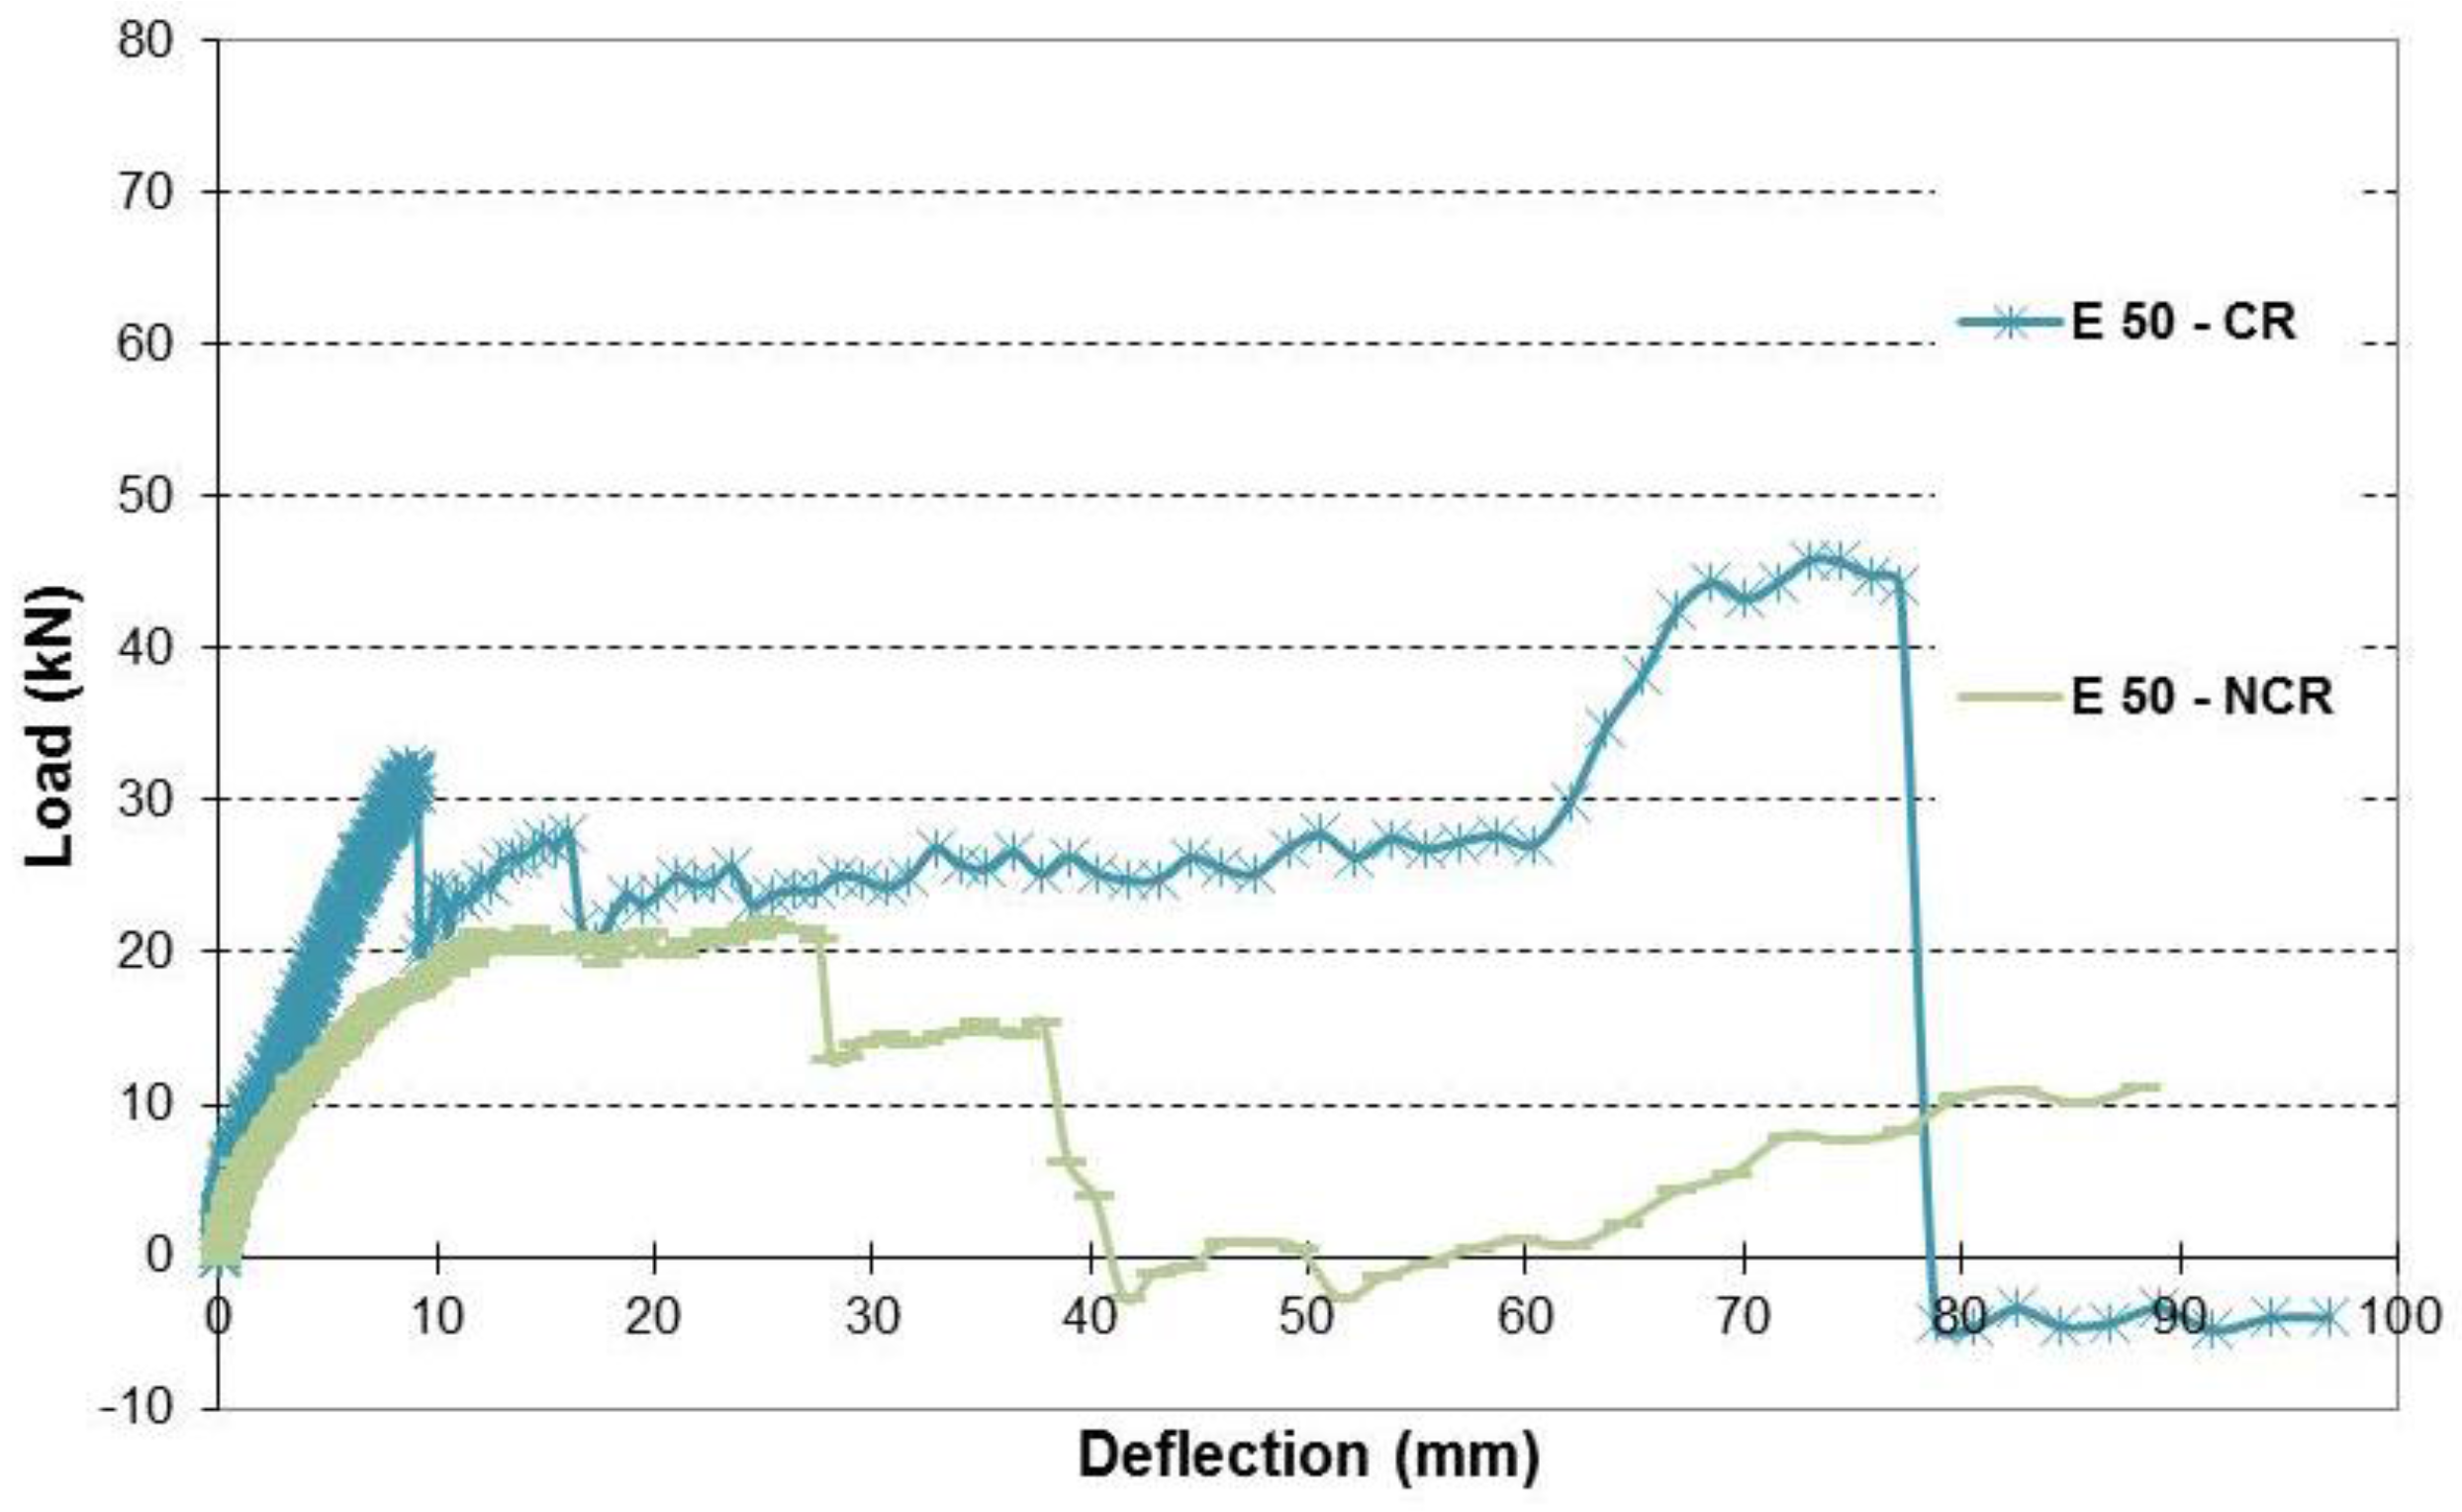
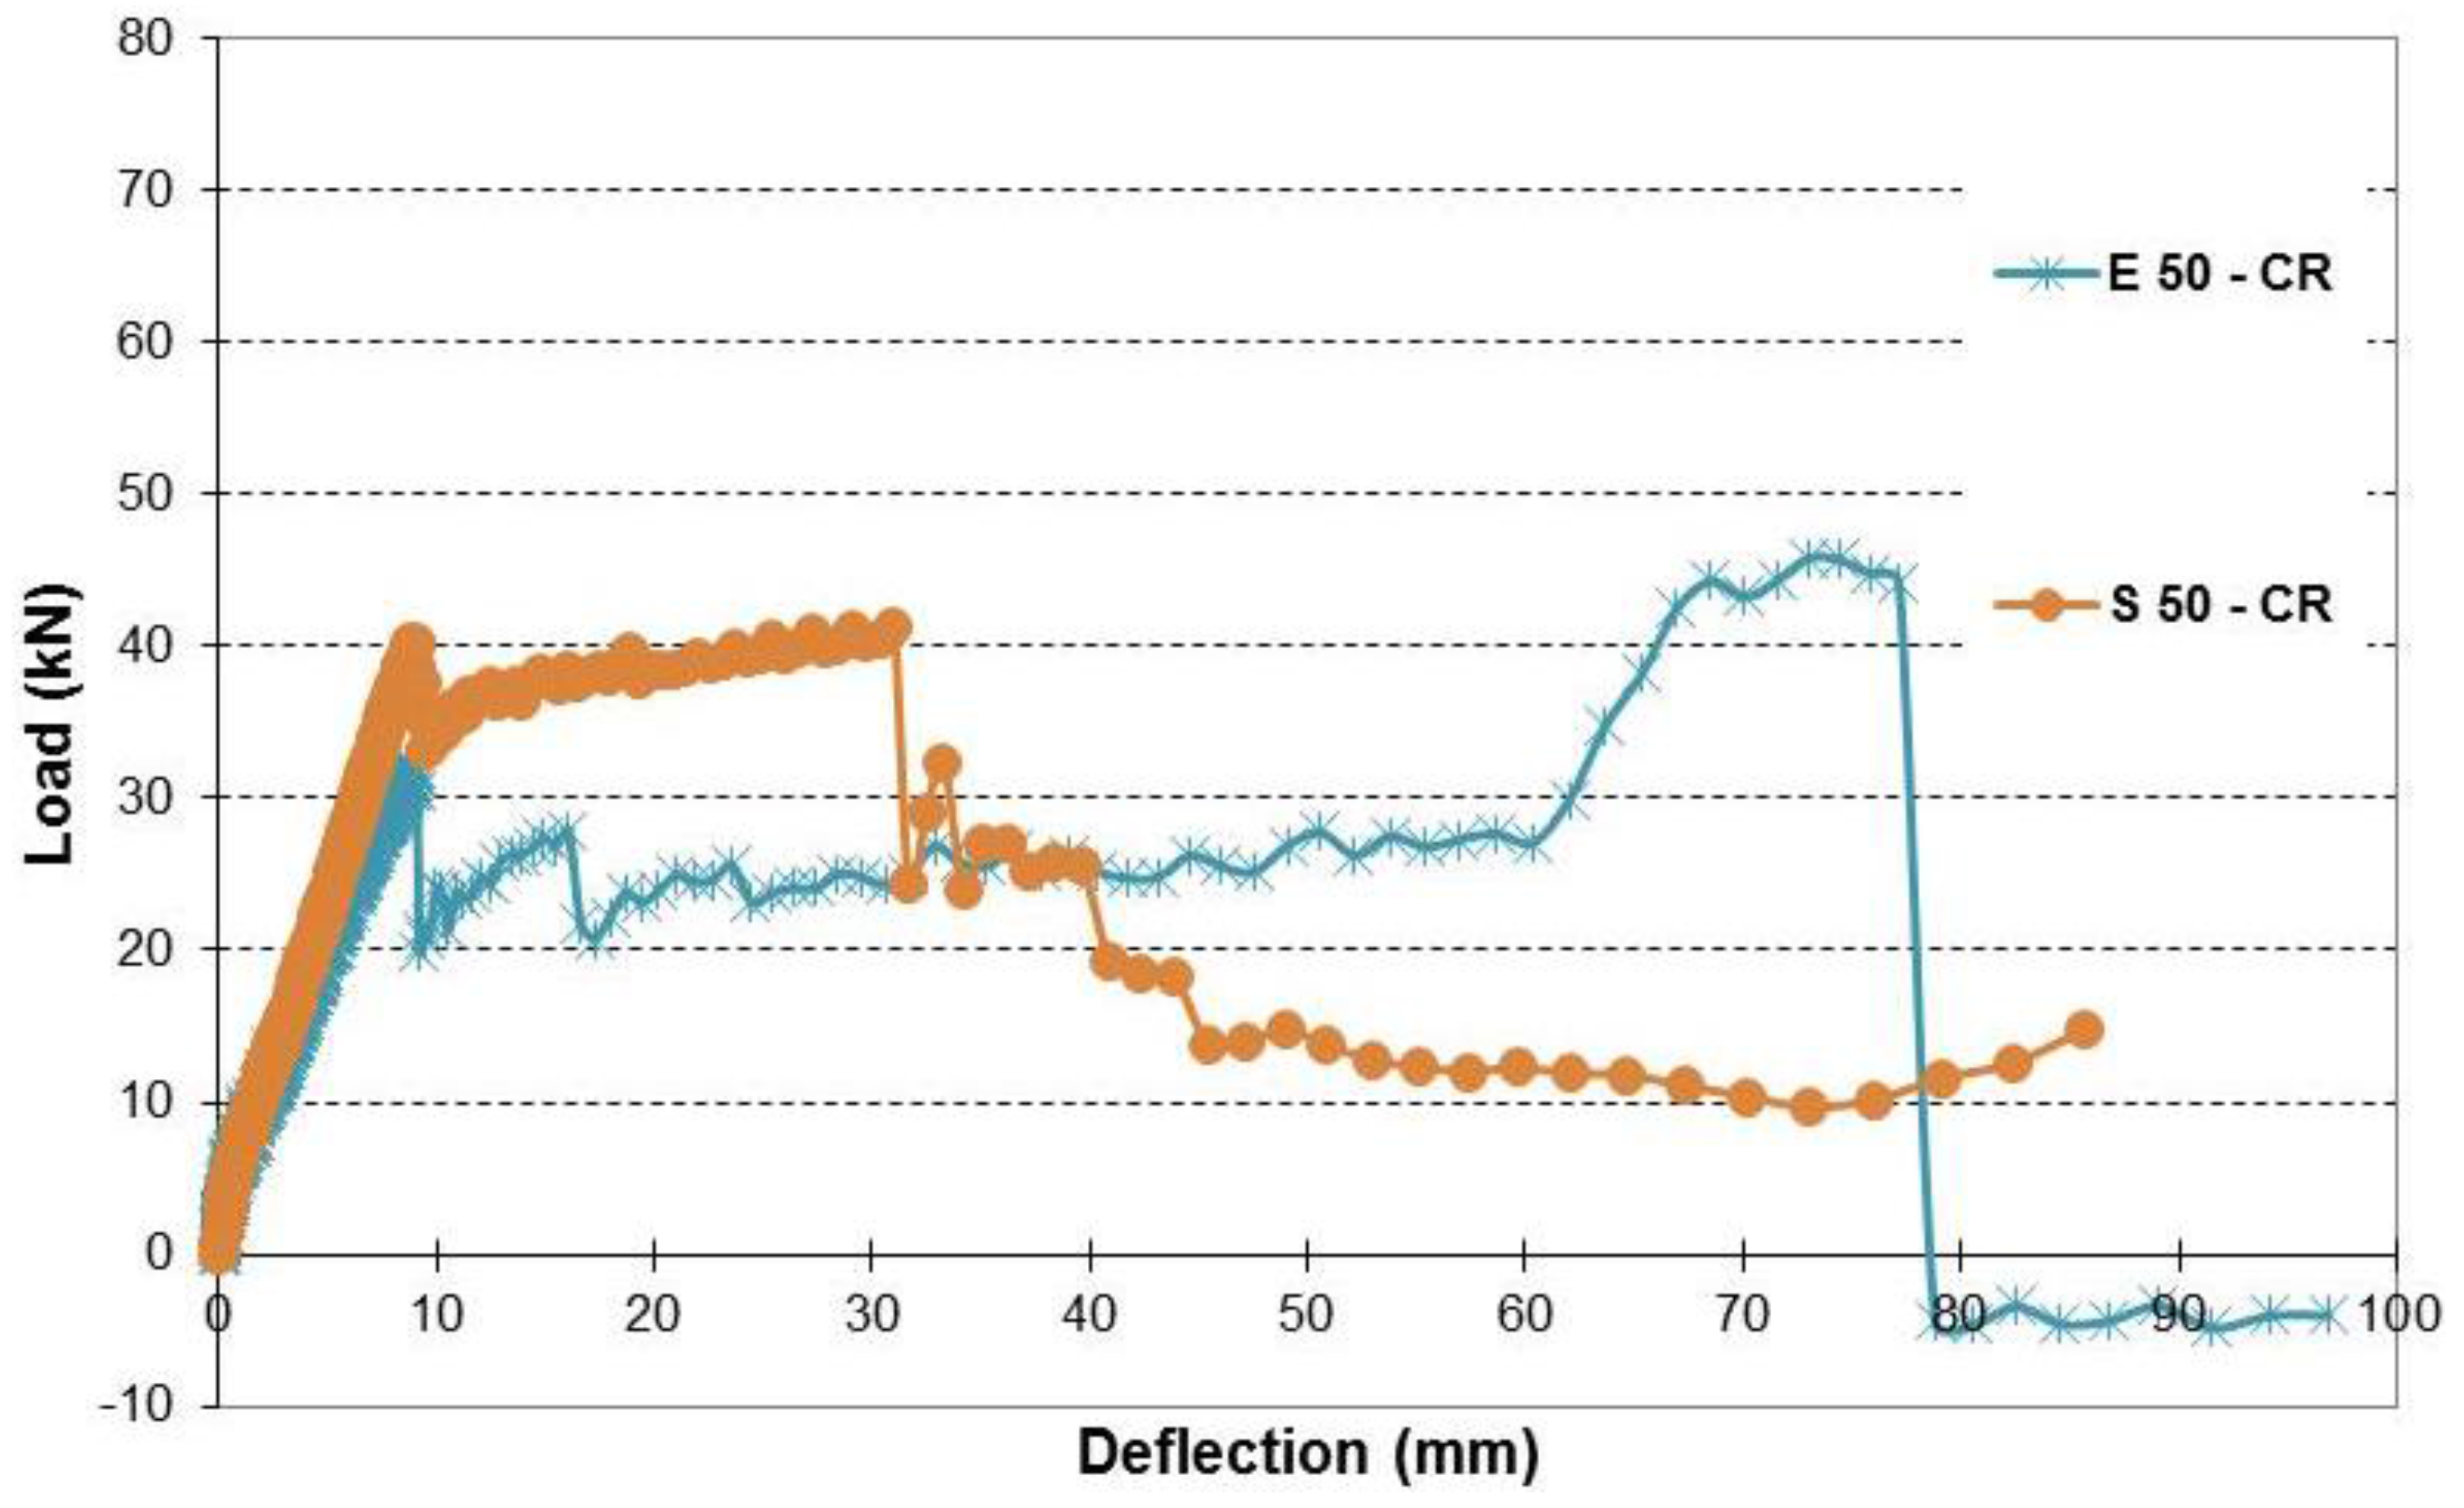
Figure 27. Load-deflection relationship of repaired beams with 50% corrosion level with and without cover.

3.2.4. Repair with CFRP Double Sheets

The effect of applying two layers of sheet to repair beams with 40% and 50% corrosion levels was investigated. Figure 22 shows the failure of the beams repaired with two layers of CFRP sheets. Table 9 presents failure of the beams. Figure 28 and Figure 29 show a comparison between the control beam, corroded beam–without repair, repaired beam with one layer of sheet, and repaired beam with two layers of sheet. For 40% corrosion level, it seems that strengthening improved the load carrying capacity. E 40–CR had higher load capacity than E 40–CN, but it was less ductile. When two layers of sheet were applied, E 40–CR and E 40–C2R had similar stiffness to that of CB–CN. E 40–C2R had higher capacity than that of E 40–CN, yet smaller than that of E 40–CR. However, E 40–C2R showed more ductility than E 40–CR as its ductility was similar to E 40–CN. In general, applying double CFRP sheets did not help to restore the full capacity of the corroded beam. A similar trend was observed for 50% corrosion level, but both E 50–CR and E 50–C2R had similar stiffness, which was smaller than that of CB–CN. Also, E 50–C2R showed a ductile behavior, but it had a smaller capacity than E 50–CR. Similarly, applying double sheets did not restore the full capacity of the corroded beam.
Figure 28. Load-deflection of control beam and beams with 40% corrosion level.
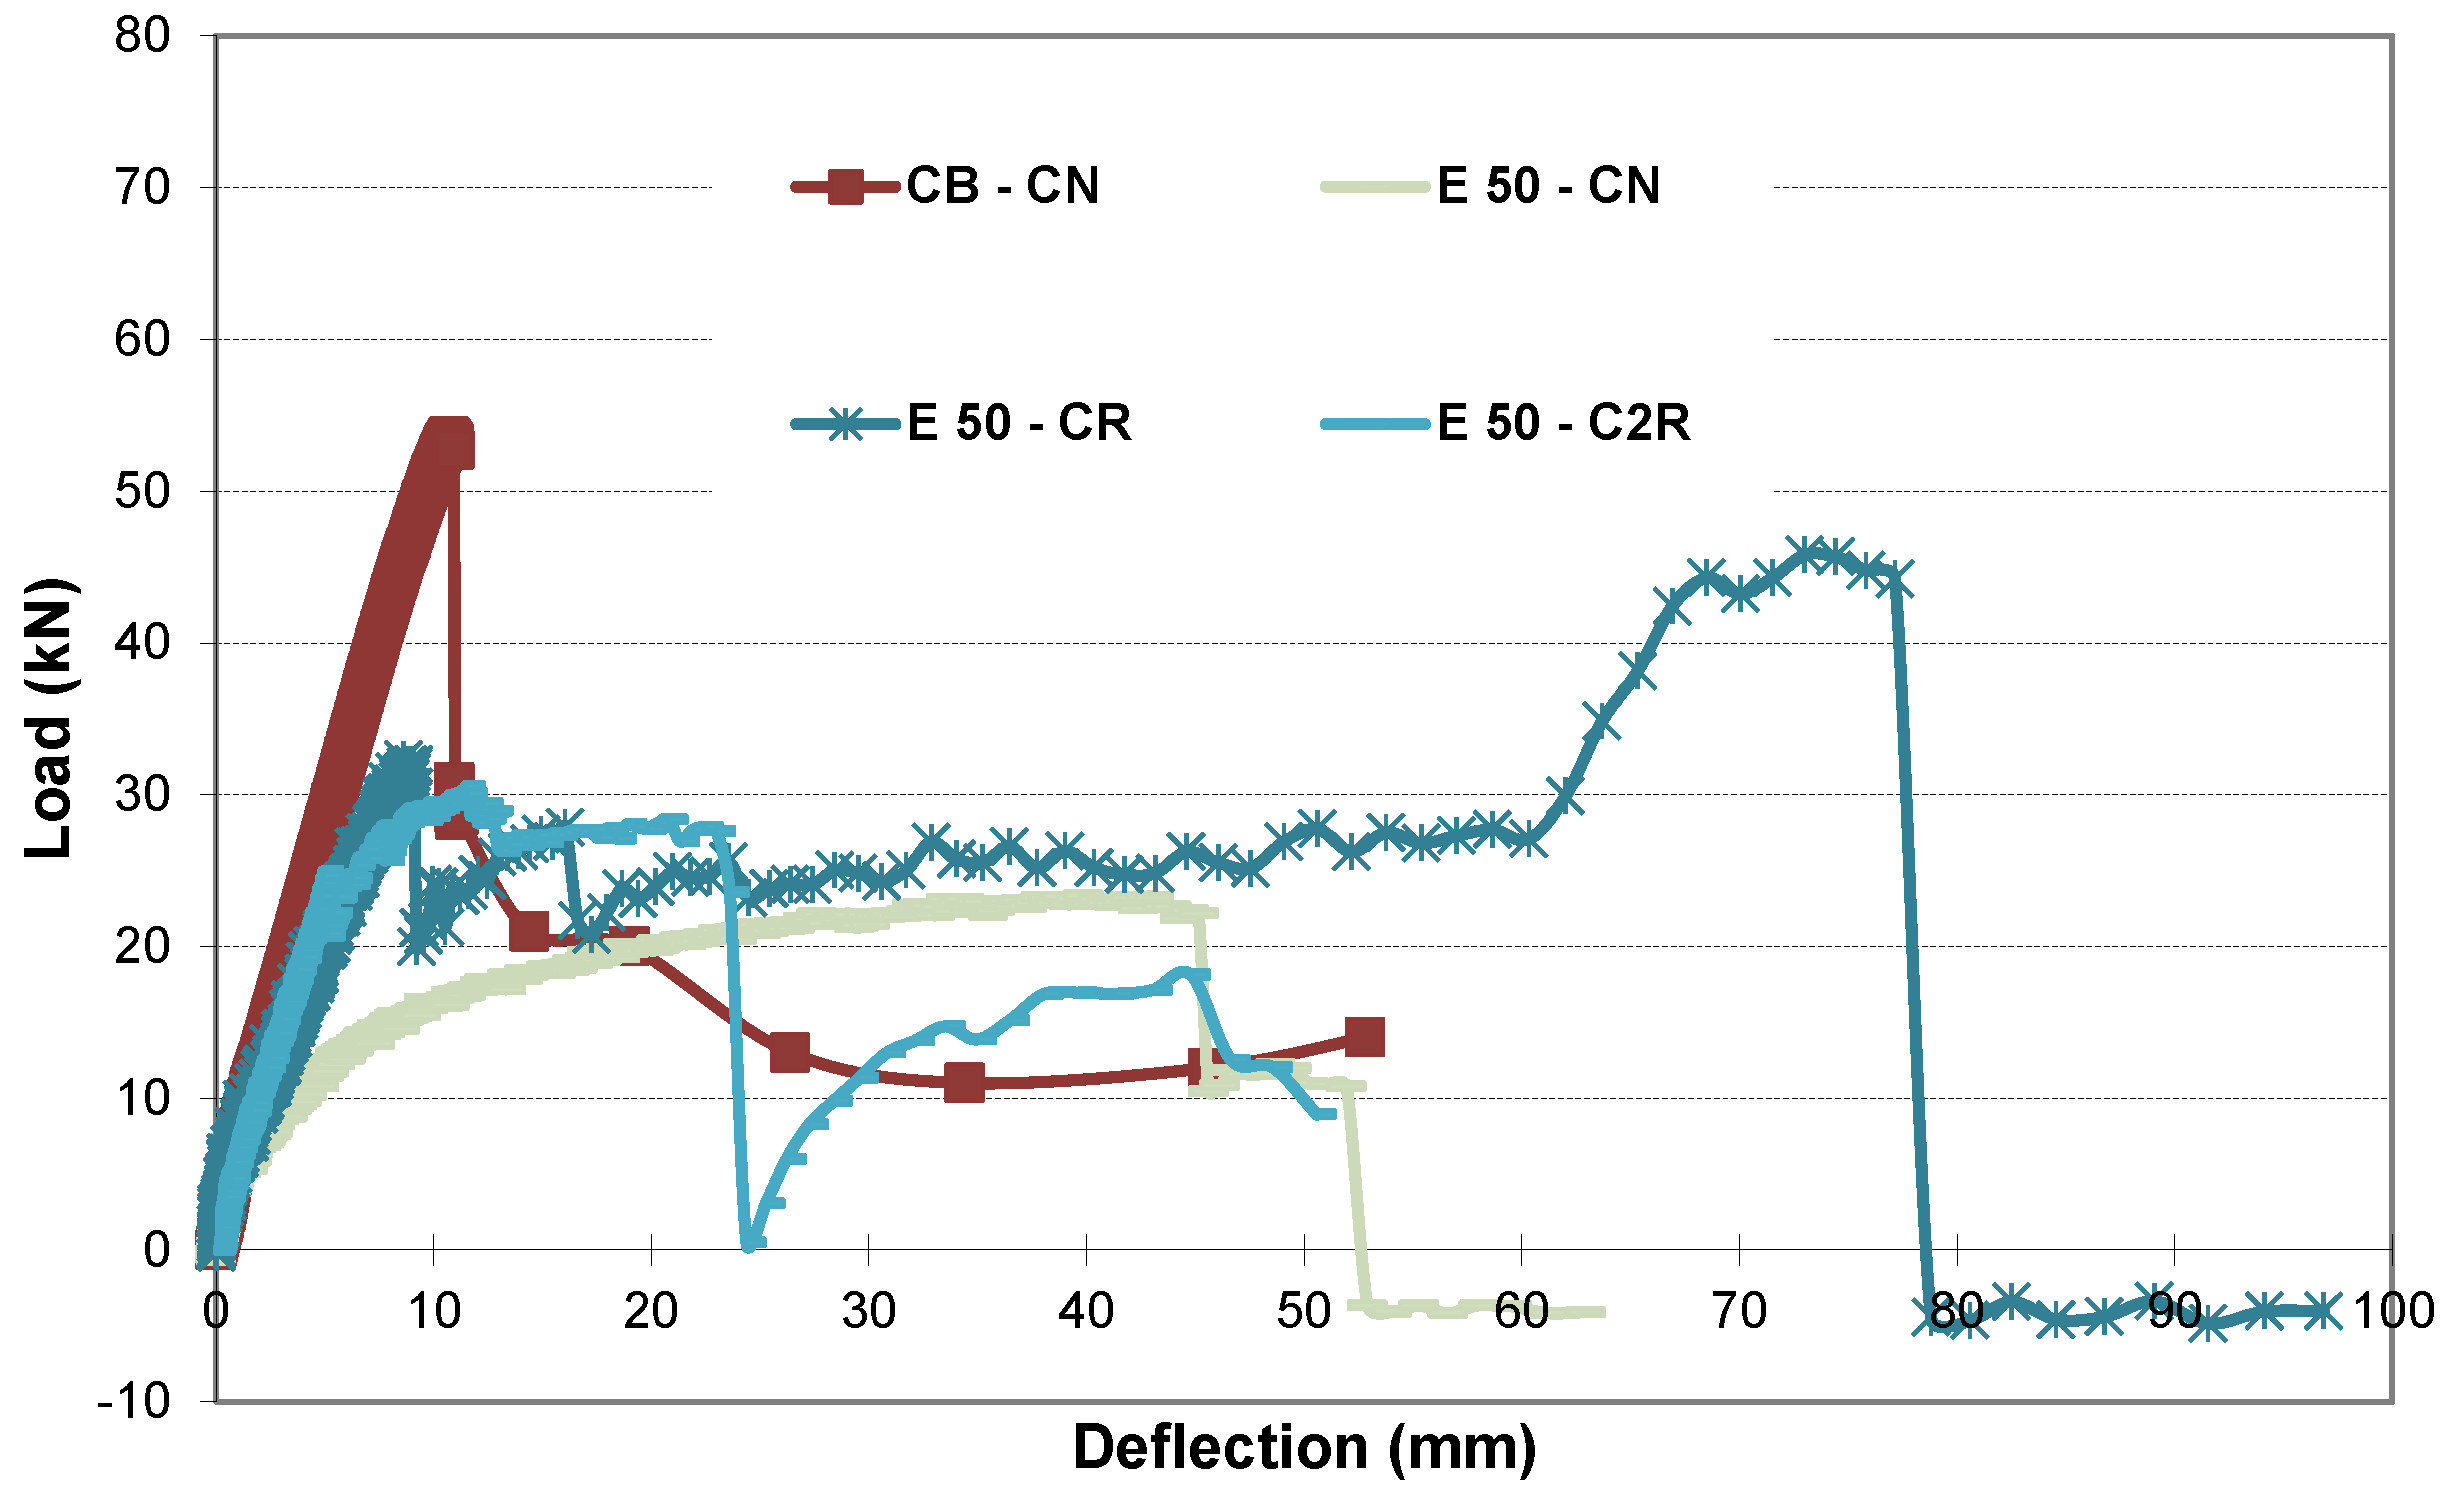
Figure 29. Load-deflection of control beam and beams with 50% corrosion level.

4. Conclusions

This research work investigated the effect of actual (non-uniform) and simulated (uniform) corrosion and repair on the performance of reinforced SCC members. Various corrosion levels up to 50% were produced and were studied. A number of cases were studied: (1) the corrosion was either experimentally induced or was simulated by using rebars with equivalent steel area to reinforce the concrete members; (2) It was assumed that the cover was lost in some of the corroded members due to the deterioration in the RC member. When the concrete cover was assumed to be lost, members were constructed without cover and then the cover and beam were repaired. SCC used to cast all of the beams had 10% RAP; (3) To restore the capacity of deteriorated members, the RC members were repaired using both CFRP sheets and U-wraps. For high corrosion levels such as 40% and 50%, two layers of sheet were also applied. All the beams were tested under two static line loads at the mid-span until failure. The conclusions are as follows:
  • Level of corrosion was found not to affect the cracking load.
  • Increasing the corrosion levels results in reduction of the load carrying capacity of the RC member. Also, the member becomes more ductile.
  • Repair using both CFRP sheet and U-wraps was found to be effective. The repair improved the load carrying capacity of the RC member. Also, it may make the member become more ductile.
  • It was found that the non-uniform change in cross section due to corrosion results in a different load carrying capacity and ductility in the RC member than when a constant reduction in rebar cross-sectional area is assumed.
  • It seems that it is conservative to model the corrosion by using the equivalent area of steel (simulated) for 20% and smaller corrosion levels. Beyond the 20% corrosion level, the simulated cases over-predict the load capacity and stiffness of the actual corroded RC member.
  • If an RC member experienced loss of cover and 10% corrosion level and was repaired by adding a new cover and applying CFRP, the repaired beam can perform even better than a repaired beam that had the same corrosion level, but still had the concrete cover intact. However, if corrosion level exceeded 10%, the repaired beam that lost its concrete cover may have a load carrying capacity that is lower than that of the repaired beam with cover by about 32%.
  • Increasing the number of layers of CFRP sheets may sound like a good idea to restore the capacity of a severely deteriorated RC member. However, it was found that the number of CFRP layers may not improve the load capacity beyond that achieved when one layer was used. However, it may improve the ductility of the RC member.
  • CFRP remains a costly option so further research is needed to reduce the cost of CFRP. One alternative is to use waste carbon fiber to produce CFRP sheets.

Author Contributions

The two authors contributed equally to this research. Ahmed Abdel-Mohti and Hui Shen wrote the paper.

Conflicts of Interest

The authors declare no conflict of interest.

References

  1. Bamforth, P.B. Enhancing reinforced concrete durability: Guidance on selecting measures for minimizing the risk of corrosion of reinforcement in concrete. In Concrete Society Technical Report; The Concrete Society: Camberley, UK, 2004. [Google Scholar]
  2. Liu, Y.; Weyer, R.E. Modeling of time-to-corrosion cracking in chloride contaminated reinforced concrete structures. ACI Mater. J. 1998, 95, 675–681. [Google Scholar]
  3. Oh, B.H.; Kim, K.H.; Jang, B.S. Critical corrosion amounts to cause cracking of reinforced concrete structures. ACI Mater. J. 2009, 106, 333–339. [Google Scholar]
  4. Kim, K.H.; Jang, S.Y.; Oh, B.H. Modeling mechanical behavior of reinforced concrete due to corrosion of steel bar. ACI Mater. J. 2010, 107, 106–113. [Google Scholar]
  5. Williamson, S.J.; Clark, L.A. Pressure required to cause cover cracking of concrete due to reinforcement corrosion. Mag. Concr. Res. 2000, 52, 455–467. [Google Scholar] [CrossRef]
  6. Buenfeld, N.R.; Davies, R.; Karimi, A.R.; Gilbertson, A. Intelligent Monitoring of Concrete Structures; CIRIA Report C661; CIRIA: London, UK, 2008. [Google Scholar]
  7. Glass, G.K.; Buenfeld, N.R. The presentation of the chloride threshold level for corrosion of steel in concrete. Corros. Sci. 1997, 39, 1001–1013. [Google Scholar] [CrossRef]
  8. Anderson-Wile, A.M.; Wile, B.M.; Wen, Q.; Shen, H. Corrosion at the Polymer-Metal Interface in Artificial Seawater Solutions. Int. J. Corros. 2012, 8. [Google Scholar] [CrossRef]
  9. Suda, K.; Misra, S.; Motohashi, K. Corrosion products of reinforcing bars embedded in concrete. Corros. Sci. 1993, 35, 1543–1549. [Google Scholar] [CrossRef]
  10. Li, H.; Englund, K. Recycling of carbon fiber-reinforced thermoplastic composite wastes from the aerospace industry. J. Compos. Mater. 2016. [Google Scholar] [CrossRef]
  11. Shin, Y.S.; Lee, C. Flexural behavior of RC beams strengthened with carbon fiber-reinforced polymer laminates at different levels of sustaining load. ACI Struct. J. 2003, 100, 231–239. [Google Scholar]
  12. Nanni, A. Carbon FRP Strengthening: New Technology Becomes Mainstream. Concr. Int. Des. Constr. 1997, 19, 19–23. [Google Scholar]
  13. Green, P.S.; Boyd, A.J.; Lammert, K. Structural evaluation of impact damaged prestressed concrete I girders repaired with FRP materials. In CFRP Repair of Impact-Damaged Bridge Girders; BC-354 RPWO #55; Department of Transportation: Tallahassee, FL, USA, 2004. [Google Scholar]
  14. Klaiber, F.W.; Wipf, T.J.; Russo, F.M.; Paradis, R.R.; Mateega, R.E. Field/Laboratory Testing of Damaged Prestressed Concrete Girder Bridges; Iowa DOT Report HR-397; Iowa State University: Ames, IA, USA, 1999. [Google Scholar]
  15. Di Ludovico, M. Experimental Behavior of Prestressed Concrete Beams Strengthened with FRP; Report CIES 03-42; University of Missouri: Rolla, MO, USA, 2003. [Google Scholar]
  16. ElSafty, A.; Graeff, M. The Repair of Damaged Bridge Girders with Carbon Fiber Reinforced Polymer (CFRP) Laminates; Final Report; FDOT Contract # BDK82 977-03; University of North Florida: Jacksonville, FL, USA, 2012. [Google Scholar]
  17. Abdel-Mohti, A.; Shen, H.; Khodair, Y. Characteristics of Self-Consolidating Concrete with RAP and SCM. J. Constr. Build. Mater. 2015, 102, 15. [Google Scholar] [CrossRef]
  18. Ibrahim, A.; Mahmoud, E.; Khodair, Y.; Patibandla, V. Fresh, mechanical, and durability characteristics of self-consolidating concrete incorporating recycled asphalt pavements. J. Mater. Civ. Eng. 2014, 26, 668–675. [Google Scholar] [CrossRef]
  19. Hossain, K.M.A.; Lachemi, M. Fresh, mechanical, and durability characteristics of self-consolidating concrete incorporating volcanic ash. J. Mater. Civ. Eng. 2010, 22, 651–657. [Google Scholar] [CrossRef]
  20. Khatib, J.M. Performance of self-compacting concrete containing fly ash. Constr. Build. Mater. 2008, 22, 1963–1971. [Google Scholar] [CrossRef]
  21. Ozawa, K.; Maekawa, K.; Kunishima, H.; Okamura, H. Performance of concrete based on the durability design of concrete structures. In Proceedings of the 1989 2nd East-Asia-Pacific Conference on Structural Engineering and Construction, Chiang Mai, Thailand, 11–13 January 1989.
  22. Petersson, O. Application of Self-Compacting Concrete for Bridge Castings; Swedish Cement and Concrete Research Institute: Stockholm, Sweden, 1998. [Google Scholar]
  23. Khayat, K.H.; Paultre, P.; Tremblay, S. Structural performance and in-place properties of self-consolidating concrete used for casting highly reinforced columns. ACI Mater. J. 2001, 98, 371–378. [Google Scholar]
  24. Lachemi, M.; Hossain, K.M.A.; Lambros, V.; Bouzoubaa, N. Development of cost effective self-consolidating concrete incorporating fly ash, slag cement or viscosity modifying admixtures. ACI Mater. J. 2003, 100, 419–425. [Google Scholar]
  25. Yurugi, M. Application of self-compacting concrete in Japan. In Proceedings of the 23rd OWICS Conference, CI-Premier, Singapore, 25–26 August 1998.
  26. Tobias, P.A.; Trindade, D.C. Applied Reliability; Chapman and Hall: London, NY, USA, 1995. [Google Scholar]
  27. Abdel-Mohti, A.; Shen, H. Strengthening of Corroded Reinforced SCC-RAP Members with CFRP; MDPI: Basel, Switzerland, 2016. [Google Scholar]

Article Metrics

Citations

Article Access Statistics

Multiple requests from the same IP address are counted as one view.