Abstract
A new type of reinforcement for unidirectional natural fiber composites has been developed, where a paper layer is assembled with a layer of unidirectional flax yarns. The paper layer chemically and mechanically bonds to the loose yarns to maintain their alignment and enables better manipulability of the reinforcement during stacking in the mold. Unfortunately, the paper layer adversely affects the permeability of the whole reinforcement to liquid resin and thus limits the impregnation quality of the final part. In this paper, a technique is adopted to increase the impregnation performance by modifying the architecture of the fibrous network in the paper layer. In particular, a method has been developed to replace a proportion of the Kraft fibers by short flax fibers in the paper layer, in an attempt to open the structure and increase the paper permeability. Permeability measurements show a major improvement in global reinforcement permeability. Basic mechanical properties of resulting composites were also analysed. Results show a slight decrease in modulus and strength when the paper layer is present. This is compensated by an important reduction in variability. Furthermore, increasing the flax proportion in the paper layer limits the loss of mechanical properties, while reducing variability even further.
1. Introduction
The resin transfer molding (RTM) process is typically used to produce large structural parts where the resin must flow long distances in the fibrous reinforcement [1]. In this process, the reinforcement is placed in a rigid mold and the resin is injected to impregnate the fibers. The reinforcement is initially dry and often assembled outside the mold, typically by stacking several layers of fiber mats or fabrics [2,3,4,5].
Just like synthetic fibers, for natural fibers applications where the design objective is to maximize mechanical properties, UD yarns are used instead of mats. In this case the yarns are aligned and stacked such that the stiffness and strength of the composite part are optimally distributed. The manipulability of the loose yarns and the integrity of their orientation under forces induced by RTM resin flow can become problematic. To cope with this, further processing is used to maintain cohesion among UD yarns, typically by weaving or stitching [6,7]. Not only do these processes induce further costs, but they are also known to negatively impact mechanical properties: weaving induces local fiber curvatures while stitching locally destructs fiber integrity [6,7]. After being chemically treated and combed, natural fibers must further be twisted in the form of yarns. Twisting is essential to provide individual yarn’s strength [8,9,10]. The twist level must be limited to small values as it generally decreases the reinforcement’s permeability [11]. This property is affected by other process parameters, among which the liquid type, the preform porosity and the fiber wettability are important ones [12]. From a manufacturing point of view, permeability also affects the mold filling time [13,14,15]. In the end, permeability affects quality since poor impregnation leads to voids’ formation in the part [16,17,18], hence decreasing expected mechanical properties.
To avoid the above drawbacks, a new type of reinforcement has been proposed [19]. It uses a thin paper layer for binding UD flax yarns. A reinforcement’s cohesion is maintained by the paper layer and very low twist levels can be used. The paper layer also maintains the yarns well aligned and as a result the variability in the measured mechanical properties was reduced, while the tensile strength and modulus were maintained at high values. Unfortunately, it was also observed that the presence of a paper layer considerably reduced the resin flow rate during injection. In fact, the paper layer was shown to be the least permeable constituent and its presence negatively affected the impregnation performance of the reinforcement as a whole [19].
The aim of this work is to investigate how to modify the structure of the fibrous network in the paper layer in order to increase the impregnation capacity. In particular, a portion of the Kraft fibers used in the previous study is substituted by short flax fibers in an attempt to open up the fibrous structure while at the same time homogenizing fiber types and maintaining basic mechanical properties. Selected material and process parameters were studied to see how they affect the fiber structure in the paper layer and how this translates into improvements in global reinforcement permeability.
2. Materials and Methods
2.1. Fabrication of the Flax-Kraft Paper Layer and UD Flax Layer
Short flax fibers consisted of untreated Tex5000 flax fiber strands, provided by Safilin Inc., Sczytno, Poland. They were precisely cut in 5 and 10 mm lengths. A batch of each fiber length was individually blended in the desired proportion with Kraft pulp at 10% of consistency, and the resulting mixture was blended in water for 5 minutes using a vertical agitator. The different initial weights are summarized in Table 1. The first column presents the total weight of the mixture (TWM). Then comes the surface density of the produced paper layer (SDpaper) along with its standard deviation (STDVSD).

Table 1.
Characteristics of the different paper layers used in the experiments.
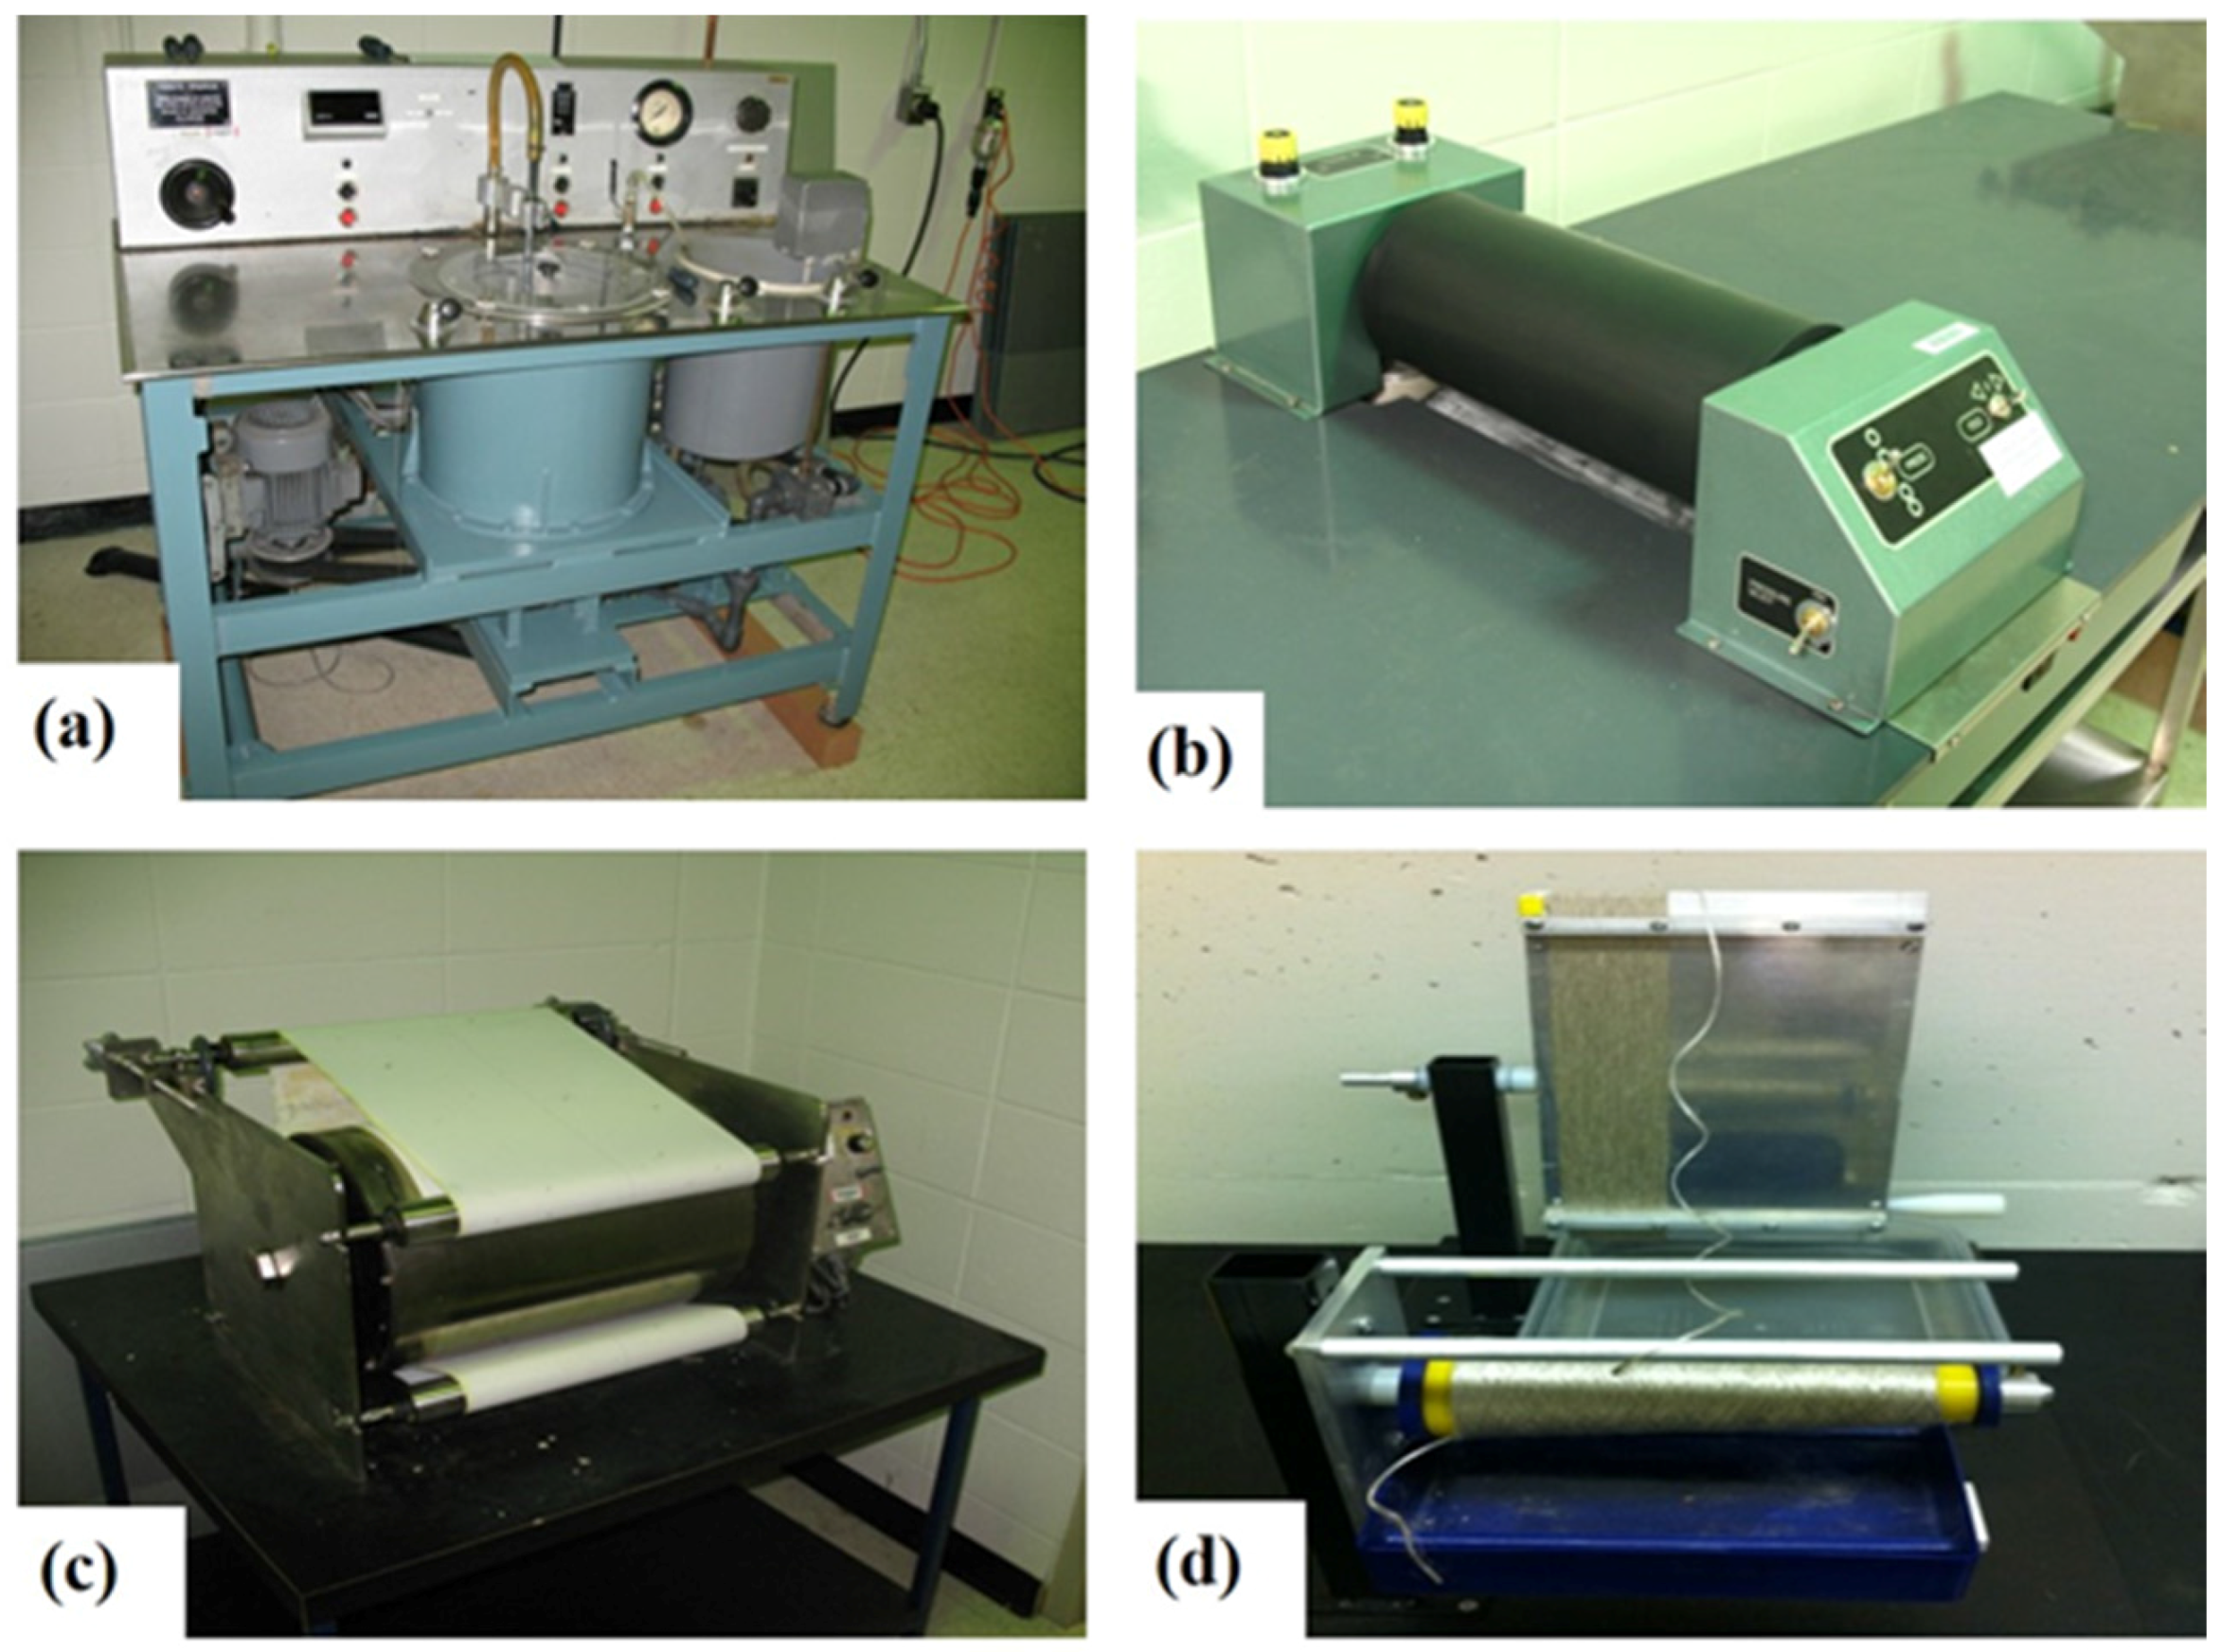
The paper layer is formed in three steps. First, a dynamic sheet former is used (Figure 1a). The fiber slurry with desired consistency is stored in the on-board tank and the mixture is pumped up to the projection nozzle located inside the spinning drum. The mixture is sprayed across the width of the forming wire through the nozzle moving up and down with a constant speed for a specific number of cycles, finally giving a thin and wet paper layer of uniform surface density. This process is well suited for making wet sheets with Kraft pulp. The process had to be adapted for processing flax fibers.

Figure 1.
Equipment used for the reinforcement fabrication. (a) dynamic former; (b) press; (c) dryer and (d) alignment apparatus for the UD flax layer.
In the second step excess water in the wet paper sheet is extracted using a sheet press (from CanPa® Instruments, Greenfield Park, Quebec, Canada) as shown in Figure 1b. Finally, the paper sheet is dried using heated dryer rolls (Fornax Drum Dryer from Adirondack Machine Corporation, Queensbury, NY, USA) in a third separate step (Figure 1c).
Figure 1d shows the custom-made setup used to prepare the UD flax layer. Tex200 flax yarns are wound side by side around a flat plate until the desired width is obtained. The flax layer is then sprayed with water and dried at room temperature. This wetting-drying step allows the fibers to chemically bond slightly together, making the loose yarns’ layer easier to manipulate for the final assembly of the reinforcement, which is detailed next.
2.2. Reinforcement Samples Preparation
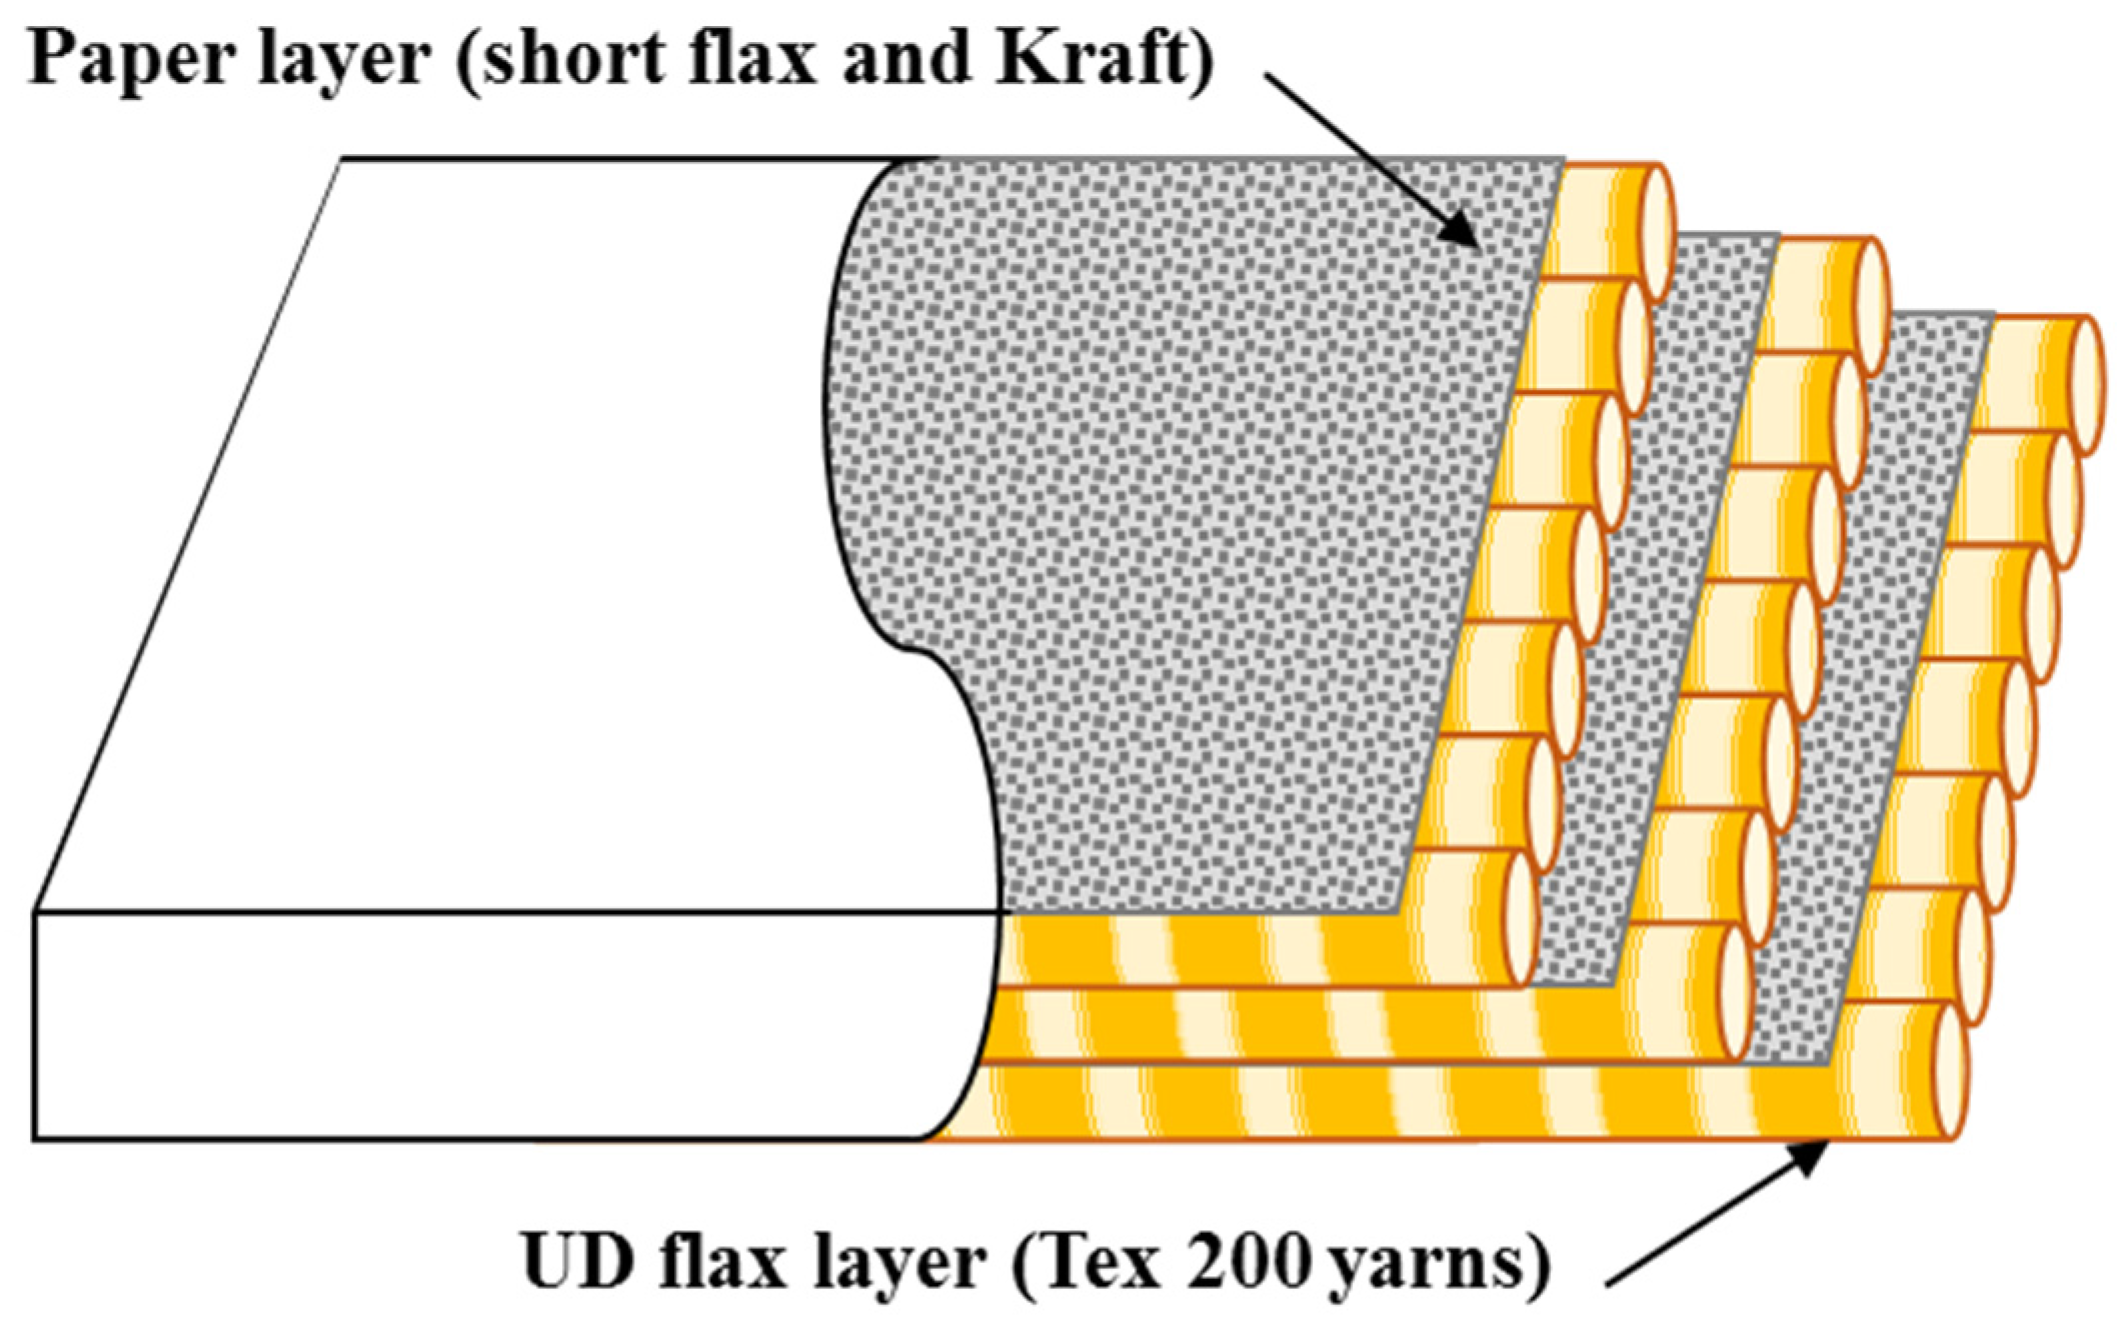
The reinforcement samples are assembled by stacking a paper layer with a UD flax layer. The reinforcement specimens used in the permeability measurements were cut in 150 × 150 mm2 samples using a paper shear cutter to ensure straight edges and avoid gaps on each side of the sample. Three layers of flax and three layers of paper were stacked for the permeability tests, with UD flax layers oriented at 0°, according to the stacking sequence shown in Figure 2.

Figure 2.
Stacking sequence of reinforcement sample.
The surface density of the three UD flax layers is assumed to be the same for all permeability samples, and stands at an average of 127 (g/m2). After the three layers of reinforcement are stacked, a 10 mm diameter circular hole is punched in the middle of the sample, as required by the radial flow permeability test.
Different paper layers and reinforcement samples were manufactured according to the full factorial design of the experiment presented in Table 2. Three levels of surface density (Table 1), two levels of fiber length (5 mm and 10 mm), and four levels of total flax proportions (0%, 25%, 50%, 75%) were used, yielding a total of 24 experiments. Paper layer thickness and planar permeability, as well as global reinforcement planar permeability, were then measured.
Table 2.
Design of experiments for permeability study.
2.3. Measuring the Reinforcement’s Permeability to Oil
2.3.1. Theoretical Background
The planar UD and radial flow methods are the most popular for permeability measurements. The radial flow method has been used in this research in order to obtain the permeability in the two directions (x and y) simultaneously. The measurement technique and calculations made to determine the permeability values are within the guidelines listed in the Benchmark II [20].
The radial flow method has been used in this research. The impregnation is made from a central injection inlet with a constant injection flow rate or constant injection pressure [3,21]. Darcy’s law relates the flow velocity, the pressure gradient, the fluid viscosity and the fiber preform permeability [4,22,23,24,25]. It may be expressed in the following tensorial form:
where ū is the volume-averaged Darcy velocity, i.e. the velocity one observes on a macroscopic scale, µ the viscosity of the fluid, the pressure gradient, and K the permeability tensor of the porous medium. In the case of orthotropic fabrics, the flow front shape is elliptical and the permeability tensor is in the form [25]:
The permeability components, Kx and Ky, can be obtained using:
where Rx,e is the equivalent radius of the flow front, ΔP the pressure drop, t the elapsed time, the reinforcement porosity, µ the resin viscosity, Ke the effective permeability and Rx0,e the equivalent inlet radius. Once Ke is obtained, the permeability in the x and y directions (Kx and Ky) can be calculated. The calculation details are given in Albert et al. [26].
2.3.2. Permeability Setup
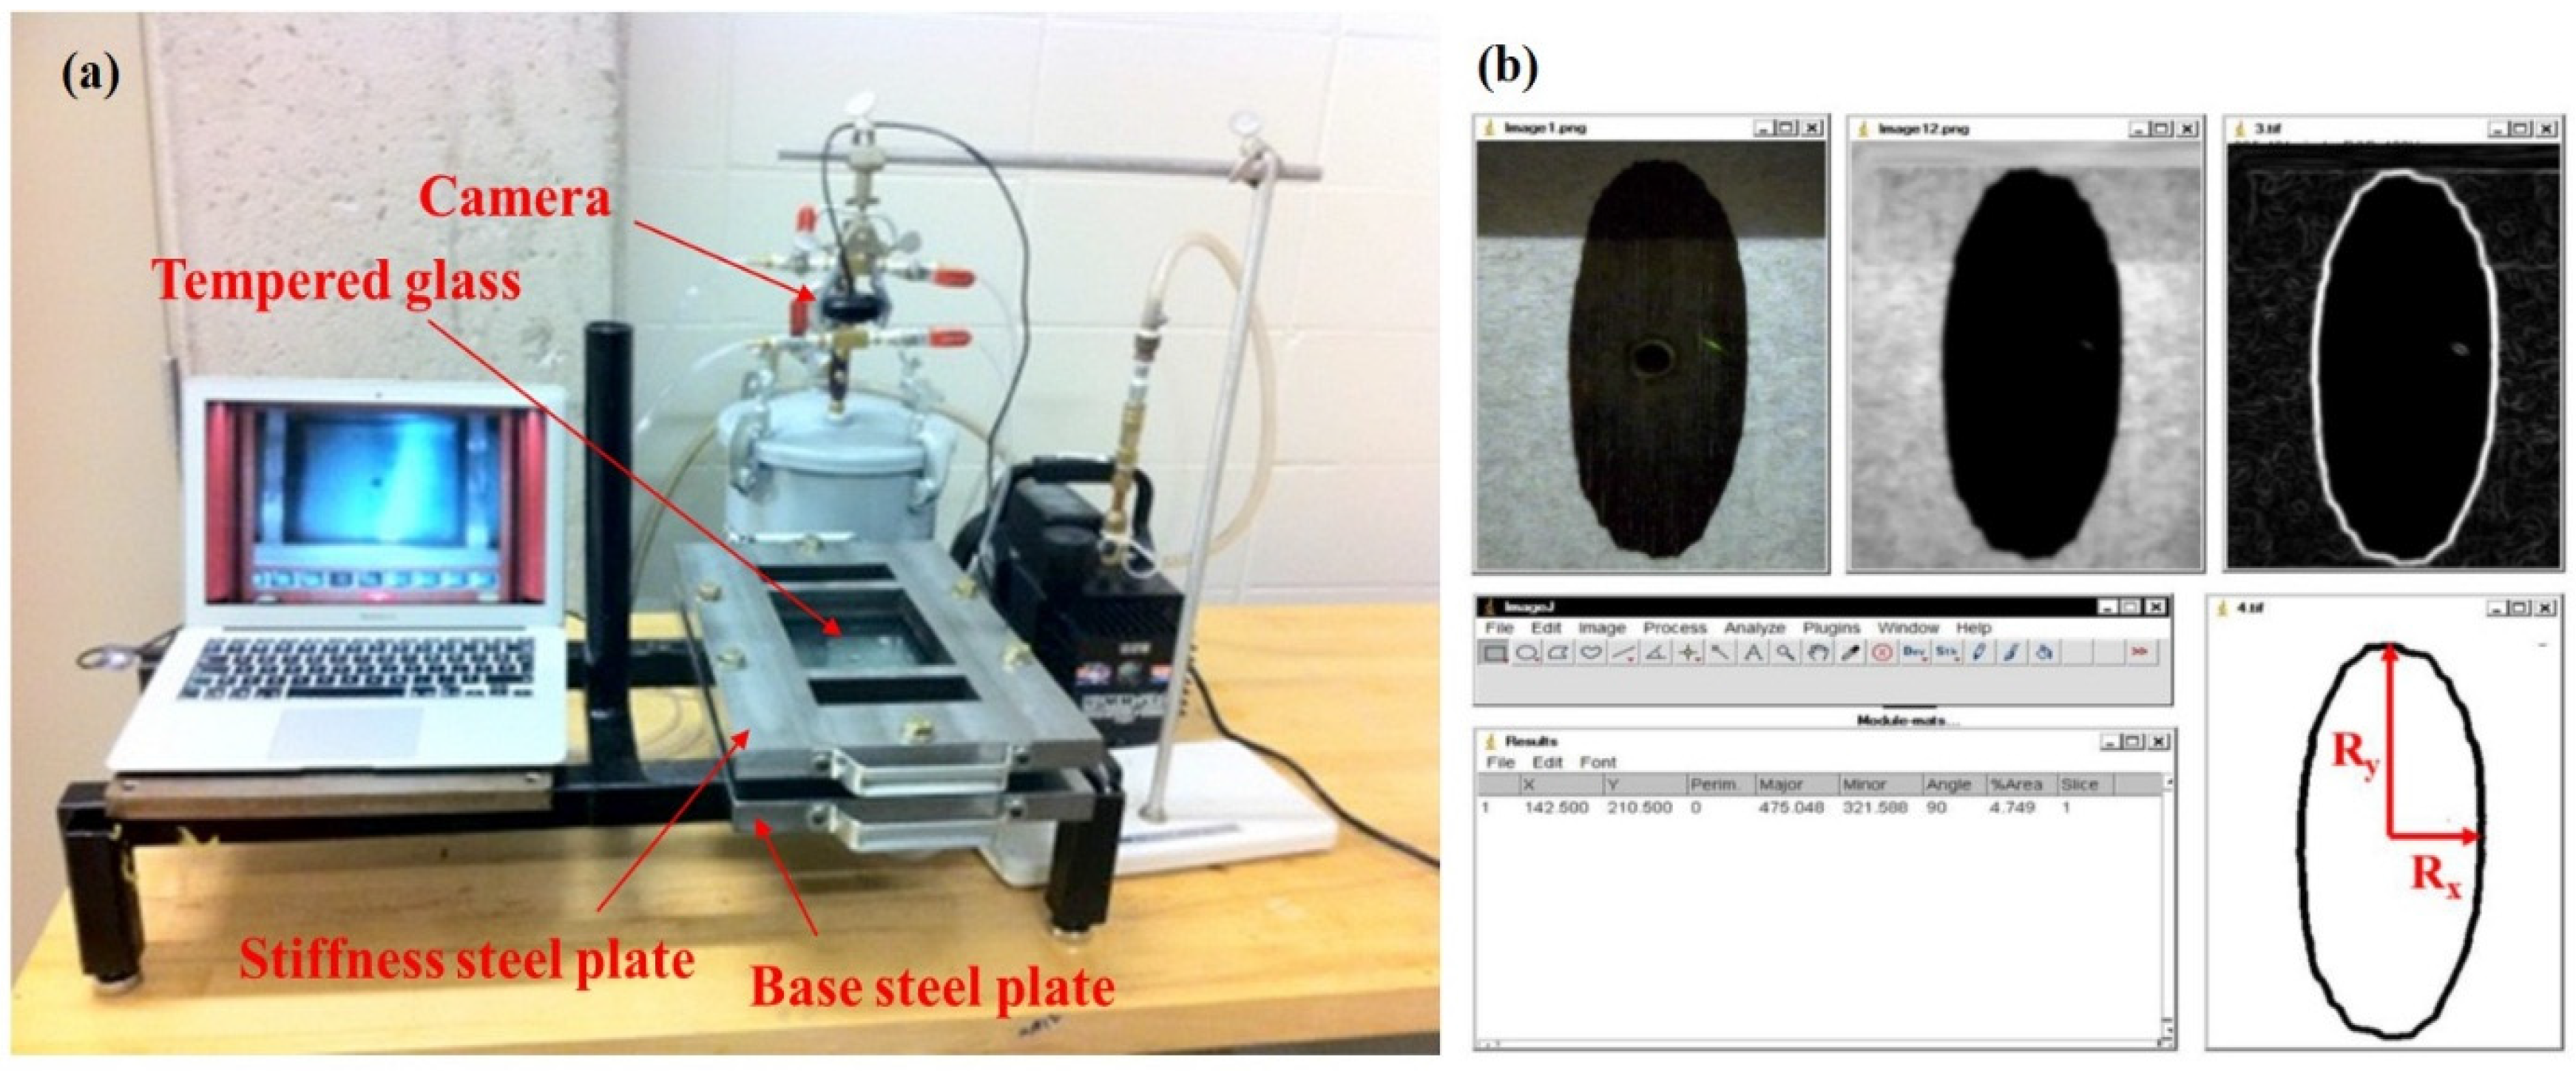
The permeability setup (Figure 3) is made of a 25 mm thick rigid steel plate (420 × 260 mm2) and a transparent 20 mm thick glass plate (370 × 220 mm2). The glass plate is clamped to the steel base by a second 25 mm thick stiffening steel plate having a rectangular opening in the middle (165 × 125 mm2), owing to record the flow front during filling, while preventing the deflection of the glass plate during the experiment.

Figure 3.
(a) Permeability measurement setup; (b) flow front shape and calculation of minor and major axis (Rx and Ry).
The mould cavity thickness is controlled with steel spacers and is sealed with a gasket between the lower steel plate and the glass plate. The seal is slightly thicker than the cavity thickness. This allows it to expand slightly when the screws are tightened to close the mould. This expansion prevents preferential flow of the fluid along the sides of the testing sample by slightly compressing it to avoid any gap between the seal and the sample. The perforated stack of reinforcement is finally compressed inside the mold and the cavity thickness is adjusted to obtain a fiber volume fraction of 35%. The required cavity thickness is calculated according to:
where Vf is the fiber volume fraction, d the cavity thickness, N the number of reinforcement layers, Wf the weight per unit area of the reinforcement, and the fiber density. The test fluid is 5w30 motor oil. The oil viscosity is 458 mPa·s at 20 °C, as measured with a Brookfield viscometer from Brookfield Engineering Inc. The fluid is delivered to the mold through plastic tubes. All tests were performed under 13.26 Psi vacuum using a vacuum pump (model Humm-Vac™ 12 CFM from Easy Composites Ltd, Stoke-on-Trent, UK). The flow front of the permeating oil was recorded with a digital camera at constant intervals of 10 s.
The camera was mounted on a support, placed directly above the mould assembly, and connected to a computer. Using an image-processing technique, the best fit ellipses of the flow front, drawn over time, are used to compute the instantaneous ellipse radiuses Rx and Ry. The equivalent permeability (Ke) is then calculated using Equation (3). Each sample in Table 2 was tested 3 times (i.e., 3 repetitions). For each test, the UD flax fibers were always oriented at 0° with respect to the length of the mold.
3. Results
3.1. Paper Layer Analysis
3.1.1. Effect of Short Flax Fibers on the Paper Layer Structure and Thickness
Paper is a complex material built from chemical and mechanical interactions between a large amount of single fibers, forming a continuous fiber network. Paper sheet thickness builds up by the continuous deposition of individual fibers. Depending on its position, dimensions, and flexibility, each deposited fiber conforms to the underlying structure already in place [27]. The Kraft and flax fibers used in this work (Table 2) present very different properties: length/width ratio, wall thickness, lumen thickness, fiber flexibility, and length distributions. The fiber network structure depends on such properties.
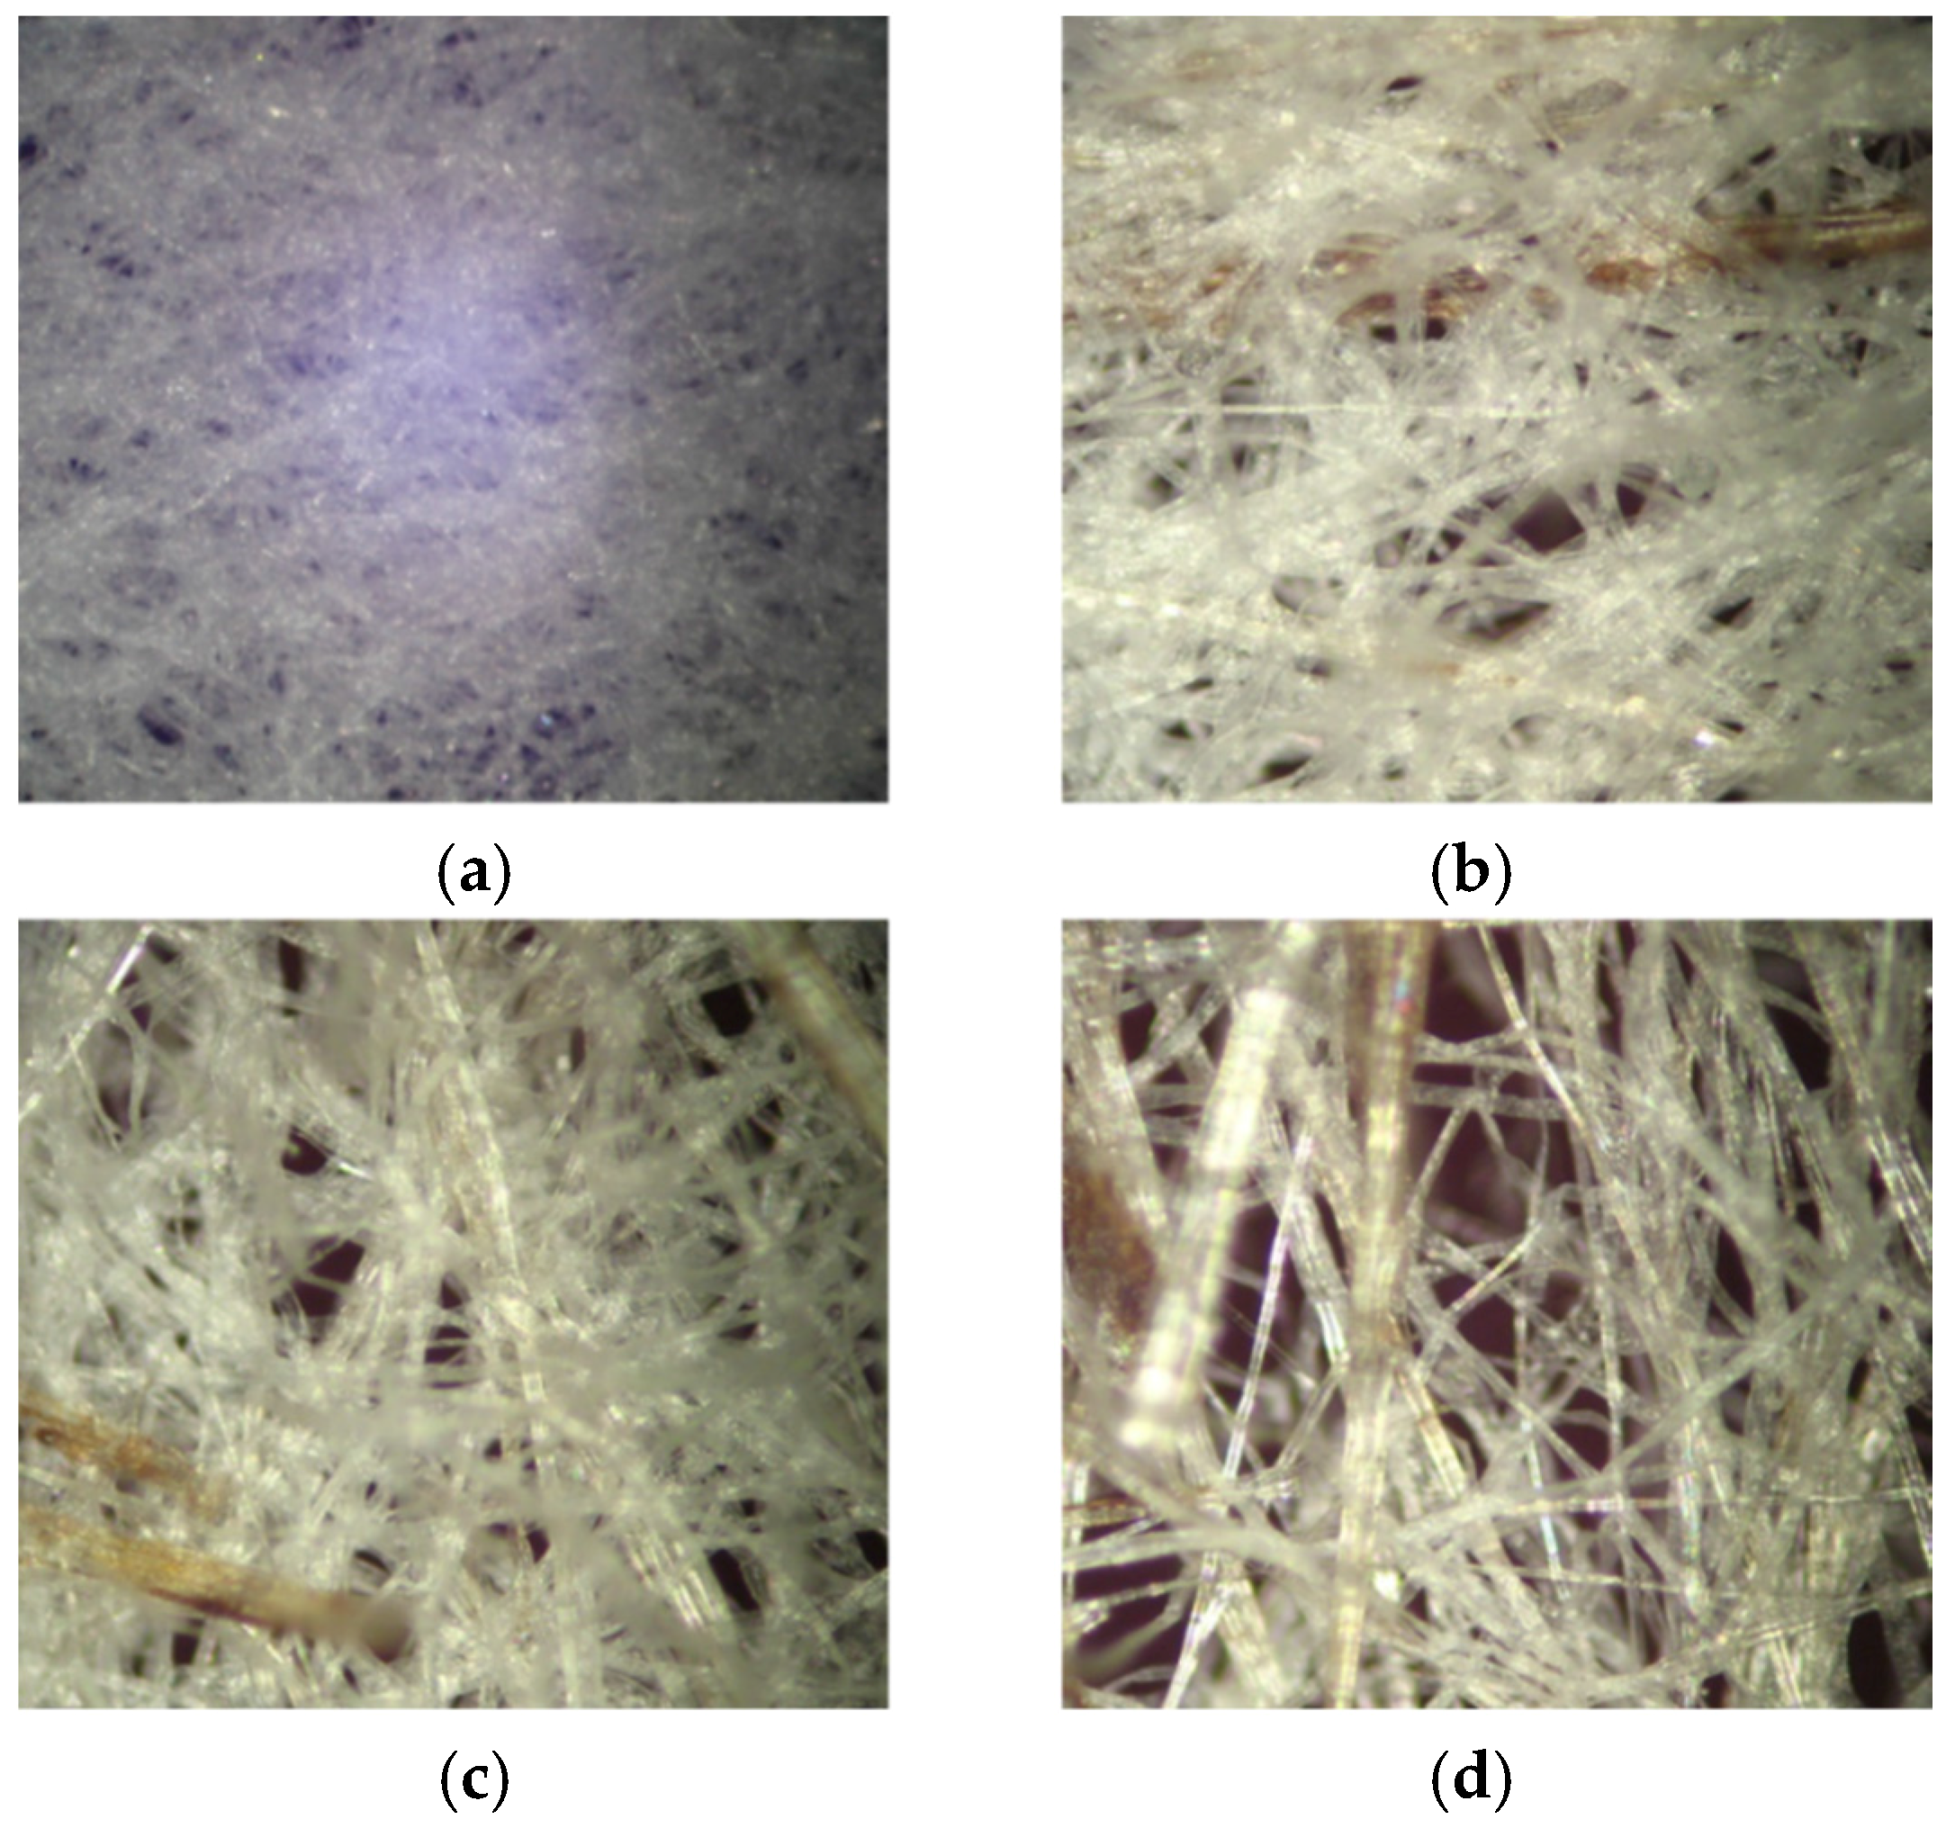
Figure 4 and Figure 5 show several images of the paper layer taken with a microscope connected to a digital camera, all at a level of magnification of 10×. For both fiber lengths it is clear that flax fiber content Wflax affects the fiber network structure. In particular, increasing the flax fiber content increases the inter fiber porosity and a more opened structure is obtained as a result. Two reasons could help explain this. First, flax fibers have a lower flexibility than Kraft fibers. Fiber flexibility determines fiber deformation during compression, which in turn affects inter fiber porosity [27,28]. Second, flax fibers have a thicker cell wall [29] than Kraft fibers [26]. Thinner cell walls will collapse (flatten) more easily and create a network that conforms better under compression forces [30,31].

Figure 4.
Effect of flax fiber (5 mm) content on the fibrous network structure, SD = 28.92 g/mm2. (a) 6g Kraft; (b) 1.5 g Flax (5 mm) + 4.5 g Kraft; (c) 3g Flax (5 mm) + 3 g Kraft; (d) 4.5 g Flax (5 mm) + 1.5 g Kraft.
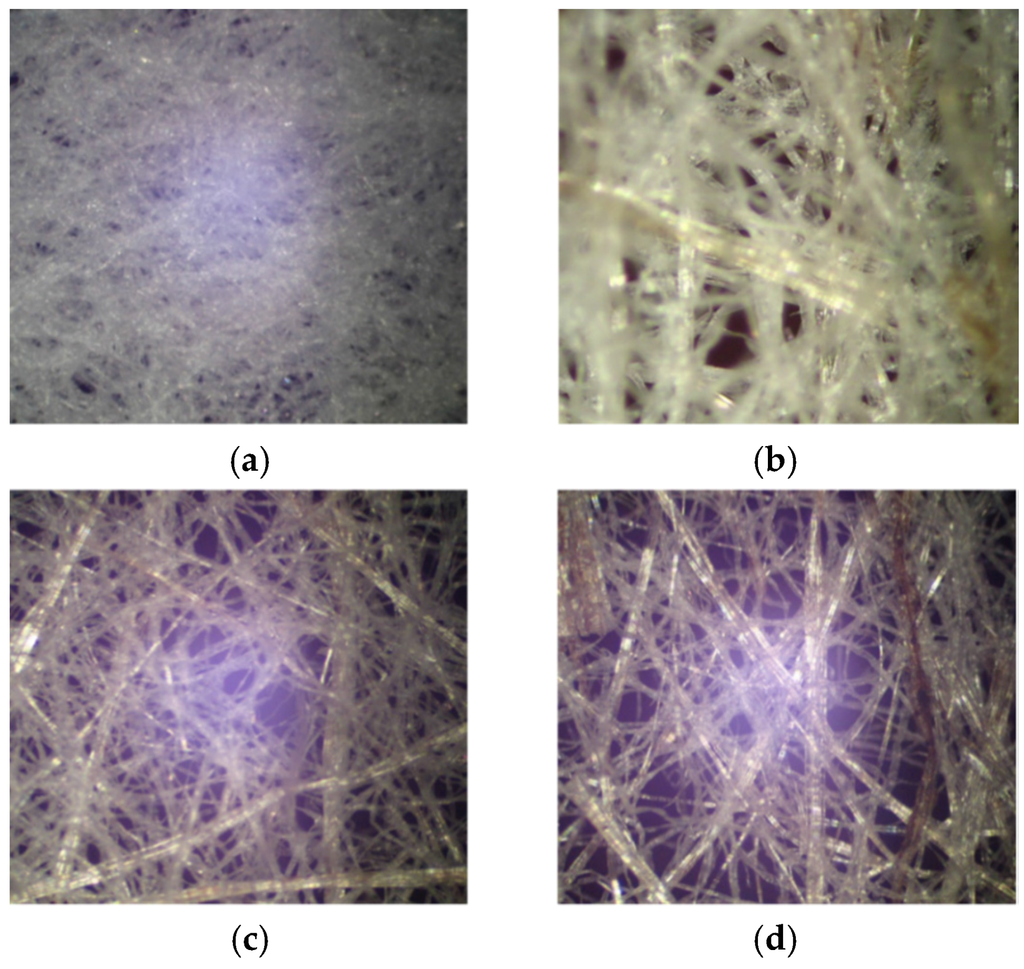
Figure 5.
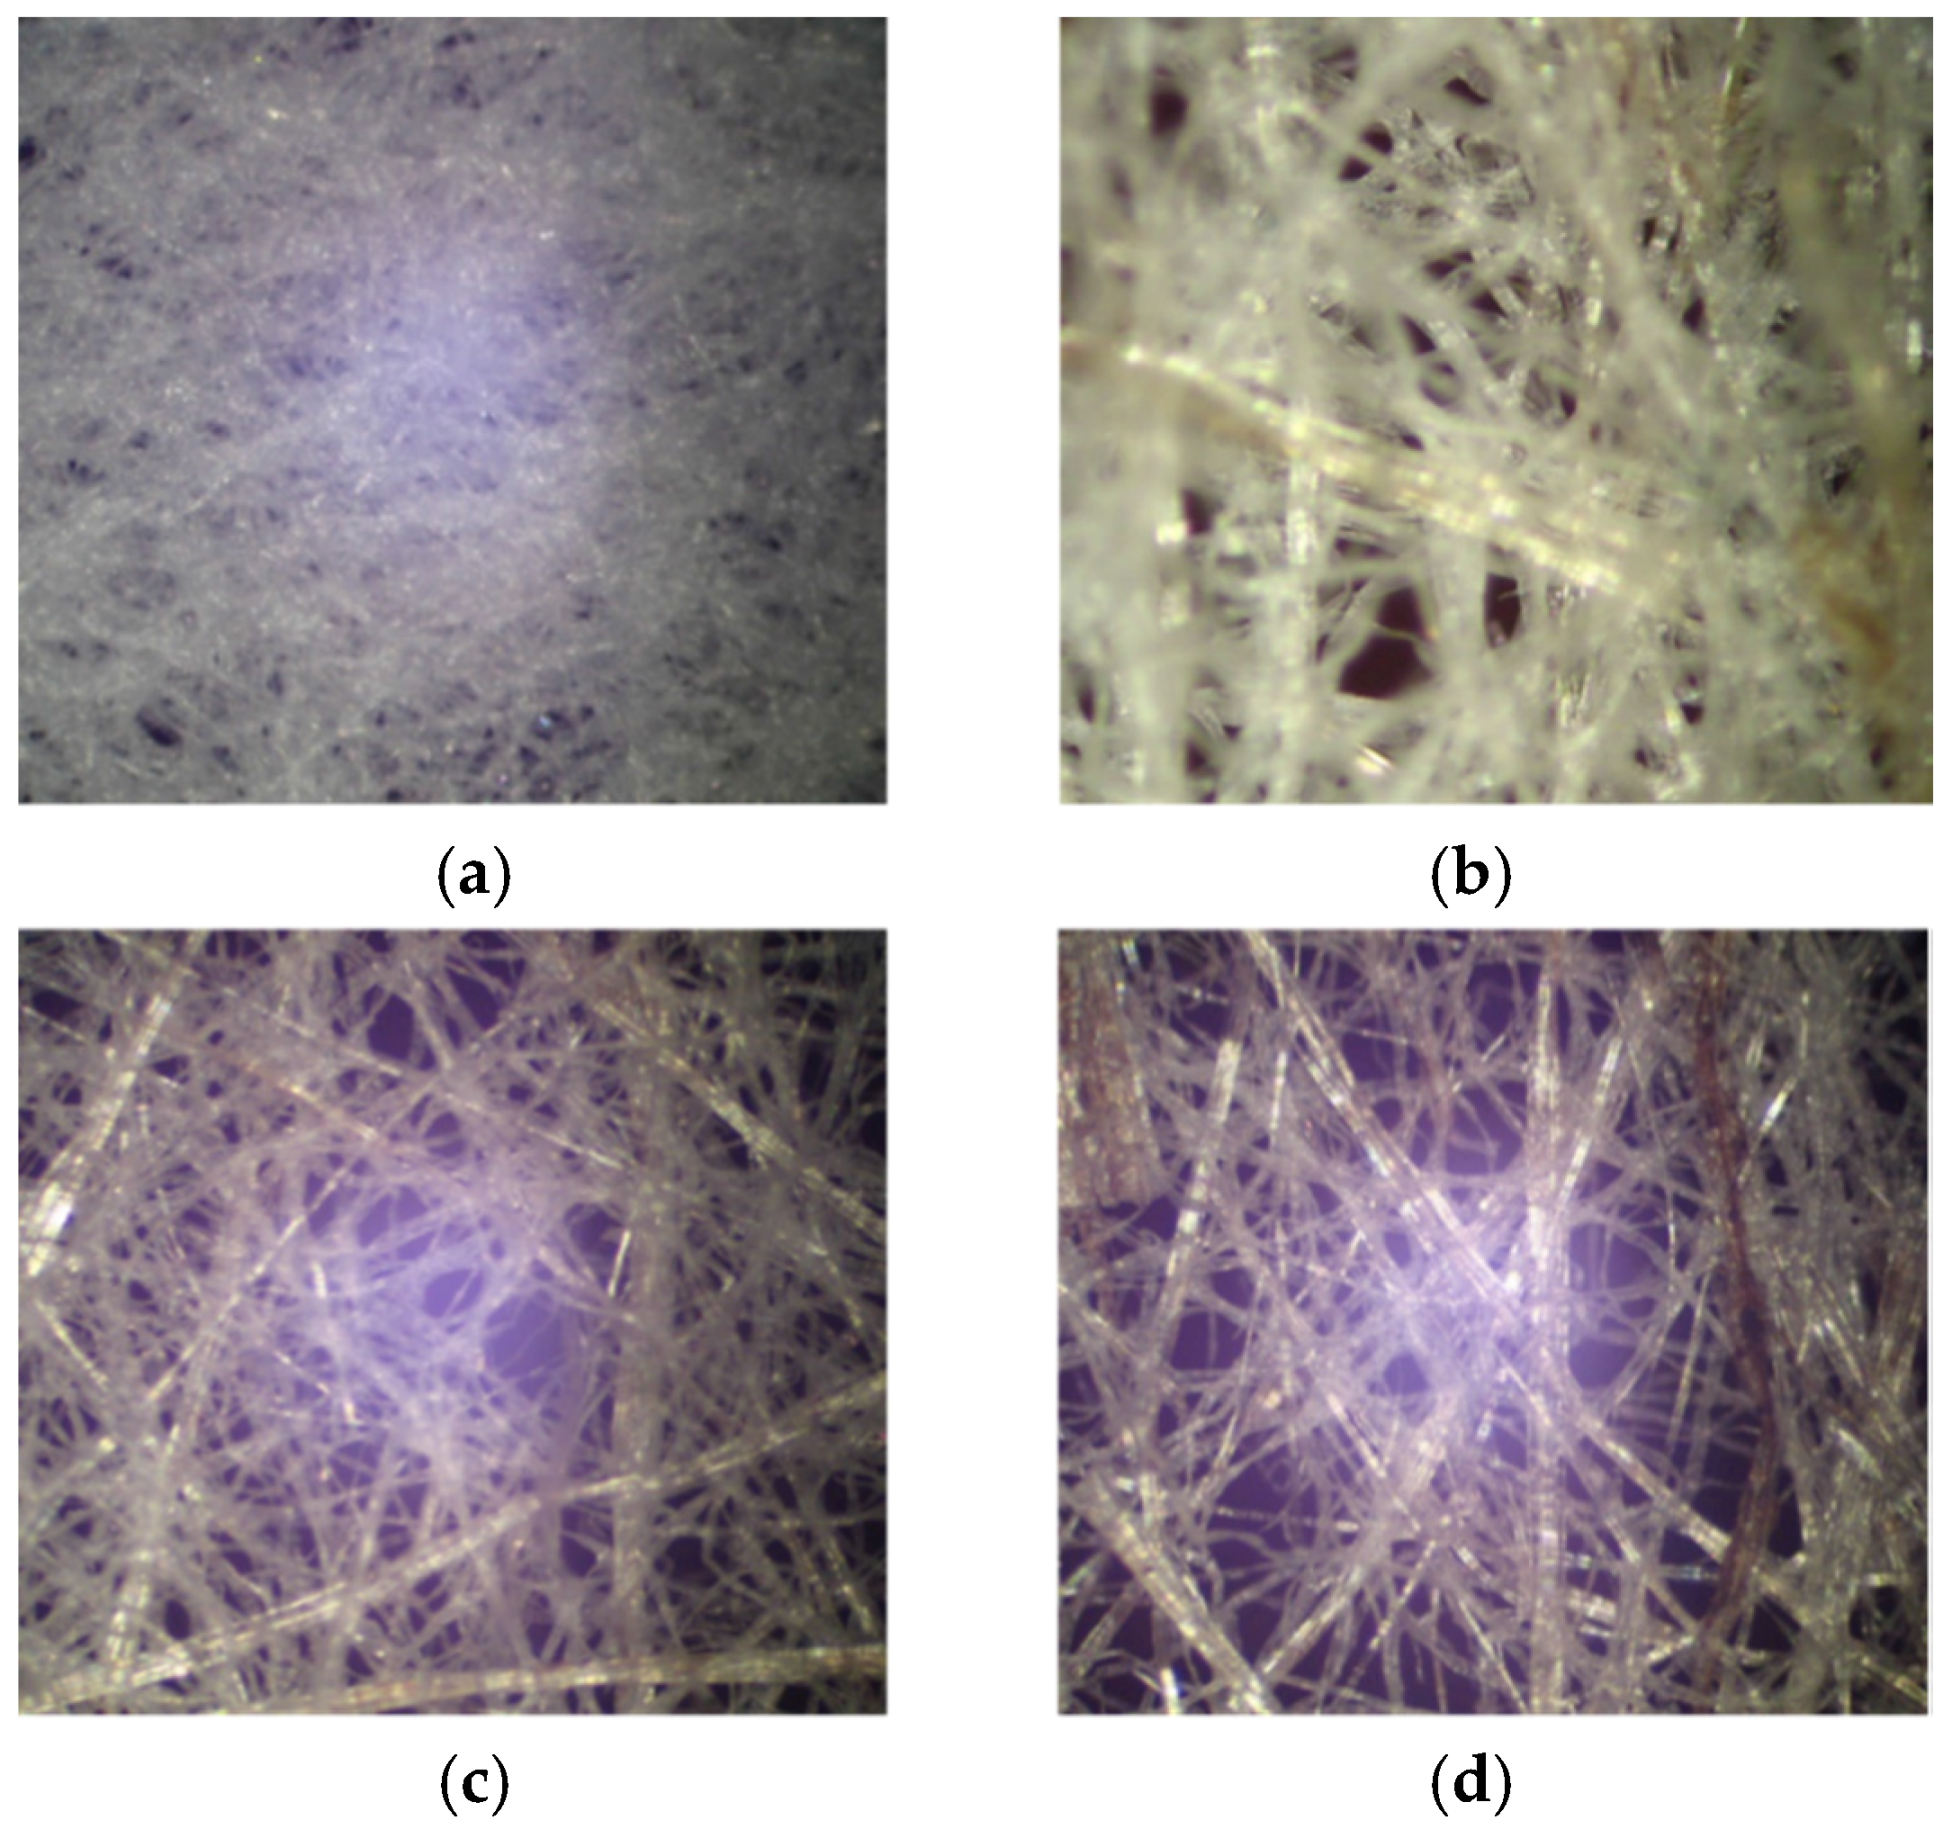
Effect of flax fiber (10 mm) contents on the fibrous network structure, SD = 28.92 g/mm2. (a) 6g Kraft; (b) 1.5 g Flax (10 mm) + 4.5 g Kraft; (c) 3g Flax (10 mm) + 3 g Kraft; (d) 4.5 g Flax (10 mm) + 1.5 g Kraft.
The fiber length determines the initial fiber network properties, and therefore the original number of fiber-to-fiber contact points. It also determines the initial distance between fiber-to-fiber contact points. Consequently, one would expect a relationship between fiber network structure and fiber length [32]. This is visible when comparing Figure 4 and Figure 5: the effects of increasing the flax proportion just described are intensified for longer fibers (10 mm).
Similar images were obtained for SD = 38.21 g/mm2 and SD = 46.58 g/mm2. The same tendencies were observed. Taken together, these results indicate that at equal paper surface density, increasing flax fiber content and flax fiber length both help increase inter fiber porosity. It is well known that the inter fiber porosity of a porous media significantly affects its density and consequently its permeability [33].
Surface density is clearly the dominating parameter for sheet thickness (Figure 6). Generally speaking, a paper sheet made with two types of fibers will be dominated by the characteristics of the fiber having the larger aspect ratio (length/diameter) in the blended furnish [33]. For each mixture, the differences in fiber cell wall thickness and fiber flexibility influenced the compression properties and conformability of the resulting paper sheets, and hence impacted their final thickness [32]. In particular, the larger wall thickness of flax fibers, combined with their lower flexibility, led to increases in paper thickness.
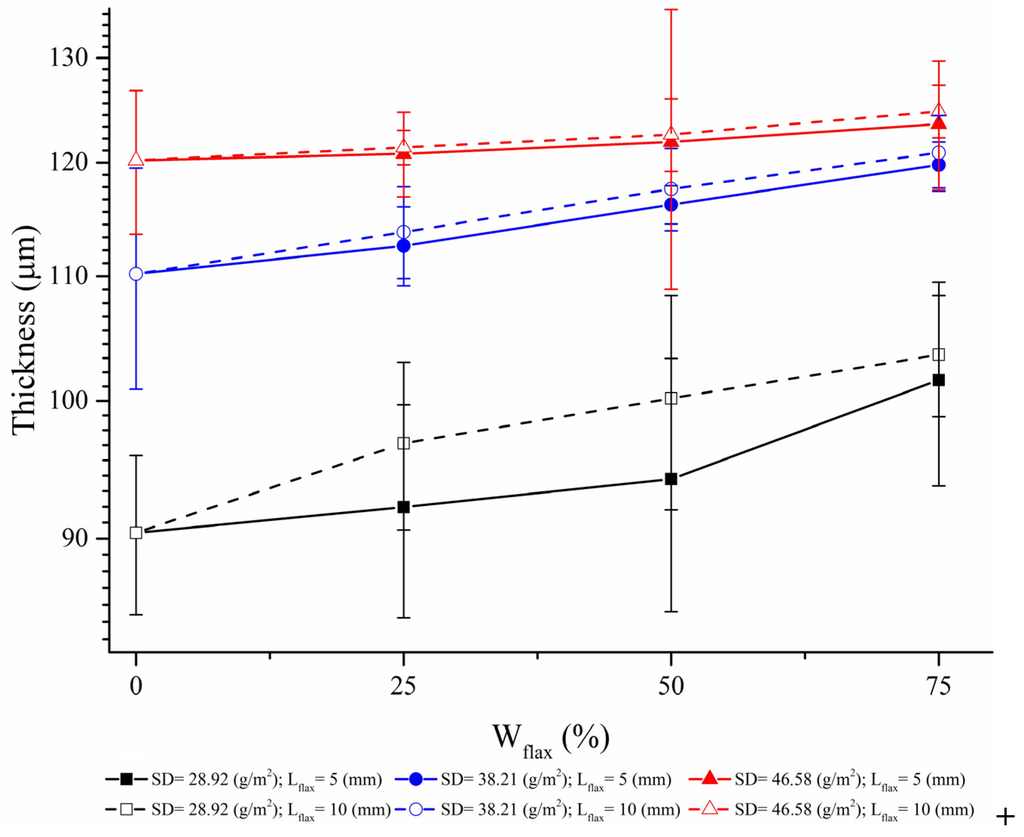
Figure 6.
Effect of short flax fiber content on paper layer thickness.
3.1.2. Paper Layer Planar Permeability
In what follows denotes the planar permeability of the paper layer in the cross direction (CD) and denotes the planar permeability in the machine direction (MD), MD being defined as tangent to the rotating direction of the dynamic former's spinning drum of Figure 1a. Results of the planar permeability measurement are tabulated in Table 3.
Table 3.
Results of planar permeability of paper layers.
At first glance, a significant difference is observed for the planar permeability depending on the flow direction. , the planar permeability in the MD, is higher than , the planar permeability in the CD, by a factor of 1–3 for 5 mm flax fiber and by a factor of 1–4 for 10 mm flax fiber. Due to a velocity gradient in the fiber slurry at the time of deposition on the forming wire, there exists a preferential alignment of the fibers in the MD. This decreases resistance to fluid flow in this direction and increases . On the contrary, the fluid flow perpendicular to this direction is more difficult, which in turn decreases the permeability.
Generally, an increase of the paper surface density decreases the planar permeability in both CD and MD, while an increase in the short flax fiber content has the reverse effect. An increase in flax fiber length also slightly increases planar permeability.
3.1.3. Summary of Paper Layer Analysis
At this point, it can be concluded that the three important parameters under study for manufacturing the paper layer, namely surface density, flax content and flax fiber length, influence two of its important properties, namely paper structure and permeability. Table 4 summarizes the important results. An investigation of how these same parameters influence global reinforcement’s permeability is presented next, in an attempt to correlate paper layer properties with reinforcement permeability.
Table 4.
Summary of important results on paper layer.
3.2. Global Reinforcement Permeability Analysis
3.2.1. Assumptions
Permeability Kx and Ky of the whole reinforcement is obtained following the procedure described in [26] using Equation (3). A first assumption is that the UD flax layers always have the same surface density, which from Section 2.2 stands at an average of 127 (g/m2). This seems reasonable considering that the Tex200 yarns are equally distributed (same number of yarns per sample). Another assumption is that variability is small enough such that each UD flax layer within a sample presents similar permeability behavior. First, the measured permeability of the UD flax layers are measured: and . The total fiber volume content Vf of all tests was kept constant at 35%. To maintain consistency with the results in Section 3.1, in what follows the permeability behavior of the whole reinforcement is studied as a function of surface density, flax fiber content and flax fiber length of the paper phase only.
3.2.2. Permeability Analysis
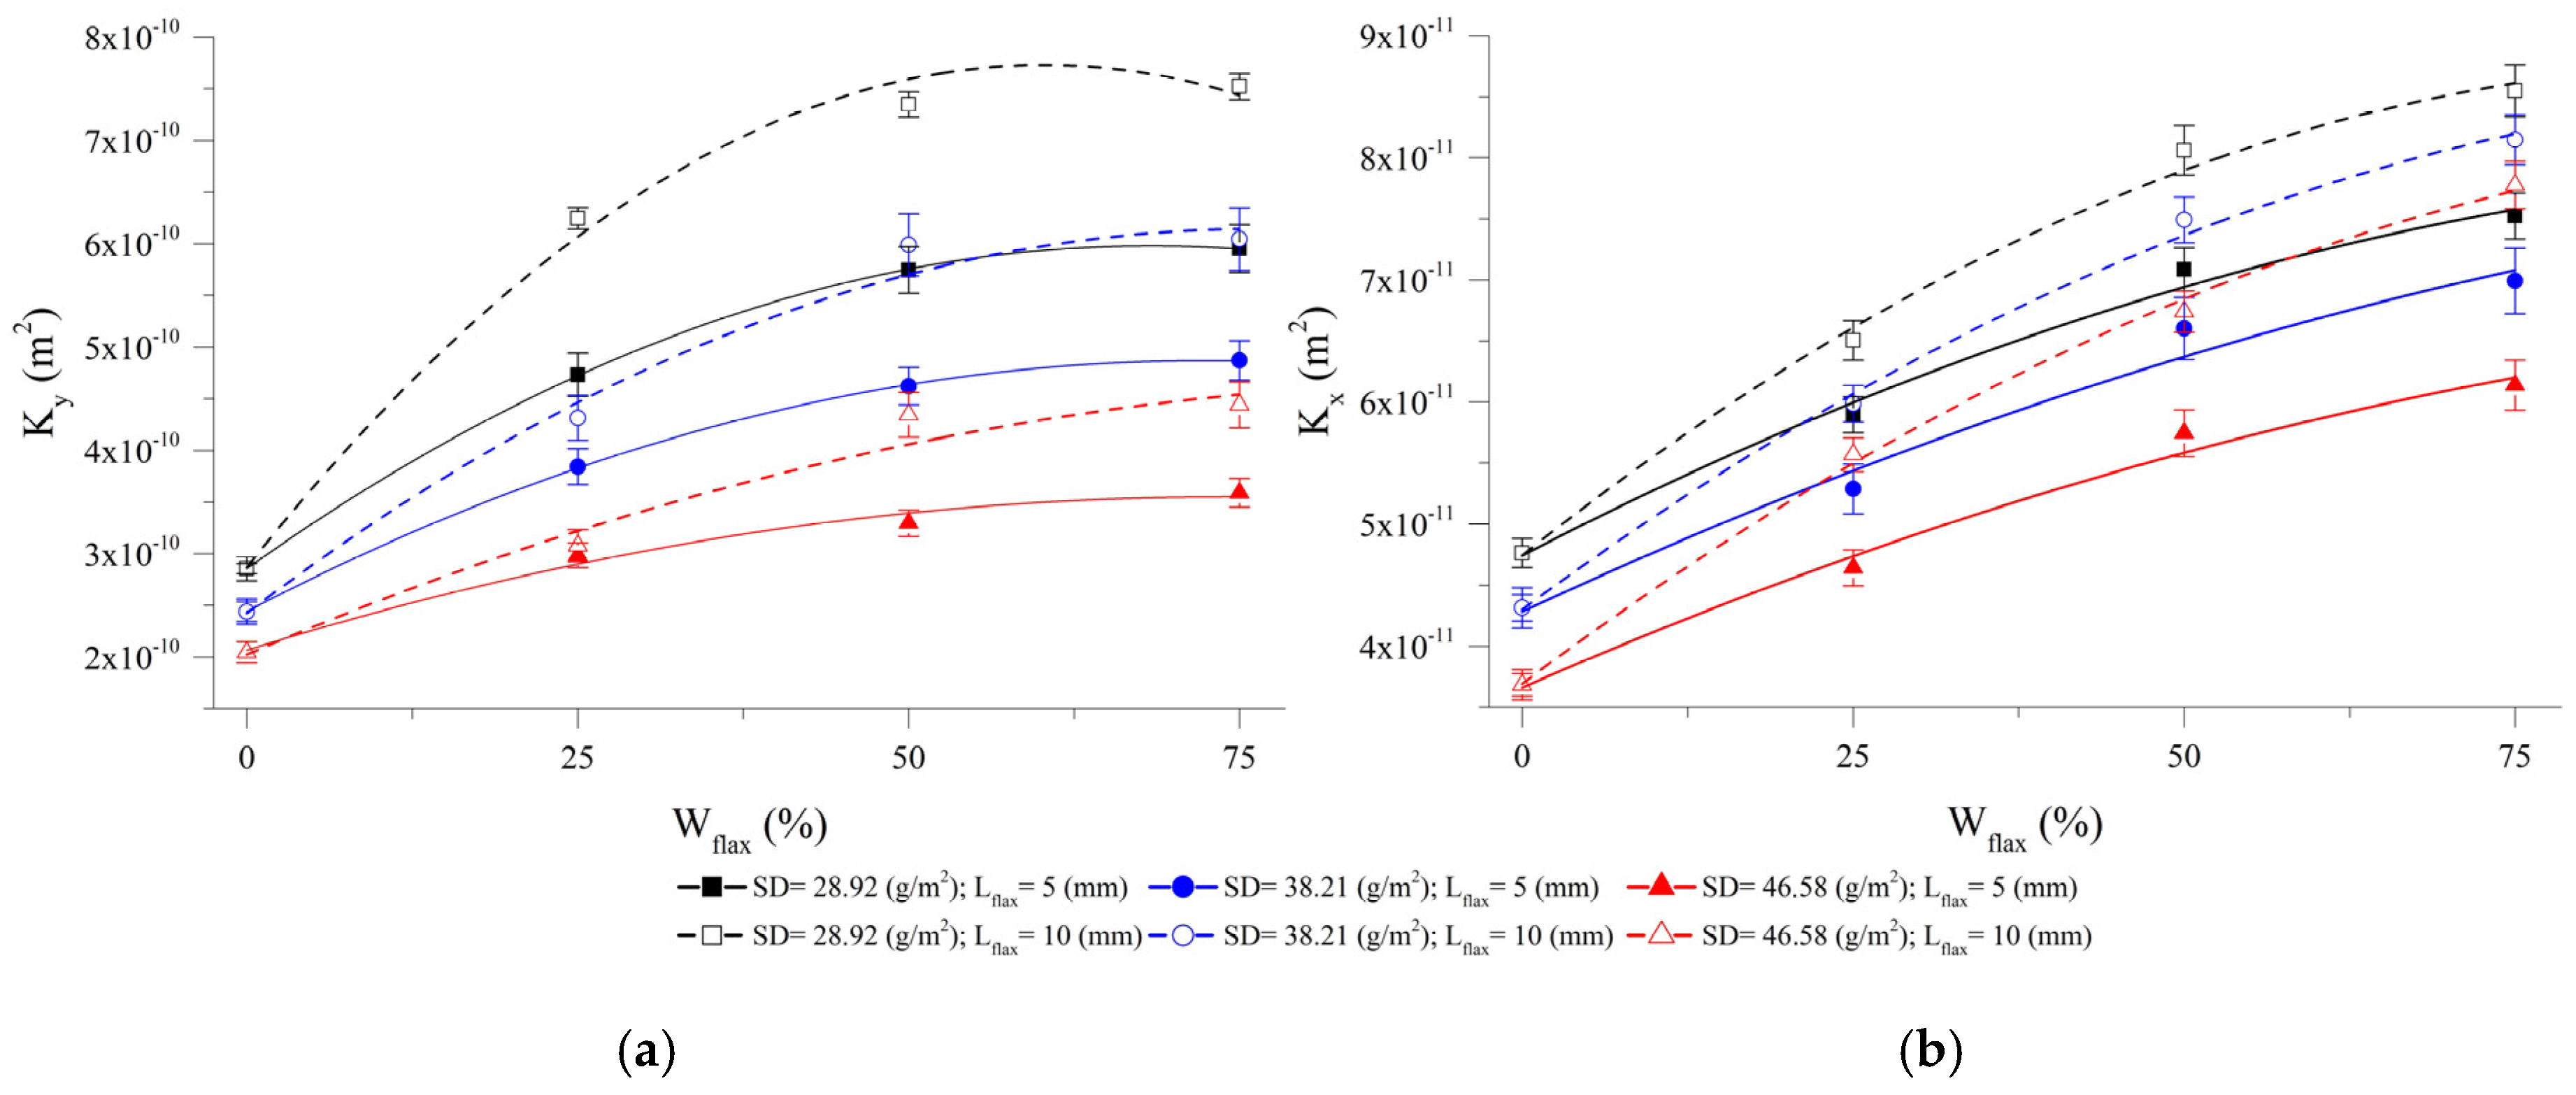
Figure 7 shows graphs of Kx and Ky permeability. Again here, Ky is always higher than Kx. This is partly because the paper layers are stacked such that the (y) axis coincides with the MD (as explained earlier). However, this time the main explanation lies in the alignment of unidirectional yarns in the (y) direction. Impregnation across the twisted yarns (x direction) is difficult as fluid can move faster between the yarns than across [9].
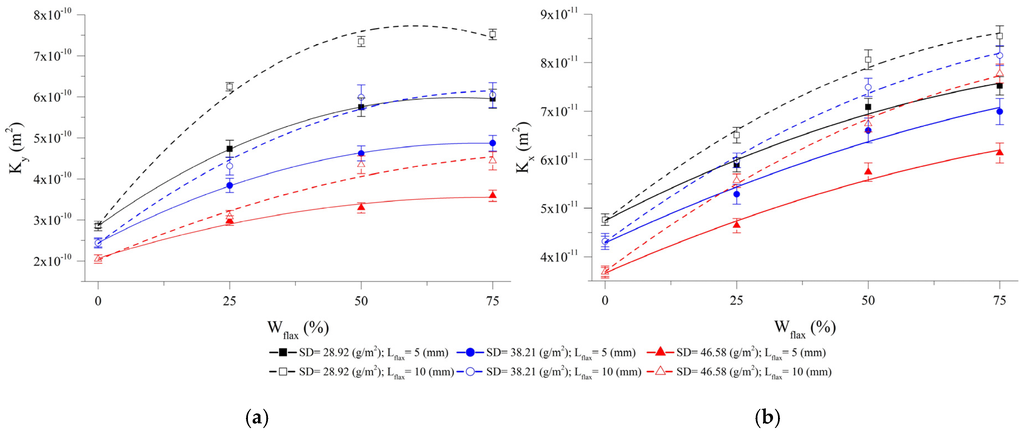
Figure 7.
Effect of paper phase parameters on the reinforcement Kx (a) and Ky (b) permeability.
The curves in Figure 7 confirm that the reinforcement’s permeability is influenced by the paper layer structure. In particular, for both directions, important differences in permeability values are obtained by varying paper layer surface density, flax content and fiber length. It is important to note that since the permeability of the UD layer is assumed constant, these differences must be governed by the permeability behavior of the paper layers. The next section investigates this important relationship.
3.2.3. Modeling Reinforcement Permeability Based on the Individual Permeability of Each Layer
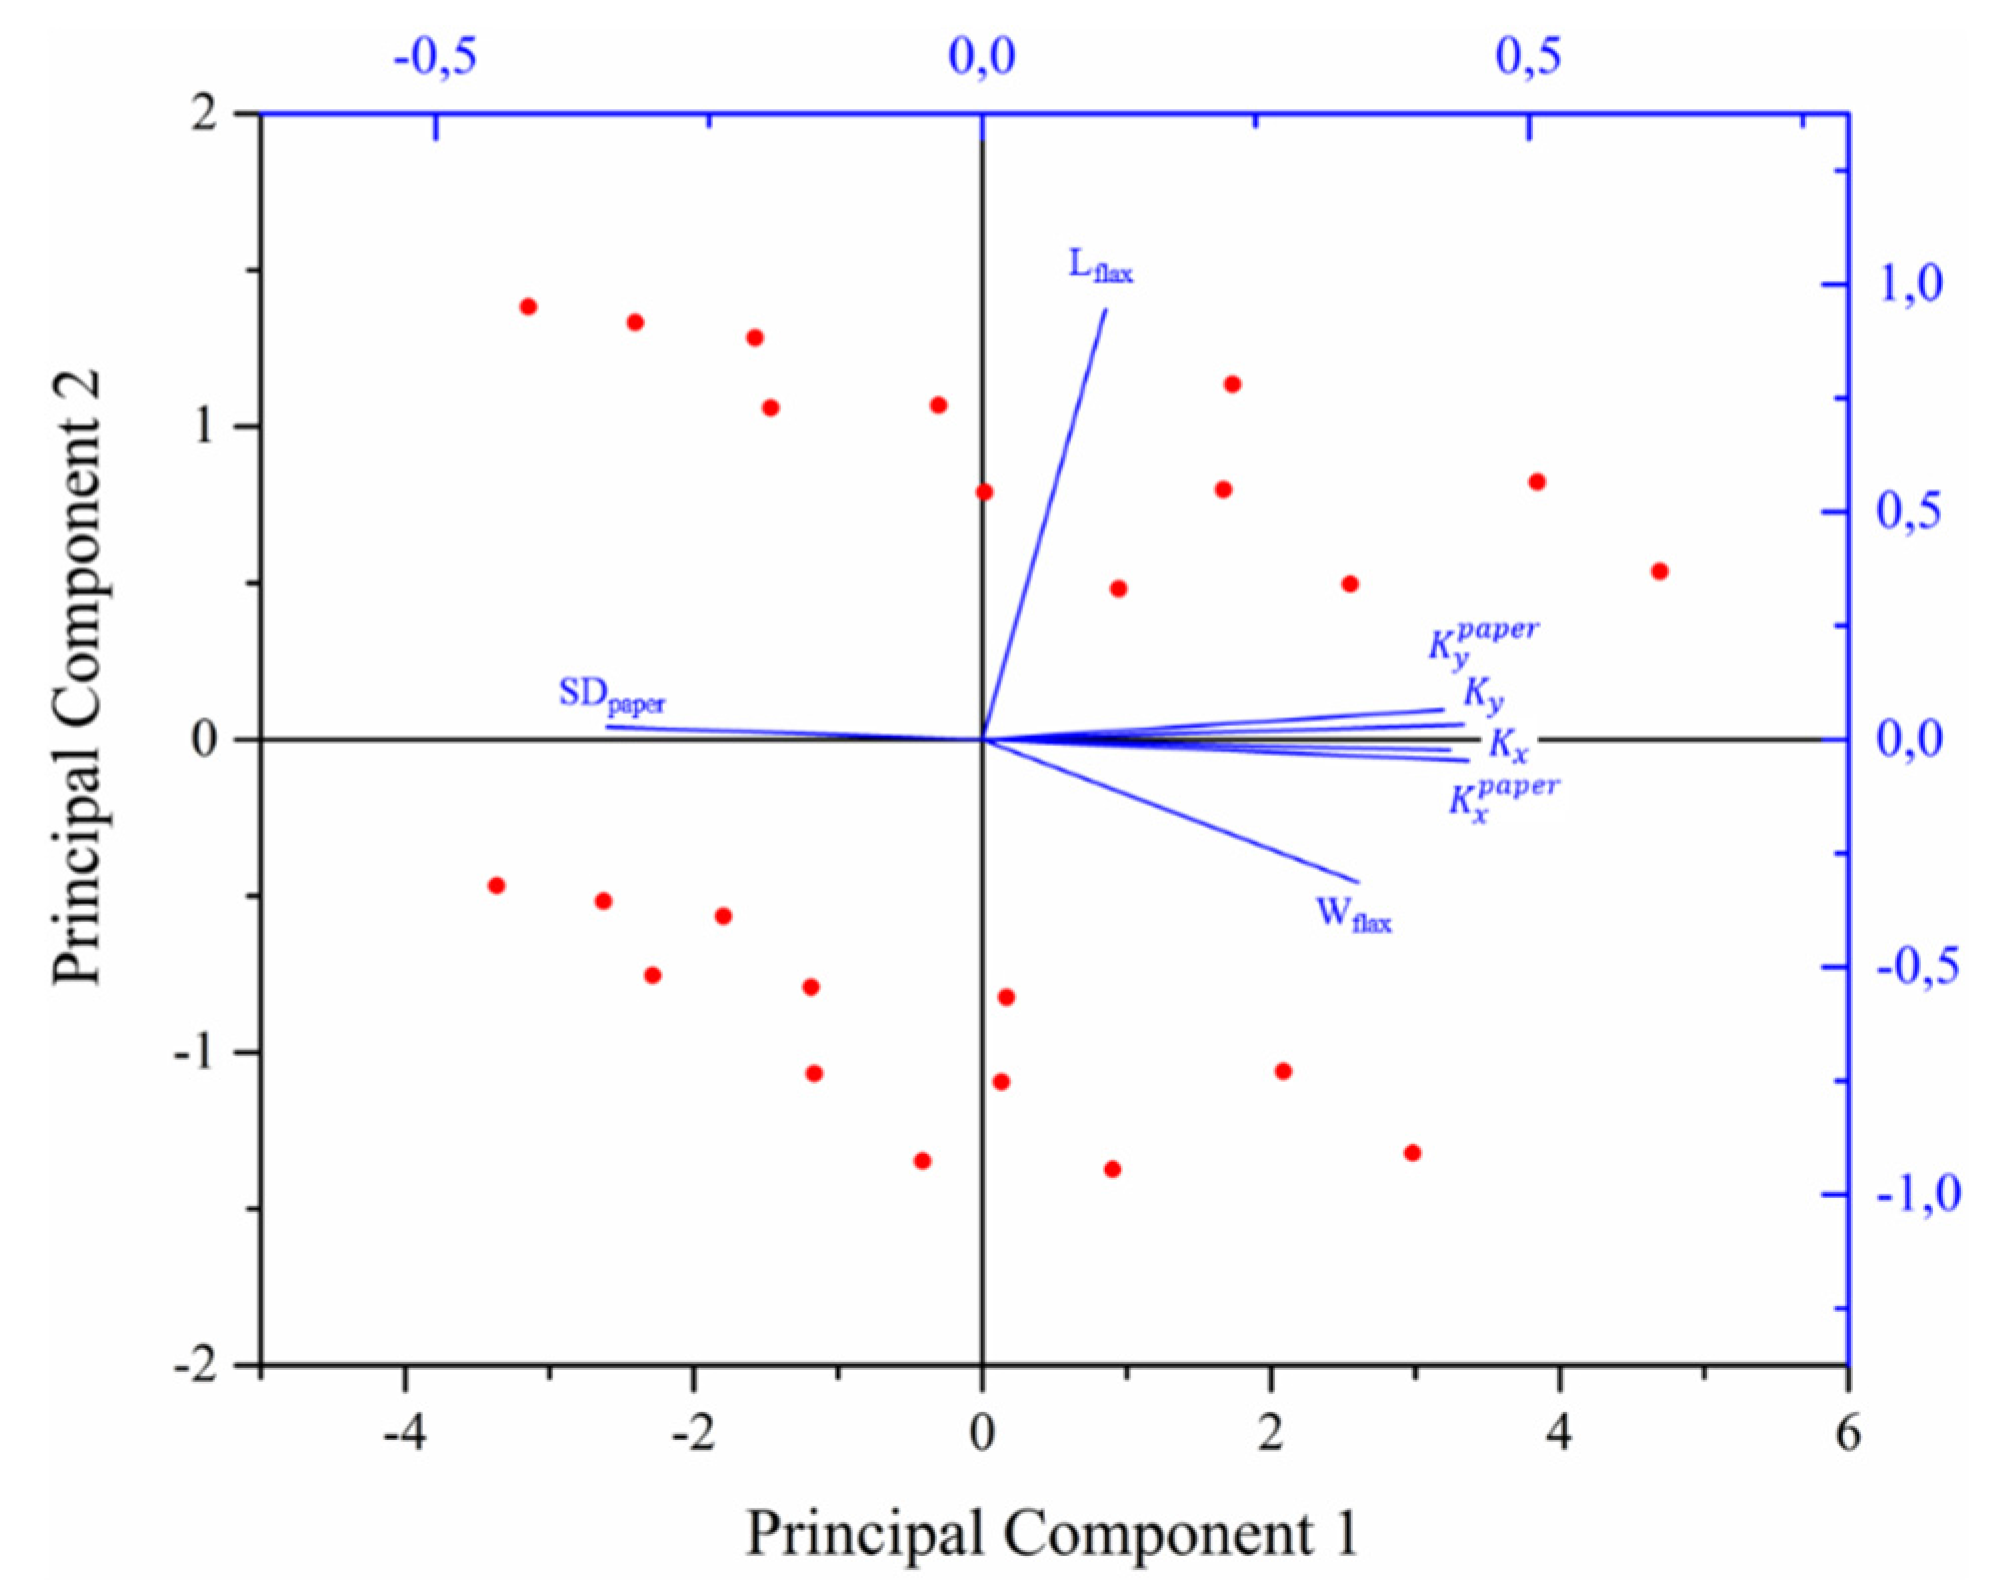
Projections of the first two principal components of the seven variables in Table 5 are shown in the biplot of Figure 8. The effect of fiber length is represented by the two clusters of points in different regions of the second principal component (namely one cluster above the horizontal 0 axis and another cluster below). All other effects are shown along the first principal component.
Table 5.
Coefficients of the correlation matrix.
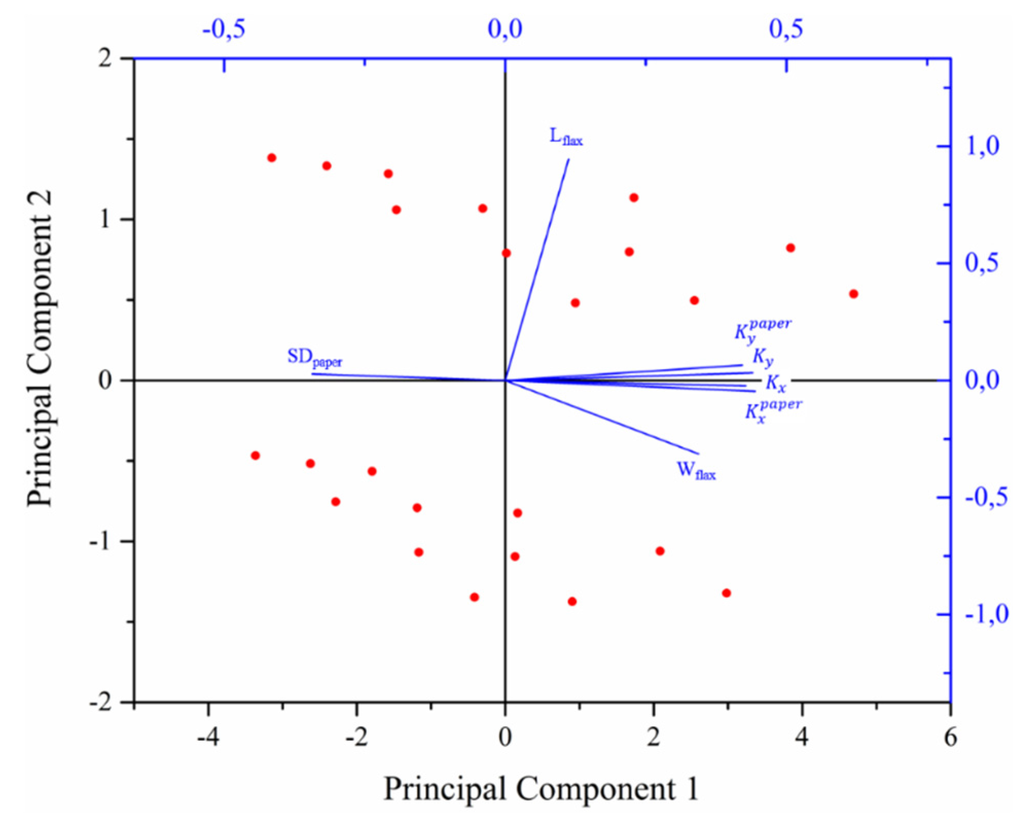
Figure 8.
Projection of the first two components in the PCA analysis.
It is clearly seen that surface density inversely affects and of the paper layers, whereas flax content (Wflax), and to a lesser extent flax fiber length (Lflax), positively affects them. However, most importantly in Figure 8, the permeability Kx and Ky of the whole reinforcement lies very close to the paper layer permeability and . This observation confirms that the parameters that affect paper layer permeability also affect the global reinforcement’s permeability in the same way.
Using multiple linear regression, linear models can be obtained for expressing the planar permeability of the reinforcement as a function of the individual planar permeability of the UD layer and paper layer:
Using instead the method in [34,35], the permeability of the reinforcement can also be predicted using the individual permeability values of each constituent layer:
where Kx,y is the permeability of the reinforcement in either direction (x or y), n is the number of individual layers (flax and paper), ht is the total reinforcement thickness, and hi and are the individual layer thickness and permeability in the corresponding direction (x or y), respectively.
Substituting the planar permeability for each paper layer (Table 3) and the constant planar permeability of the unidirectional flax yarns layer in the above equation, the predicted permeability of the global reinforcement is presented in Table 6.
Table 6.
Reinforcement permeability obtained from Equation (8).
Applying again a multiple linear regression on this new set of data gives:
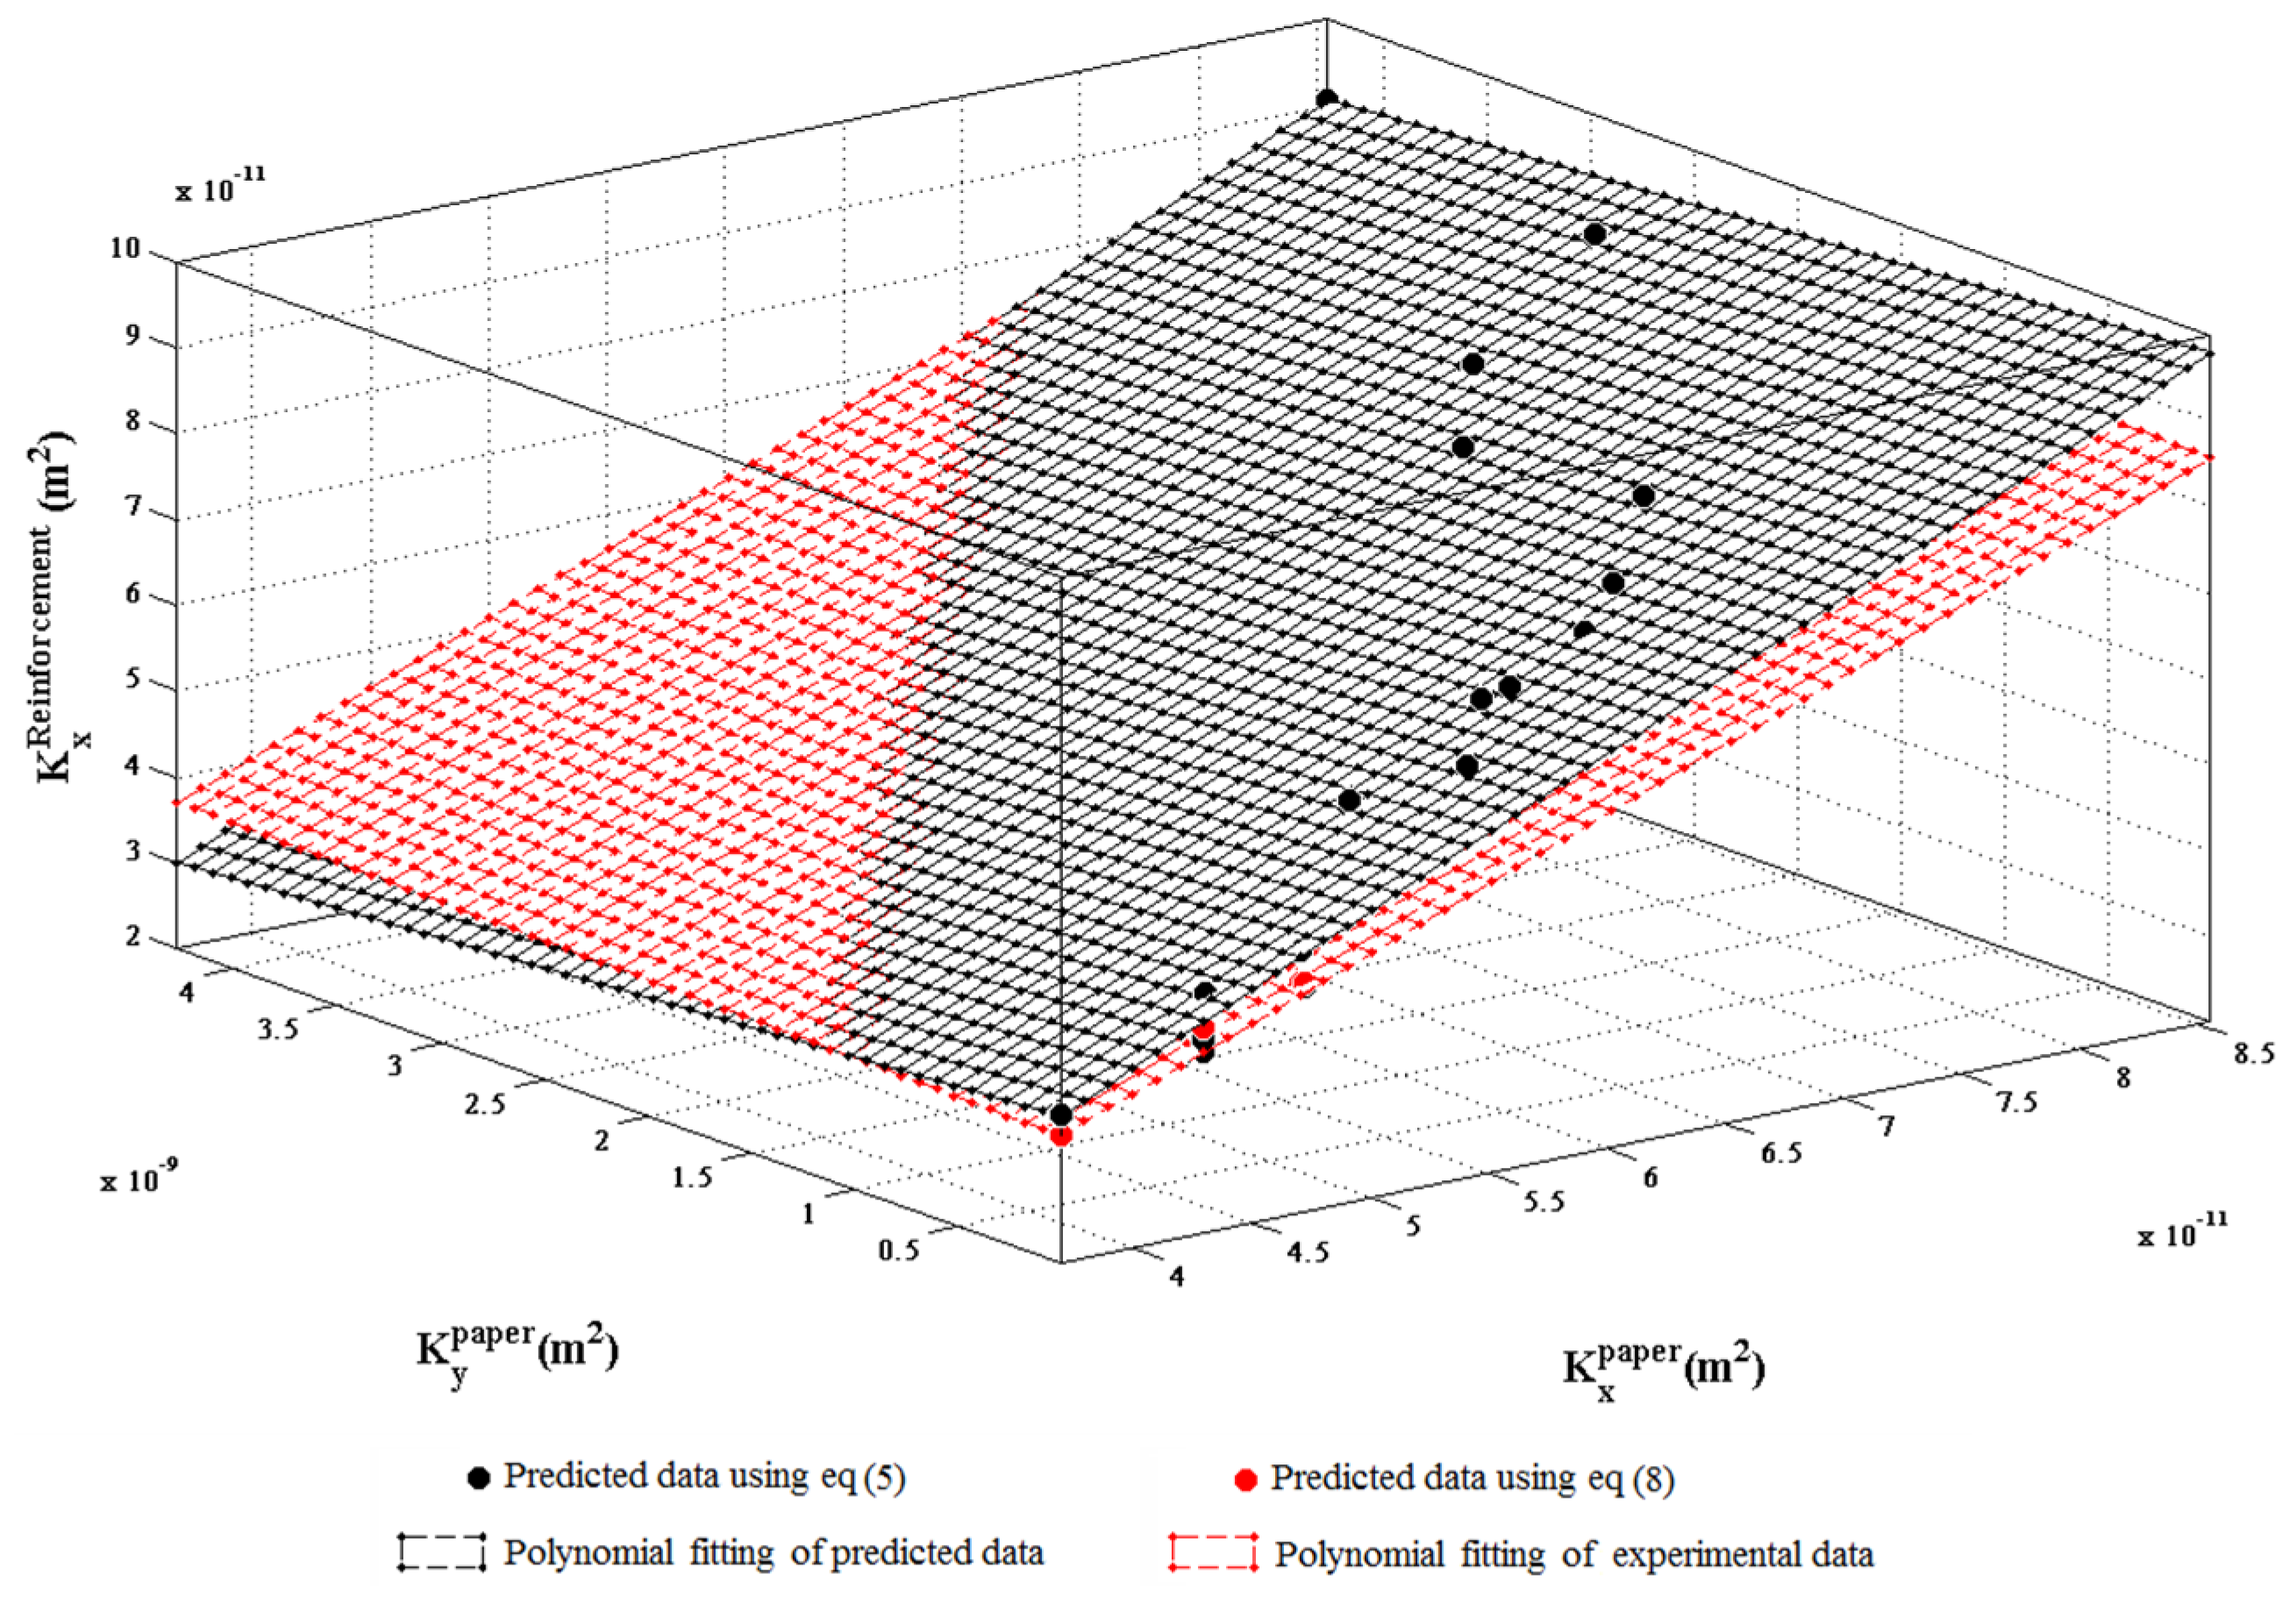
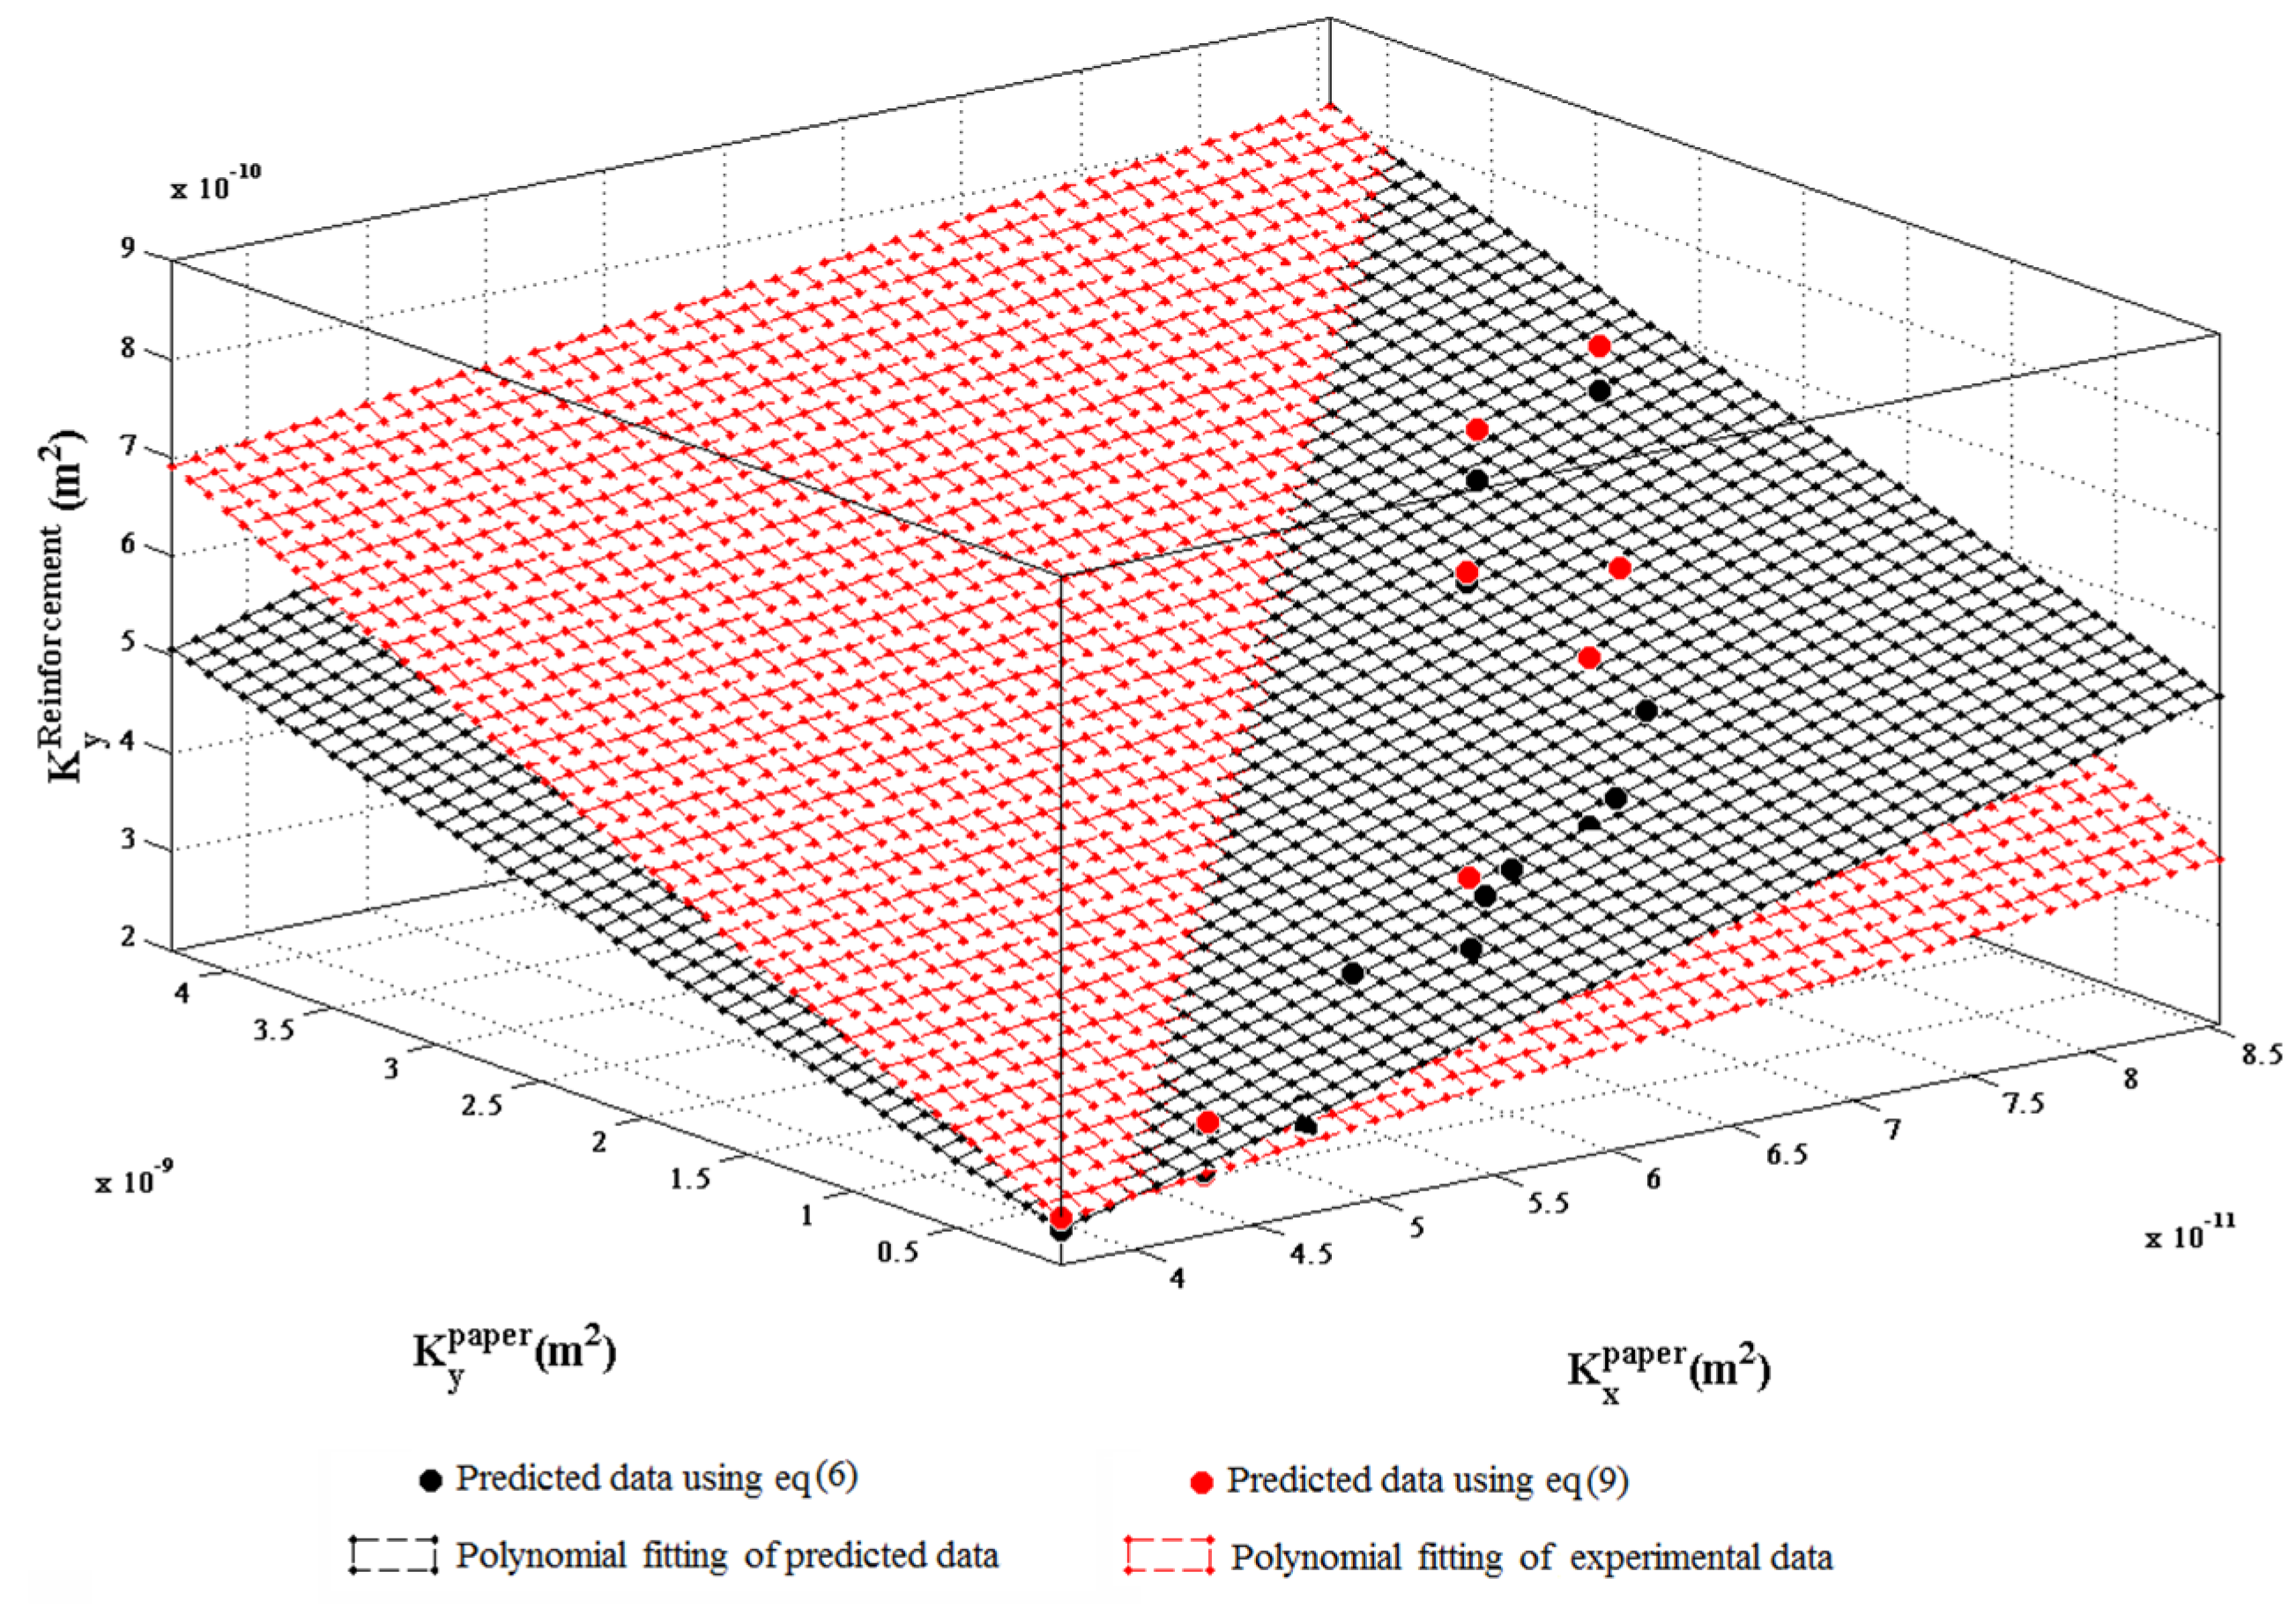
Both experimental and predicted data, using respectively Equations (5 and 6) and (8 and 9), are plotted in Figure 9 and Figure 10. A rather good agreement is observed between both types of models.

Figure 9.
Comparison between experimental data and predicted Kx using Equations (5 and 8).
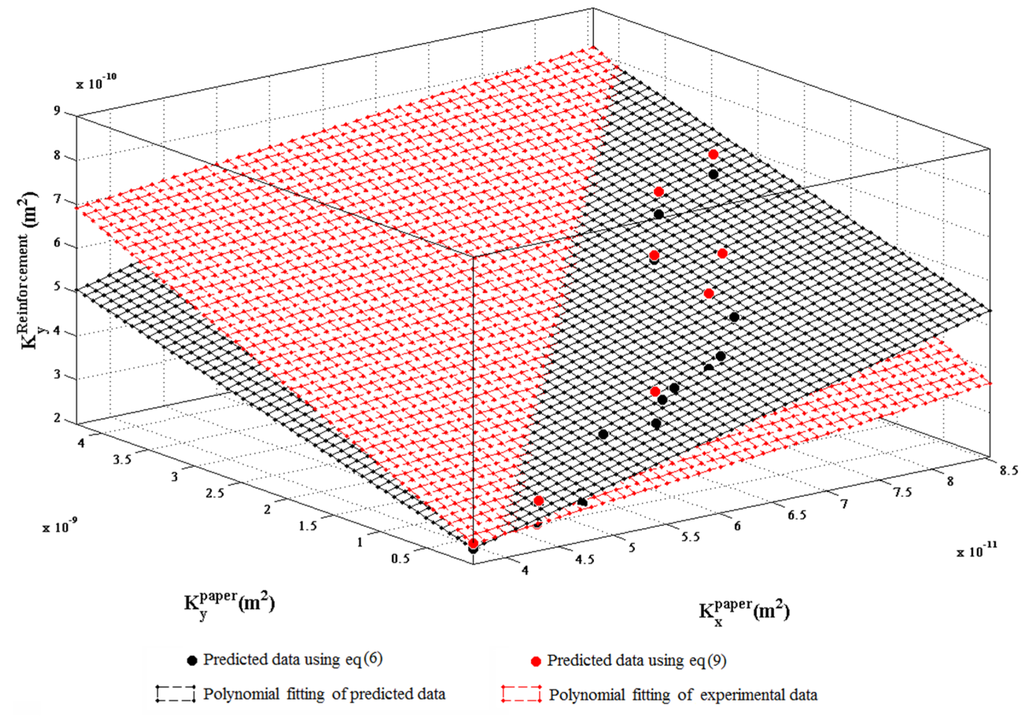
Figure 10.
Comparison between experimental data and predicted Ky using Equations (6) and (9).
3.2.4. Controlling Permeability and Impregnation Behaviour
The flow front shape of the studied reinforcement is elliptic where the major axis corresponds to the high permeability in the direction of the unidirectional flax yarns (Figure 3). A more limited impregnation is observed in the cross direction (minor axis). Since the paper layer permeability is also different in both CD and MD direction, it is quite possible that the orientation of the paper layer with respect to the UD flax yarns could influence the flow front shape.
Equations (9 and 10) are used again to predict the permeability of a reinforcement in both principal directions, but this time the paper layers are given different MD-CD orientations with respect to the flax yarns. The flow front shape type is itself predicted using the ratio in Equation (11) [26]:
Rx can therefore be related to Ry using this equation:
where .
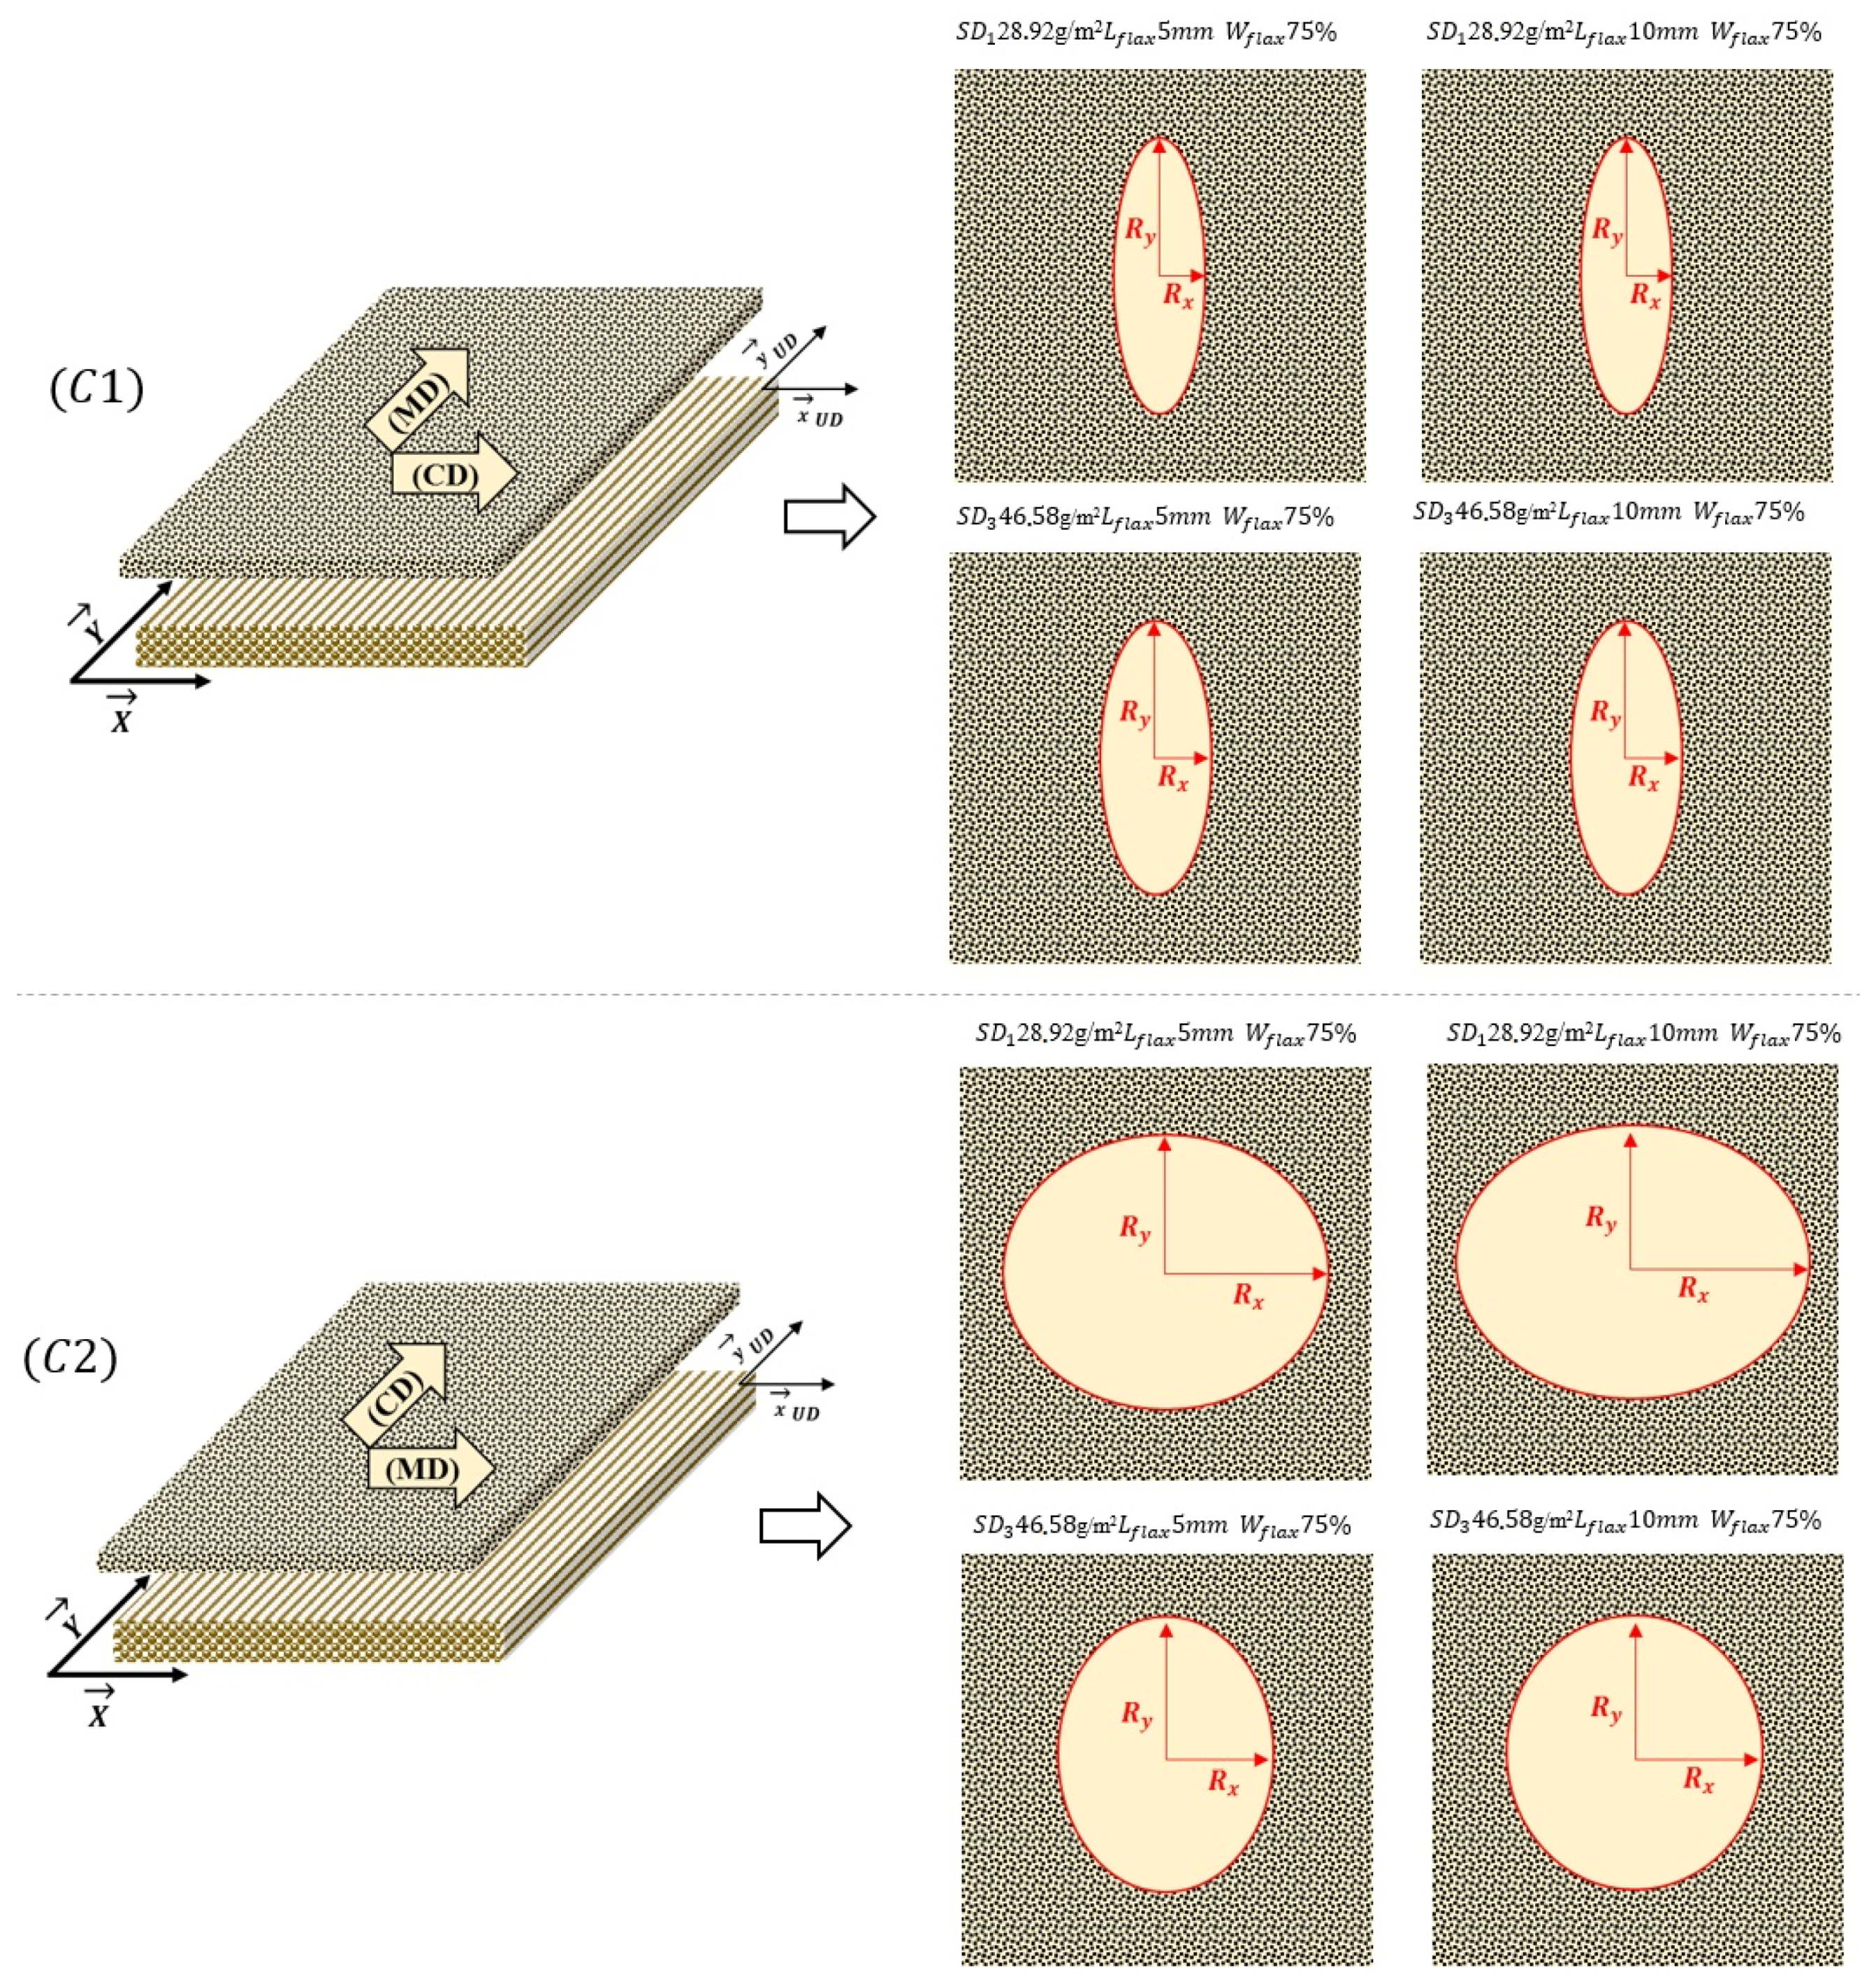
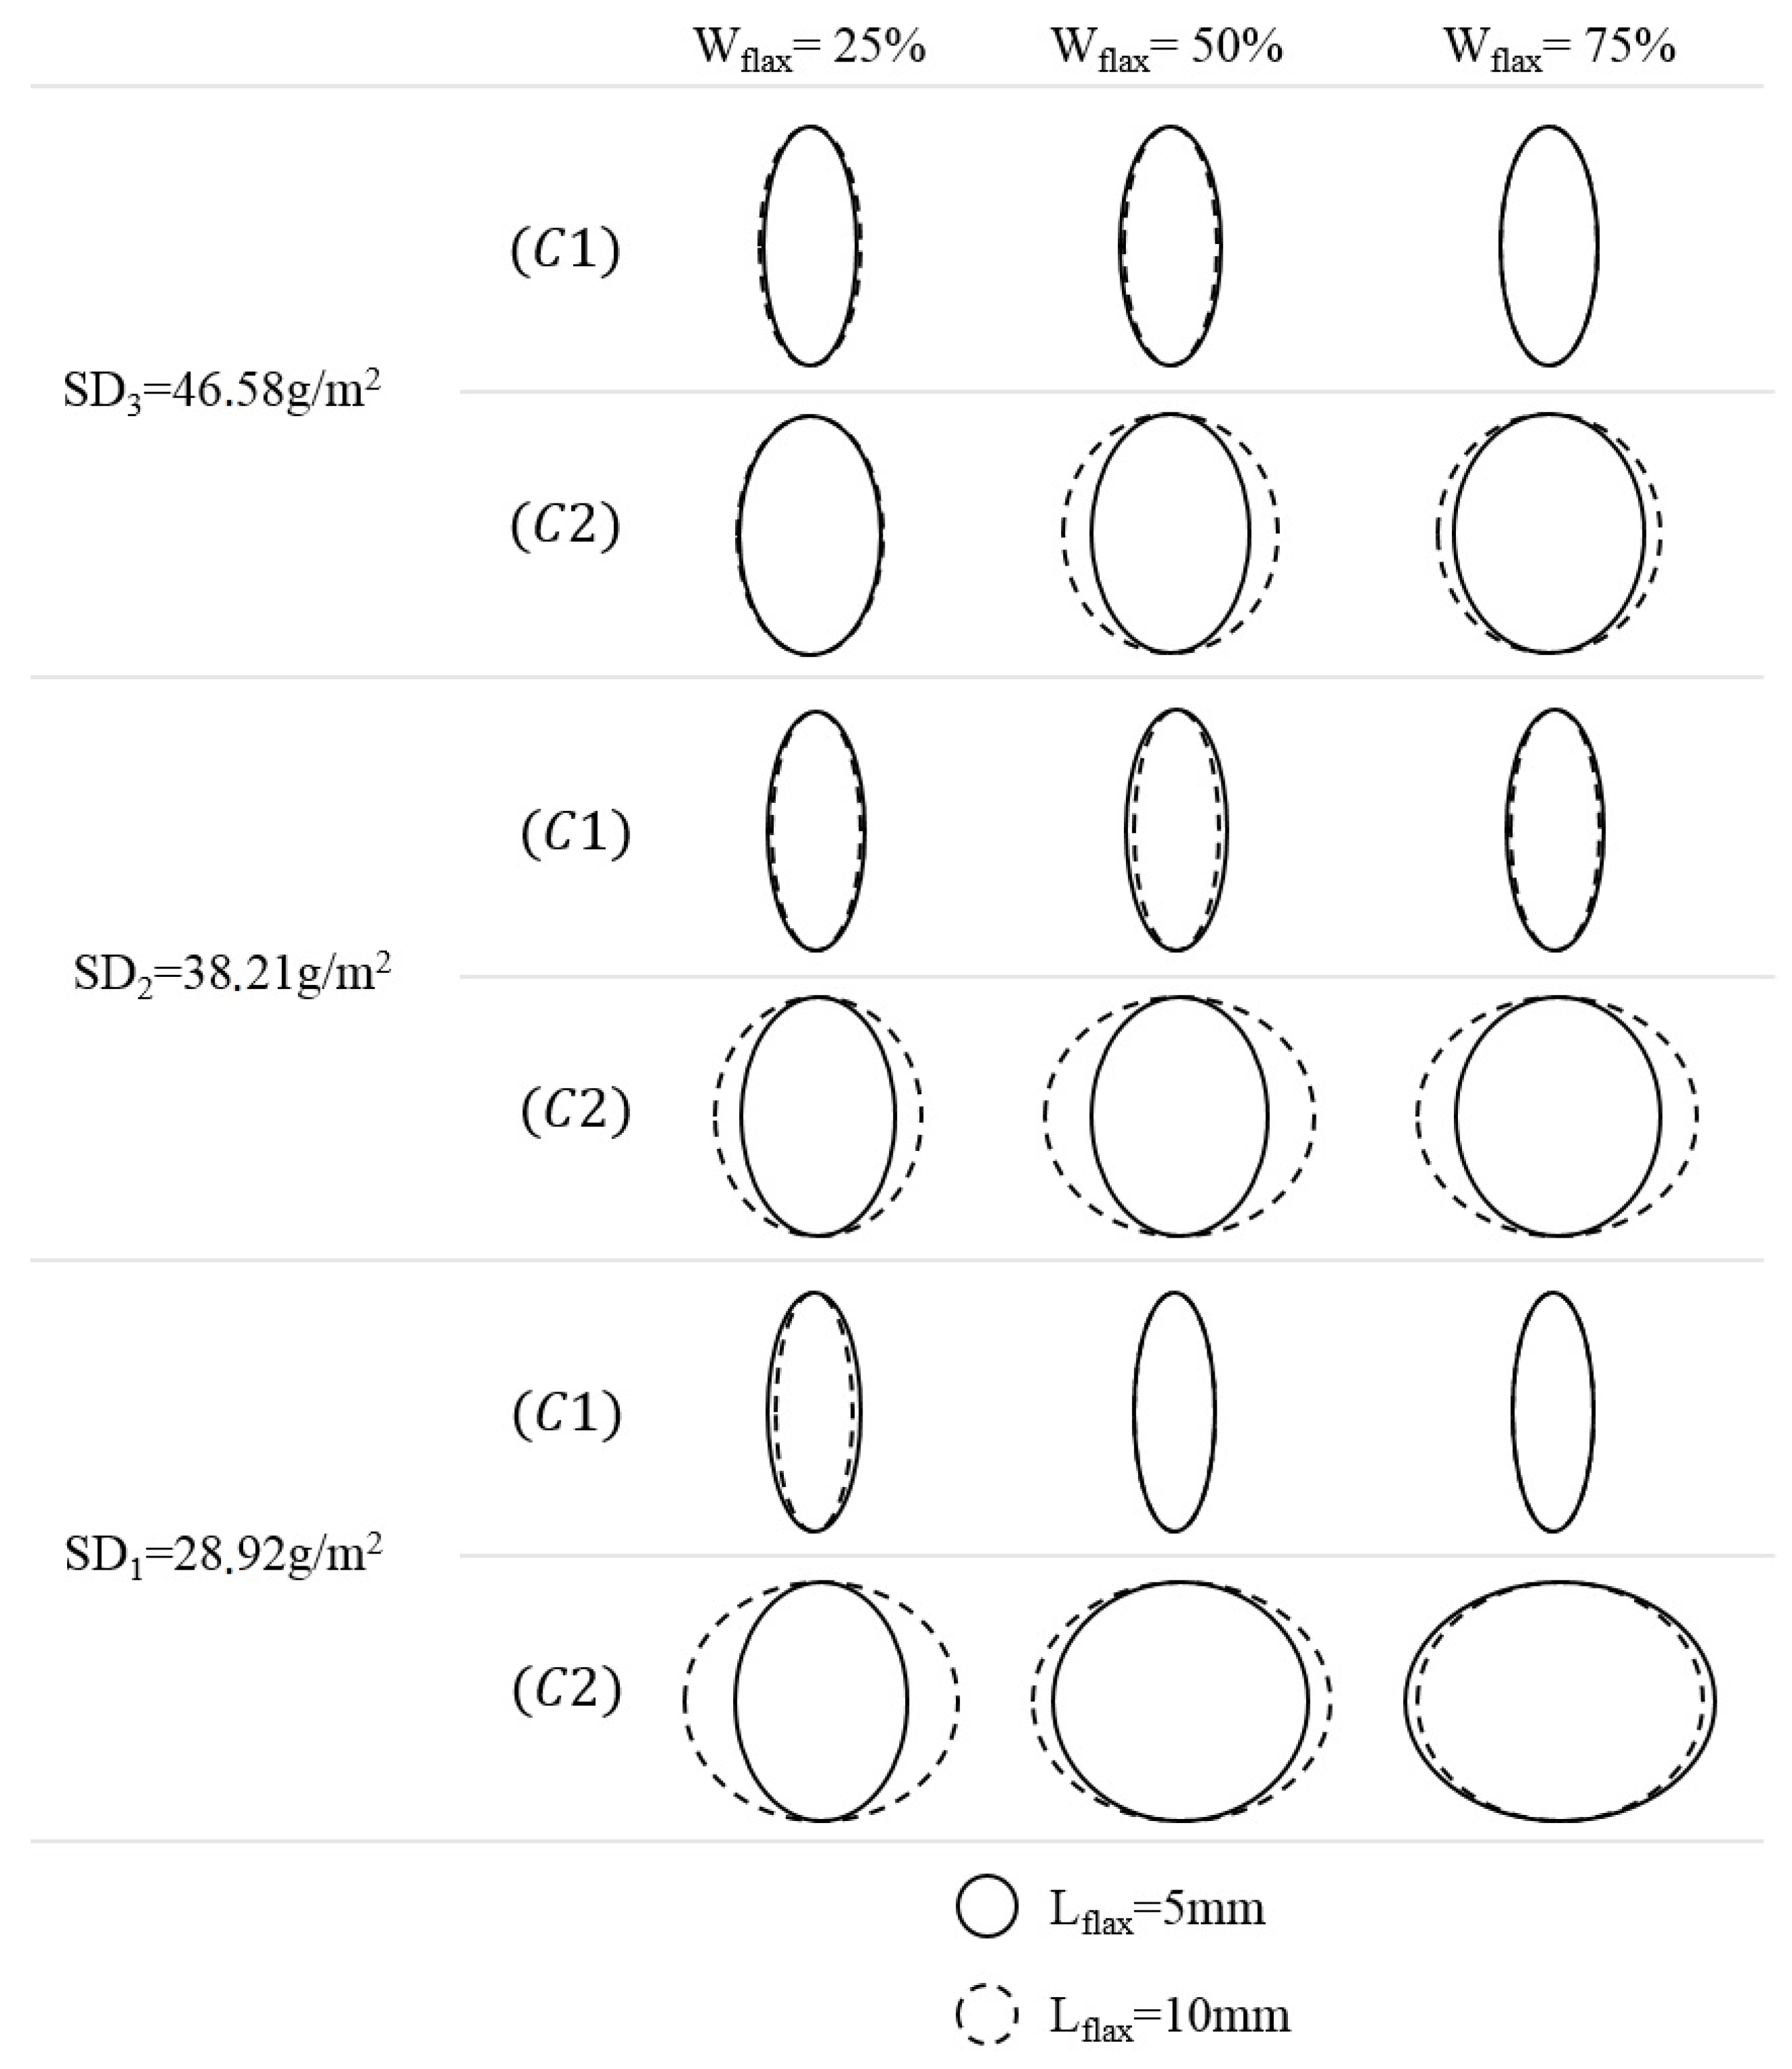
Next, the flow front is predicted for two different cases. In the first case (C1 in Figure 11), the paper layer’s MD direction is parallel to the flax yarns while in the second case (C2 in Figure 11) the paper layer’s MD direction is perpendicular to the flax yarns.

Figure 11.
Comparison of predicted reinforcement flow front shapes for two different paper layer orientations.
As can be seen, the calculated minor and major axis (Rx and Ry), which define the flow front shape, are very different for C1 and C2. A limited impregnation in the X direction is observed for the first case while a significant increase of Rx and a more pronounced effect of flax fiber length is observed for the second case. This means that apart from having a significant effect on the global permeability of the reinforcement, the paper layer properties could also play a significant role in the flow front type for planar parts. The generalized results are presented in Figure 12.
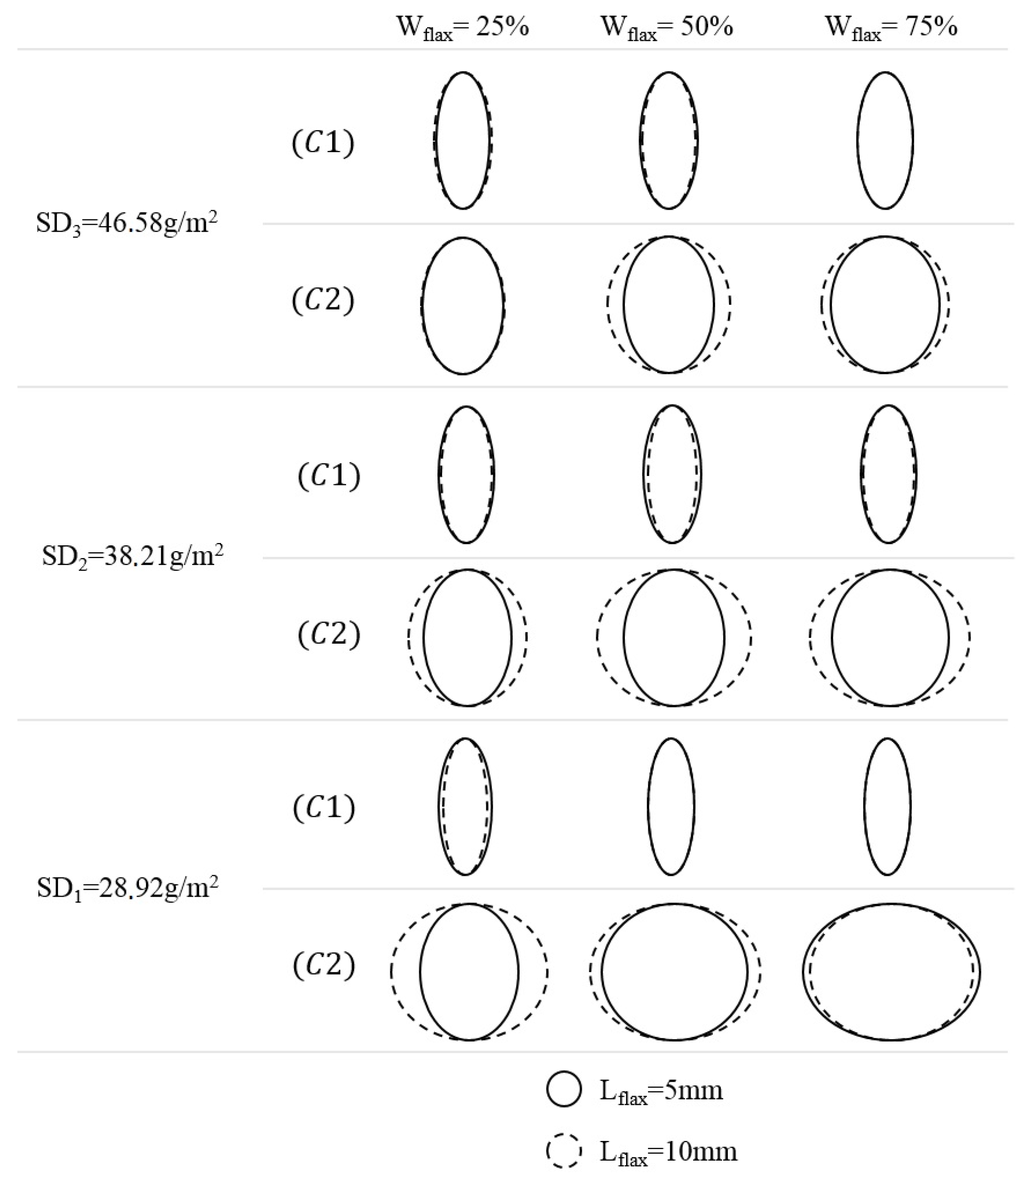
Figure 12.
Predicted reinforcement flow front shapes.
3.3. Mechanical Properties
In order to investigate how the flax-Kraft paper layer affects basic mechanical properties, paper layers with a surface density (SDpaper) of 28.92 g/m2 and two different flax proportions (Wflax) of 0% and 75% at 5 mm of fiber length were used to fabricate composite plates. The resin transfer moulding (RTM) process was used to produce the samples, with the same mold used in permeability measurement (Figure 3) and using epoxy resin. The samples dimensions were 270 mm × 150 mm. Thereafter, the composites were cured based on the recommended cure cycle for the resin. Test samples were cut according to the ASTM D3039 for tensile tests. Tests were carried out on an Instron testing machine, model 4206, with a load cell of 150 KN with crosshead speed of 2 mm/min. At least five specimens were tested for each type of composite. Results are presented in Table 7.
Table 7.
Comparison of tensile properties, Vf = 35%.
By comparing values of the UD/Paper (Wflax= 0%) with UD samples, it is observed that mechanical properties at Vf = 35% show a slight reduction of 12% and 13% in the modulus and strength, respectively. However, the presence of the paper layer also substantially reduces the standard deviations. The variability of the Young modulus and tensile strength are decreased by 53% and 69%, respectively. These results are similar to those obtained by Lebrun et al. [19].
The decrease in mechanical properties is attributed to the lower permeability of the reinforcement when the paper layer is present. It is possible that this influences the reinforcement saturation during resin infusion and favors the formation of voids in the composite plates. This explanation is further supported by analysing the composite mechanical properties when the flax proportion is increased to 75%. The improved permeability yields a slight increase of the measured modulus and strength with a further decrease of the variability, when compared to samples at Wflax= 0%.
4. Conclusions
The effects of adding short flax fibers (5 or 10 mm) to the Kraft fibers in the paper phase of a new UD flax-paper reinforcement have been studied. Permeability tests performed on the flax-paper reinforcement showed that the paper layer should be made with low surface density, high flax fiber proportion, and using long flax fibers. These settings favor the flow of resin in the RTM process used to impregnate the flax-paper reinforcement, i.e. they help increase global reinforcement’s permeability.
A principal component analysis (PCA) analysis was performed. The permeability Kx and Ky of the whole reinforcement lay close to those of paper layer planar permeability. This confirms that the controlled parameters, all related to the paper layer structure, affect the paper layer permeability in the same way that they affect the global reinforcement’s permeability.
Prediction models of the reinforcement’s permeability as a function of paper and flax yarns layers’ individual permeability were then obtained. One model was obtained by regressing the experimental values while another was obtained by regressing theoretically predicted values using Equation (8). Both models gave almost identical results.
The use of Equation (8) allows to compute the permeability of the reinforcement in two different orientations of the paper layer with respect to the aligned flax yarns. Minor and major axis radii defining the flow front were then obtained for two orientations. In the first case, where the paper layer’s MD was set parallel to the flax yarns, impregnation was very limited in the cross direction. In the second case, where the paper layer’s MD was set perpendicular to the flax yarns, a significant increase in cross direction impregnation was simulated. It seems then possible to control impregnation behavior of the new UD flax-paper reinforcement by fine tuning the paper layer’s MD orientation. Future research is required to fully confirm this and to generalize this result for composites made from layers with different orientations (45°, 90°).
Comparing the results in this study with the permeability of a standard glass mat (K ≈ 1.0 x10⁻¹⁰ m2 at Vf = 35% [36]), it seems reasonable to think that further optimization of the paper layer could yield global reinforcement permeability values that are interesting for industrial applications (high permeability and low injection times) while ensuring good part quality in terms of void content. This final optimization implies the inclusion of paper layer manufacturing parameters (forming pressures, drying temperatures, etc.) in addition to the three material parameters used in this study. This aspect is currently being addressed [37].
Finally, the basic mechanical properties of composite plates were slightly reduced when the paper layer is present. This is accompanied by an important reduction of the variability. This loss of mechanical properties can be reduced if the paper layer is made from a larger proportion of flax fibers.
Acknowledgments
The authors want to acknowledge the Natural Sciences and Engineering Research Council of Canada (NSERC) for its financial support to this project. Special thanks also go to Jean Paradis from Innofibre for his support in the supply and preparation of the Kraft pulps.
Author Contributions
Mohamed Habibi carried out the experimental tests. Mohamed Habibi and Luc Laperrière have both contributed to analyze data and writing the paper. All authors read, discussed and approved the final manuscript.
Conflicts of Interest
The authors declare no conflict of interest.
References
- Qiang, L.; Richard, S.P.; Hermione, S.G. New set-up for in-plane permeability measurement. Compos. Part A Appl. Sci. Manuf. 2007, 38, 954–962. [Google Scholar]
- Gebart, B.R. Permeability of Unidirectional Reinforcements for RTM. J. Compos. Mater. 1992, 26, 1100–1133. [Google Scholar] [CrossRef]
- Talvensaari, H.; Ladstätter, E.; Billinger, W. Permeability of stitched preform packages. Compos. Struct. 2005, 71, 371–377. [Google Scholar] [CrossRef]
- Kris, H.; Daniela, D.; Hugo, S.; Marleen, V. New set-up for measurement of permeability properties of fibrous reinforcements for RTM. Compos. Part A Appl. Sci. Manuf. 2002, 33, 959–969. [Google Scholar]
- Gerd, M.; Sven, B.; Hugo, S. 2D permeability tensor identification of fibrous reinforcements for RTM using an inverse method. Compos. Part A Appl. Sci. Manuf. 2008, 39, 1530–1536. [Google Scholar]
- Cristaldi, G.; Latteri, A.; Recca, G.; Cicala, G. Composites based on natural fibre fabrics. Woven Fabr. Eng. 2010, 17, 317–342. [Google Scholar]
- Goutianos, S.; Peijs, T.; Nystrom, B.; Skrifvars, M. Development of flax fibre based textile reinforcements for composite applications. Appl. Compos. Mater. 2006, 13, 199–215. [Google Scholar] [CrossRef]
- Yuanqiao, R.; Richard, J.F. A modeling and experimental study of the influence of twist on the mechanical properties of high-performance fiber yarns. J. Appl. Polym. Sci. 2000, 77, 1938–1949. [Google Scholar]
- Shah, D.U.; Schubel, P.J.; Clifford, M.J. Modelling the Effect of Yarn Twist on the Tensile Strength of Unidirectional Plant Fibre Yarn Composites. J. Compos. Mater. 2013, 47, 425–436. [Google Scholar] [CrossRef]
- Omar, F.; Mohini, S. Biofiber Reinforcements in Composite Materials, 1st ed.; Woodhead Publishing: Sawston, Cambridge, 2014. [Google Scholar]
- Ma, H.; Li, Y.; Wang, D. Investigations of fiber twist on the mechanical properties of sisal fiber yarns and their composites. J. Reinf. Plast. Compos. 2014, 33, 687–696. [Google Scholar] [CrossRef]
- Lagardère, M.; Park, C.H.; Panier, S. Permeability of natural fiber reinforcement for liquid composite molding processes. J. Mater. Sci. 2014, 49, 6449–6458. [Google Scholar]
- Gastón, F.; Exequiel, S.R.; Analía, V. Study of saturated and unsaturated permeability in natural fiber fabrics. Compos. Part A Appl. Sci. Manuf. 2010, 41, 16–21. [Google Scholar]
- Rodriguez, E.; Giacomelli, F.; Vazquez, A. Permeability-Porosity Relationship in RTM for Different Fiberglass and Natural Reinforcements. J. Compos. Mater. 2004, 38, 259–268. [Google Scholar] [CrossRef]
- Jing, L.; Chuck, Z.; Richard, L.; Ben, W. Statistical characterization and robust design of RTM processes. Compos. Part A Appl. Sci. Manuf. 2005, 36, 564–580. [Google Scholar]
- Xue, D.; Miao, M.; Hu, H. Permeability anisotropy of flax nonwoven mats in vacuum-assisted resin transfer molding. J. Text. Inst. 2011, 102, 612–620. [Google Scholar] [CrossRef]
- Bickerton, S.; Sozer, E.M.; Graham, P.J.; Advani, S.G. Fabric Structure and Mold Curvature Effects on Preform Permeability and Mold Filling in the RTM Process. Part I. Experiments. Compos. Part A Appl. Sci. Manuf. 2000, 31, 423–438. [Google Scholar] [CrossRef]
- Grujicic, M.; Chittajallu, K.M.; Shawn, W. Effect of shear, compaction and nesting on permeability of the orthogonal plain-weave fabric preforms. Mater. Chem. Phys. 2004, 86, 358–369. [Google Scholar] [CrossRef]
- Lebrun, G.; Couture, A.; Laperrière, L. Tensile and impregnation behavior of unidirectional hemp/paper/epoxy and flax/paper/epoxy composites. Compos. Struct. 2013, 103, 151–160. [Google Scholar] [CrossRef]
- Vernet, N.; Ruiz, E.; Advani, S.; Alms, J.; Aubert, M.; Barburski, M.; Barari, B.; Beraud, J.; Berg, D.; Correia, N. Experimental determination of the permeability of engineering textiles: Benchmark II. Compos. Part A Appl. Sci. Manuf. 2014, 61, 172–184. [Google Scholar] [CrossRef]
- Lekakou, C.; Johari, M.A.K.; Norman, D.; Bader, M.G. Measurement techniques and effects on in-plane permeability of woven cloths in resin transfer moulding. Compos. Part A Appl. Sci. Manuf. 1996, 27, 401–408. [Google Scholar] [CrossRef]
- Morren, G.; Bottiglieri, M.; Bossuyt, S.; Sol, H.; Lecompte, D.; Verleye, B.; Lomov, S.V. A reference specimen for permeability measurements of fibrous reinforcements for RTM. Compos. Part A Appl. Sci. Manuf. 2009, 40, 244–250. [Google Scholar] [CrossRef]
- Bickerton, S.; Sozer, E.M.; Šimácek, P.; Advani, S.G. Fabric structure and mold curvature effects on preform permeability and mold filling in the RTM process. Part II. Predictions and comparisons with experiments. Compos. Part A Appl. Sci. Manuf. 2000, 31, 439–458. [Google Scholar] [CrossRef]
- Lundström, T.S.; Stenberg, R.; Bergström, R.; Partanen, H.; Birkeland, P.A. In-plane permeability measurements: a nordic round-robin study. Compos. Part A Appl. Sci. Manuf. 2000, 31, 29–43. [Google Scholar] [CrossRef]
- Weitzenböck, J.; Shenoi, R.; Wilson, P. Radial flow permeability measurement. Part A: Theory. Compos. Part A Appl. Sci. Manuf. 1999, 30, 781–796. [Google Scholar] [CrossRef]
- Chan, A.W.; Hwang, S.T. Anisotropic in-plane permeability of fabric media. Polym. Eng. Sci. 1991, 31, 1233–1239. [Google Scholar] [CrossRef]
- Curto, J.; Conceição, E.; Portugal, A.; Simões, R. Three dimensional modelling of fibrous materials and experimental validation. Materialwiss. Werkstofftech. 2011, 42, 370–374. [Google Scholar] [CrossRef]
- Rusu, M.; Mörseburg, K.; Gregersen, Ø.; Yamakawa, A.; Liukkonen, S. Relation between fibre flexibility and cross sectional properties. BioResources 2011, 6, 641–655. [Google Scholar]
- Hock, C.W. Microscopic structure of flax and related bast fibres. J. Res. Natl. Bur. of Stand. 1942, 29, 41–50. [Google Scholar] [CrossRef]
- Johansson, A. Correlations between Fibre Properties and Paper Properties. Master’s Thesis, Royal Institute of Technology (KTH), Stockholm, Sweden, 2016. [Google Scholar]
- Pulkkinen, I.; Alopaeus, V.; Fiskari, J.; Joutsimo, O. The use of fibre wall thickness data to predict handsheet properties of eucalypt pulp fibres. O Papel 2008, 69, 71–85. [Google Scholar]
- Jones, R.L. An Investigation of the Effect of Fiber Structural Properties on the Compression Response of Fibrous Beds. Ph.D. Thesis, Georgia Institute of Technology, Atlanta, GA, USA, 1962. [Google Scholar]
- Rasi, M. Permeability Properties of Paper Materials. Ph.D. Thesis, University of Jyväskylä, Jyväskylä, Finland, 2013. [Google Scholar]
- Binetruy, C. Calcul et Validation Expérimentale de la Perméabilité Et Prévision de L'imprégnation de Tissus en Moulage RTM. Ph.D. Thesis, Université Lille1, Villeneuve d'Ascq, France, 1996. [Google Scholar]
- Fournier, R. Optimisation and Modelisation of the RTM Process. Ph.D. Thesis, École Nationale Supérieure des Mines de Paris, Paris, France, 2003. [Google Scholar]
- Pomeroy, R.; Grove, S.; Summerscales, J.; Wang, Y.; Harper, A. Measurement of permeability of continuous filament mat glass–fibre reinforcements by saturated radial airflow. Compos. Part A Appl. Sci. Manuf. 2007, 38, 1439–1443. [Google Scholar] [CrossRef]
- Ameri, E.; Lebrun, G.; Laperrière, L. In-plane permeability characterization of a unidirectional flax/paper reinforcement for liquid composite molding processes. Compos. Part A Appl. Sci. Manuf. 2016, 85, 52–64. [Google Scholar] [CrossRef]

© 2016 by the authors; licensee MDPI, Basel, Switzerland. This article is an open access article distributed under the terms and conditions of the Creative Commons Attribution (CC-BY) license (http://creativecommons.org/licenses/by/4.0/).